A 40-Year Analysis of the Hydrological Drought Index for the Tigris Basin, Turkey


1
Department of Civil Engineering, Ankara Yildirim Beyazit University, 06010 Ankara, Turkey
2
Water Resources Planning Division, SU-YAPI Engineering and Consulting Inc. 06530 Ankara, Turkey
*
Author to whom correspondence should be addressed.
Water 2019, 11(4), 657; https://doi.org/10.3390/w11040657
Submission received: 7 February 2019
/
Revised: 22 March 2019
/
Accepted: 24 March 2019
/
Published: 29 March 2019
(This article belongs to the Section Hydrology)
Abstract
:Drought is a natural disaster that occurs globally when water availability is significantly below normal levels. Drought assessment is important for water resource planning, and therefore indexes can be used to characterize drought magnitudes. Using the monthly streamflow data at 47 stations from 1972 to 2011, the streamflow drought index (SDI) series with 3- (SDI-3), 6- (SDI-6), and 12-month (SDI-12) time scales were calculated, and the hydrological drought of the upper Tigris Basin in Turkey has been assessed. The results showed that almost all stations experienced at least one severe drought during the study period. The results revealed that since the early 1990s the study area has become drier. Using the data for a 12-month period and the area of the sub-basins for each flow monitoring station, area-weighted SDI-12 (WSDI) values were constructed. According to the WSDI results, the intensity and number of drought conditions increased during every 10-year period. This outcome has been verified using the maps of averaged SDI-12 values over the Tigris Basin. We noticed from observations of the maps that the time domain zones in lower latitudes experienced drought earlier as compared with zones in higher latitudes.
1. Introduction
Given the impact of climate change, hydrological extremes are occurring more frequently. The low streamflow that is associated with droughts is one of the extreme hydrological phenomena that is mainly caused by meteorological abnormalities and human activities in the catchments [1]. Hydrological drought has had negative impacts on humankind’s water supply, ecological stability, and agricultural systems [2]. The basis for drought cannot be defined by the initial point in the global hydrological cycle [3]. Although there is no general agreement about the definition of drought, it is usually defined as below-normal water availability [4,5,6].
In terms of the four basic approaches to measuring drought, Wilhite and Glantz [7] categorized the definitions as meteorological, hydrological, agricultural, and socioeconomic drought. Among these, the first three definitions involve methods of measuring drought as a physical phenomenon, whereas the last definition involves tracking water scarcity and the effects on supplies through socioeconomic systems. Foremost among these definitions, hydrological drought is significant due to its high interdependence on processes such as the effects of urban water supply and hydropower generation on surface water resources [8]. To monitor drought, various drought indices that provide a quantitative method for determining drought events have been developed using hydrological variables. These indexes are the simplest method to monitor drought conditions because the index value indicates the level of drought severity [9]. Similar to drought definitions, the drought indicators are based on the physical datasets used, such as rainfall, streamflow, reservoir storage, soil moisture, and groundwater, and are classified as meteorological, agricultural, and hydrological drought indicators [10].
On the basis of a runoff drought index, the streamflow drought index (SDI), has been developed by Shukla and Wood [11] using hydrological models and real-time applications. However, this index required model simulation accompanied with significant data density. Another index, the standardized streamflow index (SSI), has been created by Vicente-Serrano et al. [12] and involved the intensive procedure of determining different types of probability distribution functions (PDFs) for each time scale in order to contrast hydrological regimes and flow characteristics. Unlike the computationally intensive procedures, Nalbantis and Tsakiris [13] developed the streamflow drought index (SDI) to predict drought onset and duration using cumulative streamflow volumes. Hydrological drought analysis based on SDI has been conducted in several areas such as the Northern Peloponnese in the Achaia and Korinthia Prefectures in Greece [14], the northwest of Iran [9], the junction of the upper Yangtze River and the middle Yangtze River in China [15], the Diyala River Basin shared between Iraq and Iran [16], the Neman River Basin in Europe [17], the Sefid-Rud Basin in the Iran plateau [18], and the Kucuk Menderes Basin in Turkey [19]. In some research areas, such as the Cetina River catchment area in Croatia [20], Vistula River in Poland [21,22], the Great Plains states of the United States [23], and 121 near-natural catchments in the United Kingdom [24], droughts were monitored simultaneously using hydrological and meteorological drought indexes. The main outcome of these studies was that meteorological and hydrological parameters were mainly affected by natural and anthropogenic factors. For example, the strongest natural climate fluctuation that were measured in the tropical Pacific, the El Niño Southern Oscillation, impacted meteorological indexes, such as sea level pressure and temperature, surface wind, and the cloudiness of the sky [25]. In addition to the natural factors, external forces such as solar variability have affected drought characteristics [26]. Reddy et al. [27] demonstrated the significant temporal connection between the Indian monsoon rainfall and the sunspot activity. Wood and Lovett [28] suggested that the solar cycle strongly influenced rainfall variations and also the timing of droughts.
In the assessment of drought indices, it is strongly recommended that a high-quality dataset over at least a 30-year period should be used in the calculations due to sampling uncertainties in frequency-analysis-based hydrological research [29,30]. Studies on hydrological droughts have mostly been conducted using datasets under natural conditions. However, constructing structures such as dams, weirs, and levee banks on a river; changing drainage patterns in the basin; and extracting water from water sources, alter the natural flow regimes in the spatiotemporal domain. Such modifications in the basin can also alter hydrological drought characteristics [15].
The aims of this paper were to analyze the hydrological drought index based on the SDI method for overlapping periods using 3-(SDI-3), 6-(SDI-6), and 12-month (SDI-12) time scales within each hydrological year, and to construct maps that indicated the averaged SDI-12 values over the basin for every 10-year period interval (1972–1981, 1982–1991, 1992–2001, and 2002–2011). For this purpose, monthly streamflow data at 47 stations from 1972 to 2011 were used. Since this basin had a major role in water and energy management aspects, several human-made structures and irrigation projects existed within the basin. Therefore, the datasets were first investigated regarding their flow regime conditions, and then the SDI method was applied.
2. Study Area and Data
2.1. Study Area
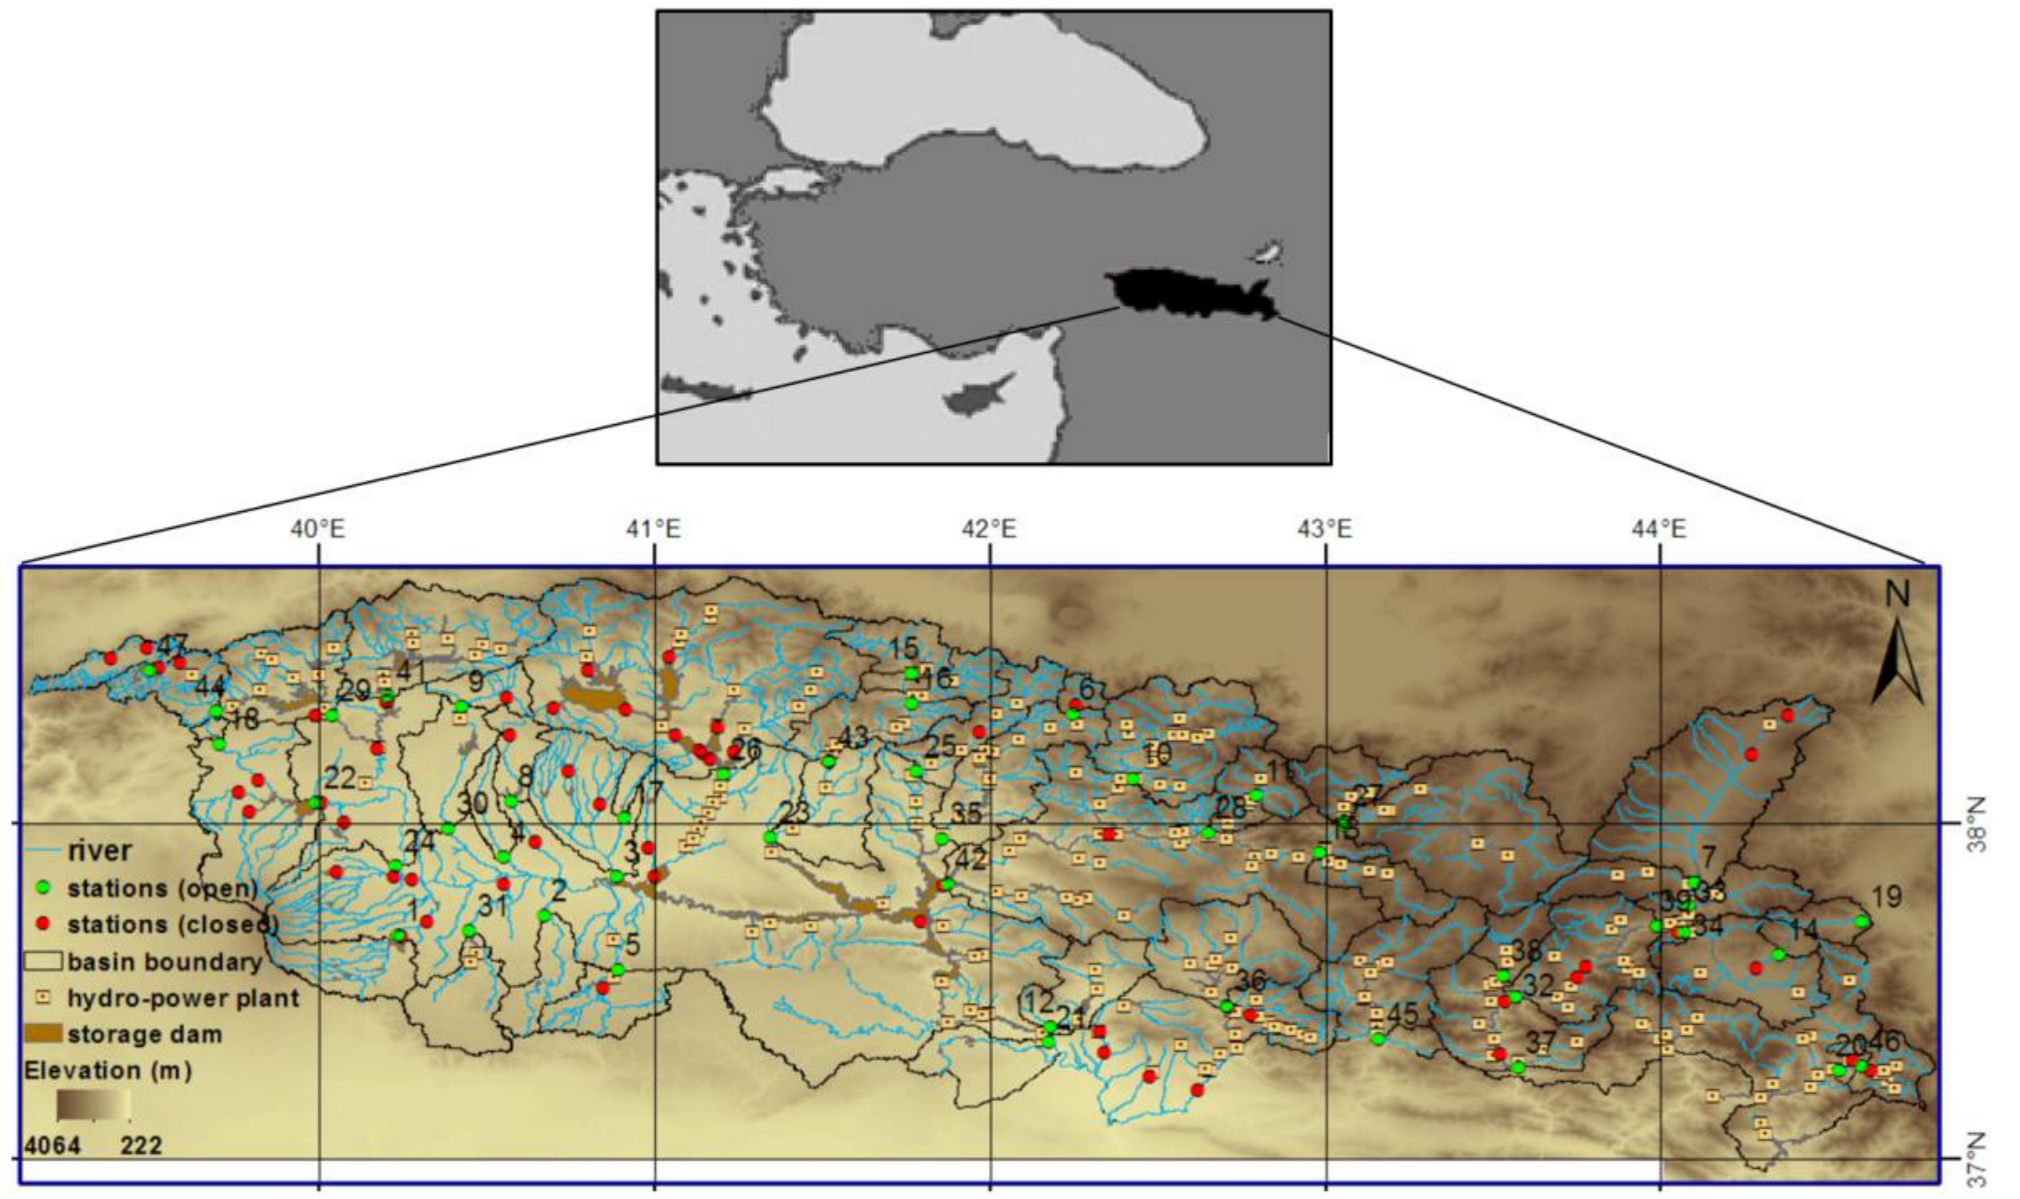
The Tigris River and its drainage network have served as the home of many developed urban civilizations in Mesopotamia. Given its existing uses for agricultural and hydropower purposes, the Tigris River is one of the most important rivers in Turkey, Syria, and Iraq. The Upper Tigris Basin is located at 36°57′–38°45′ latitude and 39°06′–44°50′ longitude, and the basin covers approximately 54,700 km2 in Turkey (Figure 1). The Tigris River is one of Turkey’s major transboundary rivers and originates from a small mountain lake south of the city of Elazig, and then flows through Iraqi territory via many tributaries. It forms the border between Turkey and Syria over a short distance, and crosses into Iraq. In Iraq, the Tigris River joins the Euphrates River and then flows into the Persian Gulf as the Shatt al-Arab River. The total length of the Tigris River is 1990 km, and as the focus of our current study, the river flows for 512 km through Turkish territory.
The Tigris Basin is located in Eastern and Southeastern Anatolia. In both regions, continental climate characteristics dominate. The precipitation and temperature averages change from south to north, and east to west in the basin. Whereas the precipitation amounts in the mountainous regions are high, the precipitation amounts in the lowlands drop to a yearly average value of 400 mm. In the elevated parts of the Tigris Basin, snowfall is high, and river flows are formed from snow melting, reaching a maximum between March and May. During this time, half of the total water volume passes through the river. Towards the end of summer, the flow in the river reduces. The basin experiences a subtropical Mediterranean climate with wet winters and dry summers [31]. The characteristic vegetation of the basin is a maquis shrubland.
2.2. Data
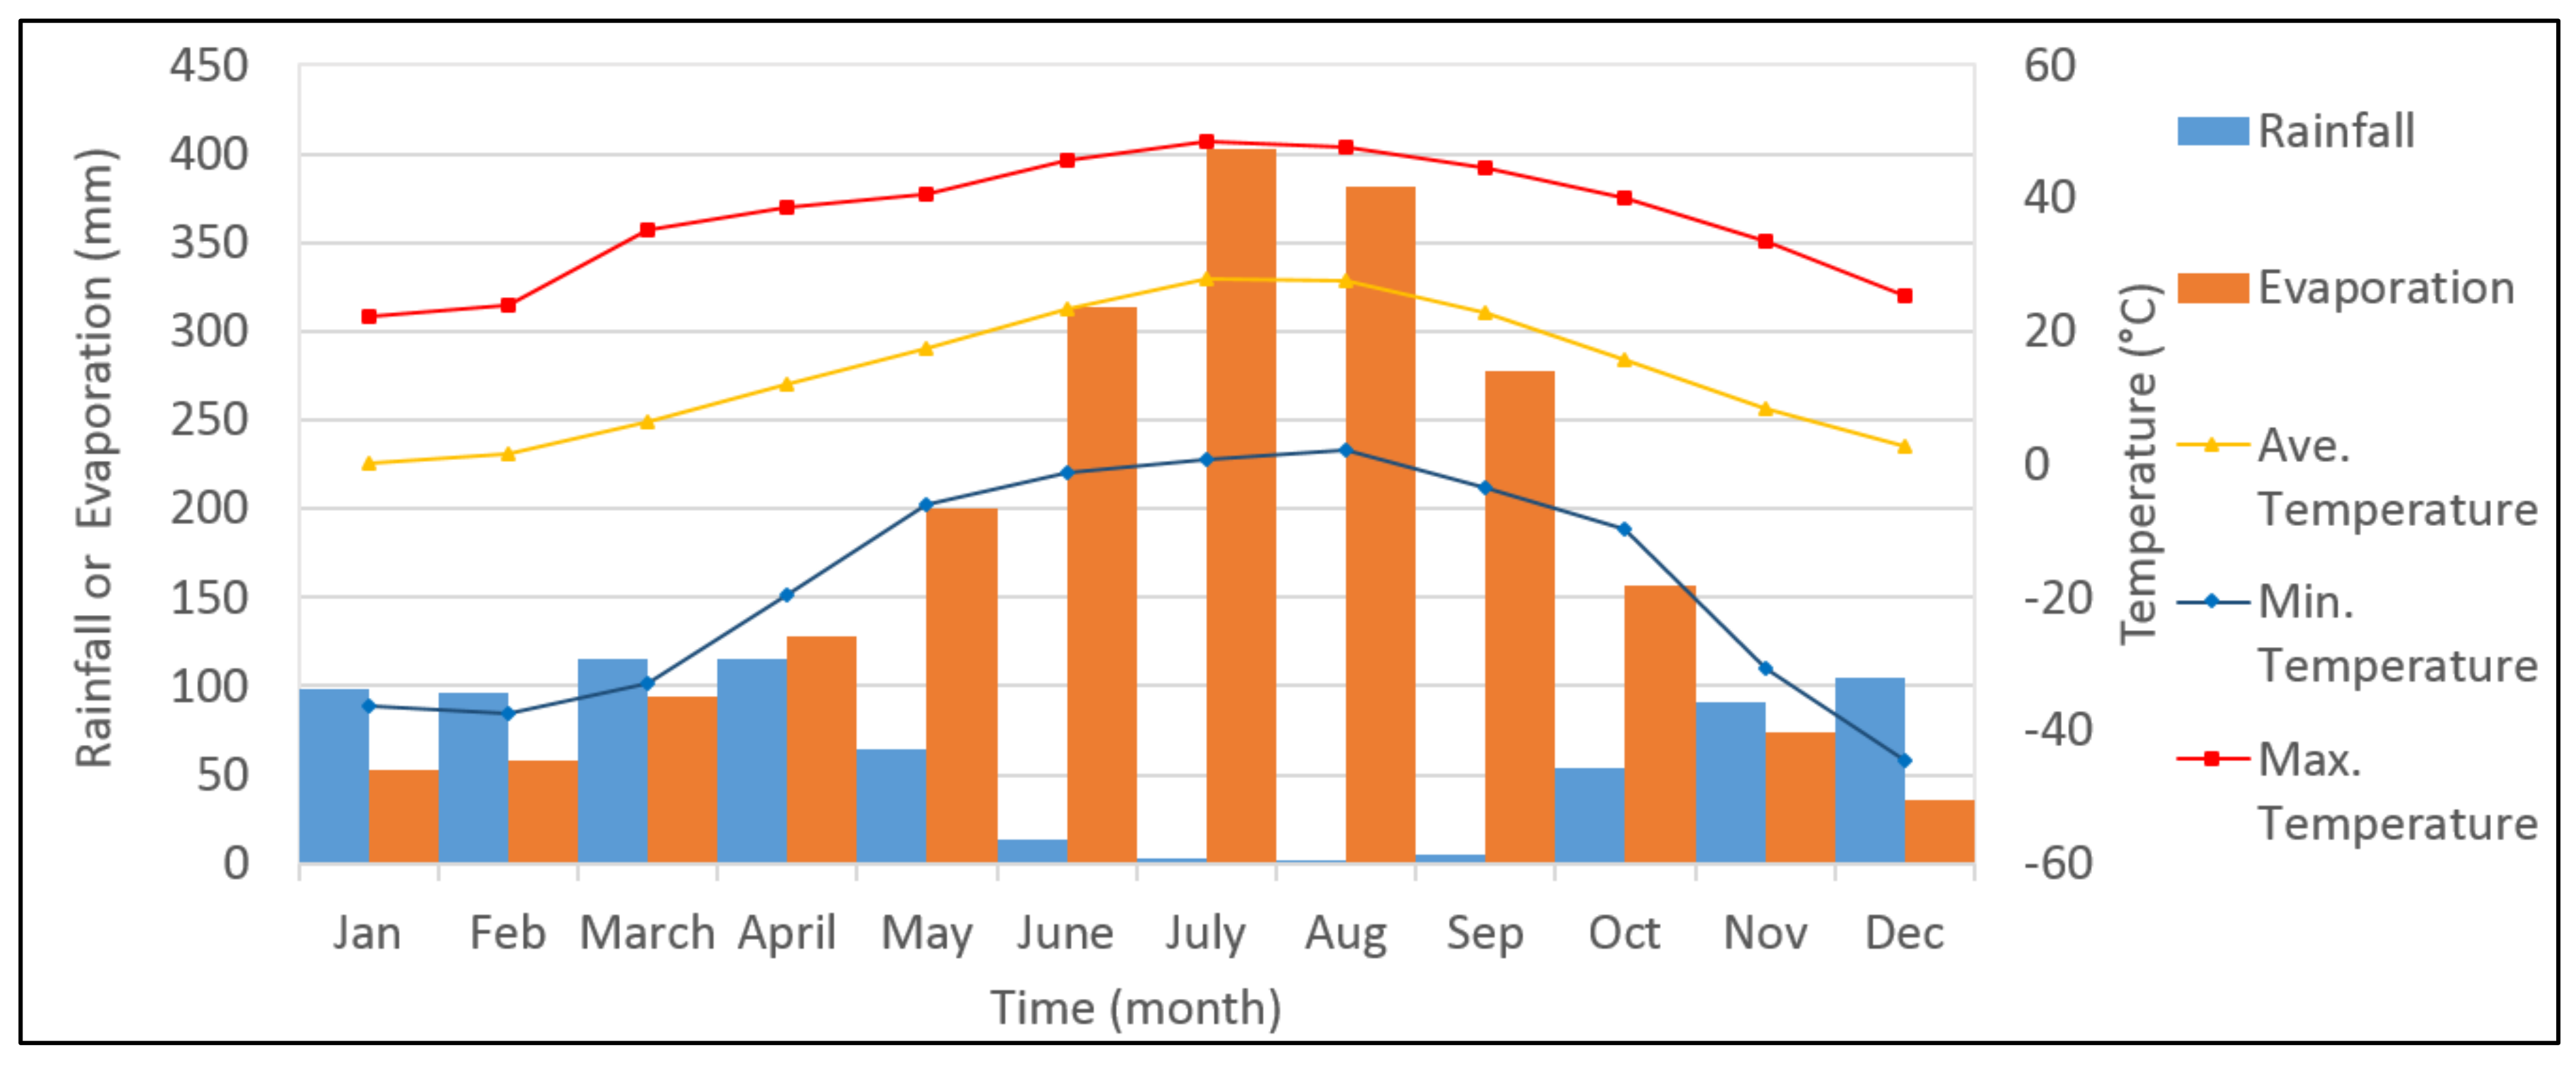
Since the Tigris Basin is large, several meteorological stations in the basin are operated by the State Hydraulic Works (DSI) and Meteorological Service (MGI). Using the stations that have a data period greater than any 10-year period between 1972 and 2011 (Figure 2), the average monthly precipitation, evaporation, minimum temperature, maximum temperature, and average temperature amounts were calculated. Since the records of meteorological and hydrological datasets did not overlap, various kinds of drought could be traced. Instead, only the rainfall map was depicted to interpret the spatial variability in rainfall over the basin. To accurately represent rainfall distribution, the homogeneity of the network with a continuous record length was required. Heterogeneity in the network distribution caused difficulties in interpolating measurements into a uniform grid [32]. Given physiological network weaknesses, the ordinary Kriging method was used to procure climatological information.
For the purpose of interpreting the rainfall variability over the basin, the ordinary Kriging method has been used to generate averaged yearly rainfall amounts. For the whole basin, average rainfall amounts were determined each month. As seen in Figure 3, the percentages of the rainfall amount in winter, spring, autumn, and summer were 40%, 39%, 19%, and 2%, respectively. When the rainfall distribution was examined in the spatial domain, we observed that rainfall occurred mostly to the north and southeast of the basin (Figure 2). The average annual rainfall amount in the Tigris Basin was 772.7 mm, which was greater than the country’s average rainfall amount of 574 mm.
Stations shown with a red circle in Figure 2 measured the air temperature. The measurements indicated that the average annual temperature in the basin was 13.8 °C. The highest and lowest temperature values were measured in July and December, respectively. Using the arithmetic mean method the basin’s average evaporation value was calculated using stations that had class A pan evaporation data and a working period greater than 15 years. As seen in Figure 3, the average annual evaporation was calculated as 2003.3 mm.
To analyze the hydrological drought index, the monthly observed streamflow data were collected. Figure 1 represents the 104 hydrometric stations in the Tigris Basin, shown with red and green circles. However, data length limited the number of stations to 47, shown with green circles in Figure 1. Their geographical coordinates and elevations are presented in Table 1. The data covered the period from 1972 to 2011. The elevations of the stations ranged between 370 and 1928 m. The region had several storage dams and hydropower plants (Figure 1). Therefore, streamflow naturalization, which implies removing quantifiable human influences, was performed.
3. Methods
3.1. Streamflow Naturalization
For SDI computations, naturalized flow data were used. The data were gathered from the Upper Tigris Basin master plan final report. According to this report, naturalization studies were conducted considering the water consumption amounts in upstream facilities, which were generally irrigation facilities. Flow data were naturalized using the Equation:
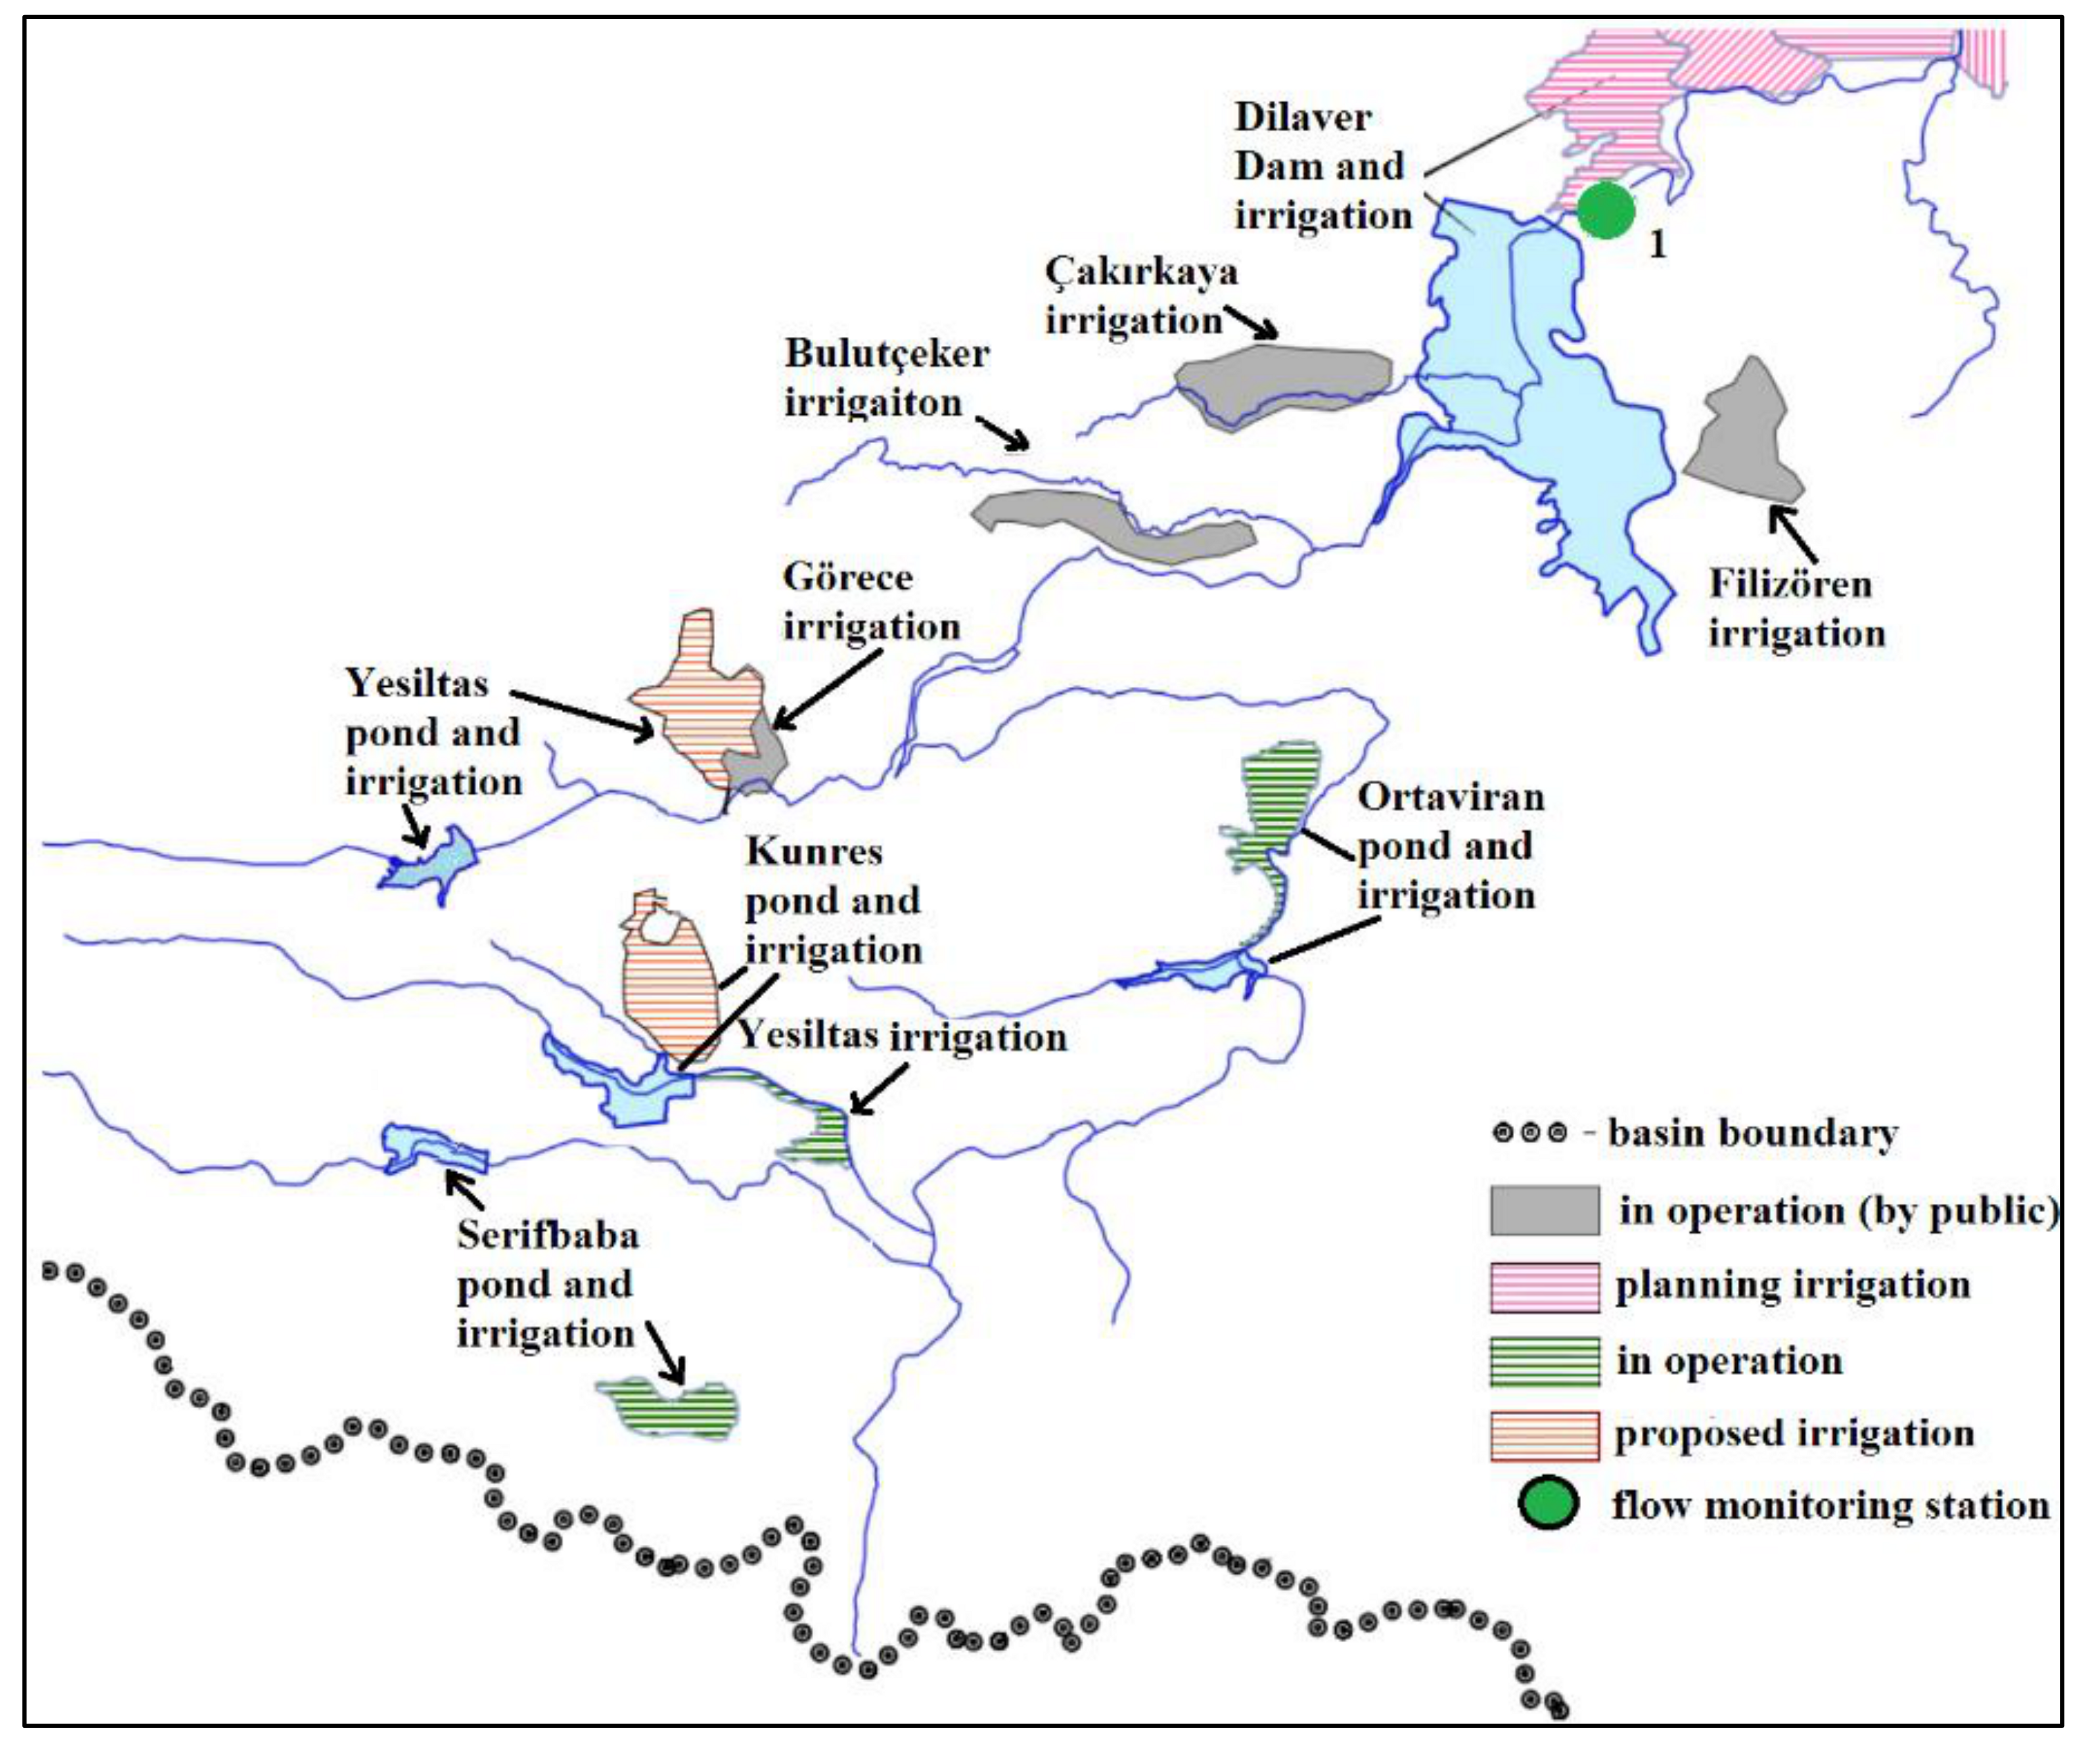
where and are the normalized flow and measured flow amounts, respectively; and is the upstream water consumption amount or water volume differences in the storage facilities. Figure 4 shows the storage facilities and irrigation areas (planning, proposed, and operational) located in the upstream part of the flow monitoring station 1. As seen in Figure 4, is the observed flow amount at station 1, and was the water volume amount that was stored in dams and ponds or used for irrigation purposes. In some of the irrigated areas, which are mainly operated by the public, the required water was directly supplied from the stream. For the report, using the records from the water storage facilities and water consumption data from the field, monthly net water consumption values, , were calculated. Estimation of the naturalized time series along the river was the hardest part of the master final report. Because a monthly time scale was used throughout the report, consistent estimations were obtained.
During the studies, it was assumed that the ratio of irrigation return flow was 0.15. For the calculations, the launch date of the structures and the water requirements with current plant patterns were considered. It should also be noted that the hydropower plants in the basin did not cause any change in the amount of flow.
3.2. Normality Tests of Data Series
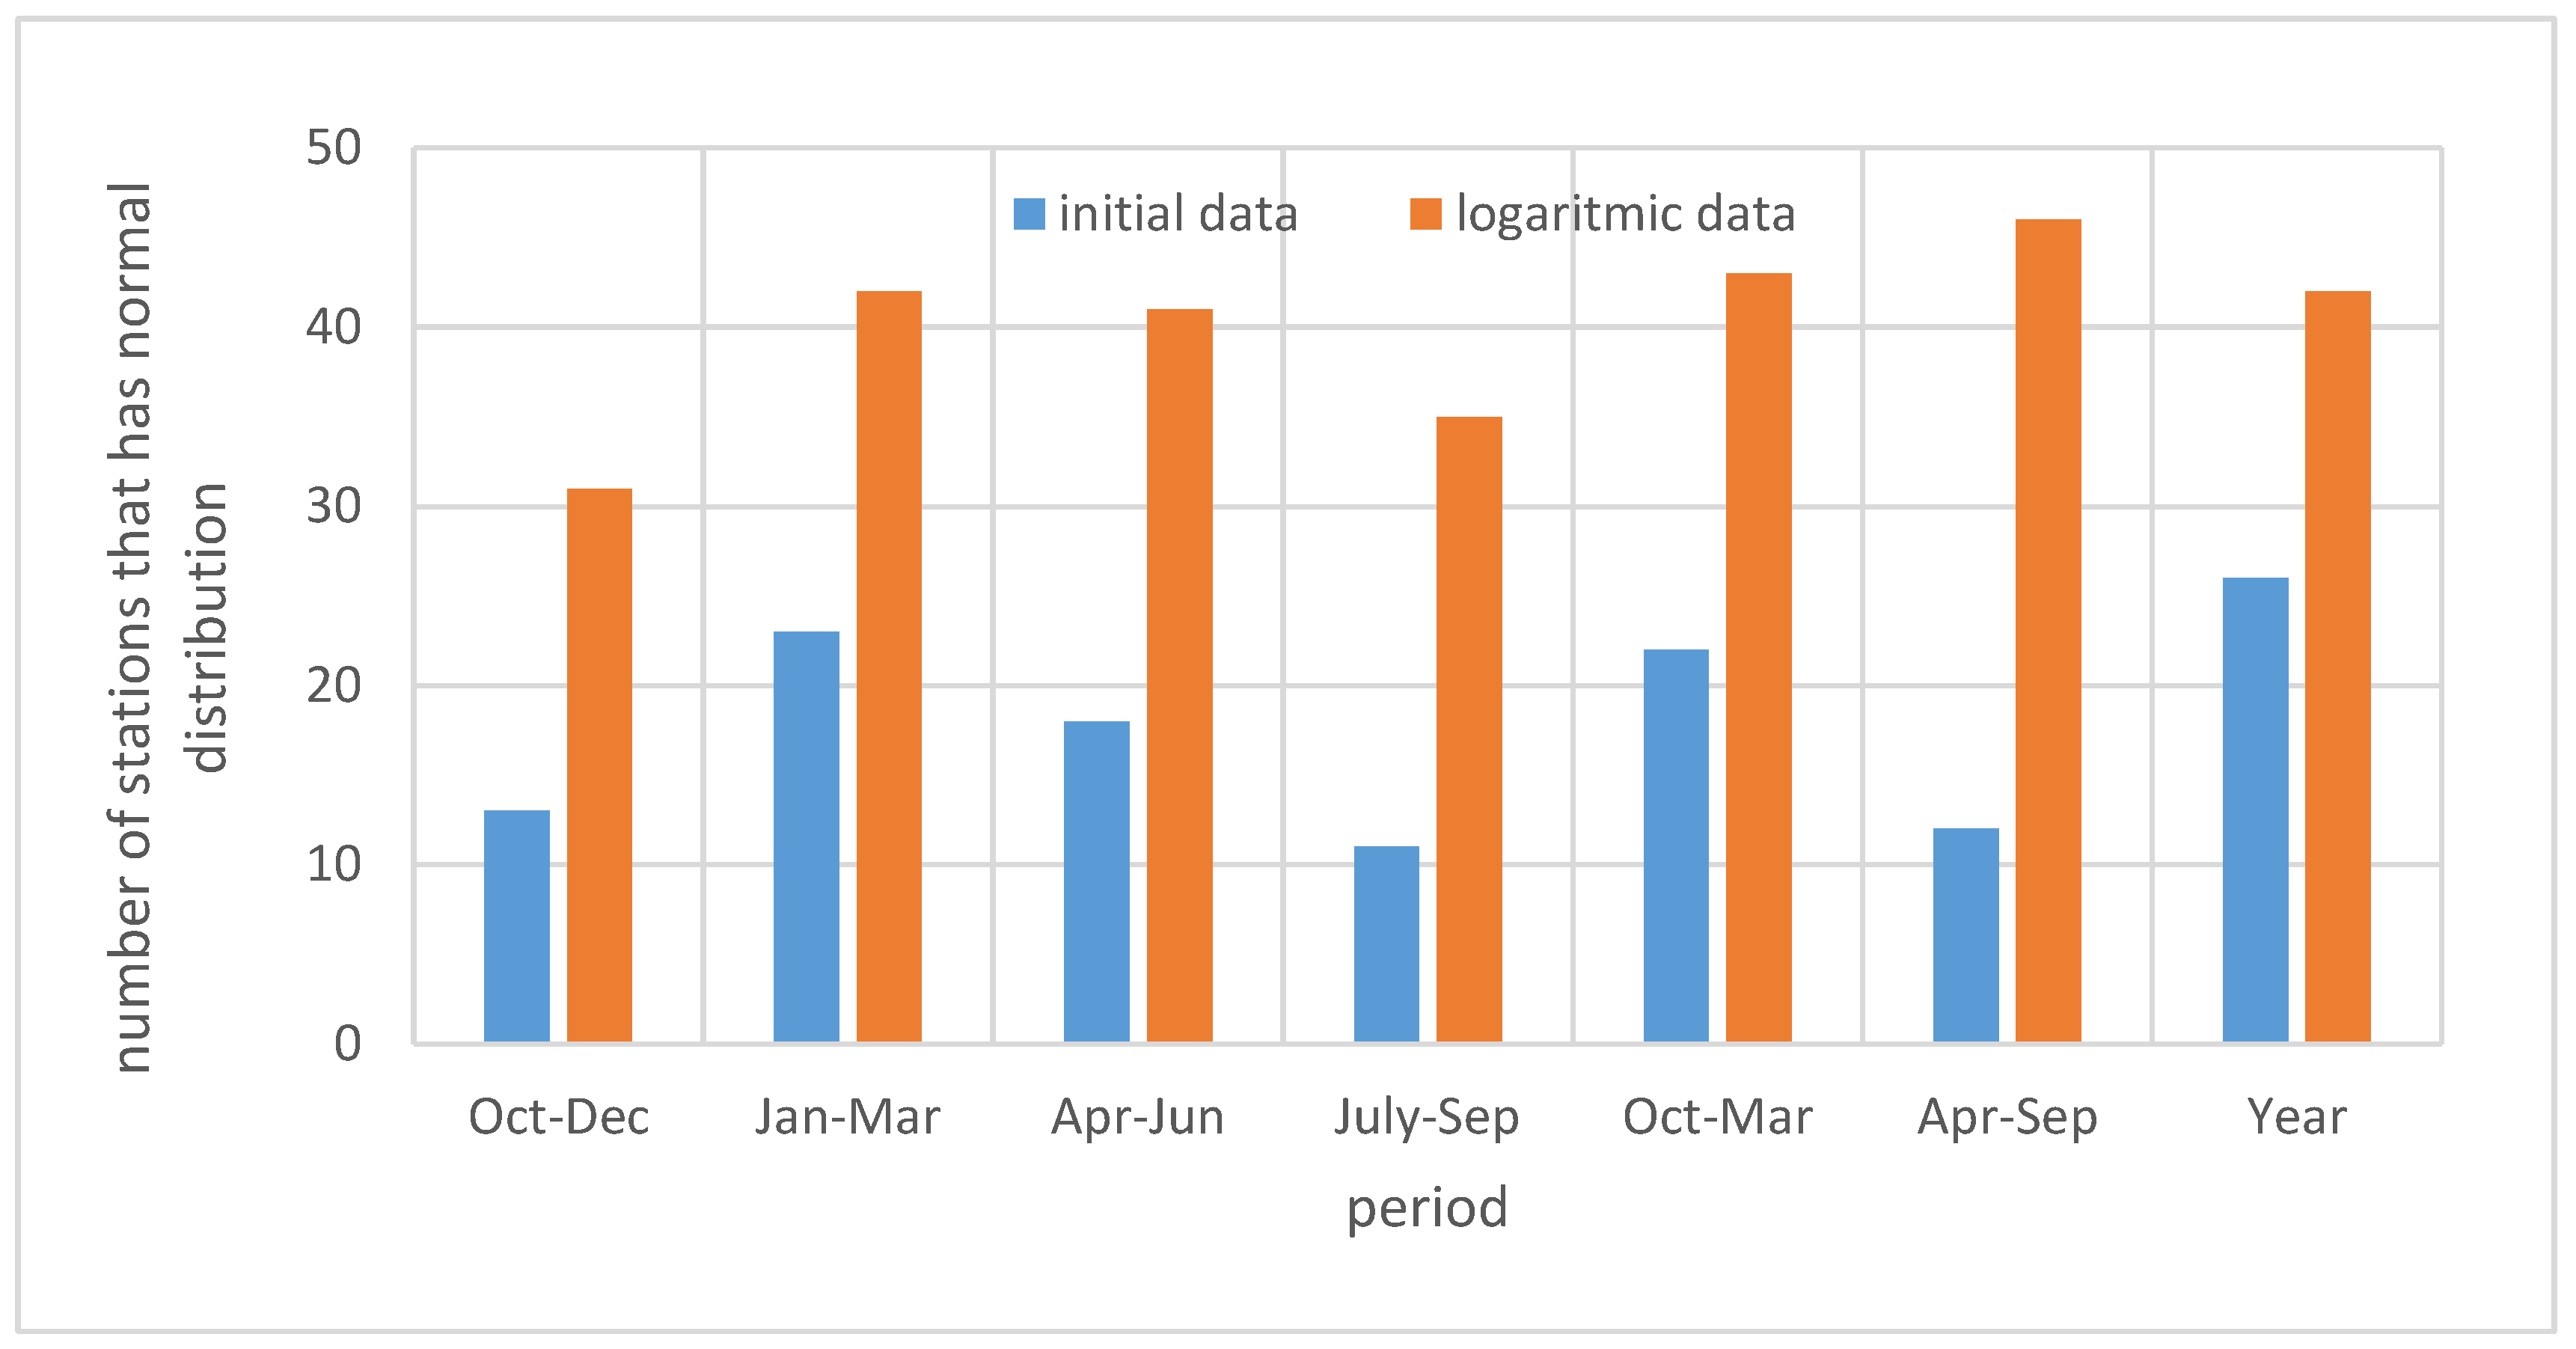
The Kolmogorov–Smirnov (K–S) test was used to check the goodness of fit of the streamflow data at the 0.05 significance level. To decrease the skewness of the streamflow series for all the reference periods, log-distributions were used. Figure 5 shows the results of the number of streamflow series in the K–S test for initial and logarithmic distributions. The log-normal distribution appeared to be the better choice. After the dataset was transformed to the logarithmic form, the SDI values for each station were computed. For the computations, the cumulative streamflow, and the mean and standard deviation of the cumulative streamflow volumes for the reference period has been calculated using the transformed data.
3.3. Streamflow Drought Index (SDI)
To characterize hydrological drought, the SDI has been developed by Nalbantis and Tsakiris [13]. For SDI calculations, the hydrological year started in October and ended in September. Using monthly streamflow volumes, , in which i denotes the hydrological year and j denotes the month within that hydrological year, the cumulative streamflow volume, , was calculated based on the equations below:
Equations (2)–(4) calculated SDI values for 3-, 6-, and 12-month periods, respectively. The SDI is described with cumulative streamflow volumes for each reference period k of the ith hydrological year as follows:
where and are the mean and the standard deviation of cumulative streamflow volumes for reference period k, respectively.
According to the SDI criterion, wet conditions are defined with values greater than 0, whereas drought conditions are defined with values lower than 0. The descriptions of hydrological drought states are provided with the criteria in Table 2.
4. Results and Discussions
Since there were 47 stations over the study area, the SDI values of the stations that were located close to the outlet are depicted in the results. As seen in Figure 1, stations 21, 36, 45, 37, and 20 were the closest stations to the outlet on the country’s border. On the basis of the 40-year time series data, the SDI series for all the reference periods, SDI-3, SDI-6, and SDI-12, are shown in Figure 6, Figure 7, and Figure 8, respectively for stations 21, 36, 45, 37 and 20.
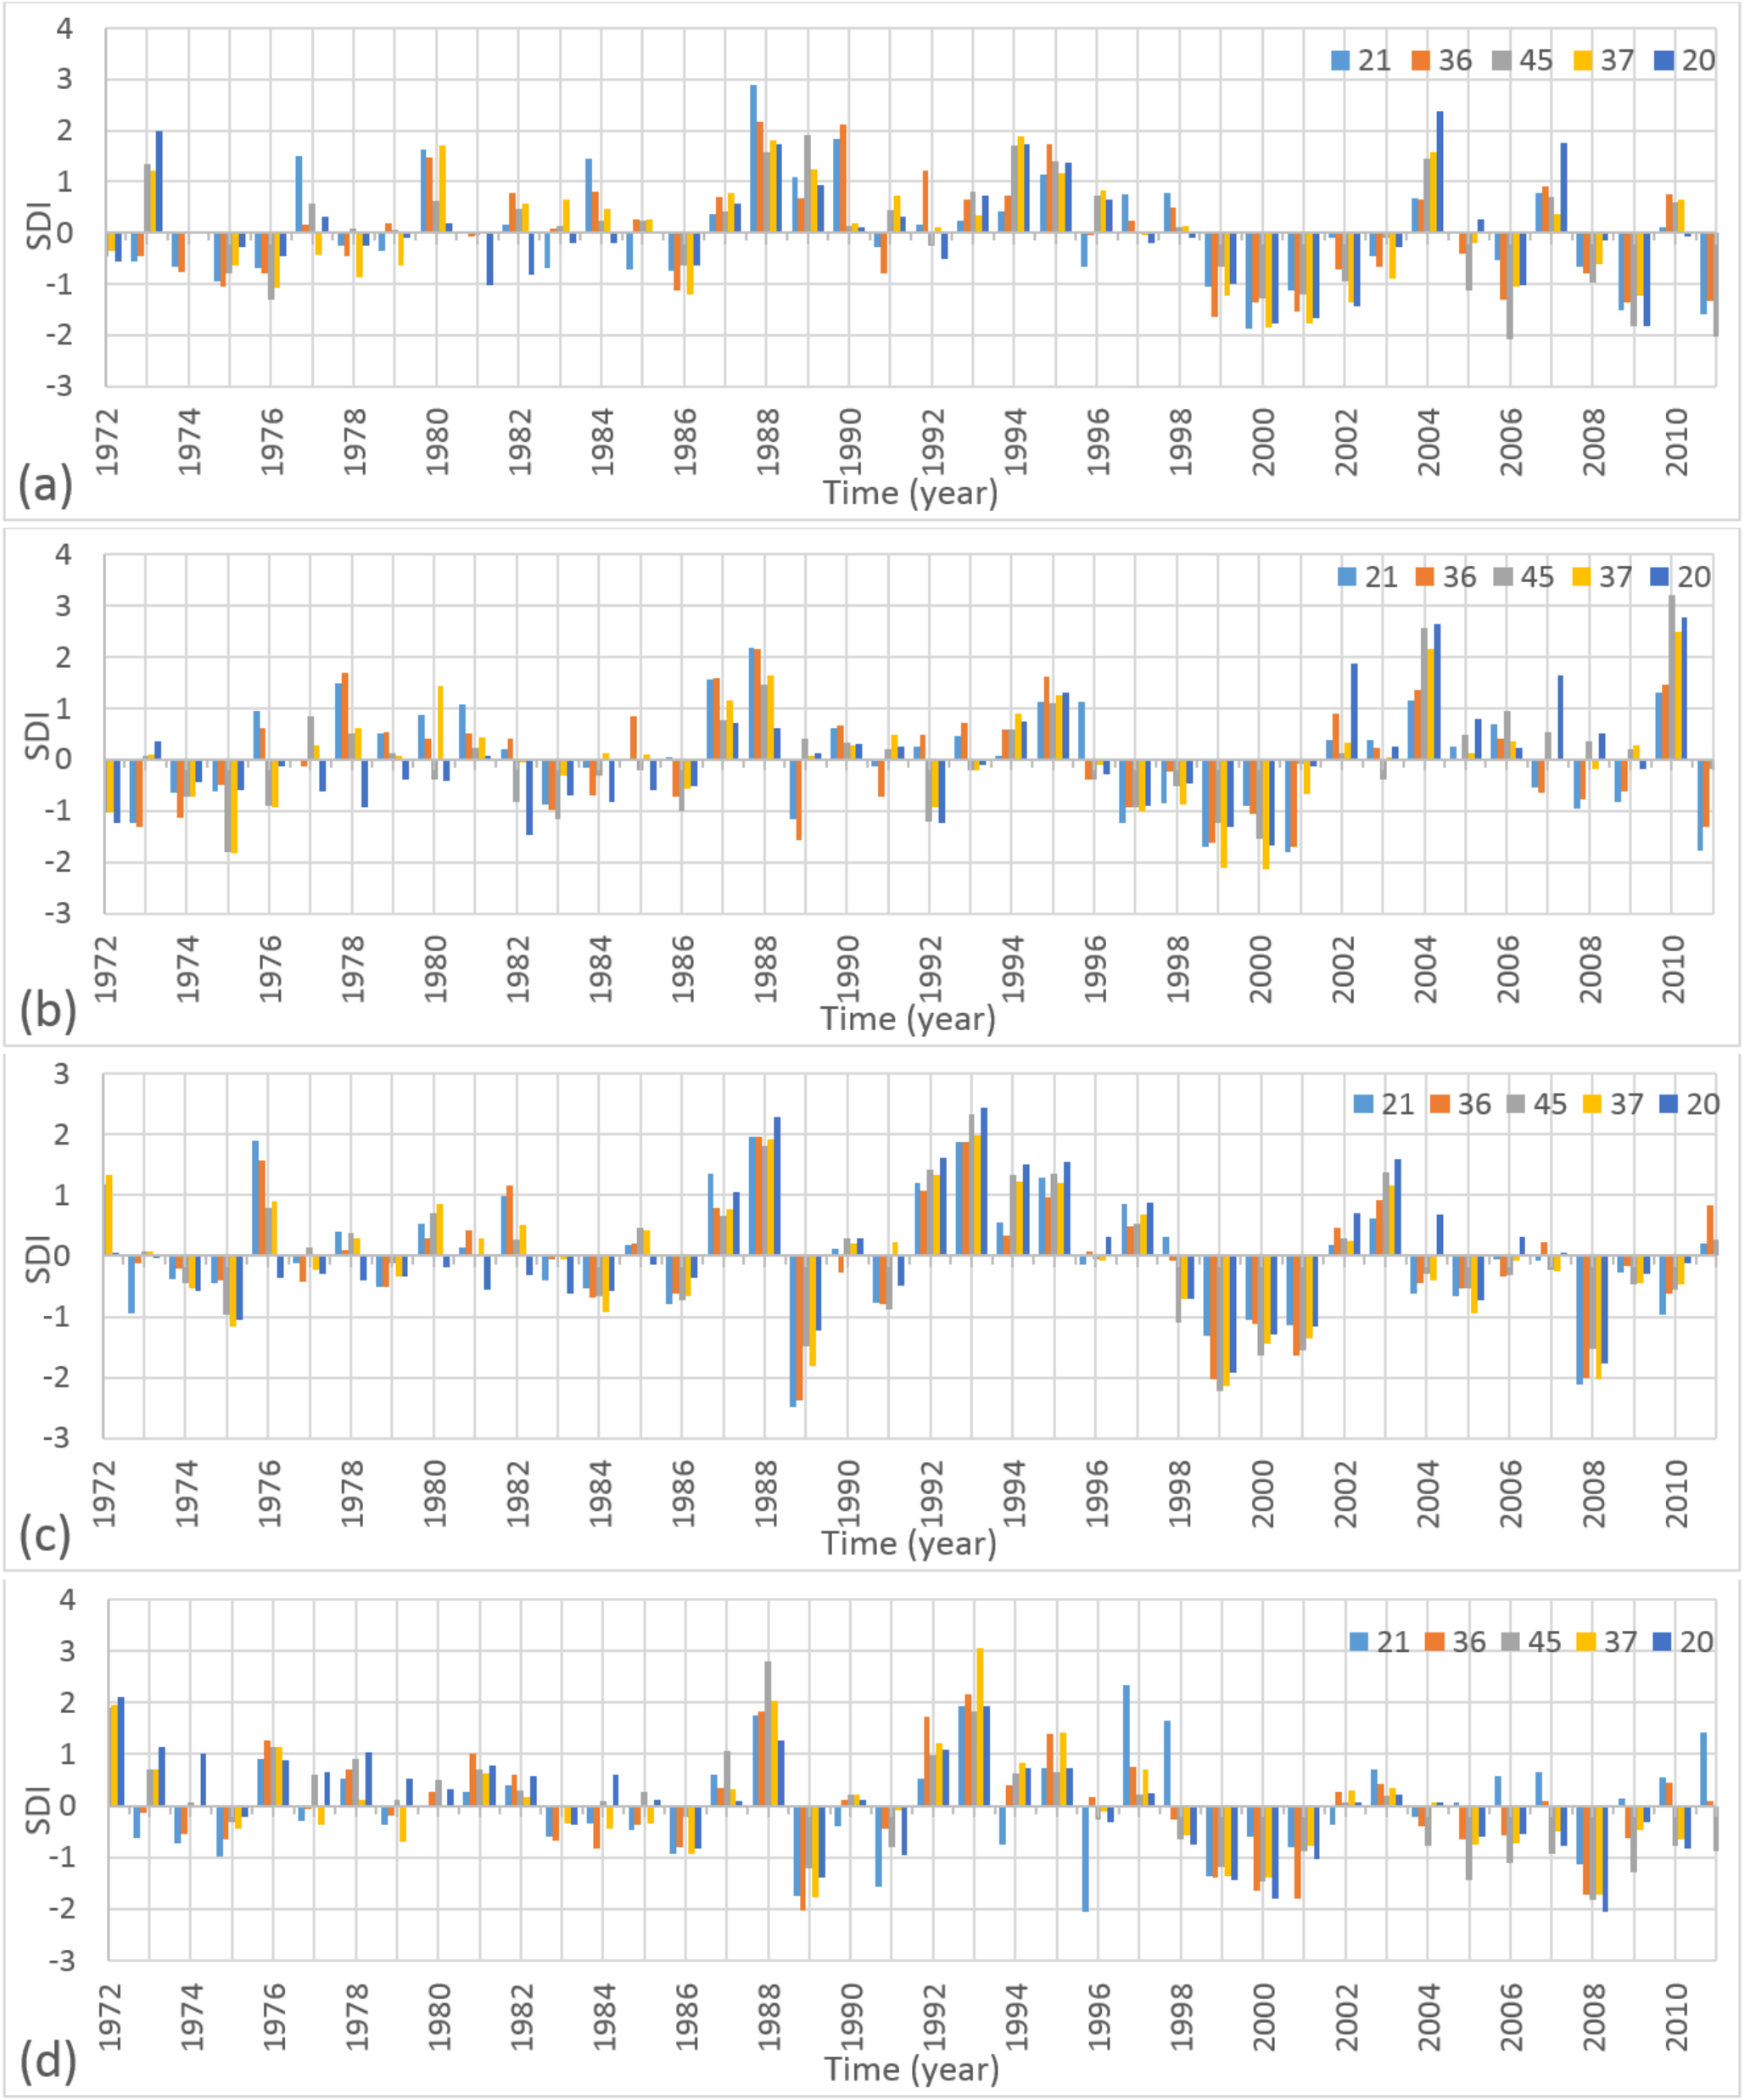
As shown in Figure 6a, the majority of the stations experienced droughts during the reference period October–December in the years between 1999 and 2011. Although, SDI-3 values in the years 2004, 2007, and 2010 were positive, the general trend in the last 13 years of the period shows that moderate drought occurred in the region. Station 45 experienced extreme droughts in the years 2006 and 2011. All of the stations experienced at least one severe drought for the reference period during October–December. Before the year 1999, none of the stations experienced severe or extreme drought.
The SDI-3 series for the period January–March are shown in Figure 6b. As seen in this figure, all stations had negative SDI-3 values for the years 1996–2001. The highest positive SDI-3 values were observed in the year 2010. However, such results were not recorded in the previous years.
For the period October–December, the majority of the stations experienced droughts in the period April–June in the years between 1998 and 2002, and between 2004 and 2010 (Figure 6c). The most severe drought was identified in 1989 at stations 21 and 36, with SDI-3 values of −2.49 and −2.38, respectively.
The SDI-3 series for the period July–September are shown in Figure 6d. In contrast to the other three-month periods, there was less deviation in the positive SDI-3 values after the year 1988. This period was the driest period in the region. Therefore, the general trend in the streamflow after 1988 has been defined as mild or moderate drought.
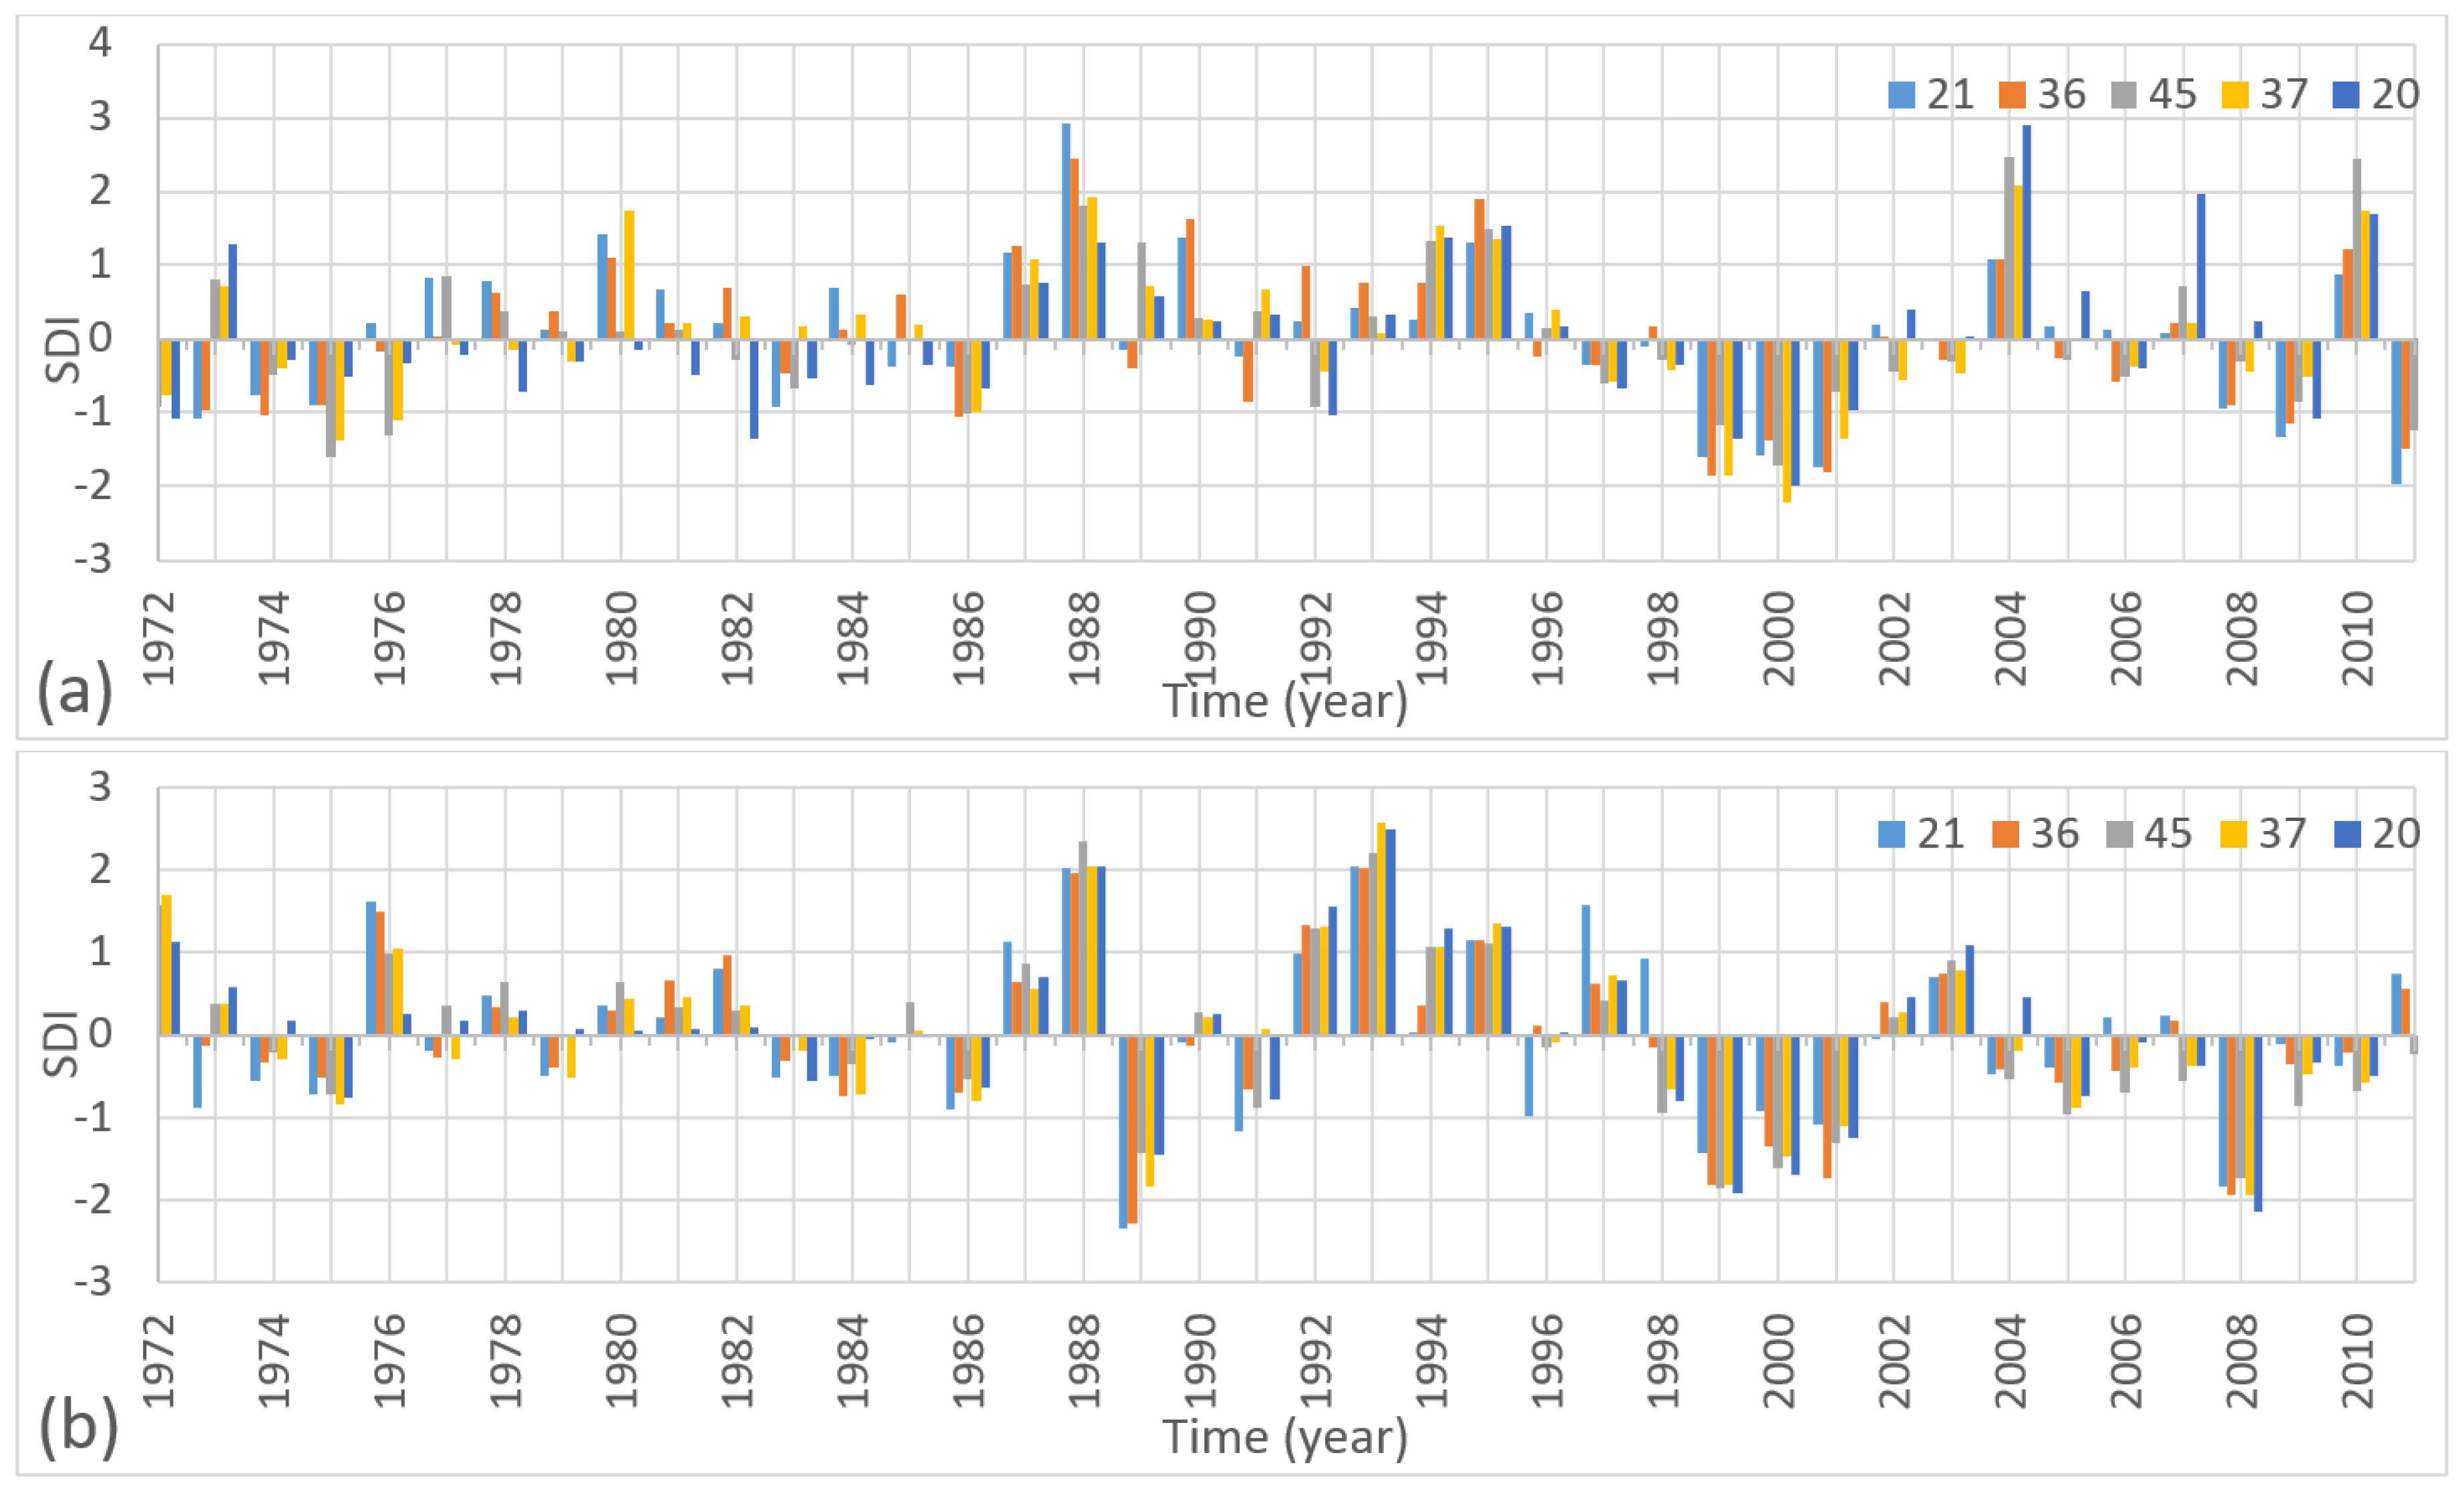
As seen in Figure 6 and Figure 7, the difference between the minimum and maximum SDI values in the three-month periods was similar to the six-month periods. For instance, the minimum and maximum SDI-3 values for the reference periods October–December and January–March were −2.07 (station 45 in 2006, October–December); 2.89 (station 21 in 1988, October–December); −2.15 (station 37 in 2000, January–March); and 3.21 (station 45 in 2010, January–March). The maximum absolute difference between these values was 5.36 for the January–March period. The minimum and maximum SDI-6 values for the October–March period were −2.22 (station 37 in 2000) and 2.91 (station 21 in1988), respectively. The absolute difference was 5.13. Similarly, for the reference periods April–June and July–September, the minimum and maximum SDI-3 values were −2.49 (station 21 in 1989, April–June); 2.44 (station 20 in 1993, April–June); −2.06 (station 21 in 1996, July–September); and 3.05 (station 37 in 1993, July–September), respectively. The maximum absolute difference between these values was 5.11 for the July–September period. The minimum and maximum SDI-6 values for the April–September period were −2.35 (21 in 1989) and 2.56 (station 37 in 1993), respectively. The absolute difference was 4.91. The minimum and maximum SDI values of the stations in the six-month periods coincide with one of the three-month periods. These differences in values show that increasing the time increments in the reference periods do not significantly affect the SDI values. In the reference period April–September, stations 37 and 21 had the lowest SDI-6 values with severe drought for the years 2000 and 1989, respectively. In the last 15 years of the study period, the decrease in the SDI-6 series was more remarkable in the April–September reference period as compared with the October–March period. In addition to this decrease, the excess evaporation in this period, shown in Figure 3, had a negative impact on irrigation, because the water requirement for crop irrigation is the highest between May and September in the Tigris Basin.
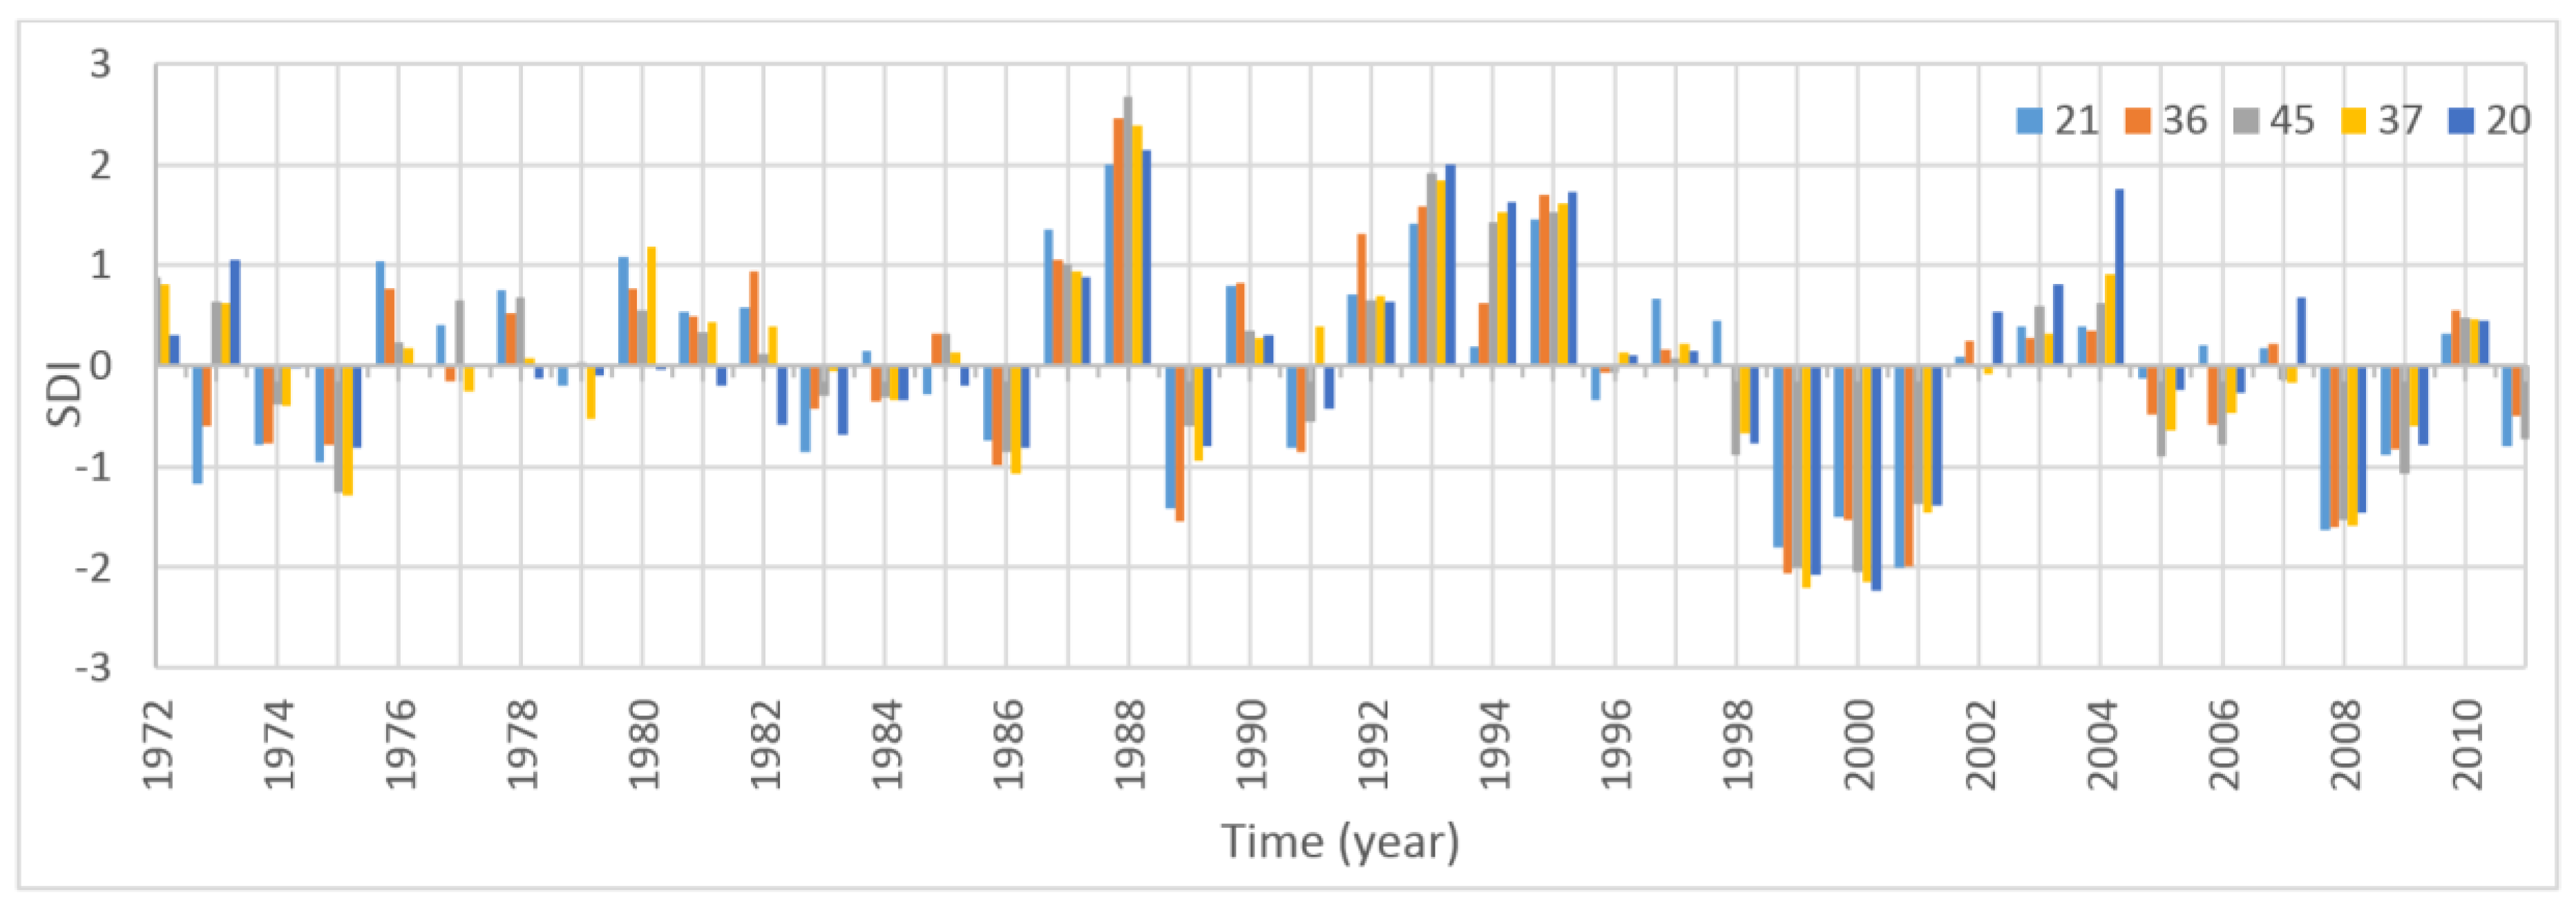
The SDI-12 series for the 12-month periods are depicted in Figure 8. All the stations experienced at least one extreme drought during the years 1999 and 2000. The most severe drought occurred at station 20, with an SDI-12 value equal to −2.23. All the moderate drought events occurred in the last 13 years of the study period. In general, the years 1999, 2000, 2001, and 2008 were the driest years.
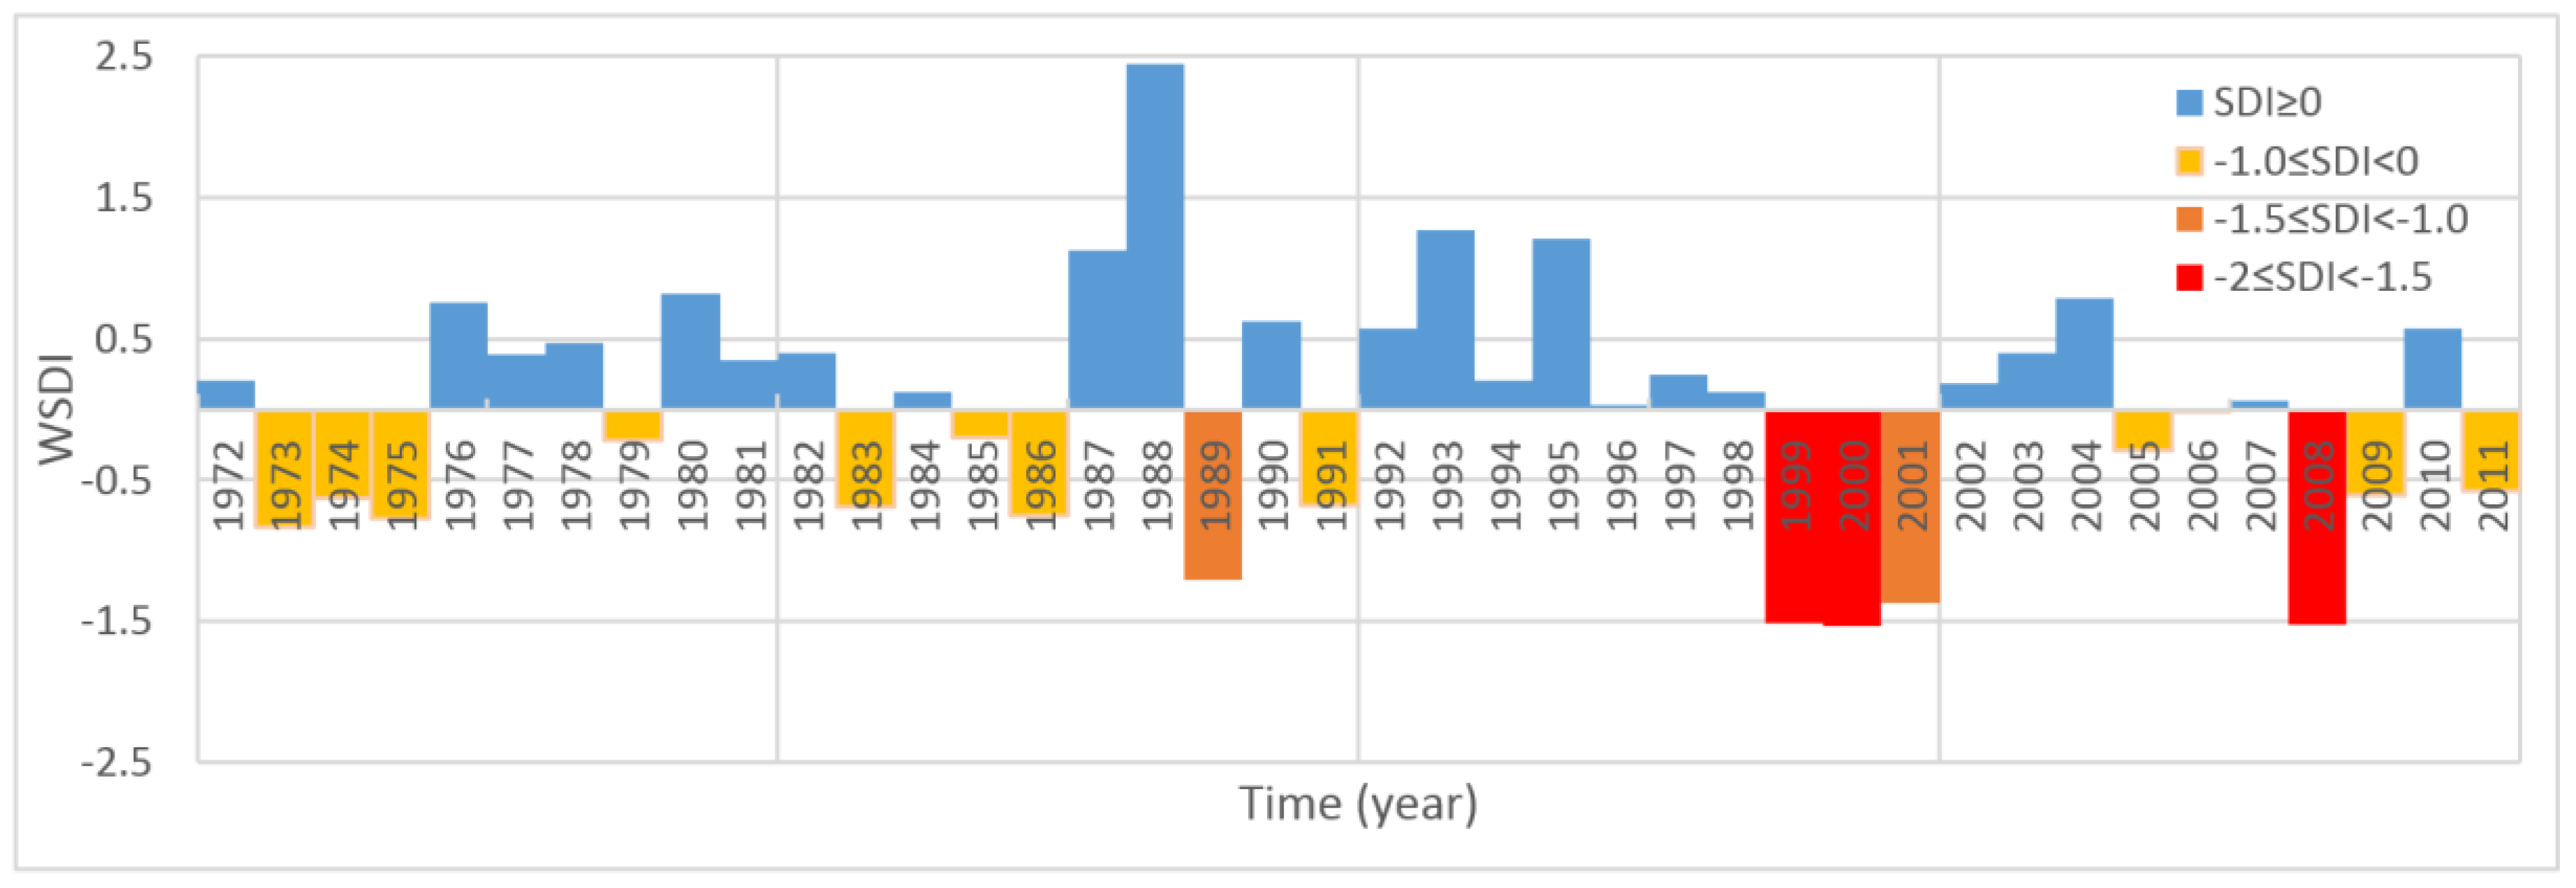
We noticed that the SDI distributions with time for the yearly reference periods are generally consistent with other periods. Therefore, using the yearly SDI-12 values of all the stations in the Tigris Basin, the area-weighted SDI (WSDI) values were computed for each year.
where is the hydrological year and is the intermediate basin area of the th station.
The drought conditions of the Tigris Basin for 40 hydrological years are shown in Figure 9. Each drought class is represented by a different color for a better visualization of drought intensity, e.g., the severe events are shown in red. As seen in Figure 8 and Figure 9, good similarities were obtained with the SDI-12 series for five stations and the WSDI series with all stations. Although some classification differences occurred in some of the years, such as 1973, 1984, 1985, and 2006, the differences in the index amounts were small. For example, in 1985 three of the five stations, stations 36, 45, and 37 showed non-drought conditions with SDI-12 values of 0.32, 0.32, and 0.14, respectively, and the other two stations, stations 20 and station 21, showed mild drought conditions with SDI-12 values of −0.19 and −0.28, respectively. However, the value of WSDI for the same year was −0.2. The averages of SDI-12 in the years 1999, 2000, and 2008 indicated that a severe drought occurred in the basin, and this description coincides with the WSDI values in Figure 9 for the same years.
The WSDI results in the study area indicate that severe and moderate drought events tend to follow each other with an average duration of more than one year. For example, severe drought was experienced in 1999 and 2000. In the following year, 2001, moderate drought conditions were observed. In the successive years, 2008 and 2009, severe and mild drought conditions were recorded. In five different periods wet conditions were observed unremittingly in the study area. The longest wet period occurred between 1992 and 1998. However, the wettest year, 1988 (SDI-12 = 2.44), was not part of the longest wet period.
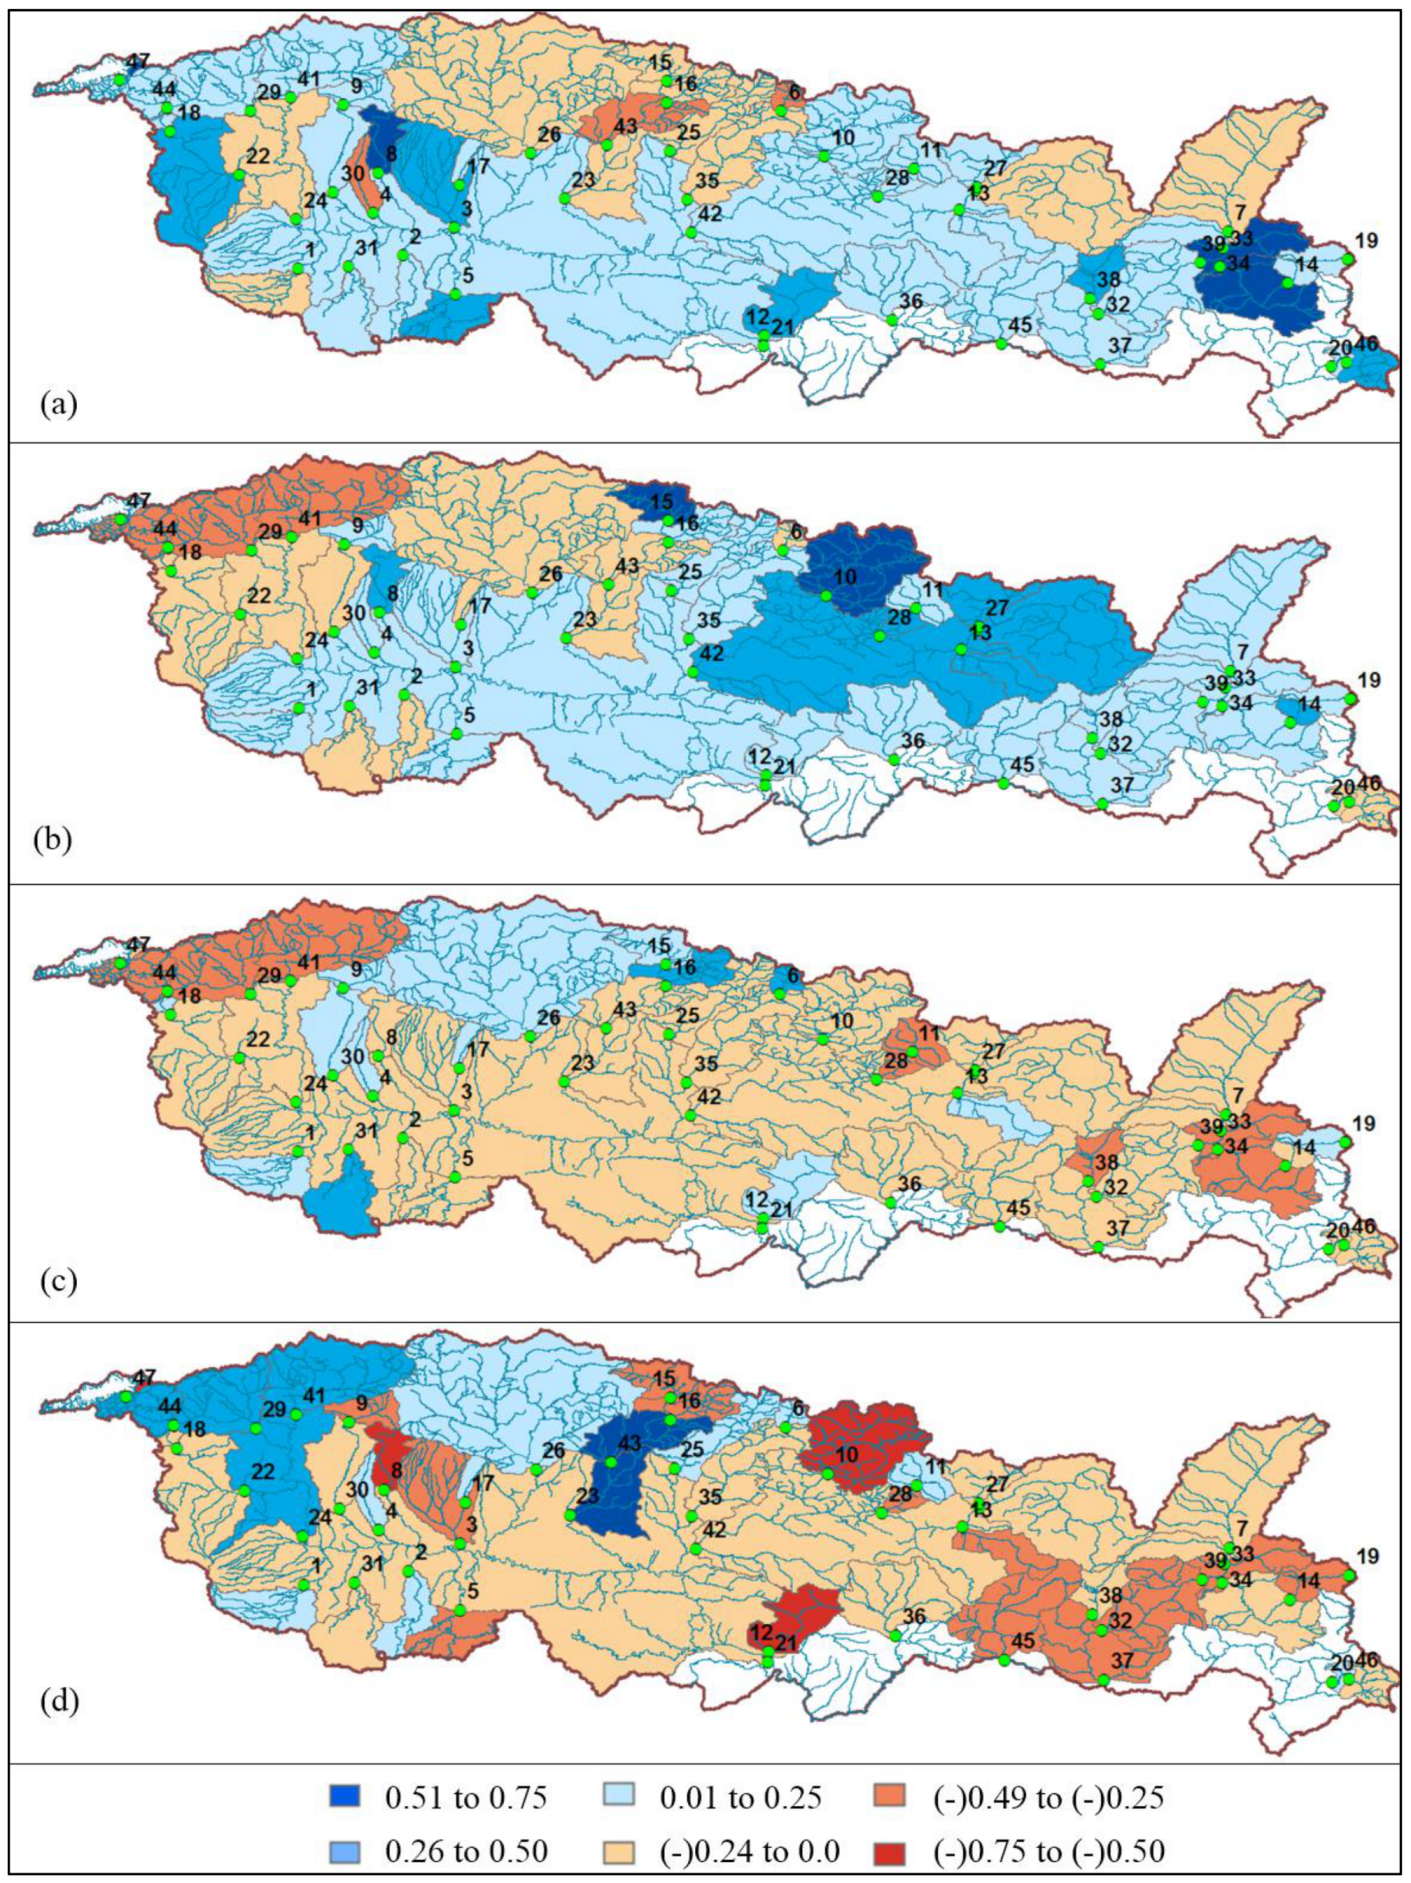
According to the results (Figure 9), the intensity and frequency of the drought conditions increased in every 10-year period. This increase is confirmed by the distribution of the average SDI-12 values for each sub-basin in every 10-year period, depicted in Figure 10. The red color in Figure 10 represents the average SDI-12 values lower than zero, indicating drought conditions. The blue color represents the average SDI-12 values equal to or greater than zero, indicating non-drought conditions. As seen in Figure 10, the areas that experienced drought increased over time. In general, drought conditions are dependent on mean latitude. Areas further south experienced drought earlier than areas further north. We observed that the intensity of drought increased with time. In the last 10-year period, two sub-basins had average drought values lower than −0.5 (Figure 10d). Before this 10-year period, average SDI-12 values this low were unprecedented.
In the Middle East, many regions have faced drought-related problems since the 1900s [33]. The results presented in this study are important for the future of water availability in the region, taken collectively with an increase in population, water stress is likely to noticeably decrease per capita renewable water resources. Our findings support the findings reported by other studies in this area. Chenoweth et al. suggested that the average annual Tigris-Euphrates river system discharge could decline 12% during the 2040–2069 period [34]. Another study, related to snow-water availability in the Euphrates-Tigris Basin, using climate model outputs and outputs provided by the variable infiltration capacity (VIC) model, suggested that snow accumulation in the lower zones of the basin will decrease more rapidly, and this will likely depress overall production volumes and the timing of peak river flow [35]. Another study, conducted by Bozkurt et al., used hydrological discharge models and a variety of model datasets to investigate the future of discharge in the Euphrates-Tigris Basin [36]. In their study, different scenario simulations revealed that a significant decrease in the mean annual discharge was occurring, ranging from 19% to 58%, and the central time of the discharges was temporally shifting to earlier timeframes within the hydrological year. A study has been conducted by Voss et al. to examine the behavior of water storage within the Tigris-Euphrates region using Gravity Recovery and Climate Experiment (GRACE) data from 2003 to 2009 [37]. They reported that water storage in this region was declining, as shown by the GRACE data especially after 2007, which coincided with the last 10-year period of this study (Figure 10d).
5. Summary and Conclusions
We estimated hydrological droughts using the streamflow drought index (SDI) in the upper Tigris Basin over the period from 1972 to 2011 with monthly streamflow data at 47 stations. After naturalizing streamflow, the probability distributions of log-normal and normal data were tested with the Kolmogorov–Smirnov test. Then, we analyzed the hydrological drought based on the SDI values using 3- (SDI-3), 6- (SDI-6), and 12-month (SDI-12) time scales at the five stations closest to the outlet on the country’s borders. The weighted SDI-12 (WSDI) values were calculated using data from all flow monitoring stations and their related sub-basin areas.
The main conclusions from this study are as follows:
- (1)
- The results of the K–S test showed that log-normal distribution was better than normal distribution at the 0.05 significance level.
- (2)
- Almost all stations experienced at least one severe drought during the study period. For yearly (12-month) periods, severe and moderate drought conditions mostly occurred after 1999.
- (3)
- The SDI-6 series showed a more remarkable decrease during the April–September period as compared with the October–March period. During the April–September period, evaporation was very high. A decrease in streamflow and water losses through evaporation resulted in reduced use of irrigation water, because the requirement for crop irrigation was the highest between May and September in the study region.
- (4)
- The WSDI findings confirmed the SDI-12 results of the selected stations. According to the WSDI results, the intensity and frequency of drought conditions increased in every 10-year period. This outcome has been verified using the maps of averaged SDI-12 values over the Tigris Basin. In these maps, we noticed that areas further south experienced drought earlier in the time domain than areas further north.
Notably, water resource management requires long-term reliable records to solve existing and foreseeable problems, which can also help in creating projections for future needs. The early assessment of probable hydrological drought can support the implementation of preventive measures or mitigation of drought impacts. In this study, our findings showed that naturalized streamflow in the Tigris River exhibits a decreasing trend mainly due to natural factors.
Author Contributions
A.O. conceived this study; Y.Z. gathered all the information and data, and performed the initial analysis; A.O. improved and prepared the manuscript.
Funding
This research received no external funding.
Acknowledgments
This part of this research is based on the work “The Upper Tigris Basin master plan final report”. The report was tendered by the General Directorate of State Hydraulic Works, and completed by SU YAPI Engineering and Consulting Inc. Rainfall datasets were provided by the General Directorate of Meteorology. The authors acknowledge the support of the SU-YAPI Engineering and Consulting Inc. during the preparation of this material. The authors would like to thank the editor and reviewers for all of their constructive and insightful comments in relation to this work.
Conflicts of Interest
The authors declare no conflict of interest.
References
- Manfreda, S.; Iacobellis, V.; Gioia, A.; Fiorentino, M.; Kochanek, K. The Impact of Climate on Hydrological Extremes. Water 2018, 10, 802. [Google Scholar] [CrossRef]
- Van Loon, A.F.; Laaha, G. Hydrological drought severity explained by climate and catchment characteristics. J. Hydrol. 2015, 526, 3–14. [Google Scholar] [CrossRef]
- Nalbantis, I. Evaluation of a Hydrological Drought Index. Eur. Water 2008, 23, 67–77. [Google Scholar]
- Hayes, M.; Svoboda, M.; Wall, N.; Widhalm, M. The Lincoln Declaration on Drought Indices: Universal Meteorological Drought Index Recommended. Bull. Am. Meteorol. Soc. 2011, 92, 485–488. [Google Scholar] [CrossRef]
- Thomas, A.C.; Reager, J.T.; Famiglietti, J.S.; Rodell, M. A GRACE-based water storage deficit approach for hydrological drought characterization. Geophys. Res. Lett. 2014, 41, 1537–1545. [Google Scholar] [CrossRef]
- Wada, Y.; van Beek, L.P.H.; Wanders, N.; Bierkens, M.F.P. Human water consumption intensifies hydrological drought worldwide. Environ. Res. Lett. 2013, 8, 034036. [Google Scholar] [CrossRef]
- Wilhite, D.A.; Glantz, M.H. Understanding: The Drought Phenomenon: The Role of Definitions. Water Int. 1985, 10, 111–120. [Google Scholar] [CrossRef]
- Vasiliades, L.; Loukas, A.; Liberis, N. A Water Balance Derived Drought Index for Pinios River Basin, Greece. Water Resour. Manag. 2011, 25, 1087–1101. [Google Scholar] [CrossRef]
- Tabari, H.; Nikbakht, J.; Hosseinzadeh Talaee, P. Hydrological Drought Assessment in Northwestern Iran Based on Streamflow Drought Index (SDI). Water Resour. Manag. 2013, 27, 137–151. [Google Scholar] [CrossRef]
- Wable, P.S.; Jha, M.K.; Shekhar, A. Comparison of Drought Indices in a Semi-Arid River Basin of India. Water Resour. Manag. 2019, 33, 75–102. [Google Scholar] [CrossRef]
- Shukla, S.; Wood, A.W. Use of a standardized runoff index for characterizing hydrologic drought. Geophys. Res. Lett. 2008, 35, L02405. [Google Scholar] [CrossRef]
- Vicente-Serrano, S.M.; López-Moreno, J.I.; Beguería, S.; Lorenzo-Lacruz, J.; Azorin-Molina, C.; Morán-Tejeda, E. Accurate Computation of a Streamflow Drought Index. J. Hydrol. Eng. 2012, 17, 318–332. [Google Scholar] [CrossRef]
- Nalbantis, I.; Tsakiris, G. Assessment of Hydrological Drought Revisited. Water Resour. Manag. 2009, 23, 881–897. [Google Scholar] [CrossRef]
- Tigkas, D.; Vangelis, H.; Tsakiris, G. Drought and climatic change impact on streamflow in small watersheds. Sci. Total Environ. 2012, 440, 33–41. [Google Scholar] [CrossRef] [PubMed]
- Li, S.; Xiong, L.; Dong, L.; Zhang, J. Effects of the Three Gorges Reservoir on the hydrological droughts at the downstream Yichang station during 2003–2011. Hydrol. Process. 2013, 27, 3981–3993. [Google Scholar] [CrossRef]
- Al-Faraj, F.A.M.; Scholz, M.; Tigkas, D. Sensitivity of Surface Runoff to Drought and Climate Change: Application for Shared River Basins. Water 2014, 6, 3033–3048. [Google Scholar] [CrossRef]
- Rimkus, E.; Stonevičius, E.; Korneev, V.; Kažys, J.; Valiuškevičius, G. Aliaksandr Pakhomau Dynamics of meteorological and hydrological droughts in the Neman river basin. Environ. Res. Lett. 2013, 8, 045014. [Google Scholar] [CrossRef]
- Arabzadeh, R.; Kholoosi, M.M.; Bazrafshan, J. Regional Hydrological Drought Monitoring Using Principal Components Analysis. J. Irrig. Drain. Eng. 2016, 142, 04015029. [Google Scholar] [CrossRef]
- Kermen, E.; Gül, O. Comparing two streamflow-based Drought Indices. In Proceedings of the 4th International Conference Water Resources and Wetlands, Tulcea, Romania, 5–9 September 2018; pp. 190–195. [Google Scholar]
- Ljubenkov, I.; Kalin, K.C. Evaluation of drought using standardised precipitation and flow indices and their correlations on an example of Sinjsko polje. Građevinar 2016, 68, 135–143. [Google Scholar]
- Kubiak-Wójcicka, K.; Bąk, B. Monitoring of meteorological and hydrological droughts in the Vistula basin (Poland). Environ. Monit. Assess. 2018, 190, 691. [Google Scholar] [CrossRef]
- Bąk, B.; Kubiak-Wójcicka, K. Impact of meteorological drought on hydrological drought in Toruń (central Poland) in the period of 1971–2015. J. Water Land Dev. 2017, 32, 3–12. [Google Scholar] [CrossRef]
- Leelaruban, N.; Padmanabhan, G.; Oduor, P. Examining the Relationship between Drought Indices and Groundwater Levels. Water 2017, 9, 82. [Google Scholar] [CrossRef]
- Barker, L.J.; Hannaford, J.; Chiverton, A.; Svensson, C. From meteorological to hydrological drought using standardised indicators. Hydrol. Earth Syst. Sci. 2016, 20, 2483–2505. [Google Scholar] [CrossRef]
- Mazzarella, A.; Giuliacci, A.; Liritzis, I. On the 60-month cycle of multivariate ENSO index. Theor. Appl. Climatol. 2010, 100, 23–27. [Google Scholar] [CrossRef]
- Wang, A.-H.; Zeng, X. Impacts of internal climate variability on meteorological drought changes in China. Atmos. Ocean. Sci. Lett. 2018, 11, 78–85. [Google Scholar] [CrossRef]
- Reddy, R.S.; Neralla, V.R.; Godson, W.L. The solar cycle and Indian rainfall. Theor. Appl. Climatol. 1989, 39, 194–198. [Google Scholar] [CrossRef]
- Wood, C.A.; Lovett, R.R. Rainfall, drought and the solar cycle. Nature 1974, 251, 594. [Google Scholar] [CrossRef]
- Guttman, N.B. On the Sensitivity of Sample L Moments to Sample Size. J. Clim. 1994, 7, 1026–1029. [Google Scholar] [CrossRef]
- Quesada-Montano, B.; Wetterhall, F.; Westerberg, I.K.; Hidalgo, H.G.; Halldin, S. Characterising droughts in Central America with uncertain hydro-meteorological data. Appl. Clim. 2018. [Google Scholar] [CrossRef]
- Kibaroglu, A.; Scheumann, W. Euphrates-Tigris Rivers System: Political Rapprochement and Transboundary Water Cooperation. In Turkey’s Water Policy; Kramer, A., Kibaroglu, A., Scheumann, W., Eds.; Springer: Berlin/Heidelberg, German, 2011; pp. 277–299. ISBN 978-3-642-19635-5. [Google Scholar]
- Lovejoy, S.; Schertzer, D.; Ladoy, P. Fractal characterization of inhomogeneous geophysical measuring networks. Nature 1986, 319, 43. [Google Scholar] [CrossRef]
- Hameed, M.; Ahmadalipour, A.; Moradkhani, H. Apprehensive Drought Characteristics over Iraq: Results of a Multidecadal Spatiotemporal Assessment. Geosciences 2018, 8, 58. [Google Scholar] [CrossRef]
- Chenoweth, J.; Hadjinicolaou, P.; Bruggeman, A.; Lelieveld, J.; Levin, Z.; Lange, M.A.; Xoplaki, E.; Hadjikakou, M. Impact of climate change on the water resources of the eastern Mediterranean and Middle East region: Modeled 21st century changes and implications. Water Resour. Res. 2011, 47, W06506. [Google Scholar] [CrossRef]
- Özdoğan, M. Climate change impacts on snow water availability in the Euphrates-Tigris basin. Hydrol. Earth Syst. Sci. 2011, 15, 2789–2803. [Google Scholar] [CrossRef]
- Bozkurt, D.; Sen, O.; Hagemann, S. Projected river discharge in the Euphrates–Tigris Basin from a hydrological discharge model forced with RCM and GCM outputs. Clim. Res. 2015, 62, 131–147. [Google Scholar] [CrossRef]
- Voss, K.A.; Famiglietti, J.S.; Lo, M.; de Linage, C.; Rodell, M.; Swenson, S.C. Groundwater depletion in the Middle East from GRACE with implications for transboundary water management in the Tigris-Euphrates-Western Iran region. Water Resour. Res. 2013, 49, 904–914. [Google Scholar] [CrossRef] [PubMed]
Figure 1.
Study area, river, and distribution of hydropower plants, dams, and flow monitoring stations with sub-basin boundaries (red circles show closed stations, whereas green circles show open stations).
Figure 1.
Study area, river, and distribution of hydropower plants, dams, and flow monitoring stations with sub-basin boundaries (red circles show closed stations, whereas green circles show open stations).

Figure 2.
Spatial distribution of the yearly rainfall map using ordinary Kriging method and distribution of meteorological stations including sub-basins of the study area (red circles show stations that measure temperature and precipitation, green circles show stations that measure precipitation, and the abbreviation E shows stations that measure evaporation).

Figure 3.
Average monthly precipitation, evaporation, minimum temperature, maximum temperature, and average temperature. We used 96, 15, and 21 meteorological stations for the average calculation of precipitation, evaporation, and temperature for the whole basin area, respectively.
Figure 3.
Average monthly precipitation, evaporation, minimum temperature, maximum temperature, and average temperature. We used 96, 15, and 21 meteorological stations for the average calculation of precipitation, evaporation, and temperature for the whole basin area, respectively.

Figure 4.
Demonstration of upstream facilities for the flow monitoring station 1.

Figure 5.
Number of stations that have a normal distribution considering the reference period using the Kolmogorov–Smirnov test.
Figure 5.
Number of stations that have a normal distribution considering the reference period using the Kolmogorov–Smirnov test.

Figure 6.
SDI-3 series of the stations 21, 36, 45, 37, and 20 for the periods (a) October–December, (b) January–March, (c) April–June, and (d) July–September.
Figure 6.
SDI-3 series of the stations 21, 36, 45, 37, and 20 for the periods (a) October–December, (b) January–March, (c) April–June, and (d) July–September.

Figure 7.
SDI-6 series of the stations 21, 36, 45, 37, and 20 for the periods of (a) October–March and (b) April–September.
Figure 7.
SDI-6 series of the stations 21, 36, 45, 37, and 20 for the periods of (a) October–March and (b) April–September.

Figure 8.
SDI-12 series of stations 21, 36, 45, 37, and 20 for yearly periods.

Figure 9.
Weighted SDI-12 series for yearly periods.

Figure 10.
Distribution of averaged SDI-12 values over the basin for 10-year period intervals: (a) 1972–1981, (b) 1982–1991, (c) 1992–2001, and (d) 2002–2011; white areas denote no data.
Figure 10.
Distribution of averaged SDI-12 values over the basin for 10-year period intervals: (a) 1972–1981, (b) 1982–1991, (c) 1992–2001, and (d) 2002–2011; white areas denote no data.


Table 1.
Details of the hydrometric stations, coordinates, elevations, and intermediate basin areas (all the stations except the underlined ones are naturalized).
Table 1.
Details of the hydrometric stations, coordinates, elevations, and intermediate basin areas (all the stations except the underlined ones are naturalized).
| Station No | Lon. (E) | Lat. (N) | Elevation (m) | Intermediate Basin Area (km2) |
|---|---|---|---|---|
| 1 | 40°14′ | 37°40′ | 702 | 648 |
| 2 | 40°40′ | 37°44′ | 1500 | 407 |
| 3 | 40°53′ | 37°51′ | 525 | 902 |
| 4 | 40°33′ | 37°54′ | 520 | 240 |
| 5 | 40°53′ | 37°34′ | 775 | 576 |
| 6 | 42°15′ | 38°20′ | 1594 | 126 |
| 7 | 44°6′ | 37°50′ | 1813 | 2070 |
| 8 | 40°34′ | 38°4′ | 738 | 305 |
| 9 | 40°26′ | 38°21′ | 800 | 292 |
| 10 | 42°25′ | 38°8′ | 1000 | 1264 |
| 11 | 42°48′ | 38°5′ | 1540 | 253 |
| 12 | 42°11′ | 37°24′ | 400 | 650 |
| 13 | 42°59′ | 37°55′ | 1350 | 614 |
| 14 | 44°21′ | 37°37′ | 1928 | 130 |
| 15 | 41°46′ | 38°27′ | 1200 | 425 |
| 16 | 41°46′ | 38°22′ | 909 | 358 |
| 17 | 40°55′ | 38°1′ | 594 | 158 |
| 18 | 39°42′ | 38°15′ | 852 | 52 |
| 19 | 44°36′ | 37°43′ | 1720 | 244 |
| 20 | 44°32′ | 37°16′ | 1090 | 101 |
| 21 | 42°10′ | 37°21′ | 370 | 9982 |
| 22 | 39°59′ | 38°4′ | 724 | 1524 |
| 23 | 41°21′ | 37°58′ | 545 | 1043 |
| 24 | 40°14′ | 37°53′ | 570 | 1390 |
| 25 | 41°47′ | 38°10′ | 910 | 640 |
| 26 | 41°12′ | 38°9′ | 597 | 4105 |
| 27 | 43°3′ | 38°1′ | 1612 | 426 |
| 28 | 42°39′ | 37°58′ | 1250 | 253 |
| 29 | 40°2′ | 38°20′ | 695 | 798 |
| 30 | 40°23′ | 37°59′ | 595 | 684 |
| 31 | 40°27′ | 37°41′ | 657 | 668 |
| 32 | 43°34′ | 37°29′ | 1072 | 1109 |
| 33 | 44°5′ | 37°46′ | 1725 | 434 |
| 34 | 44°4′ | 37°41′ | 1694 | 1006 |
| 35 | 41°51′ | 37°58′ | 530 | 1044 |
| 36 | 42°42′ | 37°28′ | 780 | 1127 |
| 37 | 43°34′ | 37°17′ | 775 | 1212 |
| 38 | 43°32′ | 37°33′ | 1627 | 290 |
| 39 | 43°59′ | 37°42′ | 1425 | 521 |
| 40 | 43°3′ | 37°60′ | 1482 | 2029 |
| 41 | 40°12′ | 38°23′ | 689 | 1504 |
| 42 | 41°52′ | 37°49′ | 465 | 3909 |
| 43 | 41°31′ | 38°11′ | 630 | 625 |
| 44 | 39°42′ | 38°20′ | 843 | 287 |
| 45 | 43°10′ | 37°22′ | 935 | 1217 |
| 46 | 44°36′ | 37°17′ | 1338 | 296 |
| 47 | 39°30′ | 38°27′ | 1263 | 101 |
Table 2.
Description of hydrological drought based on the streamflow drought index (SDI) criterion [13].
Table 2.
Description of hydrological drought based on the streamflow drought index (SDI) criterion [13].
| Description | Criterion |
|---|---|
| Non-drought | 0.0 ≤ SDI |
| Mild drought | −1.0 ≤ SDI < 0.0 |
| Moderate drought | −1.5 ≤ SDI < −1.0 |
| Severe drought | −2.0 ≤ SDI < −1.5 |
| Extreme drought | SDI < −2.0 |
© 2019 by the authors. Licensee MDPI, Basel, Switzerland. This article is an open access article distributed under the terms and conditions of the Creative Commons Attribution (CC BY) license (http://creativecommons.org/licenses/by/4.0/).
Share and Cite
MDPI and ACS Style
Ozkaya, A.; Zerberg, Y. A 40-Year Analysis of the Hydrological Drought Index for the Tigris Basin, Turkey. Water 2019, 11, 657. https://doi.org/10.3390/w11040657
AMA Style
Ozkaya A, Zerberg Y. A 40-Year Analysis of the Hydrological Drought Index for the Tigris Basin, Turkey. Water. 2019; 11(4):657. https://doi.org/10.3390/w11040657
Chicago/Turabian StyleOzkaya, Arzu, and Yeliz Zerberg. 2019. "A 40-Year Analysis of the Hydrological Drought Index for the Tigris Basin, Turkey" Water 11, no. 4: 657. https://doi.org/10.3390/w11040657
Note that from the first issue of 2016, this journal uses article numbers instead of page numbers. See further details here.