Evaporation and Soil Surface Resistance of the Water Storage Pit Irrigation Trees in the Loess Plateau

1
College of Water Resource Science and Engineering, Taiyuan University of Technology, Taiyuan 030024, China
2
Jinzhong University, Jinzhong 030600, China
*
Author to whom correspondence should be addressed.
Water 2019, 11(4), 648; https://doi.org/10.3390/w11040648
Submission received: 21 January 2019
/
Revised: 21 March 2019
/
Accepted: 23 March 2019
/
Published: 28 March 2019
(This article belongs to the Special Issue Evapotranspiration and Plant Irrigation Strategies)
Abstract
:As an important step for formulating a water-saving agricultural strategy, it is essential to make quantitative calculations for orchard soil evaporation and confirm its inner mechanism, so as to reduce ineffective water consumption and improve the utilization efficiency of water resources. To reveal the effect of water storage pits under water storage pit irrigation conditions in orchard soil evaporation, micro-lysimeters were used to measure the soil evaporation in two different forms (soil surface evaporation and pit wall evaporation) under diverse irrigation systems using water storage pit irrigation in the apple growth period of 2018. To calculate the orchard soil evaporation of water storage pit irrigation, the pit irrigation coefficient was introduced and a model was constructed. To illustrate the inner mechanism of orchard soil evaporation, the soil surface resistance under water storage pit irrigation conditions was analyzed and calculated quantitatively. The results show that: (1) introducing the pit irrigation coefficient can boost the calculation precision of the orchard soil evaporation under water storage pit irrigation conditions; (2) when applying the soil evaporation of the water storage pit irrigation model for calculation of the orchard soil evaporation, can reach 0.92; and (3) the mechanisms of the two orchard soil evaporation forms under water storage pit irrigation are very different. When soil surface evaporation and pit wall evaporation were calculated by the soil surface resistance of water storage pit irrigation model, values were 0.95 and 0.96, respectively.
1. Introduction
The study and measurement of orchard evapotranspiration is important in the utilization and management of the water in the orchard; its value is equivalent of the sum of crop transpiration and orchard soil evaporation [1,2]. Without affecting the effective transpiration T, it is essential to reduce the wetted areas and times on the soil surface as far as possible, which is a major technical measure to reduce orchard soil evaporation E and enhance water use efficiency [3]. In 1998, the water storage pit irrigation (WSPI) method [4] was put forward by Xihuan Sun. This irrigation method is suitable for orchards in northern arid and semi-arid regions, which can effectively reduce orchard soil evaporation . In the past two decades, research on the WSPI method has made breakthroughs in various aspects [5,6,7], which includes the main technical parameters of the WSPI method, soil water infiltration characteristics and simulation, nitrogen transport characteristics and simulation, and fruit tree root growth characteristics and simulation. Due to the special field engineering structure of WSPI, the main sources of orchard soil evaporation are the surface and the pit wall. There is a great difference between surface evaporation and pit wall evaporation in the function mechanism. In a WSPI orchard, due to the existence of the water storage pits, the underlying surface is abruptly changed, and the evaporation source in the pits is the soil of the pit wall. The micro-climate environment with high humidity and low wind speed in the water storage pits is very different from the atmospheric environment. The material and energy exchange interface between the water storage pits and the atmosphere is the total area of the pit opening. Therefore, the underlying reason of this paper is that the existence of the water storage pit changes the exchanged mode for the soil of the pit wall and the atmosphere in terms of material and energy. This paper attempts to explore this difference from the perspective of the soil evaporation mechanism.
The soil surface resistance, that is, the diffusion resistance of water vapor from the evaporation front of the soil through the moist soil layer to the surface dry soil layer [8], is generally expressed by . It mainly depends on the surface soil water content [9], water vapor pressure, soil temperature gradient, matrix potential, pore diameter, and air turbulence occurring at the soil-atmosphere interface, and so on. At the earliest, thanks to the comparison between unsaturated soil evaporation and saturated soil evaporation, soil surface resistance has been introduced to explain the transmission of water vapor from evaporation surface to soil surface by Slatyer et al. [10] and Monteith et al. [11]; Fuchs et al. [12] assumes that there is a saturated water vapor plane within the soil, firstly quantitatively describing the soil surface resistance:
In 1982, Shu Fen Sun [13] proposes:
This empirical formula is based on the surface saturated water content and volumetric water content. The pre-condition for the application is that when the aerodynamic resistance was calculated, the atmosphere was assumed to be a neutral layer. Therefore, would be underestimated, and the calculation of evaporation would be relatively large. Afterwards, other authors have raised the empirical formulas based on the surface soil water content, field capacity or saturated water content under different underlying conditions, and the parameters of empirical formulas are determined based on the field test data [14,15,16,17]. Park et al. [18] and Qiu et al. [19] establish a numerical model to evaluate the effect of litter layer on evaporation. Li Yan et al. [20] propose the evaporation resistance and soil evaporation model under the condition of stubble coverage, and the parameters are determined based on the experimental data. Haghighi et al. and Or et al. [21,22] propose the soil surface resistance model with a bluff body dry surface, which can accurately estimate the latent heat flux of bare soil and intermittent cluster landscape. However, the above research results are not applicable to the calculation of orchard soil surface resistance under WSPI conditions. This is due to the existence of water storage pits in the WSPI orchard, which changes the evaporation source of the orchard. Therefore, there are two forms of soil surface resistance (soil surface resistance of the surface and soil surface resistance of the pit wall ) in the WSPI orchard. In addition, for the special field layout mode of WSPI, the model of soil surface resistance, sensible heat flux and latent heat flux have not been proposed in any previous studies. Therefore, this paper attempts to study the soil evaporation of WSPI orchard from the perspective of soil surface resistance.
The development of a future evaporation model shall be corrected based on the previous model or undergo coupling with the original models under different meteorological conditions, vegetation types and underlying conditions. In this way, it should be a practical model with simple structure, high precision, few parameters and be easily accessible. The objectives of this paper are: (1) to construct the orchard soil evaporation model under on the precondition of considering the effect; (2) to further explore the evaporation mechanism of ; and (3) to provide a theoretical basis for the achievement of real-time prediction of orchard soil evaporation under and further field promotion of .
2. Materials and Methods
2.1. Experimental Site Description
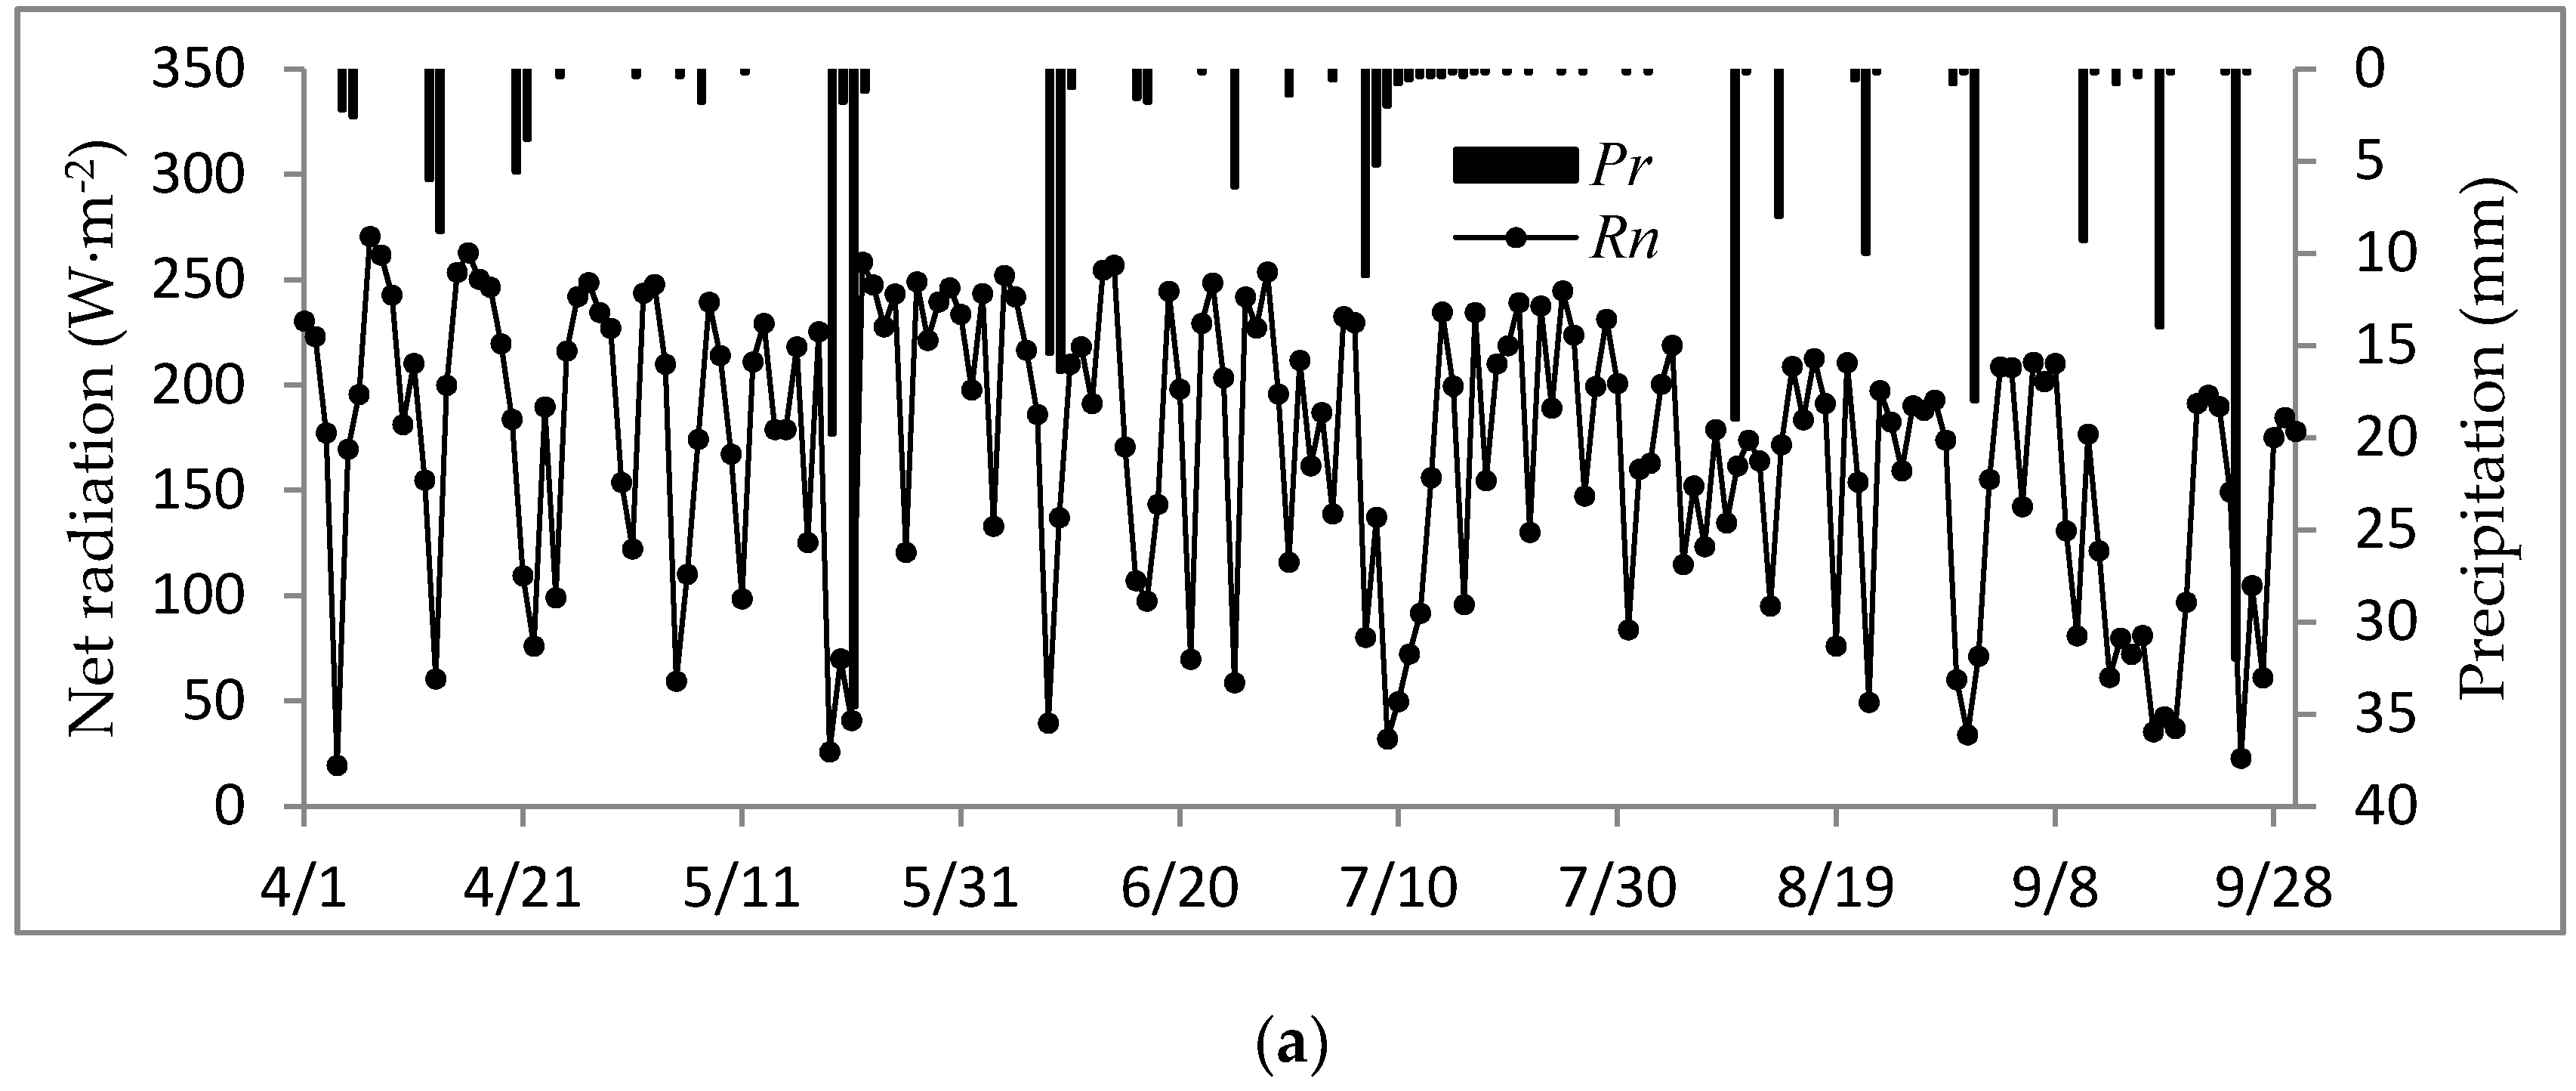
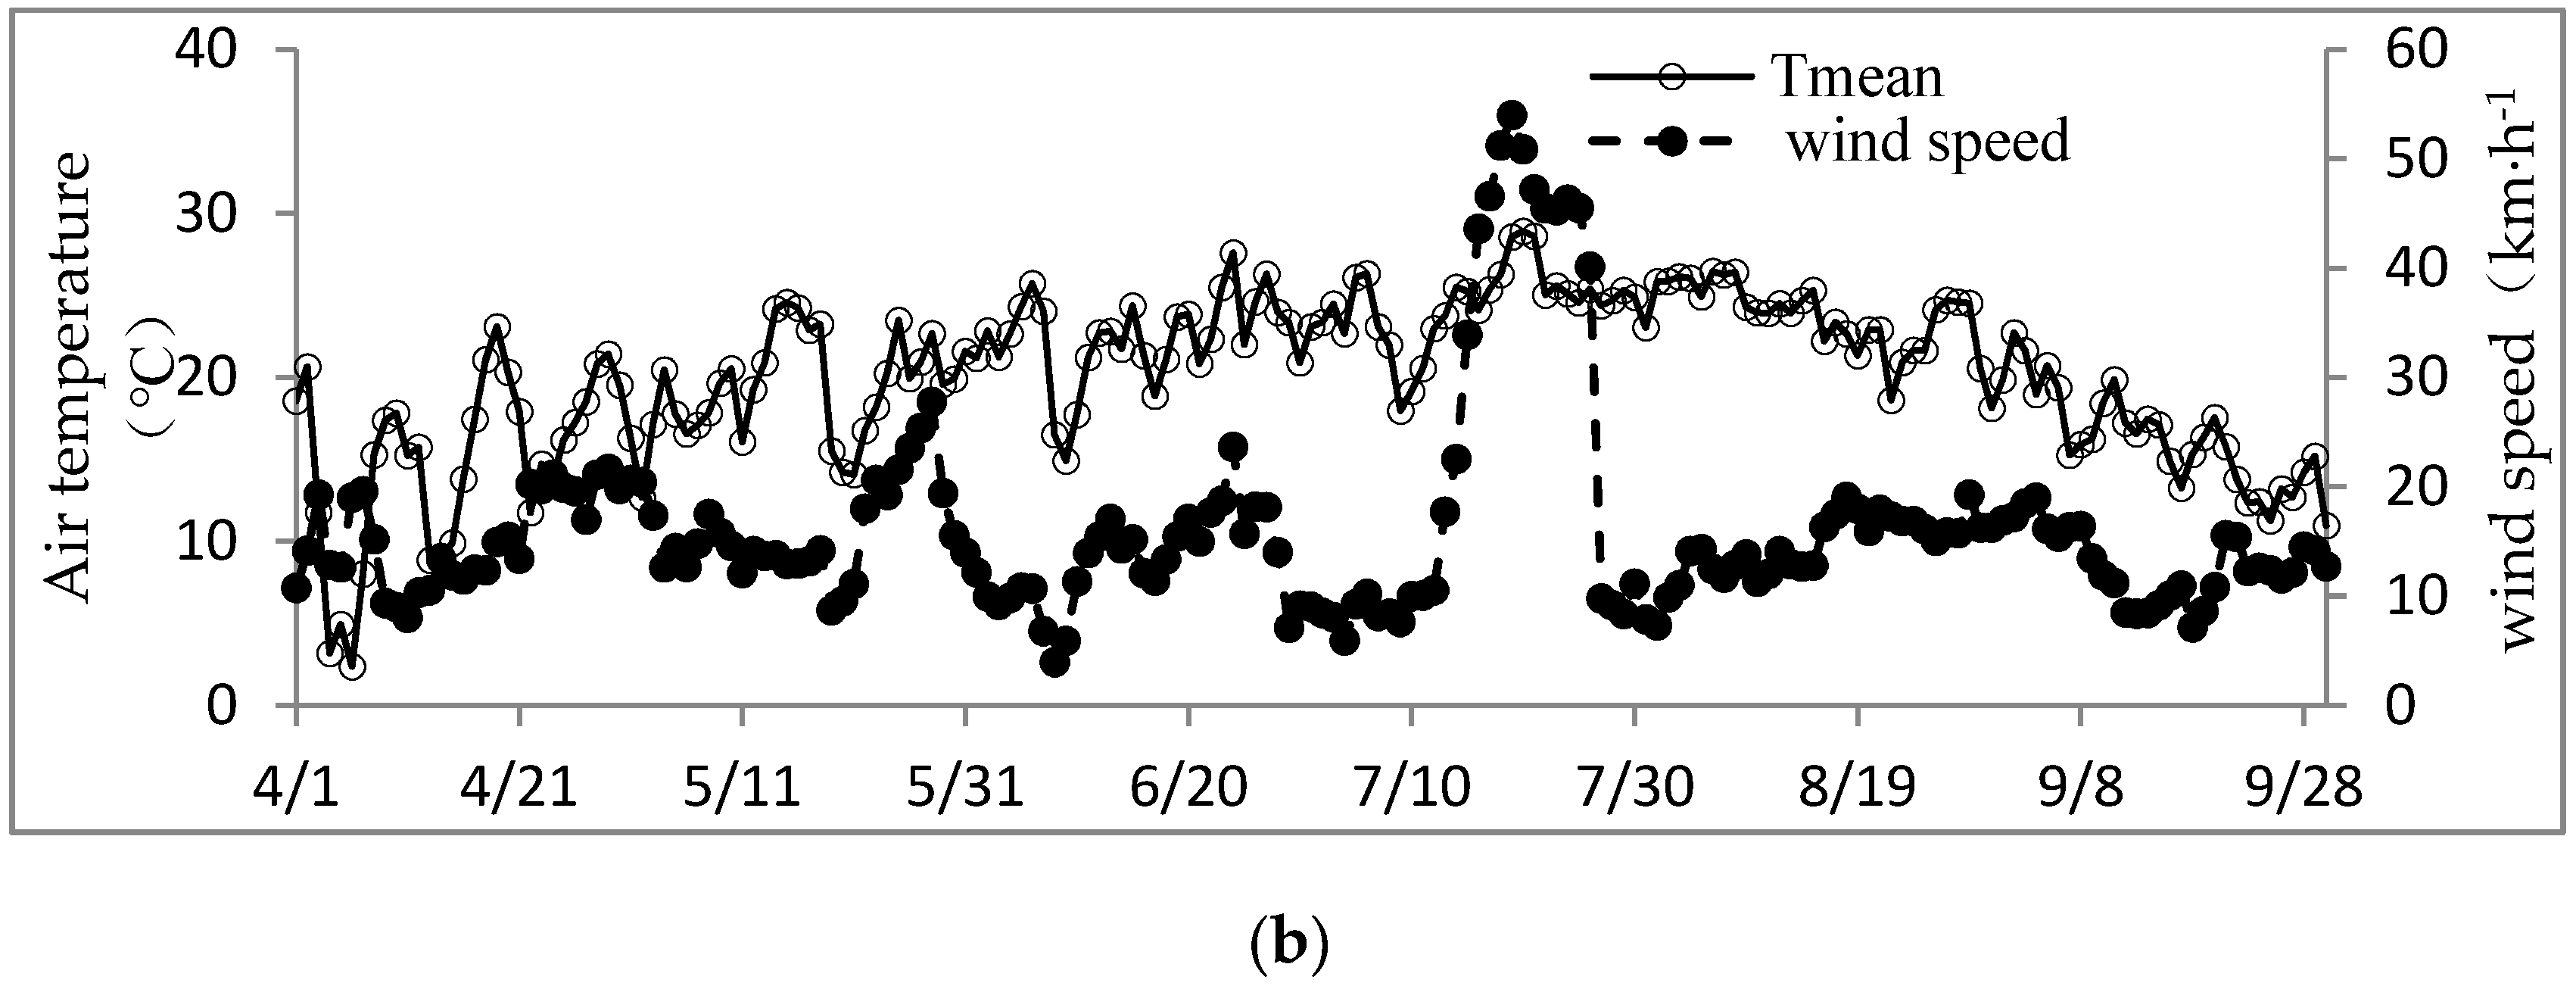
This experiment was conducted in an apple orchard at Shanxi Academy of Agricultural Sciences, situated in Taigu County, Jinzhong City, Shanxi Province (, ). The average elevation of the test site is 781.9 m. The orchard experiences a warm temperate continental monsoon climate that is typical of the Loess Plateau. Wind and sand are cold and dry in winter and spring and are affected by polar dry cold air mass. Rains in summer and autumn are hot and heavy and are affected by the highs of the subtropical Western Pacific and the lows of the Indian Ocean. Here, the mean annual air temperature is approximately 9.8 °C. The mean annual rainfall amounts to 459.6 mm, and rainfall between June and September accounts for approximately 70% of the annual precipitation. The frost period is from early October to mid-April, and the frostless season lasts 175 days. The soil texture is mainly loam, the average soil bulk density is , the field capacity is 30%, and the saturated water content is 50%. The physical parameters of the test soil are within a depth of 0–2 m (see Table 1). During the apple growth period in 2018, the rainfall was 347.6 mm, the mean air temperature was 20.17 , the mean minimum air temperature was 13.36 , the mean maximum air temperature was 27.48 , the mean wind speed was 16.04 , and the mean net radiation was 169.9 . The relative air humidity was 74.11%. The daily variation of basic meteorological factors is shown in Figure 1.
2.2. Experimental Design
The experiment was conducted from April to October during the 2018 apple season. The research object of the experiment was ten-year-old, three-stage rootstock, dwarf Fuji apples. The apple trees were planted from north to south, with a plant spacing of 2 m and a row spacing of 2 m. The test controlled the irrigation amount by measuring the soil water content. The trees were irrigated when the soil water content reached the lower limit of the irrigation threshold. Three treatments were set up, and each treatment was repeated three times. Test treatments are as follows: the 1 treatment’s upper and lower irrigation limit in the growth season was 60% and 80% of the field capacity, respectively; the 2 treatment’s upper and lower irrigation limit in the growth season was 70% and 90% of the field capacity, respectively; the 3 treatment’s upper and lower irrigation limit in the growth season was 80% and 100% of the field capacity, respectively. The irrigation date and total amount of water applied is listed in Table 2. Each tree was filled with 320 L each time; lots of 320 L of water were poured into 4 water storage pits. The average irrigation amount of each water storage pit was 80 L. The field experimental layout of the is shown in Figure 2.
2.3. Experimental Methods
The meteorological data was measured using the Adcon_Ws wireless automatic weather monitoring station in the middle of the orchard, which mainly included: precipitation, air temperature, relative humidity, wind speed, and wind direction. Data acquisition was performed every 15 min.
The small meteorological data of water storage pits were obtained using an NK-3500 handheld meteorological instrument (Li-cor company, Lincoln, NE, USA). The measured parameters included wind speed, temperature, and relative humidity. Data were collected from the pit mouth of 10 and 30 cm at 8:00 a.m., 2:00 p.m., and 6:00 p.m. on the test day.
The evaporation of was measured using micro-lysimeters. The layout of the measuring points is shown in Figure 2. Each tree was equipped with 5 micro lysimeter measuring points. Three points were at 20 cm, 60 cm, 100 cm from the tree on the surface, and two points were evenly arranged along the pit wall (see Figure 2). The measurement time was 8:00 a.m. on the test day. An electronic balance with an accuracy of 0.01 g was used. Additional tests were required after irrigation or rainfall.
The surface soil water content (0–3 cm) was measured using a drying method. Leaf area index was determined using an canopy analyzer (Li-cor company, Lincoln, NE, USA).
2.4. Energy-Balance Equation
The measurement of evapotranspiration (, evaporation ( and transpiration requires complex, expensive instruments and complicated data algorithms and interpretation [23]. Using the energy balance equation to calculate evaporation is a convenient method. The surface energy balance equation could be found in the references [24,25,26]:
where , , and represent latent heat flux, sensible heat flux, net radiation, and surface soil heat flux, respectively . The expressions of G [6] and H [27] are expressed as follows:
where , represent the mean surface soil daily temperature of day i and day i − 1, respectively , is a common coefficient , is the mean air density at constant pressure , is the specific heat of moist air at constant pressure , is the mean surface soil temperature , is the mean air temperature , is the aerodynamic resistance at the reference height , is the aerodynamic resistance from surface to canopy .
2.5. Evaluation of Model Performance
IBM SPSS Statistics23 and MATLAB R2014b were used for data analysis and calculation, and the charts were made using Excel. To evaluate the effects of the relevant factors involved in two types of the soil surface resistance under a condition, a multivariate stepwise regression analysis was performed. Standardized regression coefficients with significance level were accepted as the coefficients of the regression equations. Partial correlation coefficients were used to reflect the correlation of two types of soil surface resistance to each individual correlative factors. The slope of linear regression, the coefficient of determination , the root mean square error , and the Nash-Sutcliffe efficiency were used to evaluate the consistency between predicted and measured values to quantify model performance.
where represented the predicted and measured values, respectively, and N was the total number of test measurements.
3. Model Construction
3.1. Pit Irrigation Coefficient
As a deep, three-dimensional and new type of irrigation method, the method is evenly equipped with numerous cylinder-shaped water storage pits at a spot under the canopy layer, half the distance from the tree stem (here, there were -four water storage pits for each tree with a diameter of 300 mm and a depth of 400 mm). The field engineering layout for mainly includes the excavation of water storage pits, fortifying measures for pit walls, and anti-seepage measures for the pit bottoms. The water-saving mechanism of this irrigation method is designed to reduce the vertical movement of irrigation water as much as possible and promote its horizontal movement along the pit wall. Thus, irrigation water can directly reach the root system, and wet area of the surface can be reduced. In brief, this method can achieve the double effects of reducing deep leakage of water and invalid orchard soil evaporation.
There are two forms of orchard soil evaporation under conditions: soil surface evaporation and pit wall evaporation . The two forms of evaporation differ greatly in mechanism because of their different environments. The evaporation source of the water storage pit is the pit wall, but its water-heat exchange interface with the atmosphere is the total area of the pit opening. Therefore, in a bid to make a precise calculation of the orchard soil evaporation capacity under , the ratio of the total area of the pit opening to the occupation area of a single fruit tree is defined as the pit irrigation coefficient . These two forms of evaporation are calculated as follows:
where is the water–heat exchange area of the water storage pit under , namely the total area of the pit opening , and ; is the occupation area of one single apple tree , and . The pit irrigation coefficient under in this study was set to 0.07065.
3.2. Latent Heat Flux under the Effect
In the energy system of a irrigation orchard, the net radiation absorbed by the soil is calculated by the Beer’s exponential decay law:
where is the net radiation absorbed by orchard soil under WSP irrigation , is the solar net radiation , is leaf area index, is the extinction coefficient of the vegetation for net radiation. When the surface soil water content is low, the temperature and albedo are high, which leads to less net radiation fluxes into the soil. As the paper loses sight of the fact that c is bound to change with the change of the vegetation throughout its whole growth period, its approximate value shall be taken as 0.5 [28,29,30].
There are two small energy systems in the surface-pit energy system of the orchard, namely the orchard surface soil energy system and the orchard water storage pit energy system. In the orchard surface soil energy system, the absorbed net radiation is divided into the latent heat flux , the sensible heat flux , and the soil heat flux of surface soil , . In the orchard water storage pit energy system, the absorbed net radiation is divided into latent heat flux , sensible heat flux and soil heat flux of the pit wall , and .
Therefore, the pit irrigation coefficient is introduced, and the orchard latent heat flux under could be simplified as follows:
where is the orchard latent heat flux under condition .
The calculation formulas of and are as follows;
where , and represent average temperature of surface soil, atmosphere, pit wall soil respectively . As the paper believes that the water-heat exchange interface between the water storage pit and the atmosphere is the total area of the pit opening. Therefore, when calculating the sensible heat flux of the pit wall, its aerodynamic resistance is negligible, the approximate value could be regarded as 0.
The calculation formulas of and are as follows [30];
where is the Karman’s coefficient , is the reference height , is the theoretical roughness , is zero plane displacement , is the plant height , taking 2 m, is the rough length of the ground , taking 0.02 m, is the friction velocity , is the eddy diffusion coefficient , is the eddy diffusion decay constant, is zero plane displacement of canopy . All terms are calculated as follows [30].
The calculation formulas of and are as follows
where , represent the daily average temperatures of orchard surface soil at day i and day i − 1 , respectively. , represent daily average temperature of orchard pit wall soil at day i and day i − 1 , respectively.
In conclusion, with the combination of pit irrigation coefficient and the energy balance equation, Equation (10) is the orchard soil latent heat flux calculation model , which is proposed in this paper. Equations (11)–(16) are the calculation formulas of the parameters in the model.
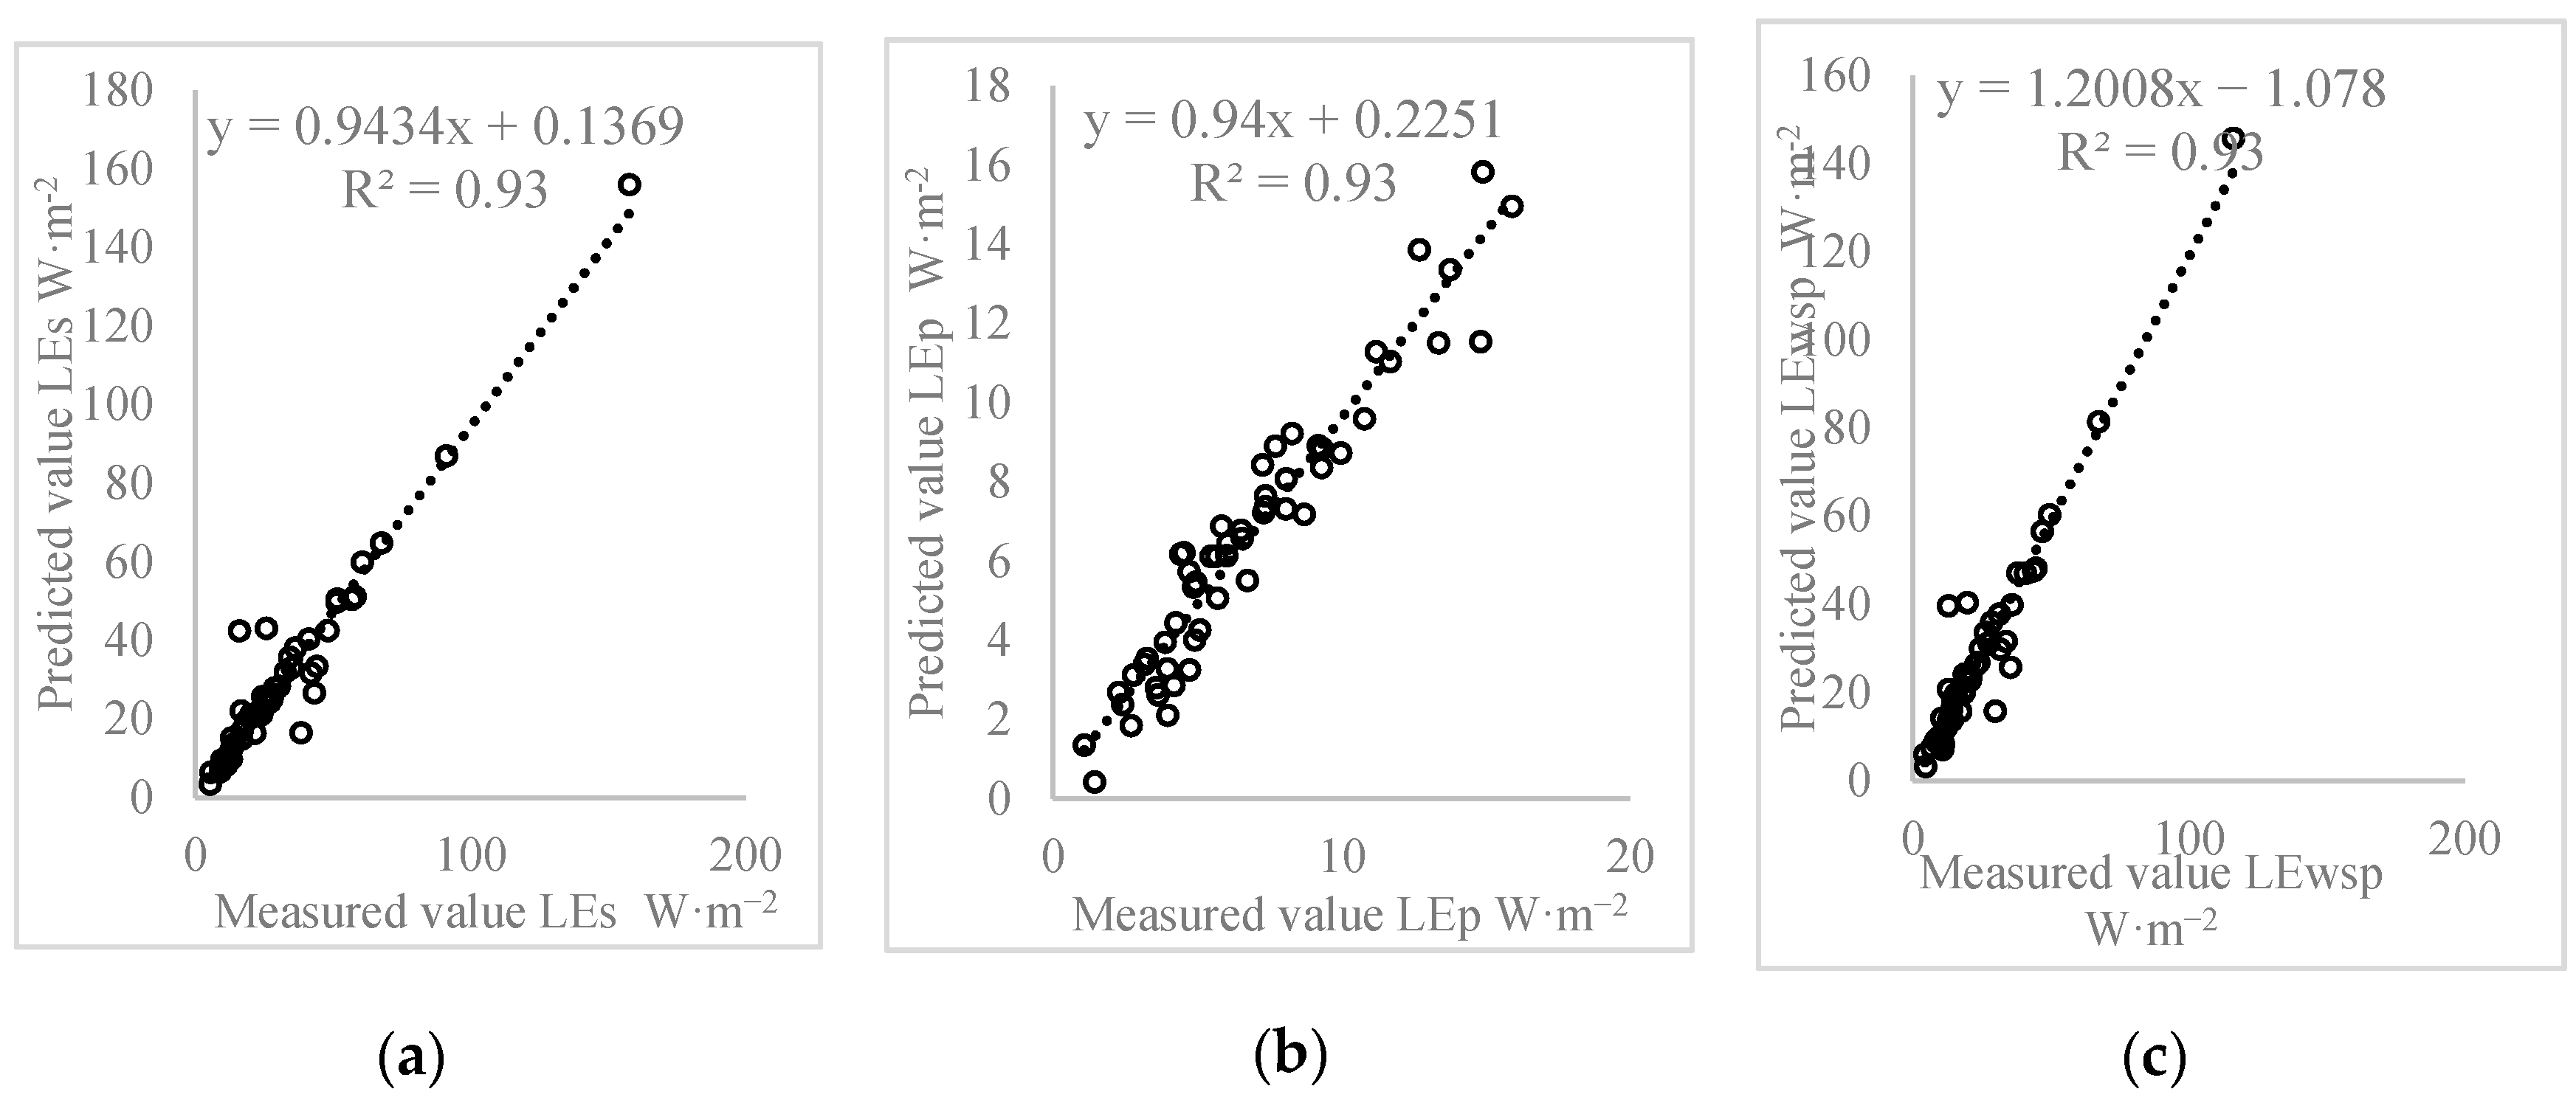
Figure 3 shows the linear relationship between the predicted and measured values of the surface soil latent heat flux , the pit wall soil latent heat flux , and the orchard soil latent heat flux , respectively. When applying the model to simulate , , and , the slope of the linear equation reaches: 0.94, 0.94, and 1.20, the fitting degrees are 0.94, 0.93, and 0.93, and the root mean square error and Nash-Sutcliffe efficiency values can be found in Table 3. This indicates that the orchard evaporation capacity under WSPI conditions could be calculated in an accurate manner.
3.3. Comparison of Two Types of Soil Surface Resistance under WSPI
Three stages should be followed during the period of soil evaporation: the stabilization stage of the evaporation rate, the declining stage of the evaporation rate, and the water vapor diffusion control stage. Each stage is controlled by the soil water content, which is the underlying reason for the different evaporation stages. The effects of soil water content on different evaporation stages is mainly reflected in the soil surface resistance. For the special field irrigation engineering of WSPI, the underlying surface was abruptly changed by the water storage pits, which further affects the orchard soil water–heat exchange form. Therefore, to describe the orchard soil evaporation under the WSPI conditions from a microscopic point of view, it is necessary to explore the characteristics of soil surface resistance and conduct a quantitative calculation.
There are two forms of soil surface resistance under the WSPI condition, the soil surface resistance of the surface and the soil surface resistance of the pit wall , which could be calculated as follows [31]:
where is latent heat of vaporization , and are air absolute humidity of the surface and the pit wall , is the air humidity , is aerodynamic resistance , and are water potentials of the surface and the pit wall respectively , . is gravitational acceleration , is cosmic gas constant , is air relative humidity , is surface roughness of momentum flux , is the surface roughness of heat flux .
The multiple stepwise regression analysis between the soil surface resistance of the pit wall and the factors of net radiation flux into the soil , the leaf area index (), the soil water content of the pit wall , the air relative humidity , the relative air humidity in the pit , the surface mean temperature of the pit wall , the air average temperature , and the difference between surface mean temperature of the pit wall and the air average temperature are shown in Table 4. For , factors of , , and were included in the multiple stepwise regression analysis, which constituted significant factors (p < 0.05) with partial correlation coefficient of 0.893, −0.557, and 0.417, respectively. , , and were in a positive correlation while and are in a negative correlativity. This result is very different from previous research on soil surface resistance. When the air humidity in the pit begins to decline after reaching the maximum level in the wake of irrigation or precipitation, the same phenomenon was observed in the water content of the pit wall. It can be seen from Table 4 that the partial correlation coefficient of is at the top value, so the daily evaporation intensity of the pit wall is not the maximum at the beginning, but is a gradually increasing process. During this process, the air humidity of the pit decreases step by step, while and remain at the original level. Generally, the daily evaporation intensity of the pit wall reached the peak after several days of irrigation or rainfall, and relative air humidity in the pit and soil water content of the pit then decreased with the gradual rising of , until the daily evaporation intensity of the pit wall gradually decreased towards stability. This result is basically in agreement with the results from Guo [6]. , , , and had no significant effect on the soil surface resistance of the pit wall, which is related to the special microclimate environmental conditions of high humidity, approximate zero wind speed, and the small amount of net radiation in the pit. Therefore, the influence of , , , and on is weakened.
A multiple stepwise regression analysis was conducted between the soil surface resistance of the surface and the factors of net radiation flux in the soil , the leaf area index (), the surface soil water content , the relative air humidity , the daily mean wind speed , the soil surface mean temperature , the air average temperature , and the difference between soil surface mean temperature and air average temperature as shown in Table 4. For , factors of and were included in the multiple stepwise regression analysis. was the significant factor for (p < 0.01) and was in a negative correlation, of which the partial correlation coefficient was −0.858. This result is consistent with the results of [14,15,16,17,18]. was another significant factor for (p < 0.05), and showed a positive correlation with the partial correlation coefficient of 0.279. During the irrigation process, the irrigation water will be directly poured into the pit and reach the root system along the pit wall. In this way, the influence on orchard surface soil water content is small. Therefore, the impact on the orchard soil surface evaporation is relatively small. During the rainfall process, the orchard surface soil water content increases significantly and decreases, so rainfall has a greater impact on surface evaporation. The effect of , , , and on evaporation depend on the wet state of the soil surface, and the above factors have no significant effect on the soil surface resistance in the WSPI orchard. This is because the surface soil water content is maintained at a low level in the absence of precipitation. In the current study, the leaf area index () had no significant effect on the two forms of soil surface resistance, which may be related to the focus of this paper. The research objects were dwarf apple trees, and the range variation of was small during the entire growth period (with an average of 2.88, a standardized deviation of 0.46, a minimum value of 1.98, and a maximum value of 3.78).
Therefore, the model has been proposed in the paper, with the following expression formula:
The variables are the same as above.
3.4. Verification of the Model
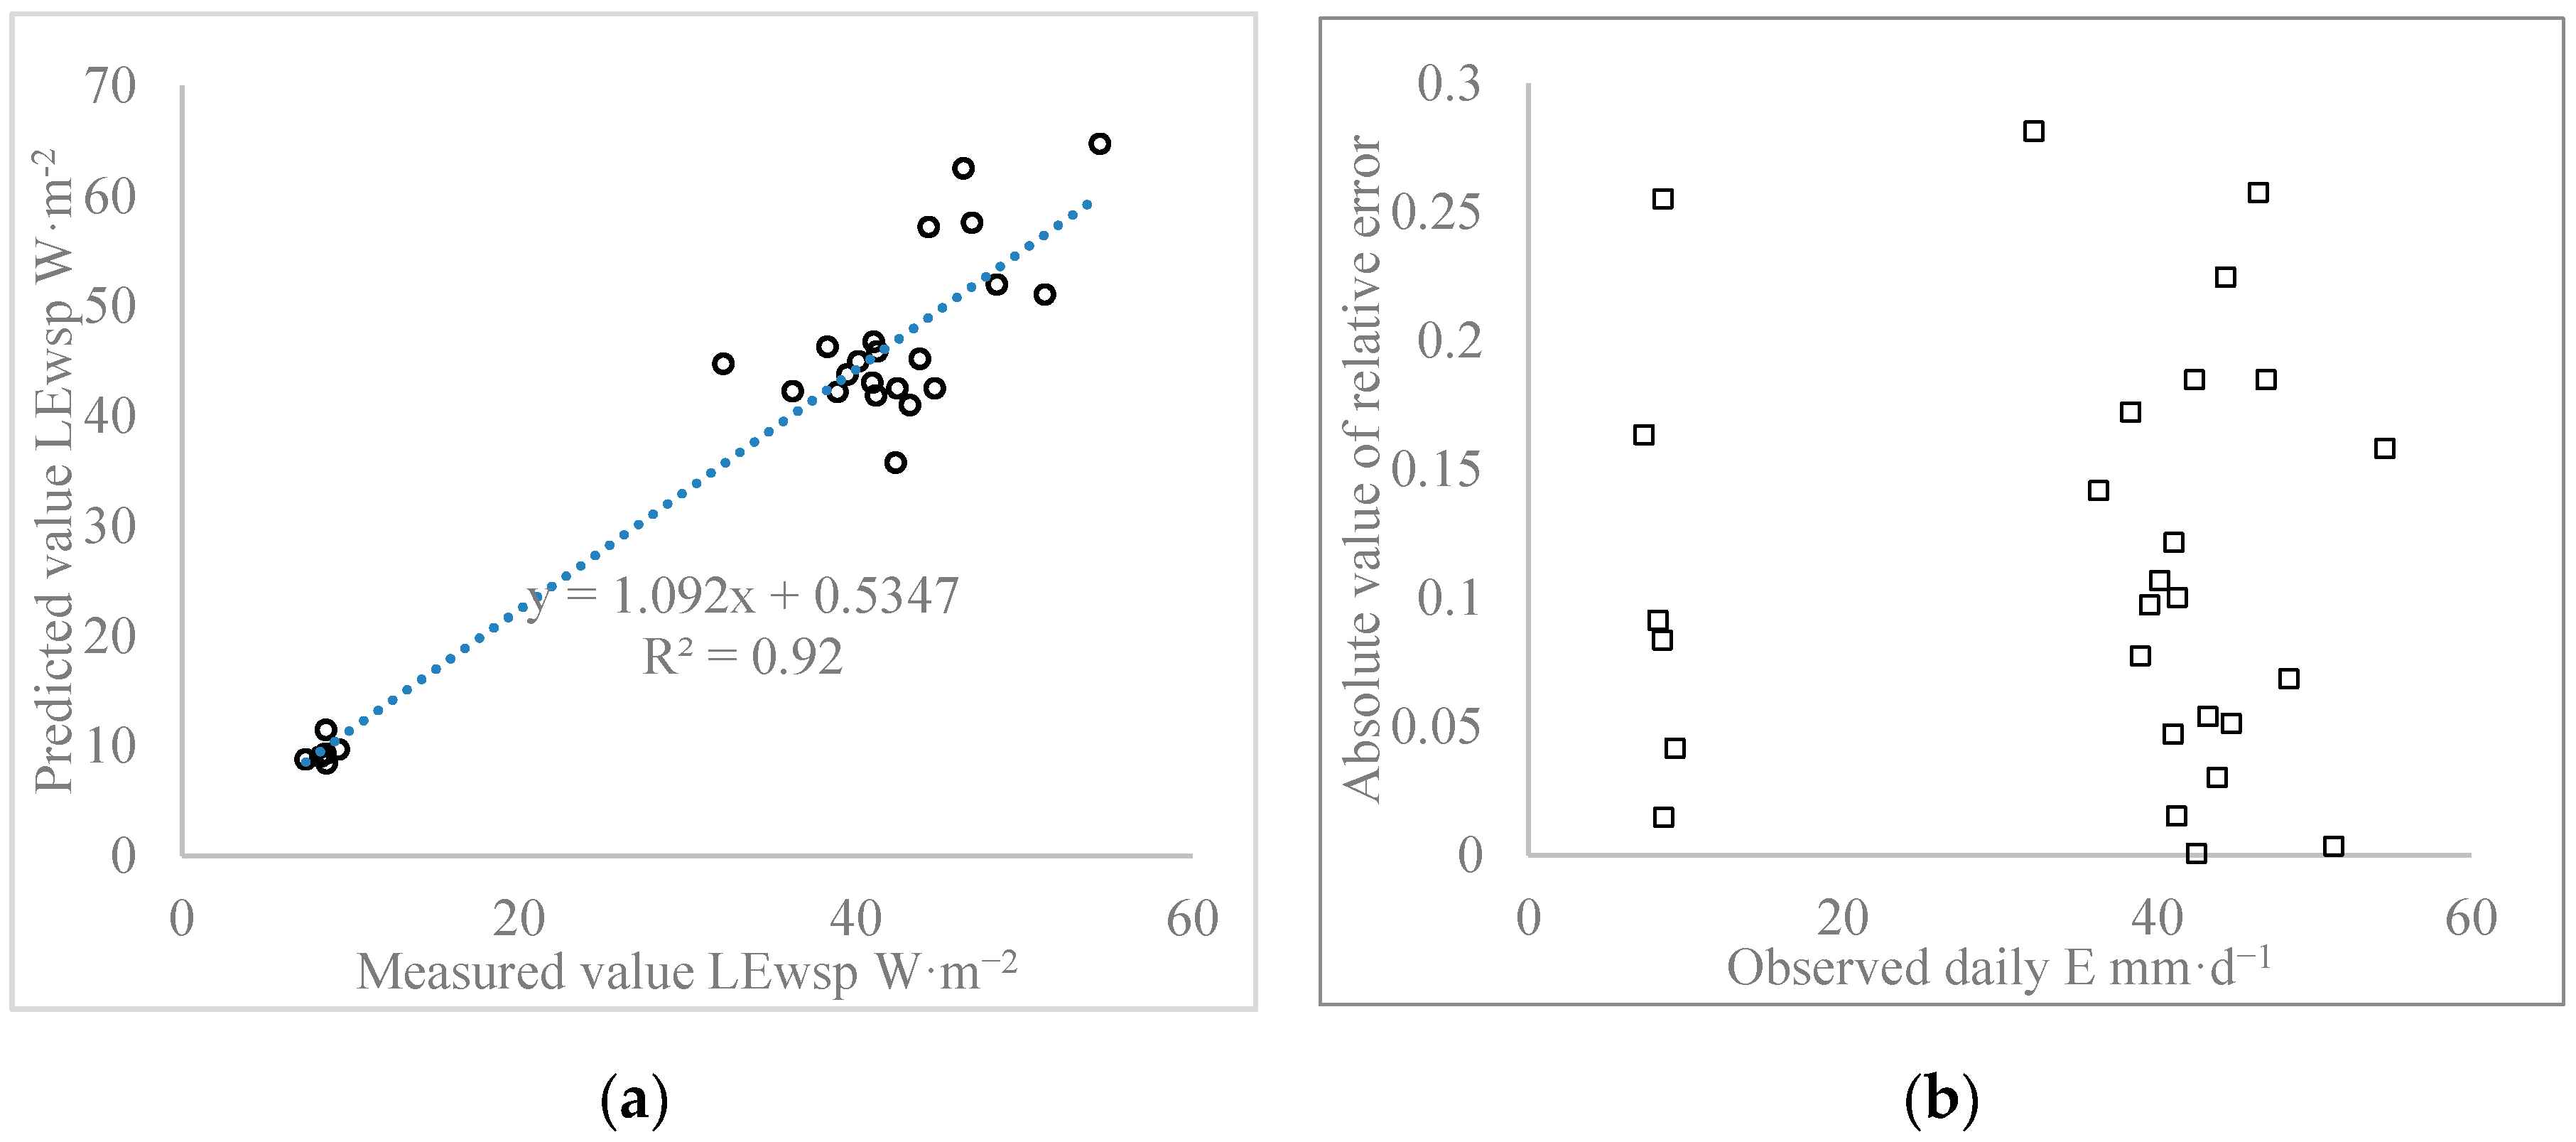
In order to verify the model proposed in the paper, it is essential to verify the experimental data from 24 May to 31 May 2018.
Figure 4 indicates the linear relationship between the predicted and measured values of the orchard soil latent heat flux by the model and the scatter plot of the absolute value of relative error. When the model was used to simulate the orchard soil latent heat flux under WSPI, the slope of the linear equation was 1.092 with a fitting degree of 0.916 and a root mean square error of 6.4801. The absolute value of the relative error was basically less than 20%.
Figure 5 shows the linear relationship between the predicted and measured values of the surface soil latent heat flux . and the pit wall latent heat flux using the model. It can be seen in Figure 5 that the slopes of the linear equation reached 0.95 and 0.98, the fitting degrees were 0.95 and 0.96, and the root mean square error values were 4.75 and 0.75, respectively.
4. Discussion
4.1. Comparison of Different Soil Resistance Models under WSPI
The calculation of soil surface resistance is generally based on an empirical formula, a semi-empirical formula, or the perspective of physics. Some of the most common formulas with high precision can be found in Table 5.
The linear relationship between the predicted and measured values of and by using the different soil surface resistance models in Table 5 is shown in Figure 6. Using the , , and models to simulate , the slopes of the linear equation reached 0.26, 0.74, and 0.95, respectively, the fitting degrees reached 0.73, 0.91, and 0.95, respectively, the root mean square error values reached 28.51, 14.35, and 4.75, respectively, and the Nash-Sutcliffe efficiency reached −1.02, 0.49, and 0.94, respectively. Using , , and models to simulate , the slope of the linear equation reached 13.98, 9.20, and 00.98, respectively, the fitting degree reached 0.17, 0.28, and 0.96, respectively, the root mean square error values reached 222.43, 113.65, and 0.75, respectively, and the Nash-Sutcliffe efficiency reached −3629.14, −946.769, and 0.96, respectively.
The above analysis shows that there is little difference between the model and other commonly empirical formulas calculating the surface soil latent heat flux, while a substantial difference exists between the model and the common empirical formulas calculating the pit wall latent heat flux. The reason for this is that pit wall evaporation is obviously inhibitory and affected by the air relative humidity of the pit. Moreover, the absolute value of the partial correlation coefficient of is higher than the absolute value of the partial correlation coefficient of to . Therefore, is proposed for the special small environment in the water storage pit, and reveals the evaporation mechanism of the pit wall from the microscopic point of view.
4.2. Effects of Three Experimental Treatments on Soil Evaporation under WSPI
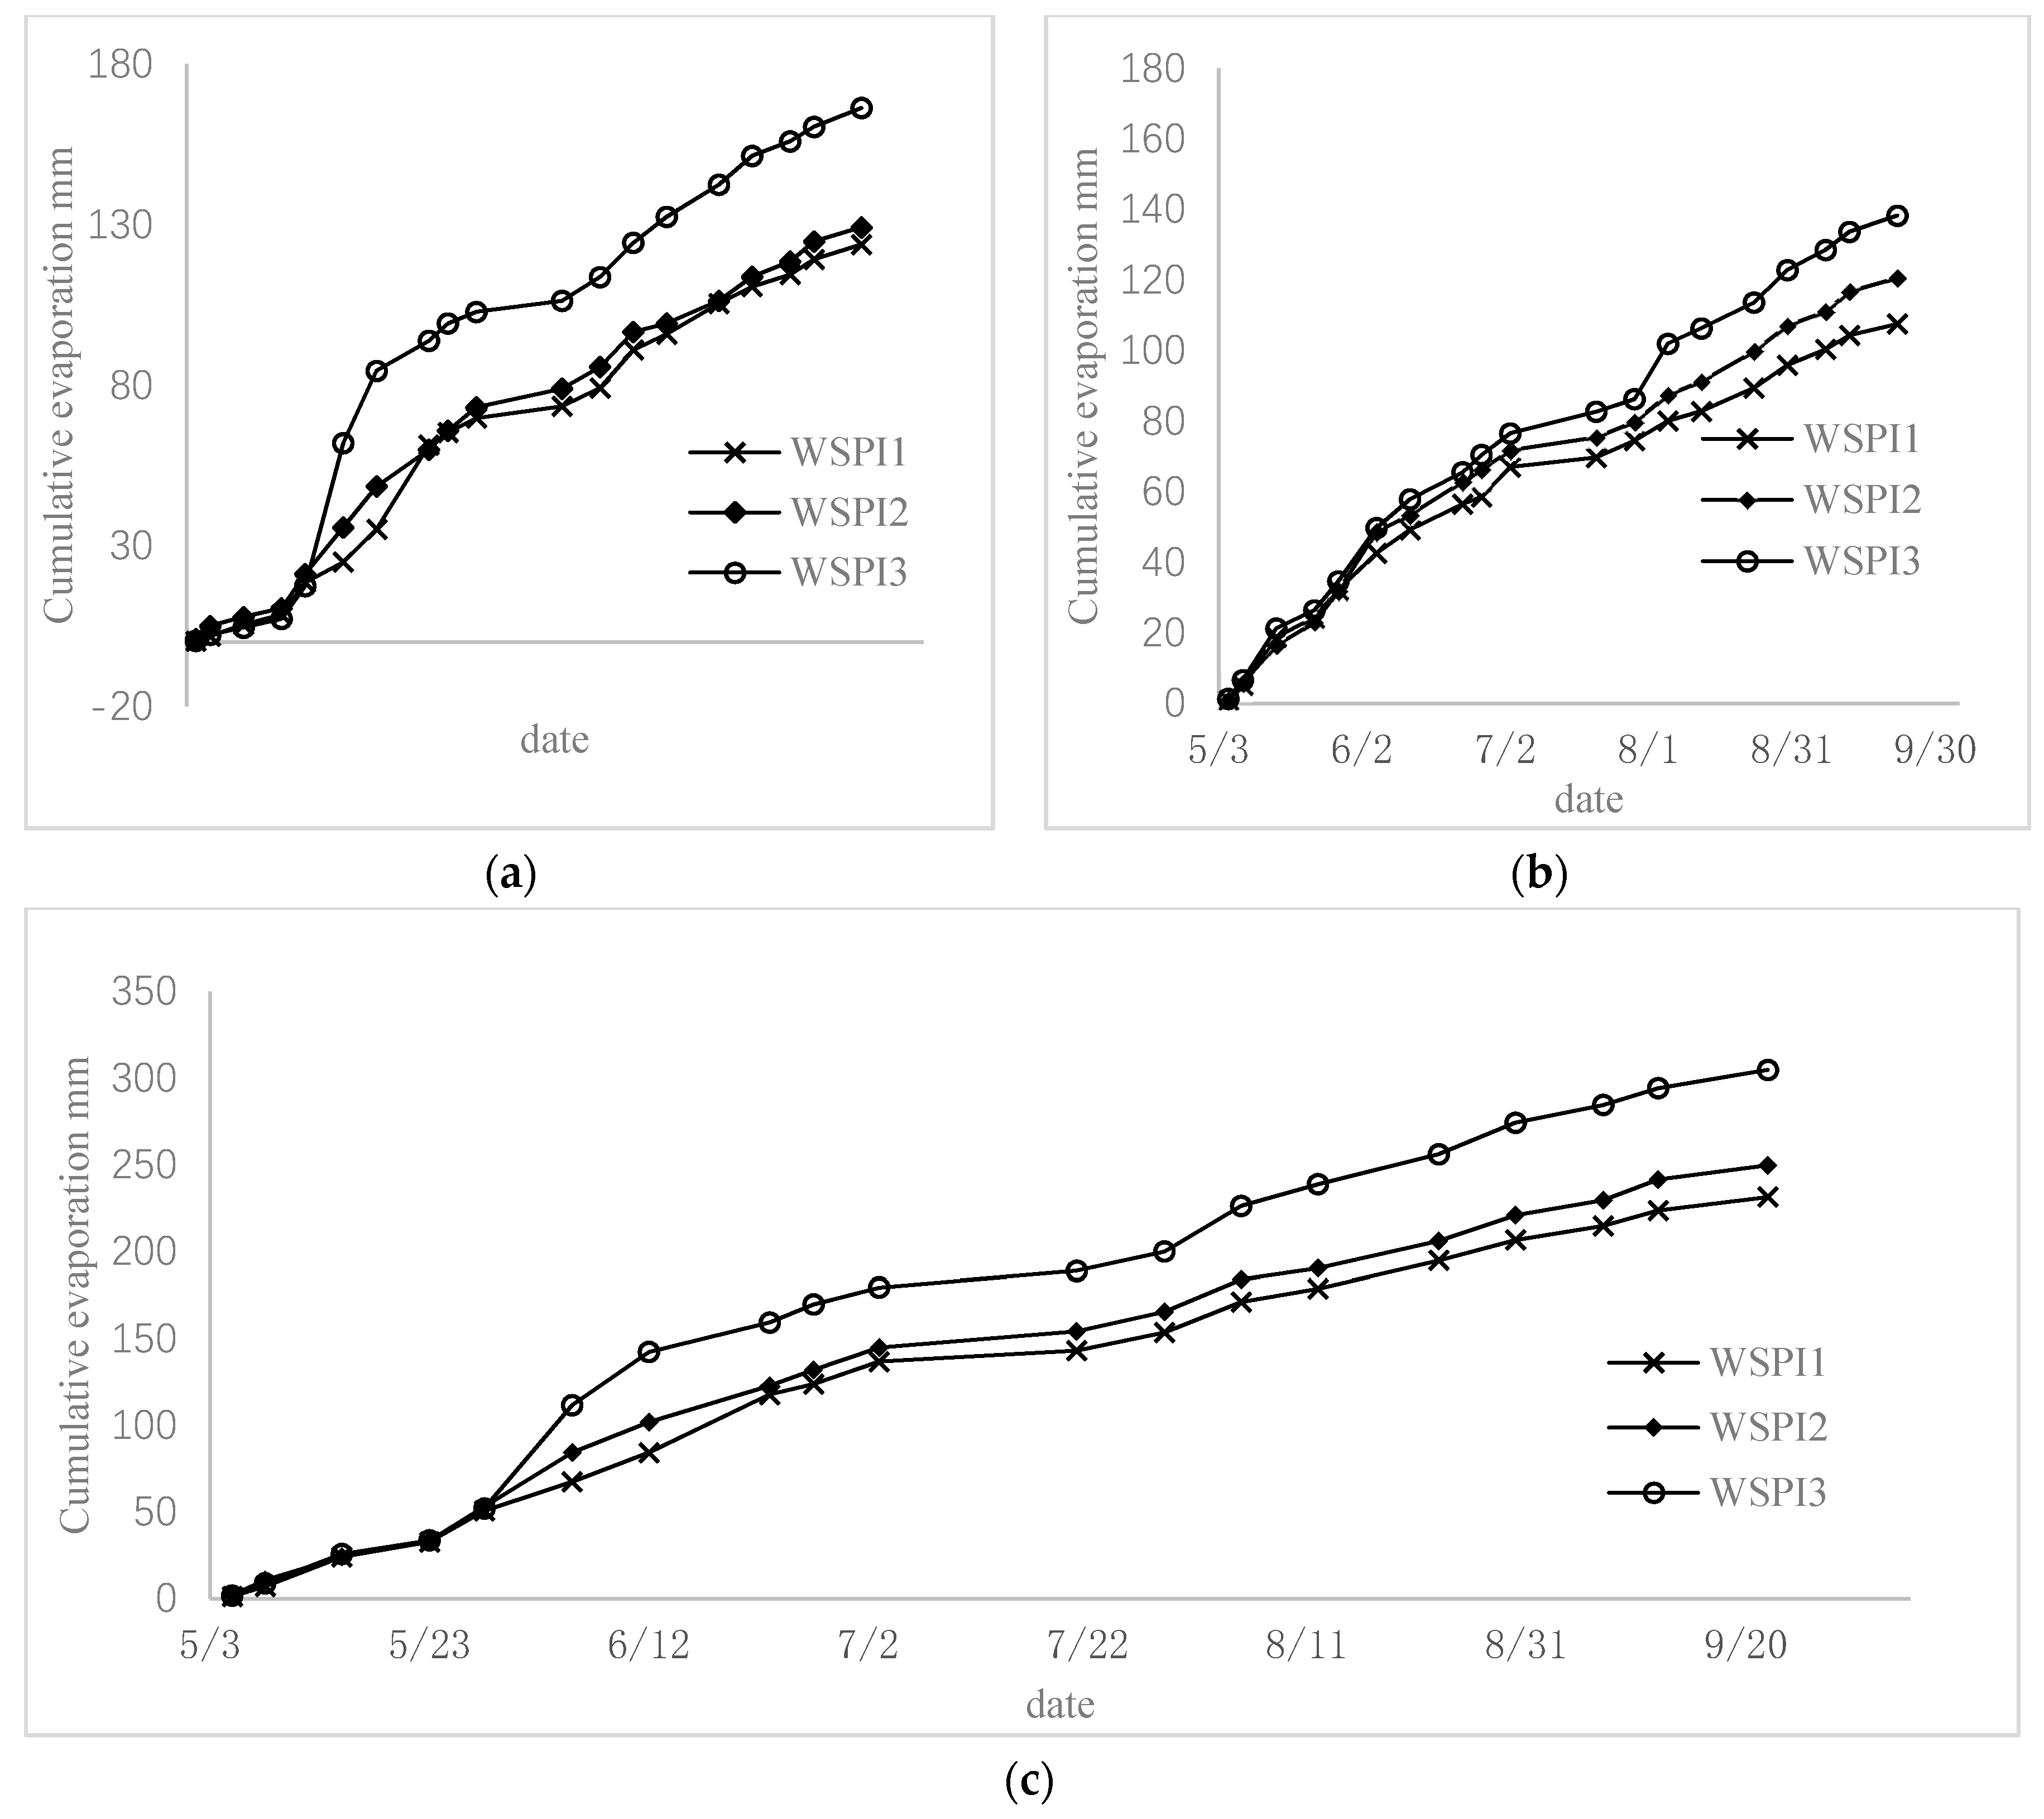
Using the soil evaporation data of the WSPI orchard in 2018, the cumulative evaporation of the surface soil, the pit wall, and the total soil were calculated under different irrigation treatments. It can be seen in Figure 7 that the relationship of the cumulative evaporation of surface soil under three different irrigation treatments is WSPI1 < WSPI2 < WSPI3; the relationship of the cumulative evaporation of pit wall soil under three different irrigation treatments is WSPI1 < WSPI2 < WSPI3; the relationship of the cumulative evaporation of total soil under three different irrigation treatments is WSPI1 < WSPI2 < WSPI3. It can be seen that soil water content is one of the important factors affecting soil evaporation, and soil evaporation increases with soil water content. Under the three different irrigation treatments, the soil evaporation of the surface was greater than that of the pits, and the surface evaporation of WSPI1, WSPI2, and WSPI3 was greater than that of the pits by 15.10%, 7.15%, and 20.27%, respectively. The surface soil moisture content is low, so the surface soil evaporation is small; at the same time the area of the water storage pit is small, and the micro-climate environment with high humidity and low wind speed in the pits, so the evaporation of pits is relatively small. In summary, it is the reason for water saving in the WSPI orchard.
5. Conclusions
Considering the WSPI effect on the orchard soil evaporation under the WSPI condition, the pit irrigation coefficient was defined to reach the goal of precise calculation in relation to the two types of orchard soil evaporation under WSPI. In this paper, the pit irrigation coefficient and the energy balance equation were used to establish the model for WSPI, whose variables were easily obtained, and the precision was high. Therefore, it is recommended that the model is applied when it comes to quantitatively predicting orchard soil evaporation under WSPI conditions.
From the microscopic perspective of analyzing the orchard evaporation mechanism of WSPI, this paper employed multiple stepwise regression analysis between the soil surface resistances of WSPI (including and ) and the influencing factors. . and . were the significant factors of (p < 0.05). , , and . were the significant factors of . (p < 0.05). The . model was then established. When the . model was used to calculate and , the 4.7502 and 0.7546, respectively. The aerodynamic resistance in the pit was neglected during the calculation period, so the model needs to be further refined to improve its precision in future research.
Author Contributions
W.M. and L.Z. conceived and designed the experiments; W.M. performed the experiments, analyzed the data and wrote the paper; X.S. and X.G. reviewed the manuscript and made helpful suggestions; J.M. contributed materials tools.
Acknowledgments
The research was supported by the National Natural Science Foundation of China (51579168), The research was supported by the National Natural Science Foundation of China (U1803112), Shanxi Provincial Key Research and Development Program (201703D211002-7-5).
Conflicts of Interest
The authors declare no conflict of interest.
References
- Wilcox, B.P.; Breshears, D.D.; Seyfried, M.S. Water Balance on Rangelands; Encyclopedia of Water Science: New York, NY, USA, 2003; pp. 791–794. [Google Scholar]
- Kool, D.; Ben-Gal, A.; Agam, N.; Šimůnek, J.; Heitman, J.L.; Sauer, T.J.; Lazarovitch, N. Spatial and diurnal below canopy evaporation in a desert vineyard: Measurements and modeling. Water Resour. Res. 2014, 50, 7035–7049. [Google Scholar] [CrossRef] [Green Version]
- Ding, R.S.; Kang, S.Z.; Zhang, Y.Q.; Hao, X.M.; Tong, L.; Du, T.S. Partitioning evapotranspiration into soil evaporation and transpiration using a modified dual crop coefficient model in irrigated maize field with ground-mulching. Agric. Water Manag. 2013, 127, 85–96. [Google Scholar] [CrossRef]
- Sun, X.H. Effect of Water Storage Pit Irrigation on Soil and Water Conservation; Tsinghua University Press: Beijing, China, 2002; pp. 367–369. [Google Scholar]
- Zhao, Y.G.; Ma, J.J.; Sun, X.H.; Guo, X.H. Spatial Distribution of Soil Moisture and Fine Roots of Apple Trees under Water Storage Pit Irrigation. J. Irrig. Drain Eng. 2014, 140, 06013001. [Google Scholar] [CrossRef]
- Guo, X.H. Research on Water Transport in SPAC System of Orchard under Water Storage Pit Irrigation. Ph.D. Thesis, Taiyuan University of Technology, Taiyuan, China, 2010. (In Chinese). [Google Scholar]
- Guo, X.H.; Sun, X.H.; Ma, J.J. Numerical simulation of three dimensional soil water content distribution in water storage pit irrigation. Fresenius Environ. Bull. 2018, 27, 7390–7400. [Google Scholar]
- Van de Griend, A.A. Bare soil surface resistance to evaporation by vapor diffusion under semiarid conditions. Water Resour. Res. 1994, 30, 181–188. [Google Scholar] [CrossRef]
- Zhang, B.Z.; Kang, S.Z.; Li, F.S.; Zhang, L. Comparison of three evapotranspiration models to Bowen ratio-energy balance method for a vineyard in an arid desert region of northwest China. Agric. For. Meteorol. 2008, 148, 1629–1640. [Google Scholar] [CrossRef]
- Slatyer, R.O.; Mcllroy, I.C. Practical Microclimatology. Plant Ind. Div. Canberra 1961, 328, 310. [Google Scholar]
- Monteith, J.L. Evaporation and Environment. Symp. Soc. Exp. Biol. 1965, 19, 205–234. [Google Scholar]
- Fuchs, M.; Tanner, C.B. Evaporation from a Drying Soil. J. Appl. Meteorol. 1967, 6, 852–857. [Google Scholar] [CrossRef] [Green Version]
- Sun, S.F. Moisture and Heat Transport in a Soil Layer Forced by Atmospheric Conditions. Master’s Thesis, University of Connecticut, Storrs, CT, USA, 1982. [Google Scholar]
- Yang, B.; Wang, P.Y.; You, D.B.; Liu, W.J. Coupling evapotranspiration partitioning with root water uptake to identify the water consumption characteristics of winter wheat: A case study in the North China Plain. Agric. For. Meteorol. 2018, 259, 296–304. [Google Scholar] [CrossRef]
- Camillo, P.J.; Gurney, R.J. A resistance parameter for bare soil evaporation model. Soil Sci. 1986, 141, 95–106. [Google Scholar] [CrossRef]
- Li, Y.; Kustasb, W.P.; Huanga, C.; Kool, D.; Haghighi, E. Evaluation of soil resistance formulations for estimates of sensible heat flux in a desert vineyard. Agric. For. Meteorol. 2018, 260–261, 255–261. [Google Scholar] [CrossRef]
- Anadranistakisa, M.; Liakatasb, A.; Kerkidesb, P.; Rizosb, S.; Gavanosisb, J.; Poulovassilisb, A. Crop water requirements model tested for crops grown in Green. Agric. Water Manag. 2000, 45, 297–316. [Google Scholar] [CrossRef]
- Park, H.T.; Hattori, S.; Tanaka, T. Development of a numerical model for evaluating the effect of litter layer on evaporation. J. For. Res. JPN 1998, 3, 25–33. [Google Scholar] [CrossRef]
- Qiu, Y.; Xie, Z.; Wang, Y.; Ren, J.; Malhi, S.S. Influence of gravel mulch stratum thickness and gravel grain size on evaporation resistance. J. Hydrol. 2014, 519, 1908–1913. [Google Scholar] [CrossRef]
- Li, Y.; Liu, H.J.; Huang, G.H. Modeling resistance of soil evaporation and soil evaporation under straw mulching. J. Irrig. Drain. Eng. 2015, 1, 98–106. [Google Scholar]
- Haghighi, E.; Or, D. Interactions of bluff-body obstacles with turbulent airflows affecting evaporative fluxes from porous surface. J. Hydrol. 2015, 530, 103–116. [Google Scholar] [CrossRef]
- Haghighi, E.; Or, D. Thermal signatures of turbulent airflows interacting with evaporating thin porous surfaces. Int. J. Heat Mass Transf. 2015, 87, 429–446. [Google Scholar] [CrossRef]
- Poblete-Echeverría, C.; Sepúlveda-Reyes, D.; Ortega-Farías, S. Effect of height and time lag on the estimation of sensible heat flux over a drip-irrigated vineyard using the surface renewal (SR) method across distinct phenological stages. Agric. Water Manag. 2014, 141, 74–83. [Google Scholar] [CrossRef]
- Liu, X.Y.; Xu, J.Z.; Yang, S.H.; Zhang, J.G. Rice evapotranspiration at the field and canopy scales under water-saving irrigation. Meteorol. Atmos. Phys. 2018, 130, 227–240. [Google Scholar] [CrossRef]
- Weng, Q.H.; Firozjaei, M.K.; Kiavarz, M.; Alavipanah, S.K. Normalizing land surface temperature for environmental parameters in mountainous and urban areas of a cold semi-arid climate. Sci. Total Environ. 2019, 650, 515–529. [Google Scholar] [CrossRef]
- Merlin, O.; Chehbouni, A. Different approaches in estimating heat flux using dual angle observations of radiative surface temperature. Int. J. Remote Sens. 2004, 25, 275–289. [Google Scholar] [CrossRef]
- Li, S.; Kang, S.Z.; Zhang, L.; Ortega-Farias, S.; Li, F.S.; Du, T.S.; Tong, L.; Wang, S.F.; Ingman, M.; Guo, W.H. Measuring and modeling maize evapotranspiration under plastic film-mulching condition. J. Hydrol. 2013, 503, 153–168. [Google Scholar] [CrossRef]
- Stannard, D.I. Comparison of Penman–Monteith, Shuttleworth-Wallace, and modified Priestley Taylor evapotranspiration models for wildland vegetation in semiarid rangeland. Water Resour. Res. 1993, 29, 1379–1392. [Google Scholar] [CrossRef]
- Mo, X.; Liu, S.; Lin, Z.; Zhao, W. Simulating temporal and spatial variation of evapotranspiration over the Lushi basin. J. Hydrol. 2004, 285, 125–142. [Google Scholar] [CrossRef]
- Zhou, M.C.; Ishidaira, H.; Hapuarachchi, H.P.; Magome, J.; Kiem, A.S.; Takeuchi, K. Estimating potential evapotranspiration using Shuttleworth–Wallace model and NOAA-AVHRR NDVI data to feed a distributed hydrological model over the Mekong River basin. J. Hydrol. 2006, 327, 151–173. [Google Scholar] [CrossRef]
- Van Bavel, C.H.M.; Hillel, D.I. Calculating potential and actual evaporation from a bare soil surface by simulation of concurrent flow of water and heat. J. Agric. Meteorol. 1976, 17, 453–476. [Google Scholar] [CrossRef]
Figure 1.
Diurnal variation of basic meteorological factors in apple growth season of 2018: (a) Description of net radiation () and precipitation (); (b) Description of air temperature () and wind speed ().
Figure 1.
Diurnal variation of basic meteorological factors in apple growth season of 2018: (a) Description of net radiation () and precipitation (); (b) Description of air temperature () and wind speed ().


Figure 2.
The field experimental layout of the : (a) The layout of measuring points; (b) The layout of water storage pits. ●, ○ and ◎ are the apple tree, moisture measuring tube and micro-lysimeter, respectively.
Figure 2.
The field experimental layout of the : (a) The layout of measuring points; (b) The layout of water storage pits. ●, ○ and ◎ are the apple tree, moisture measuring tube and micro-lysimeter, respectively.

Figure 3.
The linear relationship between the predicted and measured values of latent fluxes under WSPI: (a) ; (b) ; (c) .
Figure 3.
The linear relationship between the predicted and measured values of latent fluxes under WSPI: (a) ; (b) ; (c) .

Figure 4.
(a) The linear relationship between the predicted and measured values of ; (b) Scatter plot between observed daily and absolute value of relative error.
Figure 4.
(a) The linear relationship between the predicted and measured values of ; (b) Scatter plot between observed daily and absolute value of relative error.

Figure 5.
(a) The linear relationship between the predicted and measured values of ; (b) The linear relationship between the predicted and measured values of .
Figure 5.
(a) The linear relationship between the predicted and measured values of ; (b) The linear relationship between the predicted and measured values of .

Figure 6.
(a) The linear relationship between the predicted and measured values of by the model; (b) The linear relationship between the predicted and measured values of by the model.
Figure 6.
(a) The linear relationship between the predicted and measured values of by the model; (b) The linear relationship between the predicted and measured values of by the model.

Figure 7.
(a) Cumulative evaporation of surface soil under different irrigation treatments; (b) Cumulative evaporation of soil in water storage pits under different irrigation treatments; (c) Total cumulated evaporation of soil under WSPI by different irrigation treatments.
Figure 7.
(a) Cumulative evaporation of surface soil under different irrigation treatments; (b) Cumulative evaporation of soil in water storage pits under different irrigation treatments; (c) Total cumulated evaporation of soil under WSPI by different irrigation treatments.


Table 1.
Physical Parameters of Experimental Soil.
| Depth (cm) | Field Capacity (cm3·cm−3) | Saturated Water Content (cm3·cm−3) | Soil Bulk Density (g·cm−3) | Soil Texture |
|---|---|---|---|---|
| 0–30 | 0.3 | 0.51 | 1.49 | sandy loam |
| 30–70 | 0.28 | 0.52 | 1.44 | sandy loam |
| 70–120 | 0.29 | 0.44 | 1.50 | sandy loam |
| 120–170 | 0.32 | 0.5 | 1.51 | Loam |
| 170–200 | 0.3 | 0.52 | 1.45 | Loam |
Table 2.
Irrigation date and total amount of water applied under water storage pit irrigation (WSPI) conditions (L).
Table 2.
Irrigation date and total amount of water applied under water storage pit irrigation (WSPI) conditions (L).
| Growth Season | Irrigation Dates | Treatments | ||
|---|---|---|---|---|
| WSPI 1 | WSPI 2 | WSPI 3 | ||
| germination stage | 05.04 | 320 | 320 | 320 |
| branch shooting stage | 05.15 | 320 | ||
| 05.28 | 320 | 320 | ||
| 06.12 | 320 | |||
| 06.23 | 320 | 320 | ||
| 07.02 | 320 | |||
| fruit expanding stage | 07.28 | 320 | 320 | |
| 08.23 | 320 | 320 | ||
| 09.12 | 320 | 320 | ||
| Total irrigation amount | 960 | 1600 | 2560 | |
Table 3.
Results of root mean square error (RMSE) and Nash-Sutcliffe efficiency (NSE) when simulating , and .
Table 3.
Results of root mean square error (RMSE) and Nash-Sutcliffe efficiency (NSE) when simulating , and .
| RMSE | 6.58 | 1.00 | 7.98 |
| NSE | 0.93 | 0.92 | 0.81 |
Table 4.
Results of multiple stepwise regression analysis between soil surface resistance ( and ) and significant factors in apple season of 2018.
Table 4.
Results of multiple stepwise regression analysis between soil surface resistance ( and ) and significant factors in apple season of 2018.
| Dependent Variable | Independent Variable | Standardized Regression Coefficients | t Statistical Value | Probability Value | Partial Correlation Coefficient | F Statistical Value | Significant of F | Multiple Correlation Coefficient |
|---|---|---|---|---|---|---|---|---|
| (Constant) | 14.505 | <0.001 | 127.237 | <0.001 | 0.833 | |||
| −0.825 | −11.931 | <0.001 | −0.858 | |||||
| 0.143 | 2.072 | 0.043 | 0.279 | |||||
| (Constant) | −6.741 | <0.001 | 148.458 | <0.001 | 0.899 | |||
| 0.763 | 14.028 | <0.001 | 0.893 | |||||
| −0.259 | −4.743 | <0.001 | −0.557 | |||||
| 0.146 | 3.241 | 0.002 | 0.417 |
Table 5.
The types and sources of Soil surface resistance models.
| Model | Source |
|---|---|
| Camillo [15] | |
| Zhang et al. [16,17] | |
| This study |
Notes: 1 is the soil water content at 0–3 cm of the surface layer, is the surface layer saturated soil water content e (taking 50%), is the surface layer field capacity (taking 30%), is the soil surface resistance, when the soil water content reaches to , this paper takes 100 [15].
© 2019 by the authors. Licensee MDPI, Basel, Switzerland. This article is an open access article distributed under the terms and conditions of the Creative Commons Attribution (CC BY) license (http://creativecommons.org/licenses/by/4.0/).
Share and Cite
MDPI and ACS Style
Meng, W.; Sun, X.; Ma, J.; Guo, X.; Zheng, L. Evaporation and Soil Surface Resistance of the Water Storage Pit Irrigation Trees in the Loess Plateau. Water 2019, 11, 648. https://doi.org/10.3390/w11040648
AMA Style
Meng W, Sun X, Ma J, Guo X, Zheng L. Evaporation and Soil Surface Resistance of the Water Storage Pit Irrigation Trees in the Loess Plateau. Water. 2019; 11(4):648. https://doi.org/10.3390/w11040648
Chicago/Turabian StyleMeng, Wei, Xihuan Sun, Juanjuan Ma, Xianghong Guo, and Lijian Zheng. 2019. "Evaporation and Soil Surface Resistance of the Water Storage Pit Irrigation Trees in the Loess Plateau" Water 11, no. 4: 648. https://doi.org/10.3390/w11040648
Note that from the first issue of 2016, this journal uses article numbers instead of page numbers. See further details here.