1. Introduction
The Alps, in which most of the major European rivers (e.g., the Danube, the Rhine, the Po, and the Rhone) have their headwaters, are crucial for water accumulation and freshwater supply for large parts of Europe. For this reason, they are often defined as the natural “water towers” of Europe [
1]. Mountain regions have a significant hydrological importance also because their freshwater plays an important role in the preservation of many natural habitats, both in the Alps and in the lowlands, and therefore, careful management of these natural resources should have the highest priority [
2].
However, for flood protection purposes and hydropower (HP) generation, different types of adaptations to human needs affect natural watercourses in the great part of the Alpine region, even at high altitudes, thus strongly affecting the aquatic ecosystem’s status and biodiversity [
3].
In particular, HP generation has always been very important in the Alps in meeting energy needs, due to the typical characteristics of the area, i.e., steep slopes in combination with high water availability in rivers [
3]. During the 20th century, hydropower capacity has further increased in the Alpine region, where more than 90% of electricity production is generated by water power and several strategies to reduce greenhouse gases emissions are based on the intensification of hydroelectricity production [
4]. Besides, apart from large HP plants and reservoirs, which allow for the accumulation of energy, thousands of smaller schemes are also present in the Alps [
3].
Therefore, despite the important role of hydropower for alpine countries, significant changes in the natural environment and severe negative pressures on the ecological status of river systems have been generated. For example, interruptions of the river continuity, changes in river morphology, hydro-peaking, variation of flow and temperature regime, and alterations in the transport of sediments are responsible for the degradation of habitats, leading to a considerable loss of biodiversity, and the transformation of characteristic landscapes and natural sceneries [
5]. Hence, over the last decades, different approaches aiming at reducing the negative effects of HP generation have been developed and river stretches which are still largely in a natural state have been more attentively considered by stakeholders and decision makers, since they have become increasingly rare in the alpine space [
3,
6].
Due to water resources’ scarcity and to the presence of several water users with different (often contrasting) stakes, water-use conflicts have increased, resulting mainly from abstraction for agricultural irrigation and HP generation, water dams, recreational activities, or the preservation of ecological and environmental aspects [
3].
The risk caused by the large number of water abstractions and water-use conflicts is to expose the environmental component to the resulting negative externalities, in particular in a context, like the mountain regions in the Alps, in which the indicators required by the European legislation, i.e., the Water Framework Directive (WFD) [
7], are not fully suitable to quantify the impacts of water abstractions on watercourses, as demonstrated by different local studies and literature reviews [
8]. Besides, as required by a Guidance Document of the European Commission [
9], using only biological methods, not considerably sensitive to hydrological alterations, for the classification of watercourses affected by important hydrological pressures may overestimate their ecological status, in opposition to the WFD requirements. Thus, each member state should provide suitable methods, “more sensitive to hydrological pressures, taking into account the relationship between hydrology, morphology and the biological impacts” [
9].
For these reasons, adaptation measures, tailored to specific regional vulnerabilities, should be identified in a collaborative and participatory framework, involving local stakeholders in discussions and decision-making processes for water management and water-use conflicts resolution in the Alps [
10,
11].
Recently, multicriteria analysis (MCA) methods have been frequently applied to support decision-making problems concerning water resource management. These techniques, in fact, have the potential to improve the transparency, auditability, and analytic rigor of decisions guided by multiple, conflicting objectives, measured in different units, as in the case of water policy [
12]. Besides, this kind of decision support system can be used to improve the definition, understanding, and evaluation of innovative alternatives, supporting the identification of a solution for the complex problems and conflicts involved in regional water resource planning [
13].
In Aosta Valley, one of the most important Italian regions for HP production, an experimental approach for the assessment of water withdrawals based on the application of MCA has been recently developed. The region is situated in the North-West of Italy, in the middle of the Alps, and it is characterized by a completely mountainous territory, crossed by Dora Baltea River, one of the major tributaries of the Po River, with average annual contributions equal to 110 m
3/s (
Figure 1). In the last century, river exploitation has strongly increased, supporting economic growth and urban expansion, but eroding the ecological assets of watercourses.
The regional River Strategic Plan (Piano di Tutela delle Acque—PTA) approved in 2006 [
14] provided for the possibility to define the minimum instream flow (MIF) to be released by withdrawals through an experimental approach based on MCA, instead of using a hydrological formulation. Recently, this kind of decision-making process, which involves all the main concerned stakeholders to assess the compatibility of water diversions with environmental conditions, has been tested to several case studies. The “environment” criterion, used in the MCA, was based on “WFD derived” biological indicators. However, although biology in general is strongly affected by hydro-morphological pressures, most of the WFD methods developed for the assessment of biological quality elements either are largely insensitive to main hydrological alterations (see e.g., [
15,
16,
17]) or respond to many different pressures whose respective contribution may be difficult to apportion. As an example, the WFD indicator measuring the alteration of fish community composition can be linked to a hydromorphological alteration, but also to massive restocking, angling, or the introduction of alien species [
9]. On the other hand, the application of the MesoHABSIM (Mesohabitat Simulation Model) methodology [
18,
19] to quantify the effects of withdrawals on river ecosystems allows the above limitations to be overcome. The MesoHABSIM model has been implemented in Italy and currently it is proposed by the Italian High Institute for Environmental Protection and Research (ISPRA, Istituto Superiore per la Protezione e Ricerca Ambientale) as a reference to evaluate and model aquatic habitat in rivers. This meso-scale habitat model quantifies fish habitat availability according to the flow rate and local morphological conditions of the river and therefore, the MesoHABSIM derived indicators could be used within the MCA for the “environment” criterion, replacing the “WFD derived” ones.
The aim of this study is to (i) identify a methodological approach to include MesoHABSIM into the MCA framework; (ii) preliminarily test the resulting MCA procedure within a simple case study (single HP plant), evaluating its robustness; and (iii) assess the involved stakeholders’ feedback and the procedure applicability to other types of water withdrawals.
Therefore, in this paper, we define and discuss an innovative methodological approach aimed at including the meso-habitat modeling into the MCA framework used in Aosta Valley region to support the decision-making process for the overall assessment of water withdrawal sustainability. In particular, we focused on the replacement of the WFD derived biological indicators with MesoHABSIM based indexes, related to watercourse discharge and morphology, that allow quantification of the impacts of withdrawals on river ecosystems and fish communities.
Besides, in order to analyze the concrete applicability of this innovative methodological approach, the procedure robustness carried out during the first implementation within a single HP plant case study is assessed and discussed. In addition, the feedback obtained from stakeholders involved in previous and recent experimentations are analyzed to check their satisfaction for the improved procedure, and current applications to a wide range of different water withdrawals, in both ex ante and ex post scenarios, are briefly described.
2. Materials and Methods
This section is organized in five parts.
Section 2.1 and
Section 2.2 describe the key features of the MCA (with a specific focus on the simple additive weighting (SAW)) and of the MesoHABSIM methodologies. In
Section 2.3, the existing MCA procedure used in Aosta Valley region is described, outlining related criteria, indicators, and the initial decisional tree. This represents the starting point over which, during the study, the new methodological approach aimed at including MesoHABSIM into the MCA framework was designed and developed. Finally, in
Section 2.4 and
Section 2.5, the methods used to analyze the robustness of the new MCA procedure and the stakeholders’ response during each case study are described.
2.1. The MesoHABSIM Methodology
The use of a spatial unit of a physical habitat suitable for a fish population is an accurate tool for designing ecosystem restoration actions and instream habitat management in applications, like hydropower and water withdrawals mitigation [
19]. Thus, modeling the spatio-temporal variation of physical habitat characteristics (e.g., water depth, flow velocity distribution, substrate composition, channel geometry, and cover attributes, etc.) allows for predicting the distribution and abundance of aquatic species, assessing environmental flows, and planning river restoration measures [
20].
In recent years, mesohabitat scale and multivariate habitat suitability models have been increasingly adopted (e.g., MesoHABSIM [
21]), overcoming the traditional habitat models (e.g., PHABSIM—Physical HABitat SImulation Model [
22]), especially for steep streams or watercourses with a complex morphology. In [
23], the official guidelines of MesoHABSIM methodology (Mesohabitat Simulation Model), integrated with the geomorphic units survey and classification system (GUS) [
20] and adapted to the Italian context [
24,
25,
26], are described in detail and proposed to assess spatio-temporal alterations of habitat structure in Italian rivers and streams. The methodology consists of three main procedural steps:
Description of the river habitat: It must be carried out within a representative portion of the river stretch in terms of spatial distribution and relative proportion of typical morphological units [
27]. This reach is divided in different hydromorphological units (HMUs), which define the mesohabitat types [
28] and are characterized by collecting a set of environmental descriptors (e.g., dominate substrate, wetted/bankfull width, depth, velocity, and average slope). Since the habitat available to an organism or a target community changes according to the flow rate variations, it is necessary to repeat the survey for at least four different flow conditions typical of the hydrological regime of the analyzed watercourse [
23].
Application of biological models of habitat suitability: Multivariate statistical models, like random forests (RF) [
29], generated under reference conditions, provide habitat suitability criteria related to the environmental descriptors for different target species and life stages. In mountain watercourses, the biological component is represented by the reference fish community [
25]. By means of RF, each HMU is classified as a “suitable mesohabitat” (probability of presence > 0.5) or “optimal mesohabitat” (probability of abundance > 0.5) [
23]. This classification allows for the total available habitat in the analyzed watercourse section (H
d) to be obtained through the following equation:
where H
I and H
O represent, respectively, the habitat classified as suitable and optimal.
Analysis of the river habitat spatio-temporal variations: Hydromorphological surveys and habitat suitability models are the basis for the development of habitat-flow rating curves, which relate the area of available habitat for each target species (and life stages) with the watercourse flow rate, and of the habitat time series, which represent the variation of available habitat over time. In particular, the available habitat at time, t, (H
d(t)) is calculated through the following equation:
where H is the relationship between the habitat and flow rate for a particular species or life stage, and Q(t) is the flow measured in the watercourse at time, t [
23].
From the habitat time series, two habitat indices are calculated and applied to assess the habitat integrity for fish when anthropogenic pressures are present in the watercourse [
23].
The Index of Spatial Habitat availability (ISH) assesses the average amount of habitat surface loss for a specific species or community as a result of a particular pressure. It is calculated on a yearly basis, for each fish species (and life stage), by comparing the average available area over the period (expressed in m
2) in reference (A
Hd,r) and altered hydromorphological conditions (A
Hd), i.e., with no withdrawals (or upstream of the withdrawal site) and downstream of the withdrawal site (
Figure 2). The ISH value for the entire fish community is given by the minimum value among all the target species (and life stages) present in the considered watercourse section (Equation (3)):
The index of temporal habitat availability (ITH) compares the continuous duration of events of limited habitat availability that generates stress conditions to the fauna in both reference and altered conditions. The duration of stress events is expressed as the number of days in which a value of available habitat (in m
2) stays below a given threshold. The reference habitat threshold (named A
Q97) is set as the amount of habitat corresponding (under unaltered conditions) to Q
97, i.e., the flow value is exceeded 97% of the time (
Figure 2) [
20,
23].
In order to calculate the ITH, habitat time series are statistically analyzed using the uniform continuous-under-threshold (UCUT) curves [
28]. The average distance between the two UCUT curves, representing the cumulative duration of habitat under-threshold events in reference (
) and altered (
) conditions, is used to evaluate the alteration in the duration of stress events for each considered species; the average over the entire under-threshold durations range is the indicator of the Stress Days Alteration (SDA) (Equation (4)):
where d
max,r is the maximum under-threshold duration in the reference conditions (in days).
The ITH for each species (and life stage) is calculated through a negative exponential function (Equation (5)), which transforms the indicator of SDA in the ITH index:
As for the ISH, the ITH value for the entire community is given by the minimum value among all the target species [
20,
23].
Results derived from these two habitat indices’ applications allow for the definition of an indicator that can be used for both hydromorphological and ecological status assessment to be formed, i.e., the index of river habitat integrity (IH).
IH is calculated as the minimum value between the ISH and the ITH (Equation (6)) and its score ranges between 0 and 1, where 0 represents a very high degree of alteration of the watercourse habitat quality, while 1 corresponds to a condition with no hydromorphological alterations, i.e., where the habitat quality is equivalent to the reference condition:
In accordance with the approach used in the WFD, IH is defined in five classes of quality, as shown in
Table 1.
The threshold values defining the separation between the classes were determined through the results of simulations in several case studies for which habitat time series of at least 15 years were available, by observing the natural variability (i.e., under reference conditions) of the two indices of ISH and ITH [
23].
2.2. MCA Methodology
Multicriteria analysis (MCA) refers to a set of techniques that are used mainly to support decision makers, who have to handle a large amount of complex information in a consistent way. The methodology is often used to support water resource decision problems, which are generally characterized by uncertain consequences and complex interactions and involve many different alternatives and criteria, even facilitating the participation of multiple stakeholders with conflicting interests [
30].
The MCA methodology considered in this paper is the simple additive weighting (SAW), also known as the weighted sum method (WSM), a linear additive method described by Hwang and Yoon [
31]. Because of its simplicity, SAW is one of the most known and widely used techniques for multiple attribute decision-making problems, and it is largely applied also for the ranking of water resource management alternatives [
32]. Several studies compared the performance of SAW with other MCA methods, showing that it is a relatively simple technique, whose results are in close agreement with other approaches [
33].
The MCA model is represented by a decision matrix (or evaluation matrix), as shown in
Figure 3. N is the number of the alternatives (A
i), i.e., the different decision options that may contribute to the achievement of the decisional problem’s aims, and M is the number of criteria (C
j), i.e., the elements in terms of which the alternatives are evaluated. Besides, each element, x
ij, of the decision matrix represents the score of an alternative, A
i, when it is evaluated in terms of criterion C
j, i.e., it indicates how well the alternative A
i meets the criterion C
j [
34]. The decision matrix can contain both qualitative and quantitative data, which can be derived from expert judgements or from the application of different specific models [
12].
The relative importance of each criterion is usually given in a one-dimensional vector of weights,
W, containing M weights: w
j denotes the weight assigned to the jth criterion on the basis of stakeholders’ or decision makers’ assessments. Generally, a higher weight denotes a more important criterion [
12].
In the SAW methodology, after a normalization procedure that transforms each element, x
ij, of the decision matrix in a dimensionless value, r
ij, ranging between 0 and 1, alternatives are ranked on the basis of their weighted sum performance [
35]. Mathematically, the final performance of each alternative is calculated through the following equation:
where U
i is the final ranking performance of the ith alternative; w
j denotes the weight assigned to the jth criterion; r
ij is the normalized score of the ith alternative with respect to the jth criterion; and M is the number of criteria [
32]. The weights are usually normalized, i.e., the total value of all the criteria weights is set to 1 (
) [
33]. Besides, all the units should have the same preference direction, maximization, or minimization. For example, if all the criteria represent benefits (maximization problem), 1 represents the best score for each criterion and a higher resulting final performance, U
i, corresponds to a better alternative [
34].
In several decision-making problems, criteria are split in different sub-criteria, or indicators, to convey more specific information. In this case, the scores are assigned based on indicators (and not criteria) and weights should be allocated by stakeholders or decision makers to both criteria and indicators, with the weights of indicators also associated to the same criterion normalized (i.e., inside each group of indicators, the sum of weights should be equal to 1). Therefore, the same approach described before for the SAW methodology application and represented by Equation (7) can be followed, just considering that the elements, xij, of the decision matrix and the normalized scores, rij, are referred to indicators instead of to criteria, M is the total number of indicators, and the final weight, wj, associated to each indicator is obtained by multiplying its weight and the weight of the corresponding criterion.
After obtaining a first ranking of the alternatives, an essential step of MCA is the performance of some sensitivity analyses, through the variation of the model parameters (in particular the weights, but also, for example, the scores measurement), in order to test the robustness of results, according to input assumptions [
12].
In conclusion, a final decision should be made, based on the information acquired through the MCA process. In fact, the aim of MCA is not to identify unequivocally the final decision, but to highlight the relations among the different elements of the problem, giving information to the involved actors to support their final judgment [
36].
2.3. MCA Application in Aosta Valley
To comply with the requirements of the European Water Framework Directive [
7] and of national laws about the maintenance of the hydraulic and ecological continuity of rivers, Aosta Valley River Strategic Plan (Piano di Tutela delle Acque—PTA) mainly requires the release of a minimum instream flow (MIF) for any regional HP withdrawal, quantified through a simple hydrological formulation or through an experimental approach (hereafter named “experimentation”) based on the application of MCA, in order to assess the compatibility of HP diversions with the environmental conditions of the watercourse. More recently, the approach is used to define the “ecological flows”, i.e., the “amount of water required for the aquatic ecosystem to continue to thrive and provide the services we rely upon” [
9]: This concept includes, in addition to the MIF, also the variation of flow over time [
3].
The experimentation process has to be based on the collaboration among different stakeholders, who are involved since the beginning of the method implementation, in an attempt to apply a more participatory decisional approach and to try to support at best the interests of different water users. The identification and involvement of key institutional stakeholders is the first step: The Regional Water Authority (Regione Autonoma Valle d’Aosta—Gestione Demanio Idrico), the institution coordinating the decision-making process, organizes a “Technical Assessment Board” (TAB) inviting the representatives of the main concerned water users. Afterwards, a hydrological monitoring program is defined by the TAB, to be implemented by the HP company over the entire experimentation period in order to provide a reliable and updated flow data series to be used within the MCA (at least 5 years of data are normally required). For this reason, the installation of a continuous monitoring system at the HP dam is usually required by the applicant: Hydraulic devices will also support direct controls carried out by the Regional Water Authority to verify the withdrawal compliance with the future water license. Besides, environmental quality indexes also required by the European WFD [
7] are monitored over the experimentation period in the affected watercourse, in order to at least ensure a good ecological status downstream of the HP plant.
After this preparatory phase, the process requires the definition of management alternatives and the identification of suitable criteria and indicators. The alternatives typically correspond to different scenarios of flow release from the HP dam. Alternatives defined at the beginning of the process generally include the “reference alternative” (i.e., when there are no management differences compared to the present situation) and several release scenarios specifically proposed by a single TAB member and oriented at the maximization of each stakeholder’s interests.
Subsequently, the indicators’ scores are calculated, each one according to its specific elaboration method, for each alternative, and they are uploaded in the decision matrix of the software used to implement the SAW technique (SESAMO SHARE software (SHARE Alpine Space Consortium, RSE, Milan, Lombardy, Italy, 2012) [
37]). Besides, a set of weights has to be assigned to the criteria and indicators. In the initial evaluation, the weights are equally distributed among the criteria, in order to have a first overall assessment of the system. Indicators’ weights, on the contrary, are usually allocated by the TAB members. The software directly calculates the normalized indicators’ scores, through the corresponding utility functions, and the weighted values, considering both the weights of indicators and of the corresponding criteria. Thus, the final performance of each scenario is calculated by means of Equation (7) and a first ranking of alternatives is obtained. Therefore, starting from the results obtained through the MCA application, TAB members are involved in several sensitivity analyses (see
Section 2.4) and, later, in deepening and refining existing flow release alternatives through the SAW process to assess further halfway scenarios to be finally adopted. Afterwards, a final set of weights is defined for criteria, agreed upon by all the TAB members, taking into account the opinions of the different stakeholders and selecting weights that can be explained to external observers and policy makers. Finally, the winning alternative represents the best mediation scenario, agreed upon among all the involved stakeholders and supporting the stakes of the different concerned actors. This alternative is thus officially approved by the regional government, ratifying the TAB results, and it is implemented by the applicant.
Overall, if no discharge data are available before the beginning of the experimentation, the decision-making process requires a minimum of 5 years to collect a reliable series of flow rate data. During this period, TAB members are actively involved in the whole MCA procedure, taking part in meetings, discussions, and continuous improvements of the approach (e.g., the indicators’ elaboration and refinement, or the weighting procedure). Moreover, flow rate monitoring should also continue after the decision-making (for a total of at least 15 years [
38]) and, if there are significant changes in the hydrological regime, the ecological flow values should be redefined through the analysis of discharge data.
Criteria and Indicators: The Initial Decisional Tree
Five criteria were initially considered in Aosta Valley since the first experimentations were carried out to assess the sustainability of HP diversions (i.e., energy, environment, fishing, landscape, and economy), corresponding to the main stakeholders concerned by water withdrawal in the region and each representing the key interests of a different water user.
In
Figure 4, the decisional tree initially considered in Aosta Valley is shown. It is the schematic structure in which the MCA elements are hierarchically organized to fully describe and to facilitate an understanding of the decision-making problem: Criteria and indicators represent the “branches” and the “leaves” of the MCA tree, respectively [
39]. In the figure, next to each criterion, the corresponding stakeholders are indicated.
Figure 4 shows the set of indicators elaborated and successively adopted in the first MCA applications in Aosta Valley (i.e., since 2009).
In particular, the indicator of “energy index”, associated to the energy criterion, quantifies the production losses due to the flow releases; while for the economy criterion, the indicator of “HP producer income” represents the HP company’s economic income due to the plant. Besides, the indicator of “landscape protection level”, associated to the landscape criterion, assesses how the landscape perception changes according to the flow releases.
On the contrary, for the environment criterion, four indicators were defined using indicators required by the regional environmental regulations, based on the same WFD macro-descriptors and thus, in this paper, they are named “WFD derived” indicators. These indicators are used to assess the effects of the withdrawal on the chemical, physical, microbiological, and biological quality status of the watercourse, and they are calculated as the difference between the quality status upstream and downstream of the withdrawal point.
In particular, “Δ IBE” (Δ extended biotic index) assesses the quality status of a given watercourse stretch by analyzing the alterations in the structure of benthic macroinvertebrate communities living (at least for a part of their biological cycle) in contact with the riverbed substrate. Instead, “Δ LIM” (Δ pollution level of the macro-descriptors) describes the water quality by assessing the degree of pollution due to chemical and microbiological factors, considering different parameters (i.e., % of dissolved oxygen—DO, chemical oxygen demand—COD, biochemical oxygen demand—BOD5, ammonium nitrogen—NH4-N, nitrate nitrogen—NO3-N, total phosphorus—P, and Escherichia coli). Besides, the “Δ EPT” (Ephemeroptera, Plecoptera, Tricoptera richness index) indicator estimates water quality by the variation of the relative abundance of the above mentioned orders of stream insects. Lastly, “Δ E. coli” (Δ Escherichia coli) expresses a water quality judgement based on changes in the concentration of Escherichia coli colonies induced by variations of the flow rate and of the pollutants’ load deriving from an organic source. It is extracted from the metrics used for the calculation of the LIM index, since it is more responsive to the variations of organic matter concentrations in the regional hydrographic network (while the LIM index is an aggregated indicator that considers several metrics characterized by a highly different responsiveness).
Finally, the indicator of “fish and fishing activities’ protection”, associated to the fishing criterion, is a hydromorfological proxy indicator assessing the condition of fish, and is essentially based on expert judgement.
However, several studies demonstrated that the four environmental “WFD derived” indicators initially adopted in Aosta Valley were not suitable to quantify the impacts of water abstractions on the watercourses’ hydromorphology (e.g., [
9,
15,
16,
17]). Moreover, several applications also in Aosta Valley showed that these indicators, derived from biological and chemical-physical-microbiological quality indexes, are not directly related to the flow releases at the HP plant dam, and thus they do not respond reliably to the variations of MCA alternatives, increasing the level of uncertainty in the analytical process. Furthermore, the indicator considered for fishing (“fish and fishing activities’ protection”) was not sufficiently reliable, since it was essentially based on expert judgement. The above criticalities led the application of the MesoHABSIM methodology being considered as a potential alternative to replace all the indicators previously associated to the environment and fishing. The Results section (
Section 3.1 and
Section 3.2) illustrates the methodological approach used to include MesoHABSIM into the MCA framework and the main outcomes, from its first application to a real case study.
2.4. Analysis of MCA Results Robustness
Since every decision process is complex and is often affected by uncertainty in the input data, applied technique, and preferences, carrying out a sensitivity analysis is an important requirement to check the method stability [
40,
41]. This investigation allows the impacts of slight modifications in the input parameters on the results to be assessed, i.e., on the final ranking of alternatives [
42]. If the ranking does not change after minor variations, the results are considered robust; while, if the final performances of the alternatives are considerably modified, the MCA framework proves to not be highly reliable and further discussions are necessary to reach the final solution [
43].
In particular, in MCA decision processes, the weights allocation to criteria and indicators by stakeholders (or decision makers) is intrinsically affected by subjectivity, because each actor can focus his/her attention on different aspects, thus performing a different evaluation [
40]. Therefore, this phase of the decision process is the one most affected by uncertainty, as the choices of stakeholders can significantly influence the final results [
39].
For these reasons, during the experimentations carried out in Aosta Valley, sensitivity analyses aimed at testing the robustness of the MCA results are always performed in the final part of the decision-making process and they usually focus on the weights of criteria and indicators as input data. Hence, an evaluation of the stability of the ranking is performed by changing the initial weights and analyzing the size of variations that produce a considerable modification of the final ranking, i.e., in particular, the change of the winning alternative (which is the alternative with the highest final performance) [
39].
More specifically, through a tool provided by the SESAMO SHARE software, MCA calculations are repeated several times: In each simulation, the weight of a criterion (or of an indicator) is alternately increased and decreased (and consequently, even the other weights proportionally change, since the sum of weights for the criteria and in each group of indicators has to remain equal to 1) and the effects of these variations on the MCA results are analyzed.
These investigations are carried out, in the final part of each experimentation, during several meetings of the TAB, when all the concerned stakeholders, who were already involved in the decisional tree and decision matrix definition (thus having a complete knowledge of the system), are present. The results of this procedure are subsequently analyzed together by the same stakeholders: If slight modifications of the weights do not produce significant variations of the alternatives ranking, the MCA outcomes are considered stable and the process continues with the definition of the final set of weights in order to achieve the final solution. Otherwise, a revision of the indicators set and of the decisional tree is required.
The results of the sensitivity analysis procedure carried out for the first implementation, within a single HP plant case study, of the new MCA methodology are shown in
Section 3.2.
2.5. Analysis of MCA Stakeholders’ Feedback
Another important analysis performed in each experimentation in Aosta Valley region is the assessment of stakeholders’ feedback. In particular, stakeholders’ satisfaction about the final set of indicators, whose scores contribute to the final performance of each alternative, is formally checked and recorded within the TAB minutes of meetings, with the aim of verifying whether the indicators are reactive and representative of the different stakes.
This assessment is usually carried out by collecting, from each of the TAB members, a feedback on the following five characteristics of each indicator [
39]:
Reactiveness to flow releases’ variation: Each indicator should have a causal relationship with the different considered flow release alternatives in order to ensure the significance of MCA.
Compliance with the legislative framework: When possible, the use of official indicators required by local sets of laws is important, in order to strengthen the decision making.
Compliance with stakeholders’ needs: Each indicator should represent the relative stakeholder’s interests in a clear way.
Transferability to different river contexts: The possibility of adapting an indicator to different contexts, locations, and scales is an added value, even if it is essential that all the indicators are fully suitable to assess the objective of the study in the context of the investigation, in order to provide significant information.
Available dataset: Not only the actual availability of the dataset necessary for the indicators elaboration is an essential characteristic, but also the difficulties linked to data collection, management, and elaboration (e.g., time and costs required for data gathering) should be taken into account.
Therefore, the stakeholders’ feedback was collected during the first case study in which the updated MCA procedure was tested, in order to check the satisfaction of the involved TAB members for the suitability of the new indicators. The same analysis was and is being applied in the other case studies currently ongoing in Aosta Valley.
The outcomes of the stakeholders’ feedback analyses on the new procedure were then compared with the feedback obtained in previous experimentations where the old MCA approach was used. By analyzing all the minutes of TAB meetings in relation to the feedback about the above five mentioned characteristics for each indicator, a resulting comparison table was obtained, which allowed an understanding of how this new approach is perceived by the involved parties to be formed.
The results of this evaluation are shown and explained in
Section 3.3.
3. Results
This section is organized in three parts.
Section 3.1 presents the methodological approach used to include MesoHABSIM into the MCA framework (through the IH indicator adoption) and the resulting final decisional tree. In
Section 3.2, a simple case study in which the updated procedure was tested for the first time is illustrated and the results of the sensitivity analysis showing the procedure robustness are presented; finally, in
Section 3.3, the results of the evaluation of stakeholders’ feedback about the selected indicators are shown and the procedure’s application to other real case studies in Aosta Valley, involving different types of water withdrawals, is presented.
3.1. Inclusion of the MesoHABSIM Methodology in the MCA: The IH Indicator
The weaknesses of the indicators previously associated to the environment and fishing criteria, described in
Section 2.3, highlighted the need to adopt other indicators to be used in the MCA assessment, more consistent and more directly linked to the watercourse discharge alteration. Based on the positive outcomes of the MesoHABSIM methodology application during its adaptation to the Italian context, in particular in mountainous streams [
24,
25,
26] and especially on the experience gained from its use in several sites along the Aosta Valley watercourses, the MesoHABSIM derived index of river habitat integrity (IH) was identified as the most suitable indicator to be included in the MCA framework. This choice was further supported by the formal publication of the methodology official guidelines at a national level [
23].
The IH index allows a quantification of the consequences of water withdrawals on fish populations and on the river environment and, therefore, it was considered as a suitable indicator to represent both the environment and the fishing criteria. It is directly based on watercourse discharge and is calculated through Equation (5) (see
Section 2.1), leading to five classes of quality (
Table 1), with its score ranging between 0, which represents a very high degree of alteration of the watercourse habitat quality due to the impacts generated by the water withdrawal, and 1, which corresponds to a condition with no hydromorphological alterations, i.e., where the habitat quality is equivalent to the reference condition (e.g., before an HP plant construction).
In order to align the index of river habitat integrity with the other indicators already used in the MCA decisional tree in Aosta Valley, a common description form, including all information characterizing the indicator (e.g., name, description, method of elaboration, utility function, literature, and normative references, etc.), was elaborated.
Utility functions are used in the MCA process to normalize the scores of each indicator, transforming the initial scores into dimensionless values in order to allow the comparison of various indicators characterized by different units. They are mathematical functions (one for each indicator) that assign to each value of the indicator (x-axis) a corresponding dimensionless value ranging between 0 and 1 (y-axis), which represents the satisfaction level of the corresponding stakeholder(s). The index of river habitat integrity utility function is shown in
Figure 5. It can be seen that it is a linear function, y = x, ranging between 0 and 1, since IH is already dimensionless.
For the calculation of the ISH, ITH, and IH indexes, daily discharge data measured in the riverbed both upstream and downstream of the withdrawal point are required for a period of at least 5 years. Thus, if no discharge data are available before the beginning of the experimentation, the discharge monitoring should normally start when the TAB is set up. During the monitoring period, TAB members are actively involved in the MCA procedure, taking part in meetings, discussions, and continuous improvements of the approach. This compulsory need to collect reliable and consistent daily instream flow monitoring series is a result of the inclusion of the MesoHABSIM methodology into the water withdrawal assessment procedure. In fact, before the use of the IH indicator in the MCA, continuous discharge monitoring was not required in the watercourse stretch affected by the water abstraction, since the initial indicators were not directly related to this parameter.
The IH index was thus introduced in the MCA decisional tree, and as this indicator proved to be suitable to represent the interests of stakeholders related to both the environment and fishing criteria, as shown by initial applications of MesoHABSIM in Aosta Valley, it was decided to merge the two criteria in a single criterion, named “environment and fishing”.
The resulting new decisional tree used for water withdrawal sustainability assessment is shown in
Figure 6. In addition to the introduction of the IH indicator (highlighted in red), some modifications and improvements of the other indicators (e.g., landscape indicator and economy indicators) were also carried out in order to better represent the corresponding stakeholders’ interests. Besides, it must be further outlined that all the indicators, as the IH index, are directly related to the watercourse discharge (withdrawn and released at the dam), which represents the key driver of the whole assessment process.
It must be outlined that, during the final discussions among the involved stakeholders for the decisive selection of the optimal alternative, a threshold is considered for IH denoting the “good” and “high” classes in which the indicator score should remain in order to comply with the normative requirements. Thus, usually the TAB members immediately exclude the alternatives for which IH does not reach the class of quality identified as environmental protection objective in the regional planning, i.e., when IH is lower than 0.6, and they focus their attention on the other alternatives for the final decision.
3.2. First Test of the Updated MCA Procedure: Case Study on the Graines Torrent
The first complete decision-making process carried out in Aosta Valley based on the MCA application and on the final set of indicators shown in
Figure 6 (including the IH indicator) concerned a small run-of-the-river hydropower plant, located in the municipality of Brusson. The affected watercourse is the Graines torrent, a small watercourse, 4th order tributary of the Po River, with a mean annual discharge of less than 1 m
3/s and a watershed surface of about 20 km
2. The HP plant has a total head of 125 m (water intake located at 1479 m a.s.l., withdrawing a mean annual discharge of 462 L/s) and an average annual nominal power of 566 kW.
The water license was released in 2010, but, when the HP plant was built, data about the natural discharge in the streambed were not available and the MIF had been quantified using the hydrological formulation given in the regional River Strategic Plan, affecting the water availability by high levels of inaccuracy. However, since the defined water releases caused interruptions of the HP plant withdrawal for about 6 months during the year, in 2012 the HP company, Idroelettrica Brusson s.r.l., and the Regional Water Authority agreed upon starting an experimental approach for environmental flows’ definition, in order to find a compatible balance among production needs and the protection of the environmental conditions of the watercourse.
Therefore, a hydrological monitoring program (ongoing since 2012) was implemented by the HP company in order to provide consistent and updated flow data series to be used within the MCA. Thus, a monitoring system with an informative screen was set up at the dam, showing real time values of the flow upstream of the dam, flow releases, and energy produced, even supporting direct controls carried out by the Regional Water Authority.
The experimentation process started from the involvement of key institutional stakeholders forming the TAB, coordinated by the Regional Water Authority. The actors taking part in the TAB were members of the HP company (applying for a water withdrawal license renewal) and of several regional technical bodies, i.e., Regional Agency for Environment Protection (ARPA Valle d’Aosta), Regional Fisheries Consortium (Consorzio Pesca), Regional Landscape Protection Service, Regional environmental assessment and air quality protection Service, and Regional flora, fauna, hunting, and fishing Service. Stakeholders were actively involved throughout the whole decision-making process, which was implemented, reviewed, and validated yearly along the period of 2012–2017, during a total of 31 TAB meetings. During the experimentation period, the HP plant had worked by releasing provisional water flows, adapted yearly to experimentation progressive results and formally endorsed by the TAB.
After the first year of hydrological monitoring at the HP plant, some initial flow release alternatives were defined, in addition to the “reference alternative” (i.e., the scenario defined through the hydrological formulation, originally adopted by the HP company). Each alternative was proposed by a single member of the TAB and foresaw ecological flows values, defined on a monthly basis, to be released from the dam.
In the following years, several “real time” alternatives agreed by the TAB were also defined: They were based on a minimum flow value to be released in the streambed for each month, incremented by an additional release (varying on hourly basis) calculated as a percentage (from 12.5% to 30%) of the natural flow rate measured upstream of the dam. Overall, nine different alternatives were considered in the case study.
The decisional tree adopted was the same represented in
Figure 6 and the selected indicators were defined and/or reviewed over the years of the experimentation, thanks to the work and collaboration of all the actors involved in the TAB.
The first MCA results were obtained with an initial weight assessment, established together by all the TAB members, based on an equal distribution of the weights among the four criteria (i.e., 0.25 each) and on the set of weights for the economic sub-criteria and for the indicators shown in
Table 2.
It can be seen that, between the economic sub-criteria, a higher weight was allocated to “community income”, since it was assumed that the river is a public resource to be protected for the whole community. Besides, the HP company proposed the distribution of weights between IEc–1 and IEc–2, giving more importance to the former, which is referred to as the initial concession period, when the energy price is higher due to national incentives. On the contrary, all the TAB members assigned the weights to RC and RCS, preferring the latter in order to highlight the importance of economic incomes for local municipalities. Finally, a weight equal to 1 was allocated to the other three indicators, since the corresponding criteria have only one indicator each.
By performing MCA with this initial set of weights through the SESAMO SHARE software, a first ranking of alternatives was obtained. Afterwards, several sensitivity analyses were carried out, in order to investigate and quantify the significance of the MCA results, i.e., to test how much the final outcomes were affected by changes in the initial weights of the criteria and indicators. As previously explained in
Section 2.4, the weight of each criterion (and, subsequently, also of each indicator) was alternately increased and decreased by using the SESAMO SHARE software, analyzing the size of the variation necessary to obtain an important alteration of the final MCA ranking, i.e., the change of the winning alternative. These investigations were carried out in the final part of the experimentation, during some meetings of the TAB, when all the involved stakeholders were present.
The results of these sensitivity analyses concerning the criteria weights are shown in
Table 3. It can be seen that slight modifications of the initial weights did not produce significant variations of the alternative ranking. In particular, the weight of the landscape criterion had to be modified (in this case reduced) by at least 32% to change the winning alternative, while, for the other criteria, an even larger variation of the initial weight was necessary to vary the winning alternative. The table shows, for each criterion, the modified weight responsible for the winning alternative variation and the size of the weight variation (compared to the initial weight, i.e., 0.25).
Due to the significant size of the weights’ variation required to change the winning alternative, the outcomes of the sensitivity analyses demonstrated to the TAB members that the MCA results were sufficiently stable and robust.
Therefore, after this check, a final set of weights was defined for the four criteria (the indicators’ weights remained as those shown in
Table 2): 0.25 to “energy”, 0.30 to both “environment and fishing” and “landscape”, and 0.15 to “economy”. This set of weights was agreed upon by all the TAB members during a meeting, taking into account the reasons of the different stakeholders and defining weights that could be explained to external observers and policy makers. In particular, the reason leading to the assignment of a higher weight to environment and fishing is that this criterion represents two stakeholders’ interests, i.e., the environmental patrimony and the fishing activities affected by the HP plant, and their related set of laws. Moreover, the weight allocated to landscape was higher because the criterion also represents the protection needs of tourism activities in the affected area. Finally, the weight of economy was lower than energy’s one in order to highlight the importance of a renewable energy source as HP, contributing to the regional, national, and European strategies for CO
2 emission reduction. It should be noted that conflicts were reduced through the dialogue and discussions among TAB members and through the definition of further flow release alternatives, representing a compromise among different stakeholders.
The final performances of the alternatives obtained with the new set of weights were similar to the previous results (mean variation of about 2.9%) and the ranking of alternatives remained almost the same. Therefore, after the exclusion of alternatives with an IH indicator score lower than 0.6 (i.e., good status class entry level), on the basis of the MCA results and after several discussions, the TAB members finalized a definitive decision about the alternative to be adopted. This alternative implied higher fixed flow releases in summer months (for touristic reasons) and, in the other months, a basic release of 70 L/s with an additional flow release defined in real time as a percentage (variable from 12.5% to 25%) of the natural discharge continuously monitored upstream of the withdrawal point. It was recognized as the best mediation solution and it was officially endorsed, in February 2018, as the release scenario to be guaranteed by the HP company. More information about the complete experimentation carried out on the Graines torrent (e.g., description of the considered alternatives, sensitivity analyses, final ranking, etc.) can be found in [
45].
It must be noted that, during the experimentation process, environmental quality indexes required by the European WFD (based on macrozoobenthos, physical, chemical, and microbiological parameters) had been systematically monitored along the Graines torrent, outlining a high ecological status of the watercourse.
The TAB results were officially endorsed by the regional government and the selected flow release alternative is currently implemented downstream of the considered HP plant. The positive results of this first experimentation and the satisfaction of all the involved stakeholders demonstrated the actual applicability of this kind of approach and an increase of the quality of decision making.
Finally, using IH index derived from MesoHABSIM allowed the environmental asset of the Graines torrent to be quantified and highlighted, which has a good ecological status while under the pressure of water withdrawal.
3.3. Stakeholders’ Feedback about the Updated MCA Decisional Tree and Procedure Application to Other Real Case Studies in Aosta Valley
As explained in
Section 2.5, the stakeholders’ feedback about five main characteristics (reactiveness to flow releases’ variation; compliance with the legislative framework; compliance with stakeholders’ needs; transferability to different river contexts; available dataset) of each indicator was collected during the recent MCA applications using the revised procedure (i.e., considering the decisional tree shown in
Figure 6, which includes the IH indicator based on the MesoHABSIM methodology). The outcomes recorded in the related TAB minutes of meetings were then compared with those collected during previous experimentations carried out with the old procedure, in order to assess whether the new decisional tree is more representative of the different stakeholders’ interests.
Table 4 summarizes the results of this stakeholders’ feedback analysis. To obtain this final evaluation matrix, the minutes of the TAB meetings carried out during the experimentation on the Graines torrent were re-analyzed, together with the minutes of previous case studies still based on the initial decisional tree. This evaluation allowed a quantification of the MCA methodology quality according to the involved stakeholders, both for the previous and the new sets of indicators. Their opinions noticed in recent meetings for other experimentations ongoing in the region were also taken into account. It must be noted that a majority of the stakeholders involved in the different experimentations do not change (except for the HP company representatives): Therefore, they have a clear knowledge of the differences generated by the revision of the MCA framework.
As already mentioned in
Section 2.3, in fact, the previous MCA procedure was not only improved through the inclusion of the IH indicator (and, consequently, the aggregation of the environment and fishing criteria), but also other initial indicators were modified and refined over the years in order to better assess the related stakeholders’ interests.
Looking at
Table 4, it can be seen that for each indicator, the five characteristics described in
Section 2.5 were evaluated by means of one of the following judgements: Bad, poor, moderate (mod.), good, or high.
From an initial analysis of the results presented in
Table 4, a general improvement of stakeholders’ opinions about the new set of indicators, compared with the previous decisional framework, is evident for almost all the considered features. Only for the “available dataset” was a worse (or equal) judgement assigned to the revised indicators. This is due to the fact that the feature of “available dataset” also takes into account the difficulties linked to data collection, management, and elaboration, in particular due to the increase of time and costs for data gathering. In fact, since all the new indicators are based on watercourse discharge data, a continuous hydrological monitoring plan is required for several years: This increases the time extension necessary to obtain a reliable flow dataset. However, this drawback is compensated for by a higher quality of data used within the MCA for the elaboration of indicators’ scores.
More specifically, considering the indicators associated to the environment and fishing criteria, a substantial increase of the stakeholders’ satisfaction was noticed following the replacement of the previous environmental “WFD derived” and fishing indicators and the adoption of the index of river habitat integrity to represent the interests of both stakeholders.
In particular, for the features of “reactiveness to flow releases’ variation” and “compliance with stakeholders’ needs”, the opinions vary from a very negative (i.e., bad) to a highly positive judgement (i.e., high) according to the environmental stakeholders. This is due to the weaknesses, already outlined in
Section 2.3, of the previous environmental “WFD derived” indicators, which do not respond reliably to variations of flow releases (and, consequently, of MCA alternatives) and even overestimate the ecological status, thus not allowing proper quantification of the effects of withdrawals on the river ecosystem. On the contrary, the IH index is directly related to watercourse discharge alterations and it assesses in a reliable and predictable way flow release effects on the environment, even if limited in time and in amount (e.g., allowing support of river ecological functions during low water periods).
The improvement of the same features according to fishing stakeholders is due to the fact that the previous “fish and fishing activities’ protection” indicator was a hydromorphological proxy indicator, essentially based on expert judgement and not directly based on flow releases’ quantification. Besides, even if it represented fishermen needs well, its compliance with the legislative framework was poor, while the IH index holds a clear reference to recent national normatives, thus also strengthening the related stakeholders’ requests.
The “compliance with the legislative framework” feature has also improved by replacing “WFD derived” indicators with the IH index, since the latter fully complies with a more recent national set of laws, i.e., Decrees 29/2017 [
46] and 30/2017 [
47].
Regarding the “transferability to different river contexts”, no relevant differences were noticed between the previous set of environmental and fishing indicators and the use of the IH index. On the contrary, as already mentioned, the IH indicator elaboration also requires several years of hydrological monitoring, increasing the time extension necessary for reliable flow data collection; this affects, above all, the fishing stakeholders, whose previous indicator was essentially based on expert judgement and thus did not require regular and organized data collection.
Briefly also considering the other indicators, subject to several modifications and refinement over the years, it can be seen that for energetic and economic stakeholders, no substantial changes were observed after comparing previous and revised indicators. However, for energy, it should be noted that the previous indicator was defined to mainly identify flow release effects on medium and large HP plants, while the new indicator was conceived explicitly by small HP producers, taking into account specific plant characteristics (e.g., turbine typology, cut-off flows, absence of water intake, etc.). Therefore, by adopting the revised indicator, in addition to the feature of “reactiveness to flow releases’ variation”, the features of “compliance with stakeholders’ needs” and “transferability to different river contexts” have also improved, since the indicator better quantifies the outputs of hydroelectric production for small HP plants, which are more frequently concerned by sustainability assessments in Aosta Valley and in Italy, thus also improving the transferability to other river contexts.
On the contrary, the landscape indicator was concerned by more extensive modifications in recent years, mainly aimed at including visual effects on the landscape due to flow release amounts downstream of the HP plant. Therefore, a better judgement was assigned to the revised indicator for both the features of “reactiveness to flow releases variation” and “compliance with stakeholders’ needs”, since, nowadays, the indicator is highly variable with different flow release scenarios, and it also quantifies their effects on landscape perception. For this reason, for its elaboration, the collection of pictures of the bypassed stretch, aligned with discharge data, is also compulsorily required, thus increasing the time extension required to obtain a reliable visual dataset.
Due to the improvement of the stakeholders’ feedback using the new set of indicators and to the positive results of the first complete experimentation including the IH index in the MCA framework (carried out on the Graines torrent), which led to satisfactory outcomes for all the involved stakeholders, this decision-making process will be extended from the HP withdrawal’s sustainability assessment to decision problems involving combined typologies of water abstractions. Besides, the procedure can be applied both ex ante and ex post, i.e., to assess the suitability of new licenses for water withdrawals or to evaluate the renewal of licenses for existing HP plants or agricultural water diversions.
At present, 20 experimentations, involving a total of 58 HP plants with highly variable sizes and 12 farmers’ consortia with different irrigation withdrawals, are ongoing in the region.
Besides, the procedure is being used to optimize the ecological flows for both single withdrawals and multiple water diversions in the same watershed, sometimes involving multiple water bodies. The approach concerns different types of water withdrawals and it aims at assessing the following aspects of water resource management:
Assessing the compatibility between HP and agricultural withdrawals, i.e., for both HP production and field irrigation.
Assessing the compatibility between HP and industrial withdrawals, i.e., for both HP production and artificial snowmaking during the winter.
Defining the optimal ecological flow for a single HP plant or for multiple HP plants in the same catchment.
Assessing license renewal for an old HP plant or authorizing new HP plants.
Figure 7a shows the distribution between the three different typologies of water withdrawals involved in the decision-making approaches ongoing in Aosta Valley. It can be seen that the majority of water diversions are HP plants (81.7%), but several agricultural withdrawals (16.9%) are considered, while only one is for industrial use. Besides, it must be noted that agricultural and industrial water abstractions are always involved in experimentations together with HP plants, i.e., there are no decision-making processes that concern only an agricultural (or industrial) withdrawal.
The altitudes of the withdrawal points range from about 300 m a.s.l. to more than 2000 m a.s.l., while the lengths of the affected stream section downstream of the withdrawal points (bypassed stretches) vary from 1 km to more than 10 km.
Moreover, the sizes of HP plants range between few kW to more than 3 MW: The majority of them are private HP plants (56.9%), but a consistent number of public HP plants is also considered (43.1%), all belonging to the main regional HP company (
Figure 7b). Besides, in considering the typology of the involved HP plants, almost all of them are run-of-the-river plants (89.7%), but there are also six plants supplied by water storage.
4. Discussion
The experimental approach presented in this paper, with the final configuration of the decisional tree described in
Section 3.1., proved to be a suitable tool to support decision-making processes for water withdrawal assessment and environmental flows’ definition. The positive results of the current experimental studies were demonstrated in particular by the satisfaction of all the involved stakeholders, since the methodology requires a continuous collaboration among the different actors, taking into account their different interests and leading to a final decision that represents the best mediation solution. Besides, through the adoption of the updated decisional tree, the satisfaction of the involved stakeholders was further increased, due to an improvement of most of the main features for the revised indicators (as demonstrated by their feedback illustrated in
Section 3.3.). In addition, the MCA alternatives selected by the stakeholders are actually being implemented in the affected watercourses, allowing for the protection of both the ecosystem requirements and HP production needs.
At the moment, 20 experimentations based on the described procedure have been started in Aosta Valley, involving different types of water abstraction (mainly run-of-the-river HP plants) in order to find a compromise for the protection of both the ecosystem and landscape requirements and HP production or other water users’ needs. Moreover, since the approach has demonstrated to be suitable for this kind of decision problem and even the decision makers have noticed an increase in the quality of the decision making for river management, which promotes better use of a common resource, there will probably be a formal inclusion of the methodology in the new regional regulations (river strategic plan update) to assess the sustainability of water withdrawal licenses release.
A central characteristic of this methodological approach, which includes the MesoHABSIM methodology into the MCA framework, is the fact that it assesses the watercourse discharge as the primary driver, considering the effects on river conditions in relation to different ecological flows. In fact, all the indicators currently adopted in the MCA decisional tree in Aosta Valley are related to the watercourse discharge (withdrawn and released at the dam) and, for this reason, a specific hydrological monitoring plan is required since the beginning of the experimentation. The flow monitoring system allows for the provision of a reliable data series to be used within the MCA in the assessing phase and, after the end of the decision-making process, for support of the direct controls carried out by the Regional Water Authority to verify compliance with the water license requirements.
In particular, the decision to use the MesoHABSIM methodology for quantification of the effects of different withdrawal alternatives both on the environment and on sport fishing, through the IH indicator, showed the clear advantage to overcoming the limits of “WFD derived” indicators. These indicators, in fact, are scarcely related to flow release variations because they most likely respond to multiple forcing agents in the river (e.g., the presence of wastewater discharge in the riverbed, the level of dissolved organic load, the type of substrate, etc.), as shown by previous case studies carried out in Aosta Valley. Therefore, these indicators seem to be not fully suitable to quantify the impacts of water abstractions on watercourses, since no strong statistical relationships between the flow alterations and ecological responses are evident ([
8,
9,
15,
16,
17]). Furthermore, they cannot be used in the forecasting phase, before flow pressure is applied (i.e., in ex-ante assessments). The weaknesses of “WFD derived” indicators have also been highlighted by stakeholders involved in different experimentations in Aosta Valley, which identified a large improvement of their satisfaction by replacing the previous set of indicators with the IH index. This is evident by observing
Table 4 (
Section 3.3), in particular the features A and C (i.e., “reactiveness to flow releases variation” and “compliance with stakeholders’ needs”), for which the judgement has become “high” instead of “bad” with the updated decisional tree. It should be noted that the Regional Water Authority, in Aosta Valley, has been oriented to define ecological flows on a hydromorphological basis for several years, even before formal endorsement in the national decrees in 2017 (i.e., [
46,
47]) and further regional legislative framework evolution. However, WFD derived ecological status indexes are constantly implemented during the monitoring phase, in order to also ensure the compatibility of flow releases with European regulations.
Besides, through the IH indicator, theoretical flow releases scenarios can be defined and compared (both as the amounts to be released from the HP plant and as periods of release), ensuring compliance with specific threshold values for the indicator. Basically, a framework of monthly flow releases, which ensures an IH score always ≥ 0.6 is obtained (thus guaranteeing the maintenance of high or good classes), could be identified a priori.
Another strength of this methodological approach is the possibility to adapt it to different contexts and different types of withdrawals. For example, it can be applied both ex ante, i.e., during the planning process before building a new HP plant, to assess the suitability of a new license release, and ex post, for instance, to evaluate the sustainability of a license renewal, variation, or to strengthen for an existing HP plant. Besides, it can be adopted for the assessment of a single withdrawal HP plant or, at a river catchment level, several HP plants located on the same watercourse and/or functionally connected to each other, considering different sizes and typologies (e.g., agricultural withdrawals for irrigation) of water diversions, as demonstrated by recent applications of the updated procedure to real cases in Aosta Valley, as presented in
Section 3.3. In addition, the feature of “transferability to different river contexts” was assessed, through stakeholders’ feedback, as “good” or “high” for almost all the updated indicators (see
Table 4). However, for the landscape indicator, the judgement was “moderate”, but this is due to the landscape protection constraints taken into account in the indicator elaboration, which are typically referred to as regional conditions and regulations, and thus should be modified to adopt the indicator to a different region.
Moreover, the described procedure can be fully carried out for the definition of the ecological flows in mountain contexts, like the Alpine regions, where water abstractions are a prominent pressure, since MCA is able to adequately represent the different stakes of the main actors living in a mountainous environment, using measurable indicators related to the watercourse discharge. In particular, the MesoHABSIM methodology has the benefit of being applicable even in environments where the characteristics of the riverbed do not allow the use of hydraulic simulation models (e.g., in the Alps).
Furthermore, it should be noted that all the selected indicators used in the MCA decisional tree have explicit normative references (see
Table 4, column B—new, and the
Supplementary Materials, Table S8): For example, the MesoHABSIM method refers, in Italy, to two decrees, i.e., Decrees 29/2017 [
46] and 30/2017 [
47], which define new methodological guidelines for water withdrawal planning, monitoring, and assessment in Italy, ensuring the achievement of the environmental objectives of the WFD in surface water bodies. The requirement of a legislation reference as a basis for the definition or selection of an indicator to be introduced in the MCA framework will also concern any possible new indicators that may be adopted in the coming years in Aosta Valley, ensuring concrete endorsement of administrative practices.
In addition, the MesoHABSIM method requires a compulsory training course for operators responsible for the application of the methodology and a rigorous standard that is ensured by ISPRA: It uses an open-source software, it is reliable and traceable, and it expresses a judgement, through the IH index, which is divided into five classes, analogously to all the other indicators required by the European legislation.
However, despite the several advantages and benefits of the described process in supporting the decision-making problems concerning HP sustainability in the region, some weaknesses have been noticed. For example, considering the decisional tree shown in
Figure 6, a partial redundancy between the energy and economy criteria can be seen, which is also evident when looking at the stakeholders indicated near these two criteria. Both, in fact, represent the interests of the HP company, since its economic incomes are obviously linked to the HP plant energy production. Though, neither of the two criteria can be excluded from the MCA framework, because energy return also represents the regional stake in contributing, through the renewable energy produced by the considered HP plant(s), to the national and European objective of CO
2 emission reduction, while economic incomes also represent, in addition to the HP producer(s)’ interest, the local community incomes (quantified by the indicators associated to the second economic sub-criterion), thanks to the fees and services given by the HP owner. An attempt to correct this drawback, in the final phase of the experimentation carried out on the Graines torrent, was done through the new set of weights established by the TAB members for the criteria, i.e., by assigning a higher weight to landscape and environment and fishing, which aims to protect the ecosystem, and a lower weight to energy and economy. However, in the following years, a revision should be carried out in order to identify new economic indicators that are less dependent on simple HP production, as well as additional energy indicators quantifying the HP plant’s contribution to the objective of the CO
2 emissions reduction.
Furthermore, it was noticed that the described methodology and the necessary information to be provided (e.g., the MesoHABSIM application, the other indicator scores’ calculation, etc.) are more difficult to explain to administrators and stakeholders without a technical background, compared to other methods for environmental assessment, such as the indexes based on the diversity or abundance of microorganisms collected and classified in the analyzed watercourse stretch (e.g., STAR_ICMi (Standardisation of River Classifications—Intercalibration Common Metric index), see [
48,
49]). In reality, the SAW method is one of the simplest MCA techniques and it is also widely used by practitioners [
50]; nevertheless, even if the selected indicators are based on an informative standard that is easy to understand for both engineers and regional technicians, the whole process may appear much more complex than it usually is for decision makers. Hence, it was remarked that there is the necessity to simply explain the MCA methodology, but also the importance of the flow rate data collection, in order to increase the transparency and the quality of the whole assessment procedure. Due to this complexity, at present, the possibility of involving a larger number of stakeholders (e.g., members of local communities, common citizens, etc.) in the TAB meetings is limited.
Finally, it must be noted that the time needed for the collection of sufficient streamflow time series is essential and it is added to the time required for data processing and validation in order to calculate the indicator scores. This consideration was also outlined in
Section 3.3., since for the feature of “available dataset”, stakeholders generally assigned a worse judgement to the revised indicators (compared to the previous ones) due to the increased time required for the discharge data collection, essential for their elaboration (
Table 4, column E, and
Supplementary Materials, Table S11). The time extension necessary for the overall methodology application (a minimum of 5 years for the whole decision process, with flow rate monitoring also continuing after the decision-making, for a total of at least 15 years [
39]) may appear as a drawback in particular for the stakeholder applying for a water withdrawal license release, due to the long time needed before receiving a final decision. However, during the experimentation period, the applicants have the possibility of adopting provisional instream flow release schemes, which are agreed upon by all the TAB members. Moreover, due to the positive results obtained in previous case studies and to the importance of taking into account the different concerned stakeholders’ opinions, even the applicants acknowledge the advantages of the described approach.
5. Conclusions
This paper presents an innovative decision-making process recently adopted in Aosta Valley, a small region in North-Western Italy, for the assessment of water withdrawals. The approach is based on the application of multicriteria analysis (MCA), considering four criteria (energy, environment and fishing, landscape, economy) and the corresponding stakeholders, with the objective of identifying the optimal flow release scenario to be implemented downstream of the withdrawal point in order to ensure sustainable river management. Since previous applications had shown that “WFD derived” indicators were not suitable to quantify the impacts of water abstractions on regional waterbodies, a new hydromorphological indicator was introduced in the decisional tree, based on the MesoHABSIM application, i.e., the “habitat integrity index” (IH). The IH quantifies the impacts of water withdrawals on fish populations and on the river environment, and it was thus associated to the “environment and fishing” criterion, proving to be fully reactive to flow releases.
The first complete decision-making process carried out for a small HP plant on the Graines torrent showed that the final MCA system, including the MesoHABSIM methodology and IH indicator, is a suitable tool for the assessment of the withdrawals’ environmental sustainability. In particular, the assessment approach allows for the definition of the ecological flows to be identified in a mountain network, which is currently subject to evident HP pressure, considering the involved stakeholders’ interests and using measurable indicators related to the watercourse flow rate.
Even if some limitations were still noticed in the process, the final management scenario identified through MCA allows for the protection of both the ecosystem requirements and HP production needs, achieving the satisfaction of the different involved stakeholders and thus the endorsement by decision makers. Moreover, the improvement of the quality of decision-making processes for river management was noticed, allowing a better use of a common resource.
For these reasons, the presented approach based both on MCA and on the MesoHABSIM application is already being used for other real cases in Aosta Valley to assess the sustainability of water withdrawal requests, both ex ante and ex post (i.e., both for new licenses and for license renewals, variation, or strengthening). Finally, the methodology will probably be officially endorsed in the river strategic plan update as the prior experimental method for the assessment of water withdrawals’ sustainability.
Therefore, further necessary refinements will be carried out in the future years that attempt to overcome the limitations that are still evident, e.g., including more stakeholders and defining new indicators, in order to improve the whole procedure and, possibly, to adapt it to other mountain river contexts.

 ,
, 


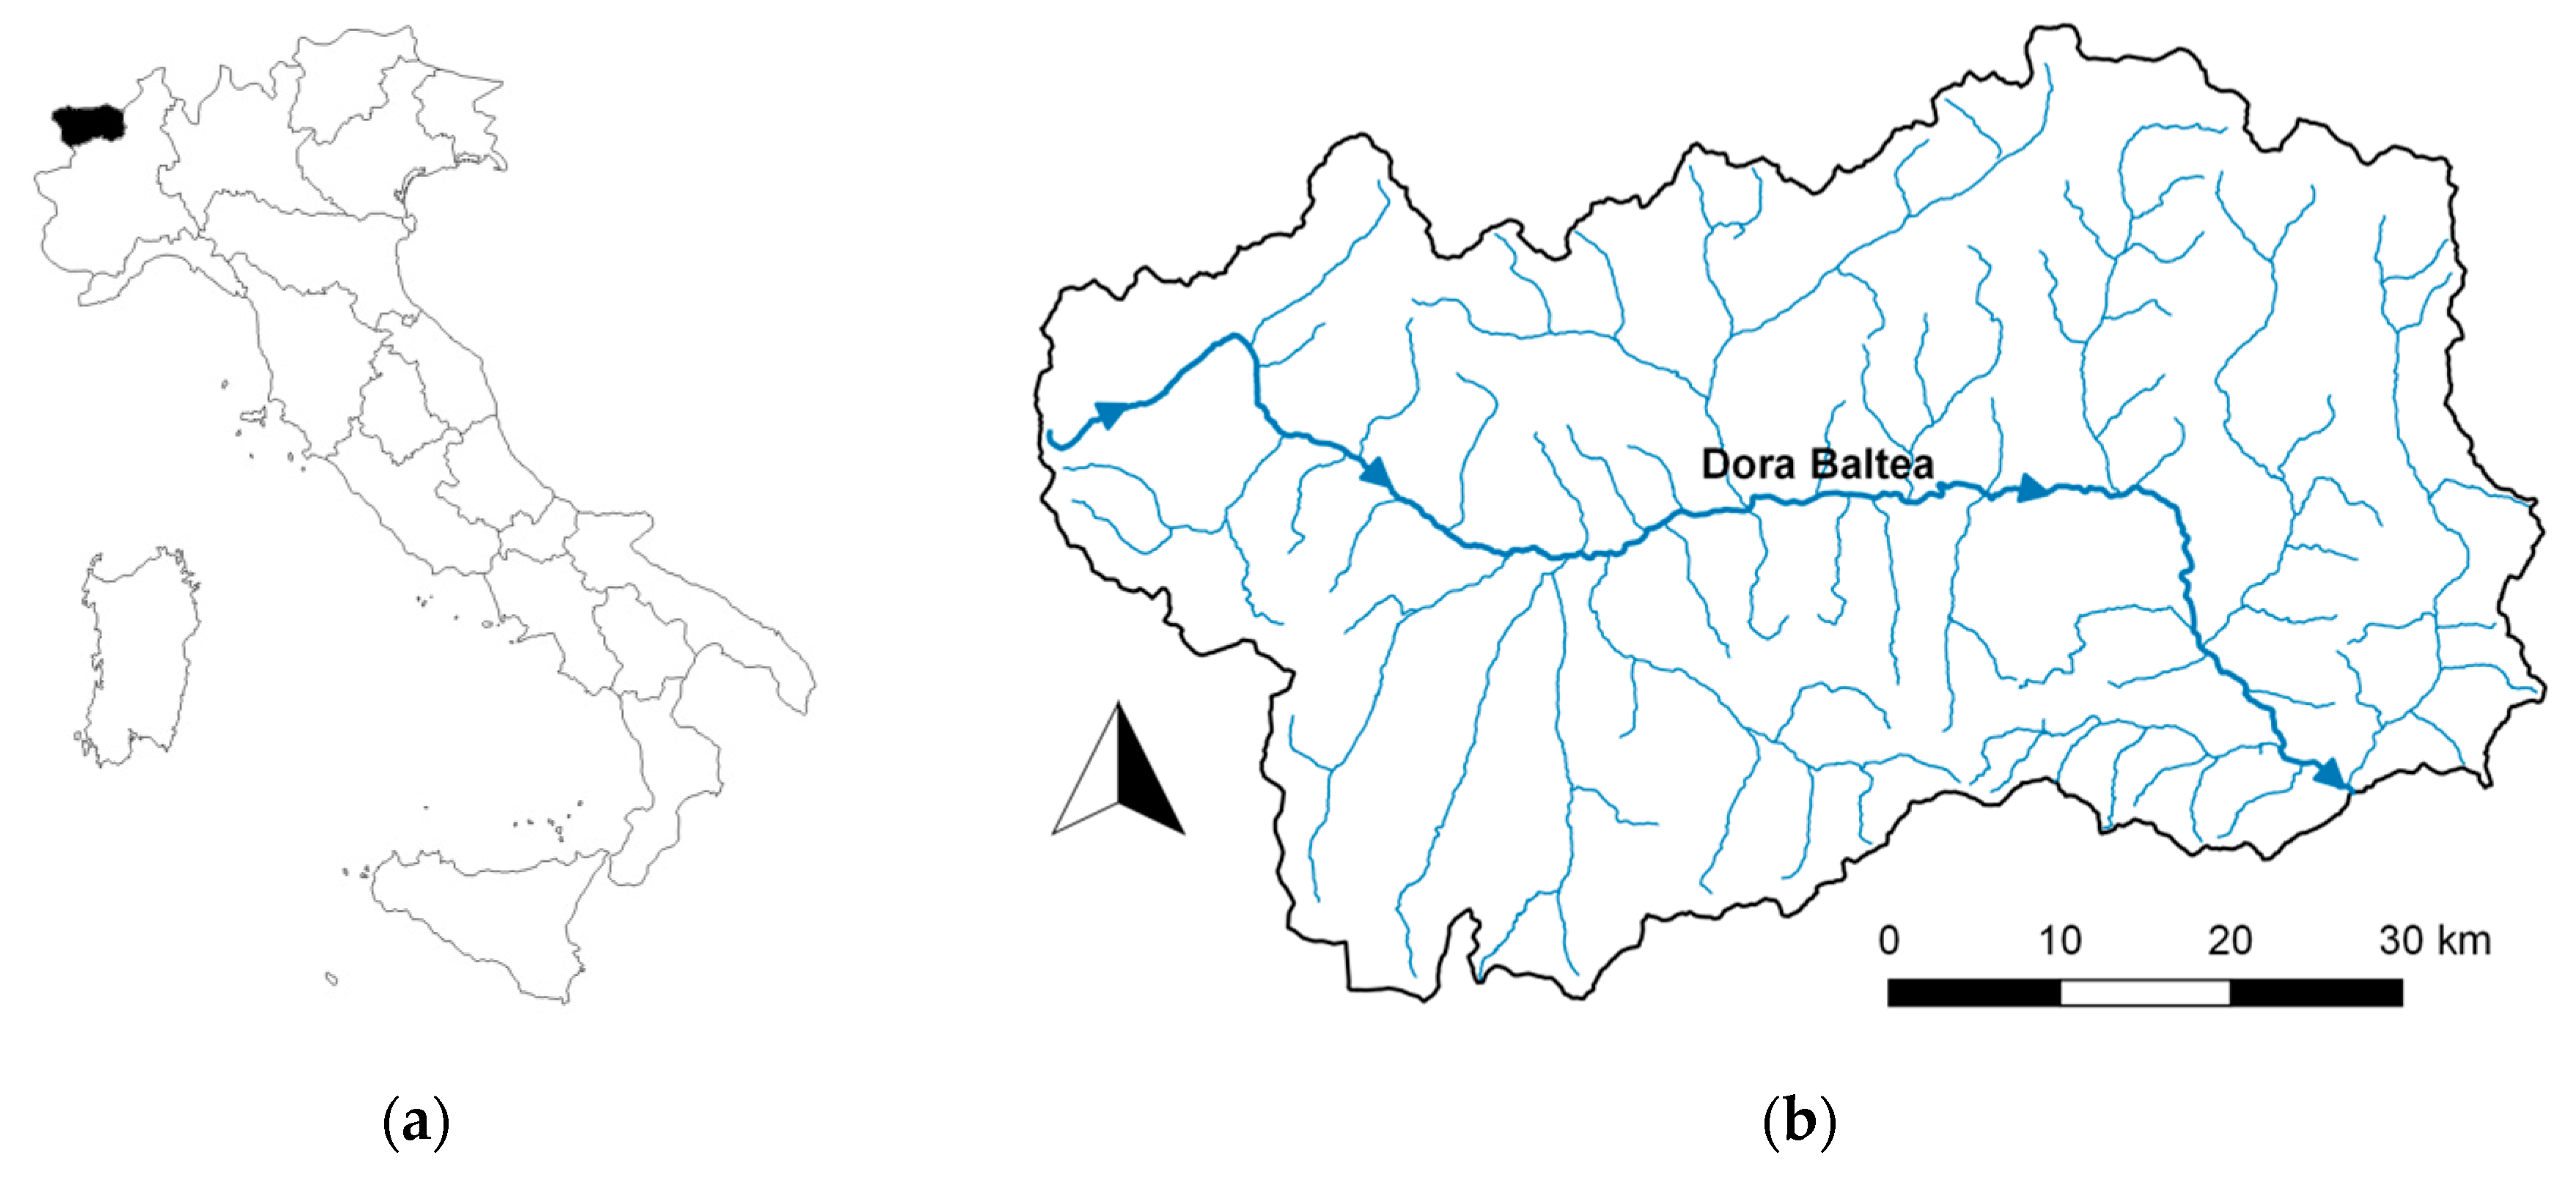
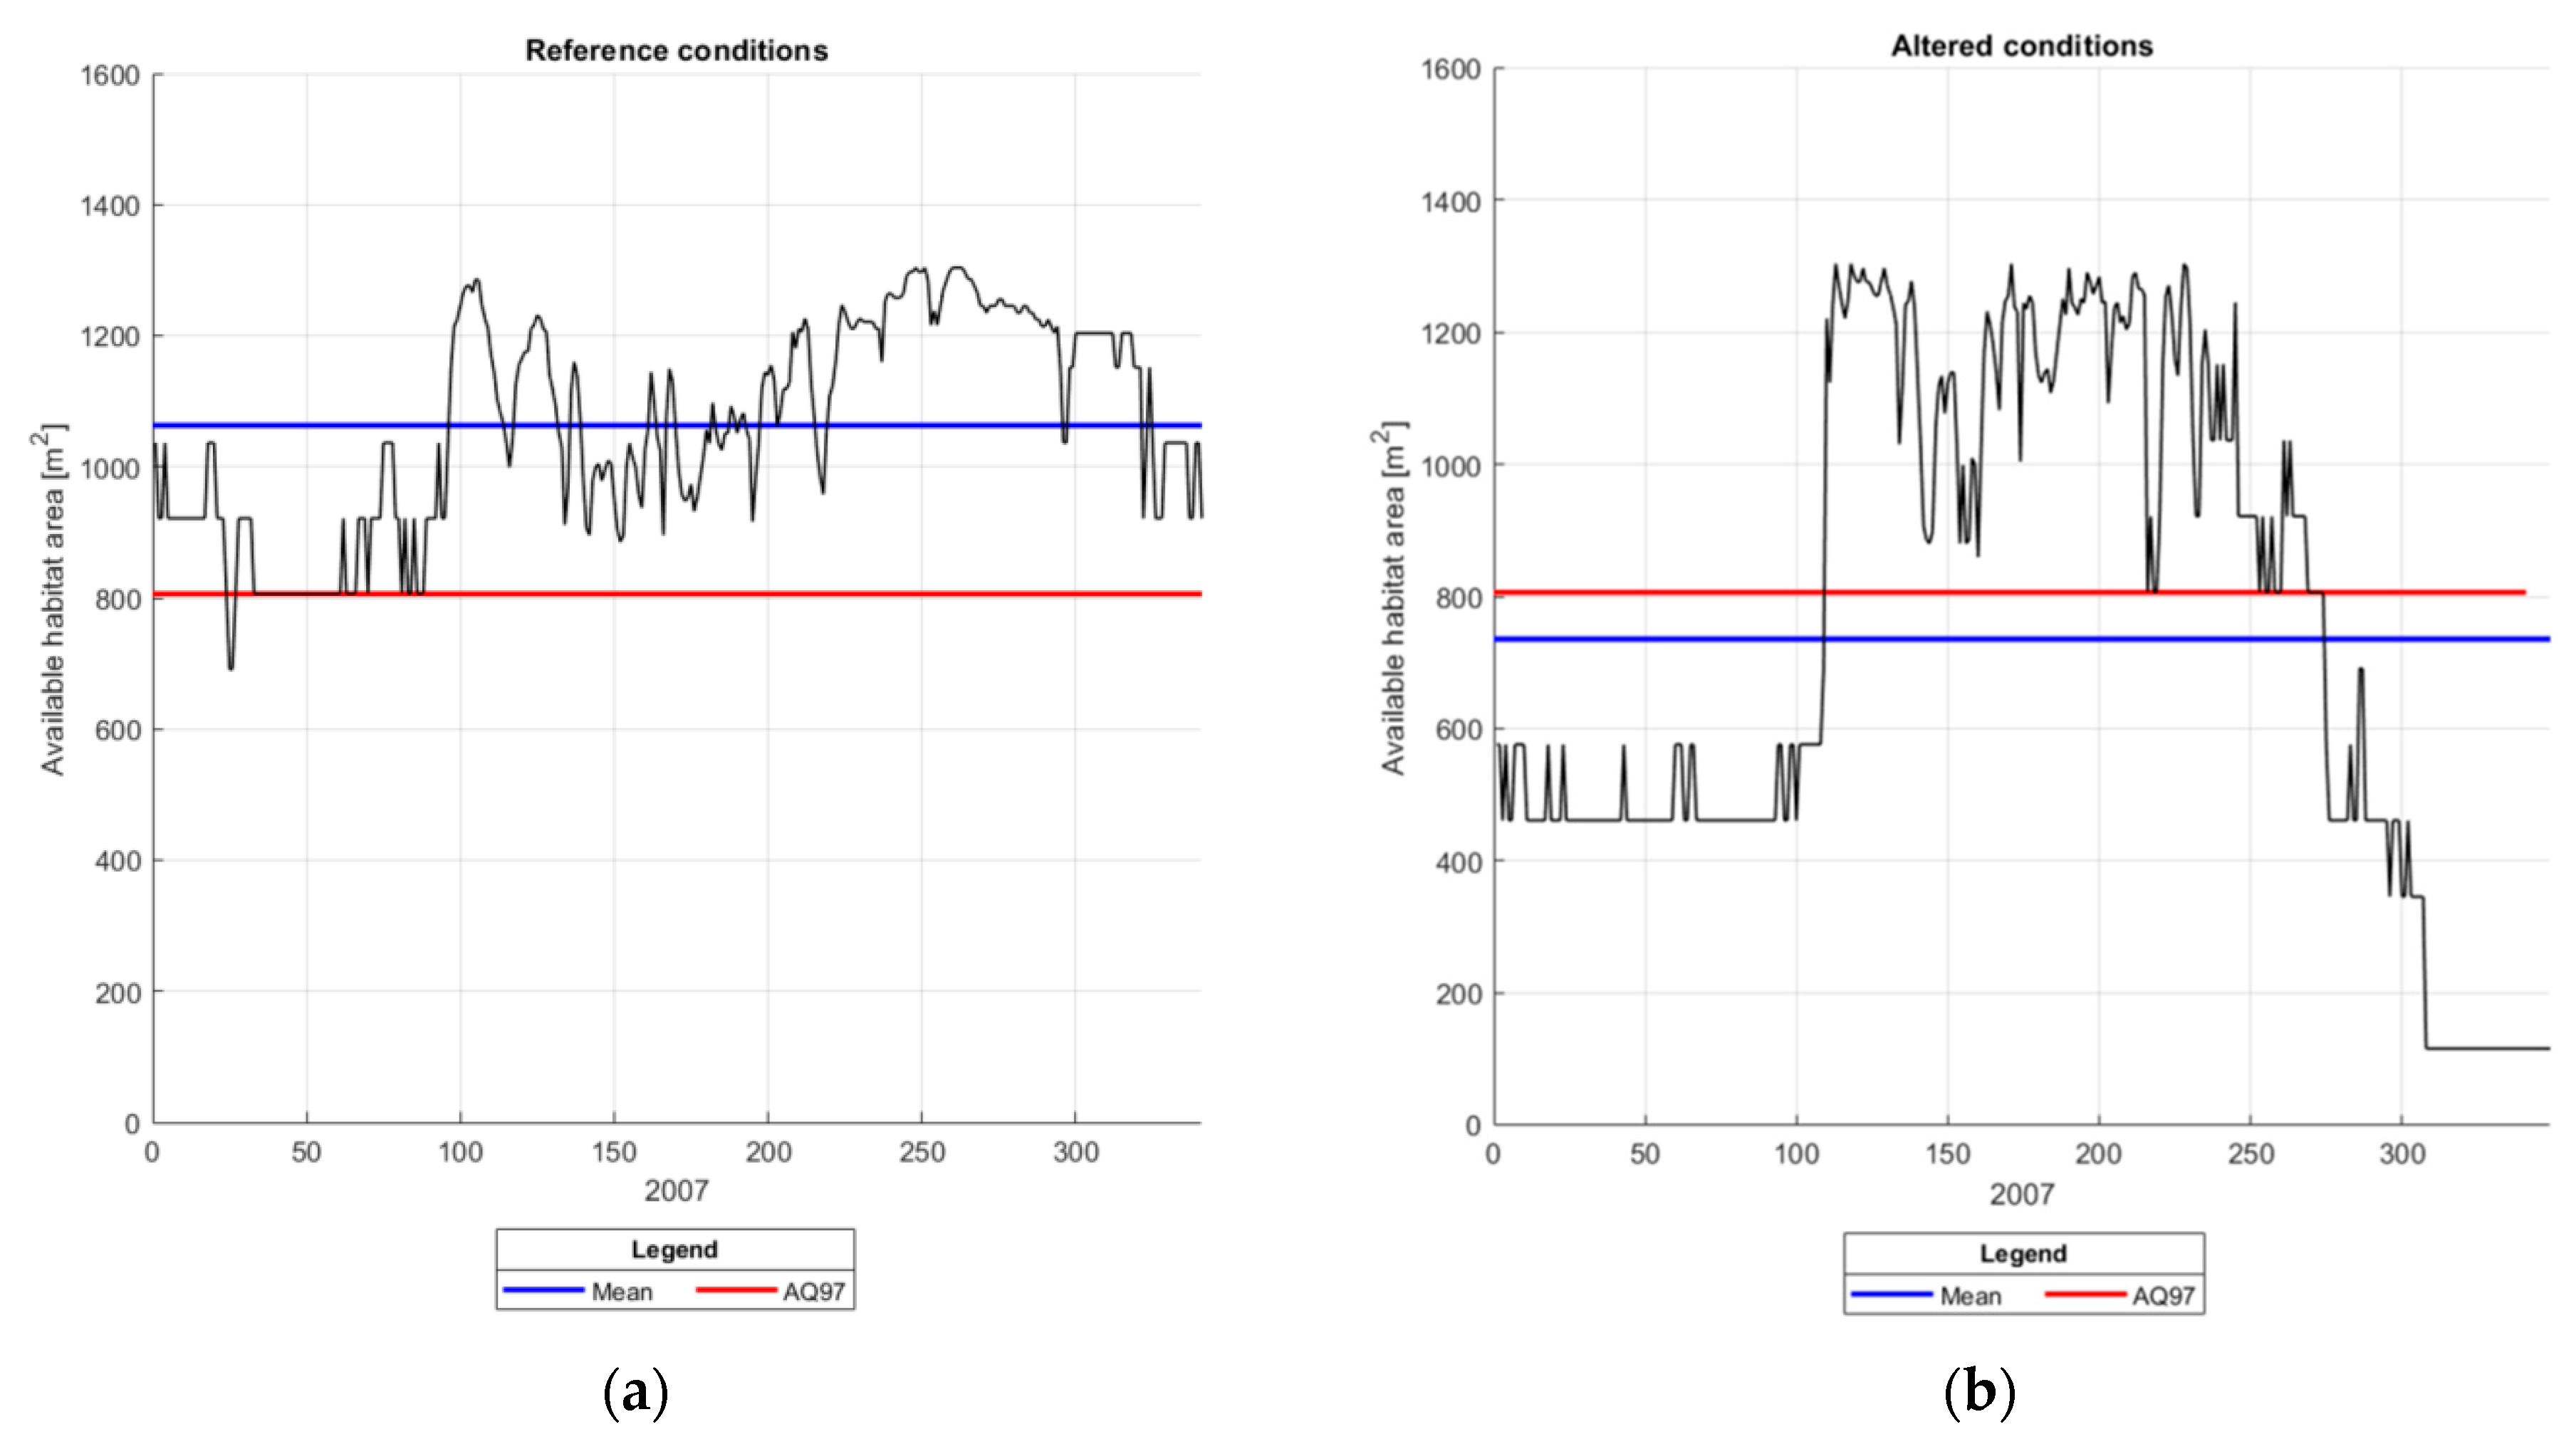
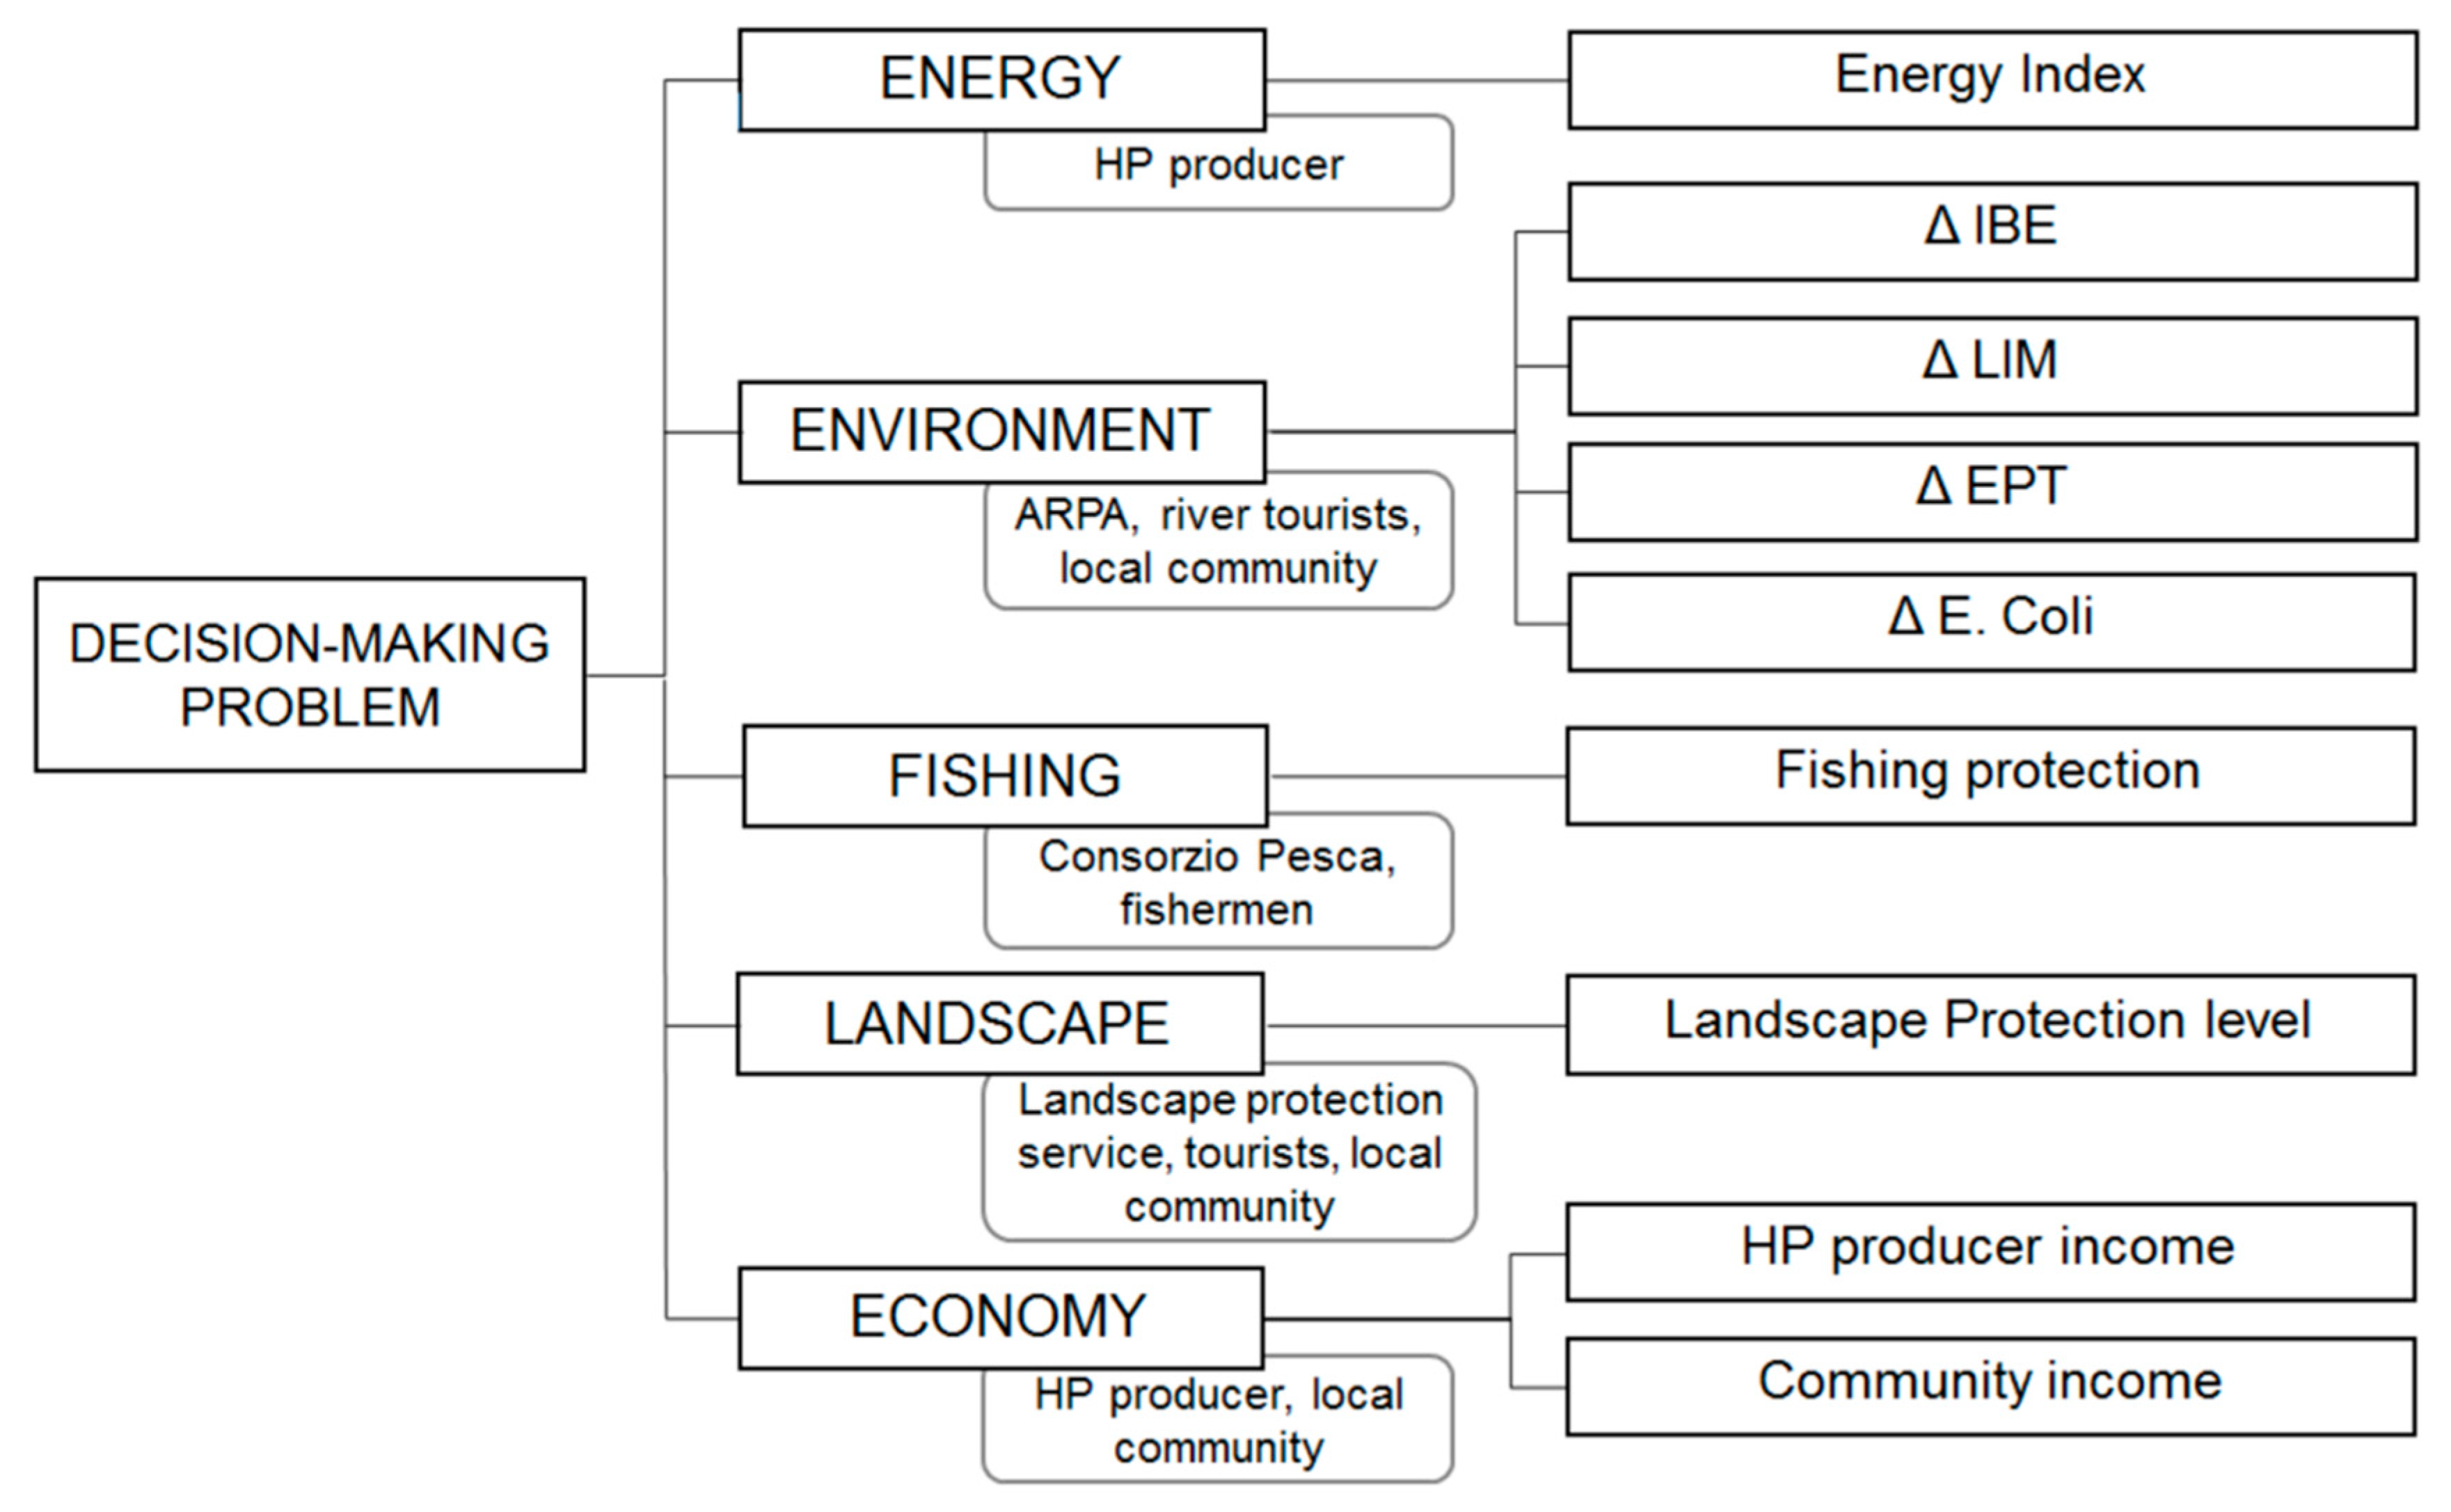
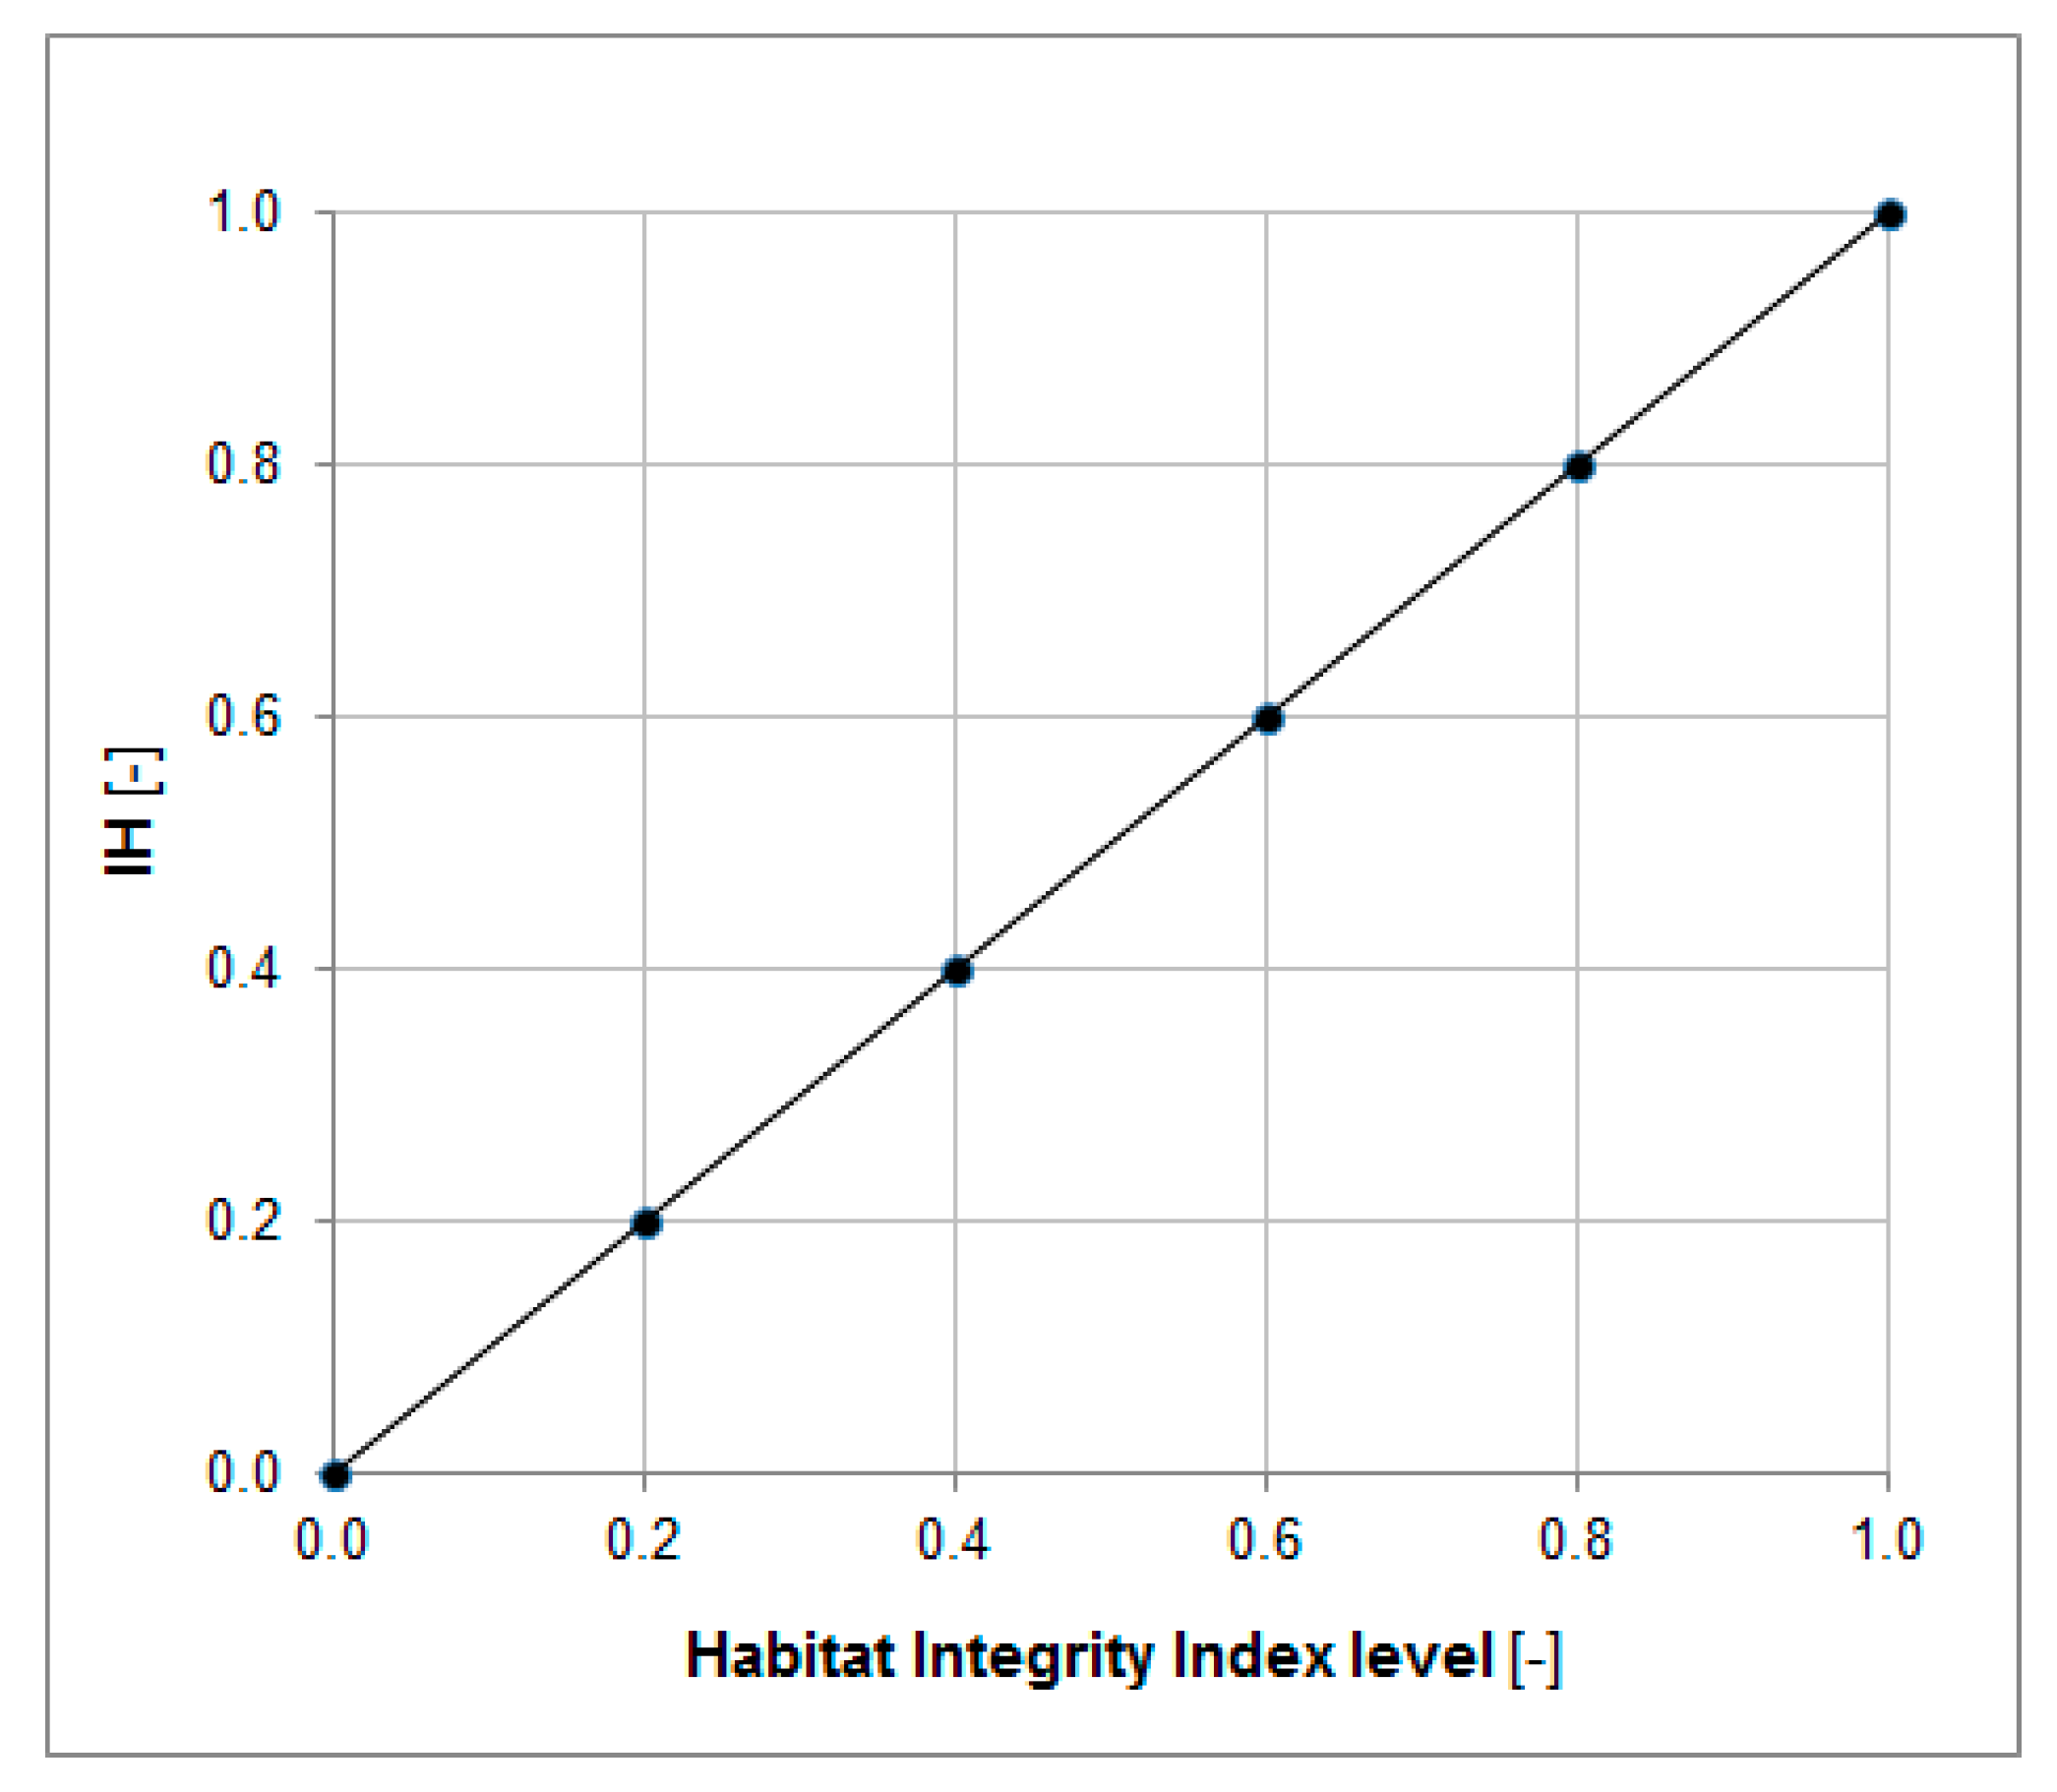
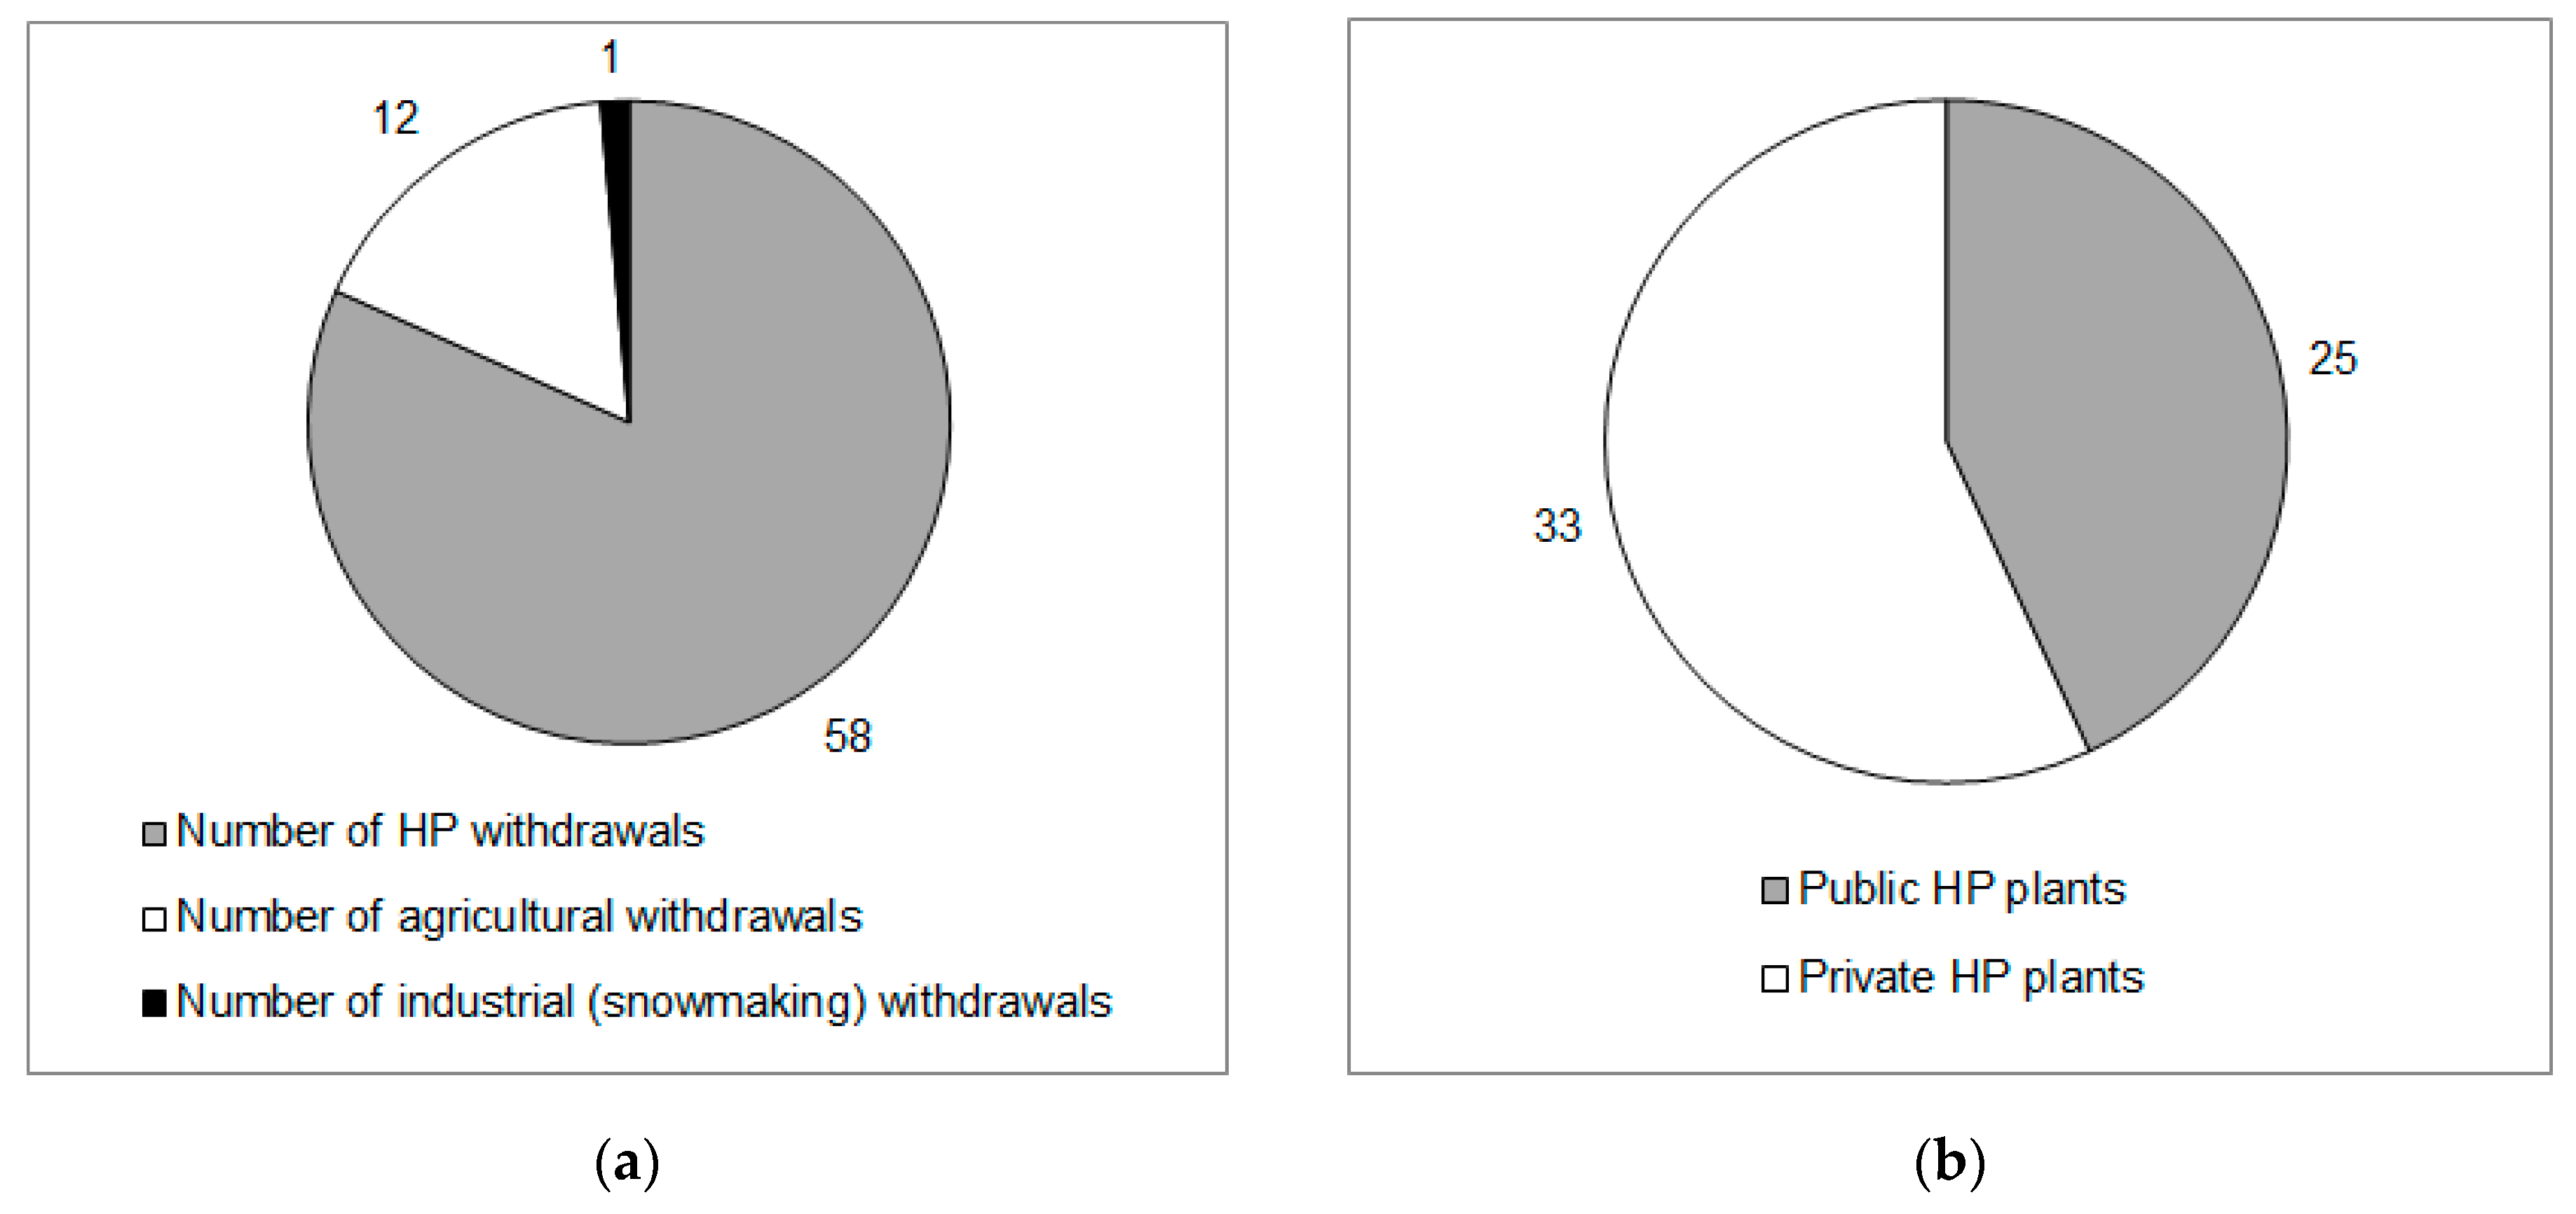