Article

Photodegradation of Ciprofloxacin and Levofloxacin by Au@ZnONPs-MoS2-rGO Nanocomposites

1
Division of Natural Sciences, Technology and Environment, Universidad Ana G. Méndez, Cupey Campus, San Juan, PR 00926, USA
2
Materials Characterization Center Inc., Molecular Sciences Research Center, University of Puerto Rico, San Juan, PR 00926, USA
3
Department of Biochemistry, School of Medicine, University of Puerto Rico, Medical Sciences Campus, San Juan, PR 00936, USA
4
Nanomaterials Research Group, Department of Natural Sciences and Technology, Universidad Ana G. Méndez, Gurabo Campus, Gurabo, PR 00778, USA
5
Department of Chemistry, University of Puerto Rico, Rio Piedras Campus, San Juan, PR 00925, USA
6
Department of Applied Physics, Autonomous University of Madrid and Instituto de Ciencia de Materiales Nicolás Cabrera, 28049 Madrid, Spain
7
IFToMM-ARoTMM, Bucharest Polytechnic University, 060042 Bucharest, Romania
*
Authors to whom correspondence should be addressed.
Catalysts 2023, 13(3), 538; https://doi.org/10.3390/catal13030538
Submission received: 21 January 2023 / Revised: 28 February 2023 / Accepted: 5 March 2023 / Published: 7 March 2023
(This article belongs to the Special Issue Nanomaterials for Photocatalysis II)

Abstract

:
This study aimed to investigate the photocatalytic performance of diverse zinc oxide catalysts containing gold nanoparticles (AuNPs), molybdenum disulfide (MoS2), and reduced graphene oxide (rGO) toward the degradation of the antibiotics levofloxacin (LFX) and ciprofloxacin (CFX) in aqueous solutions. The obtained results demonstrate that LFX is more resistant to degradation when compared with CFX and that the principal route of degradation under visible light is the formation of hydroxyl radicals. Photoluminescence (PL) measurements were employed to verify the inhibitory effect of electron–hole recombination when AuNPs, MoS2, and rGO are integrated into a semiconductor. The catalyst that achieved the highest percentage of CFX degradation was 1%Au@ZnONPs-3%MoS2-1%rGO, exhibiting a degradation efficiency of 96%, while the catalyst that exhibited the highest percentage of LFX degradation was 5%Au@ZnONPs-3%MoS2-1%rGO, displaying a degradation efficiency of 99.8%. A gas chromatography–mass spectrometry (GC-MS) analysis enabled the identification of reaction intermediates, facilitating the determination of a potential degradation pathway for both antibiotics. Additionally, recyclability assessments showed that the synthesized catalysts maintained stable photocatalytic efficiencies after 15 cycles, indicating that the heterostructures have the potential for further usage and may be tested with other organic contaminants as well.

1. Introduction

On 15 November 2022, the world’s population reached a significant milestone of eight billion people [1]. This reality presents a challenge for governments worldwide, as they must strive to sustainably produce and secure food, water, and energy for their countries [2,3,4]. Water quality and availability has been a major concern in recent decades [5], particularly with the emergence of new organic and inorganic pollutants [6]. Among organic contaminants, the detection of trace amounts of fluoroquinolone antibiotics, such as ciprofloxacin (CFX) and levofloxacin (LFX), in natural water bodies has raised alarm bells in the scientific community [7,8]. The consumption of these antibiotics can lead to side effects such as nausea, diarrhea, abdominal pain, rash, low sugar levels, and antibiotic resistance to bacterial infections, among others [9,10]. In 2019, it was estimated that more than 1.27 million people died due to antibiotic-resistant bacterial infections [11], and if the trend continues, this number is expected to rise to 10 million by 2050 [12]. As a result, scientists have developed new ways to degrade antibiotics in water over the years. A method that has been implemented for some time is the use of photocatalysts for the degradation of these compounds in water [13]. Semiconductors, such as titanium oxide (TiO2), zinc oxide (ZnO), zinc sulfide (ZnS), cadmium sulfide (CdS), strontium peroxide (SnO2), or tungsten trioxide (WO3), among others, are commonly used in photocatalytic processes [14,15,16]. Zinc oxide has been widely used due to its low cost, stability in aqueous solution, easy production, and environmentally friendly nature [17,18]. However, it has been identified that some of the disadvantages of ZnO as a photocatalyst are photocorrosion, the recombination of electron–hole pairs, fast backward reactions, and the inability to use visible light [18]. Over the years, multiple approaches have been implemented to reduce these limitations. One of them is the use of noble metals, such as platinum (Pt), gold (Au), or even silver (Ag), as cocatalysts [15,16,17,19]. These metals can increase the photocatalytic activity by reducing the recombination of electron–hole pairs and also allow the use of visible light [20]. For instance, Quin and coworkers [21] prepared a bio-inspired hierarchical assembly of carbonized spinach leaves@Au/ZnO for the degradation of CFX under visible light. The results showed a degradation of 61% of the antibiotic within a period of 180 min. Chankhanittha et al. [22] developed different Ag@ZnO composites for the complete degradation of red dye and the antibiotic ofloxacin in 25 and 80 min, respectively. The researchers attributed the improved photoactivity to the high electron–hole separation efficiency at the photocatalyst interface, as well as to the creation of a Schottky barrier at the silver–zinc oxide interface. Another material that has been gaining a lot of attention in recent years is molybdenum disulfide (MoS2). Some of the advantages of using MoS2 as a cocatalyst are its high abundance, good stability, high catalytic activity, and low cost [23]. To the best of our knowledge, no studies using ZnO/MoS2 for the degradation of antibiotics in water have been conducted, but different groups have implemented these composites for the degradation of other organic pollutants. Ahamad and coworkers [24] reported an 84.5% degradation of the pesticide dicotol in 90 min, using heterostructured nanocomposites containing MoS2/ZnO nanoparticles embedded in nitrogen/sulfur-doped graphite carbon. They attributed the results to the formation of active photogenerated species such as OH•, •O2, and e. Other heterostructured hybrid layered ZnO and MoS2 nanosheet composites have been synthesized by Benavente and coworkers [25] and tested for the degradation of methylene blue under direct solar light. The composites were able to degrade 75% of the dye after 300 min of irradiation, and this behavior was justified based on the fact that MoS2 played a key role in decreasing the bandgap of the heterostructure.
Similar to noble metals and MoS2, reduced graphene oxide (rGO) has been used as a cocatalyst for degrading organic pollutants in water. rGO is an excellent functional material in various fields, such as hydrogen production, optics, electronics, and photocatalysis, due to its large specific surface area, chemical stability, high electrical conductivity, and absorptivity [26].
Arya and colleagues [27] developed different heterostructures based on rGO-Bi2WO6 for degrading LFX under visible light at room temperature. The photocatalysts exhibited a degradation efficiency of 74.3% in 120 min. The researchers attributed the improvement in photocatalytic activity to a reduction in the recombination rate of photoexcited charge carriers due to the introduction of graphene, which served as a charge carrier.
Another research group [28] developed ternary nanocomposites based on rGO-BiVO4-ZnO for CFX degradation using visible light radiation. In this case, they observed a 98.4% degradation after 60 min, attributing the results to charge transfer and excellent electron–hole separation via rGO doping.
In this research, taking into account all the advantages of the aforementioned materials, we developed nine catalysts based on heterostructures composed of Au nanoparticles on ZnO nanoparticles, MoS2, and rGO nanosheets. These catalysts were tested for the catalytic photodegradation of CFX and LFX in an aqueous solution. The amounts of Au and MoS2 varied between 1% and 5% by weight, while the amount of rGO was kept constant at 1% w/w. The final composites were identified as follows: 1%Au@ZnONPs-1%MoS2-1%rGO, 3%Au@ZnONPs-1%MoS2-1%rGO, 5%Au@ZnONPs-1%MoS2-1%rGO, 1%Au@ZnONPs-3%MoS2-1%rGO, 3%Au@ZnONPs-3%MoS2-1%rGO, 5%Au@ZnONPS-3%MoS2-1%rGO, 1%Au@ZnONPS-5%MoS2-1%rGO, 3%Au@ZnONPs-5%MoS2-1%rGO, and 5%Au@ZnONPs-5%MoS2-1%rGO. The catalysts underwent characterization using several techniques including Brunauer–Emmett–Teller (BET) surface area analysis, field-emission scanning electron microscopy (FESEM), high-resolution transmission electron microscopy (HRTEM), X-ray diffraction (XRD) analysis, Raman spectroscopy, X-ray photoelectron spectroscopy (XPS), diffuse reflectance, and gas chromatography–mass spectrometry (GC-MS).

2. Results and Discussion

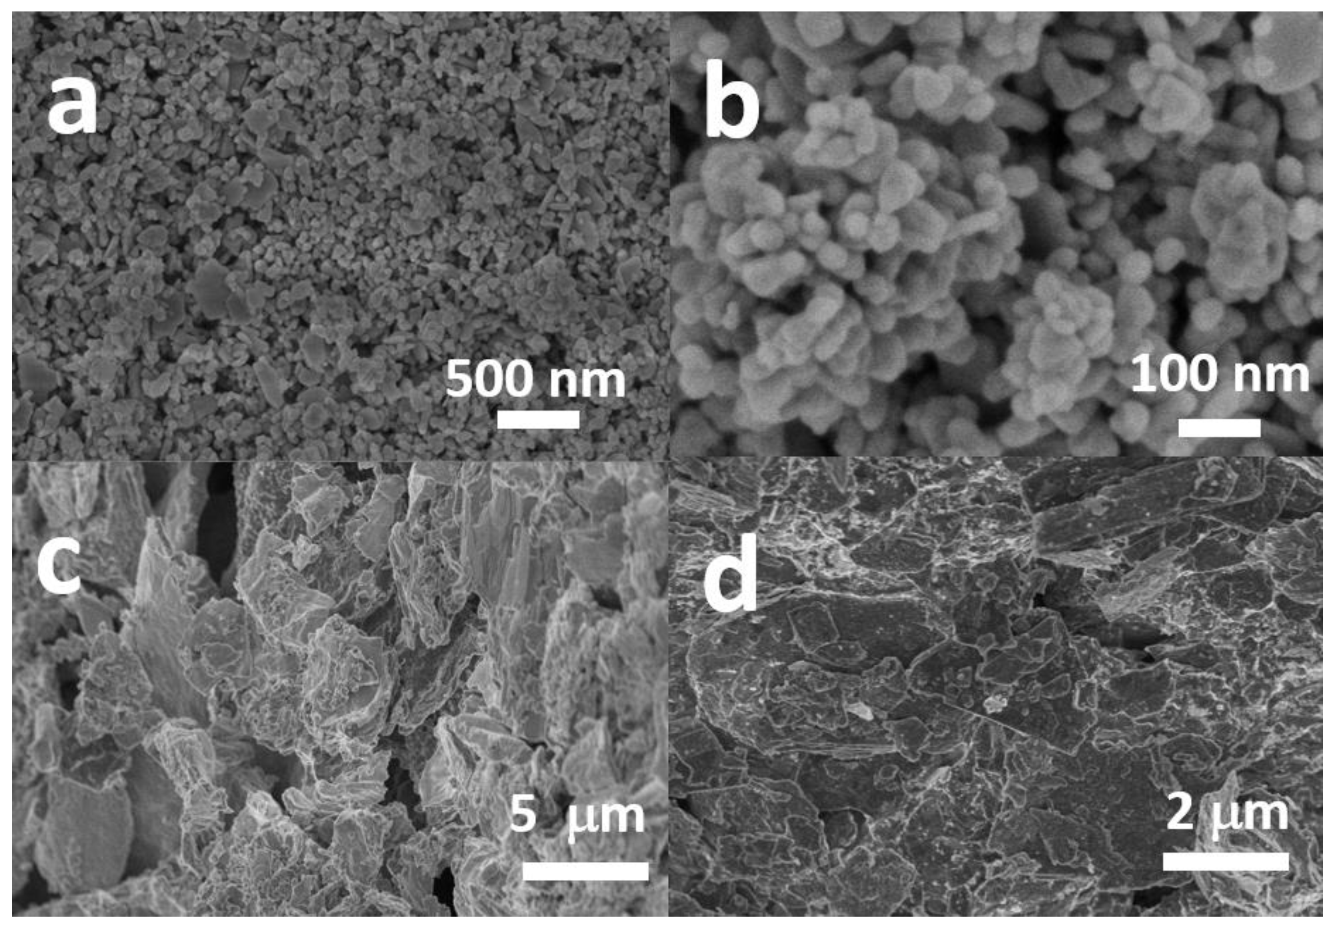
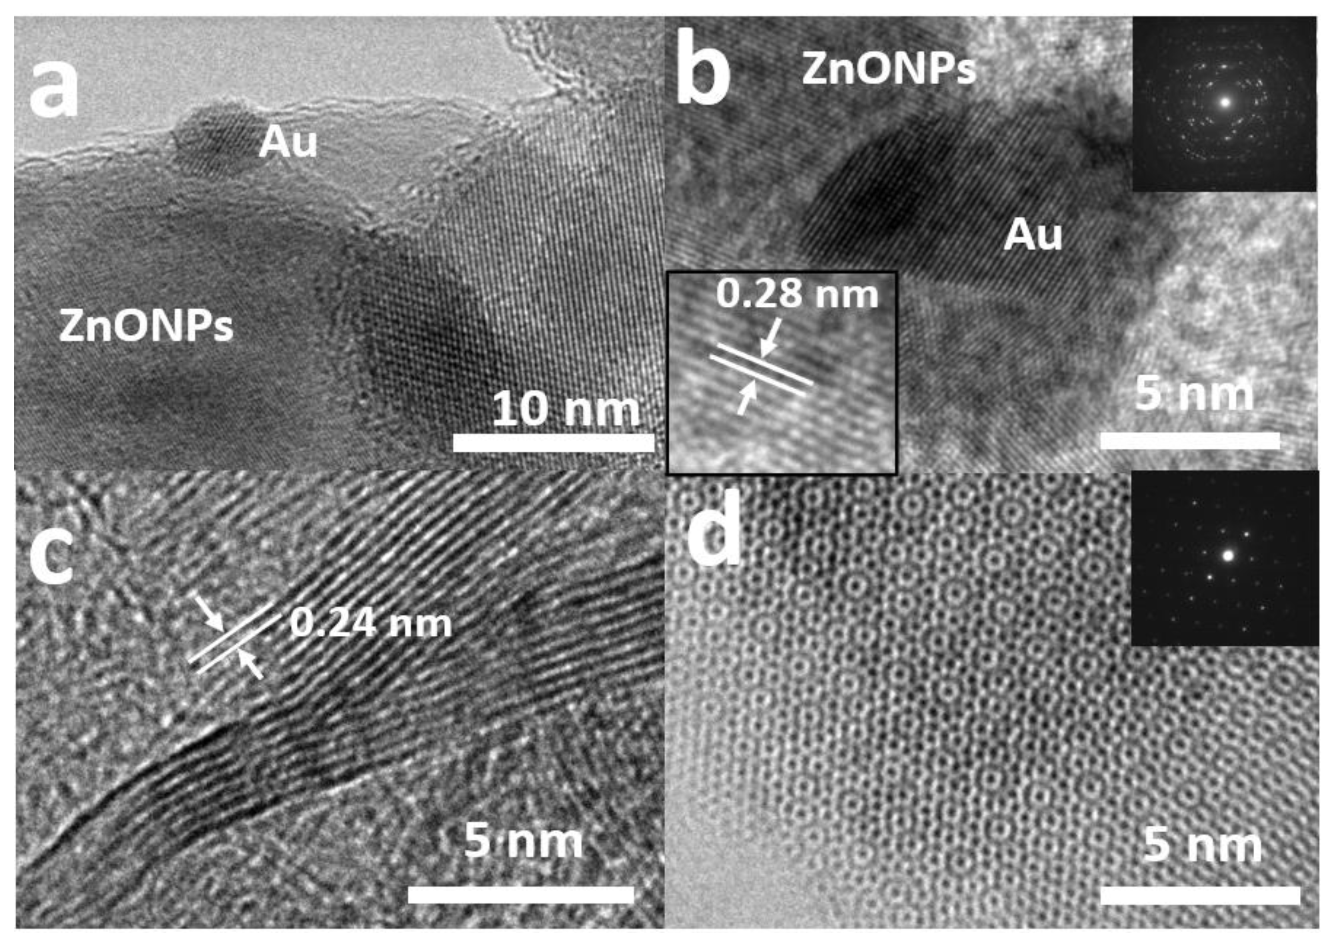
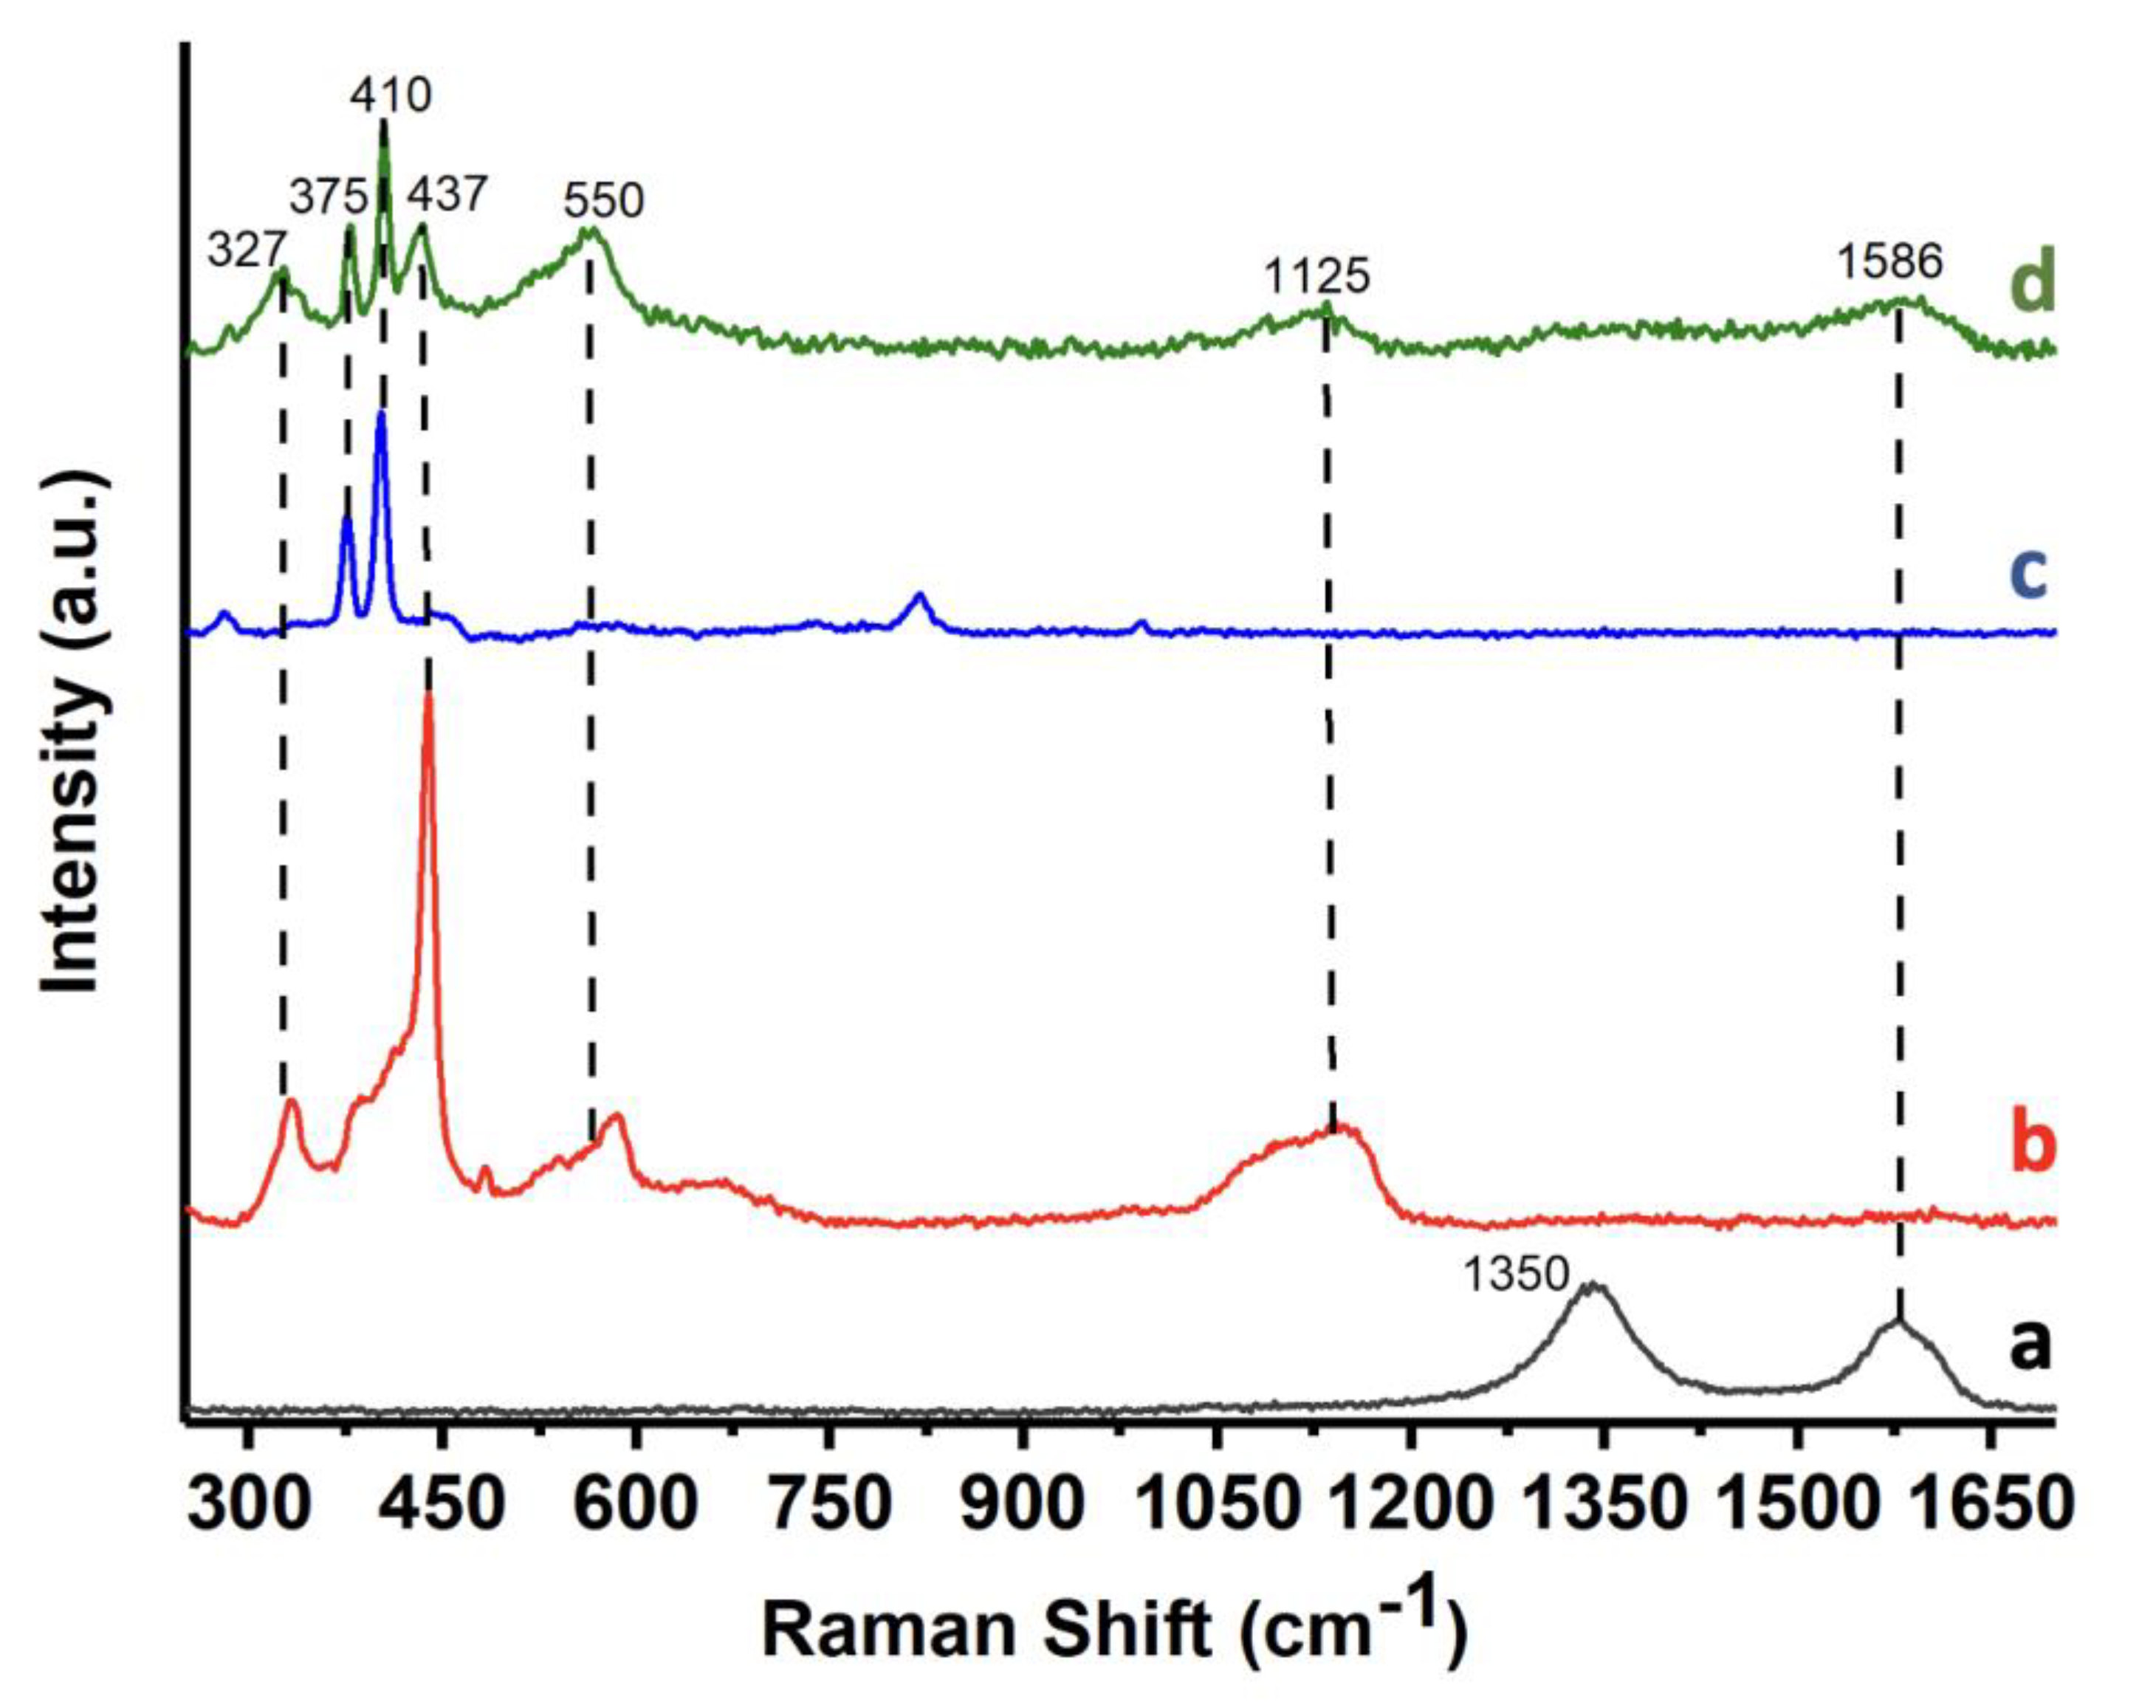
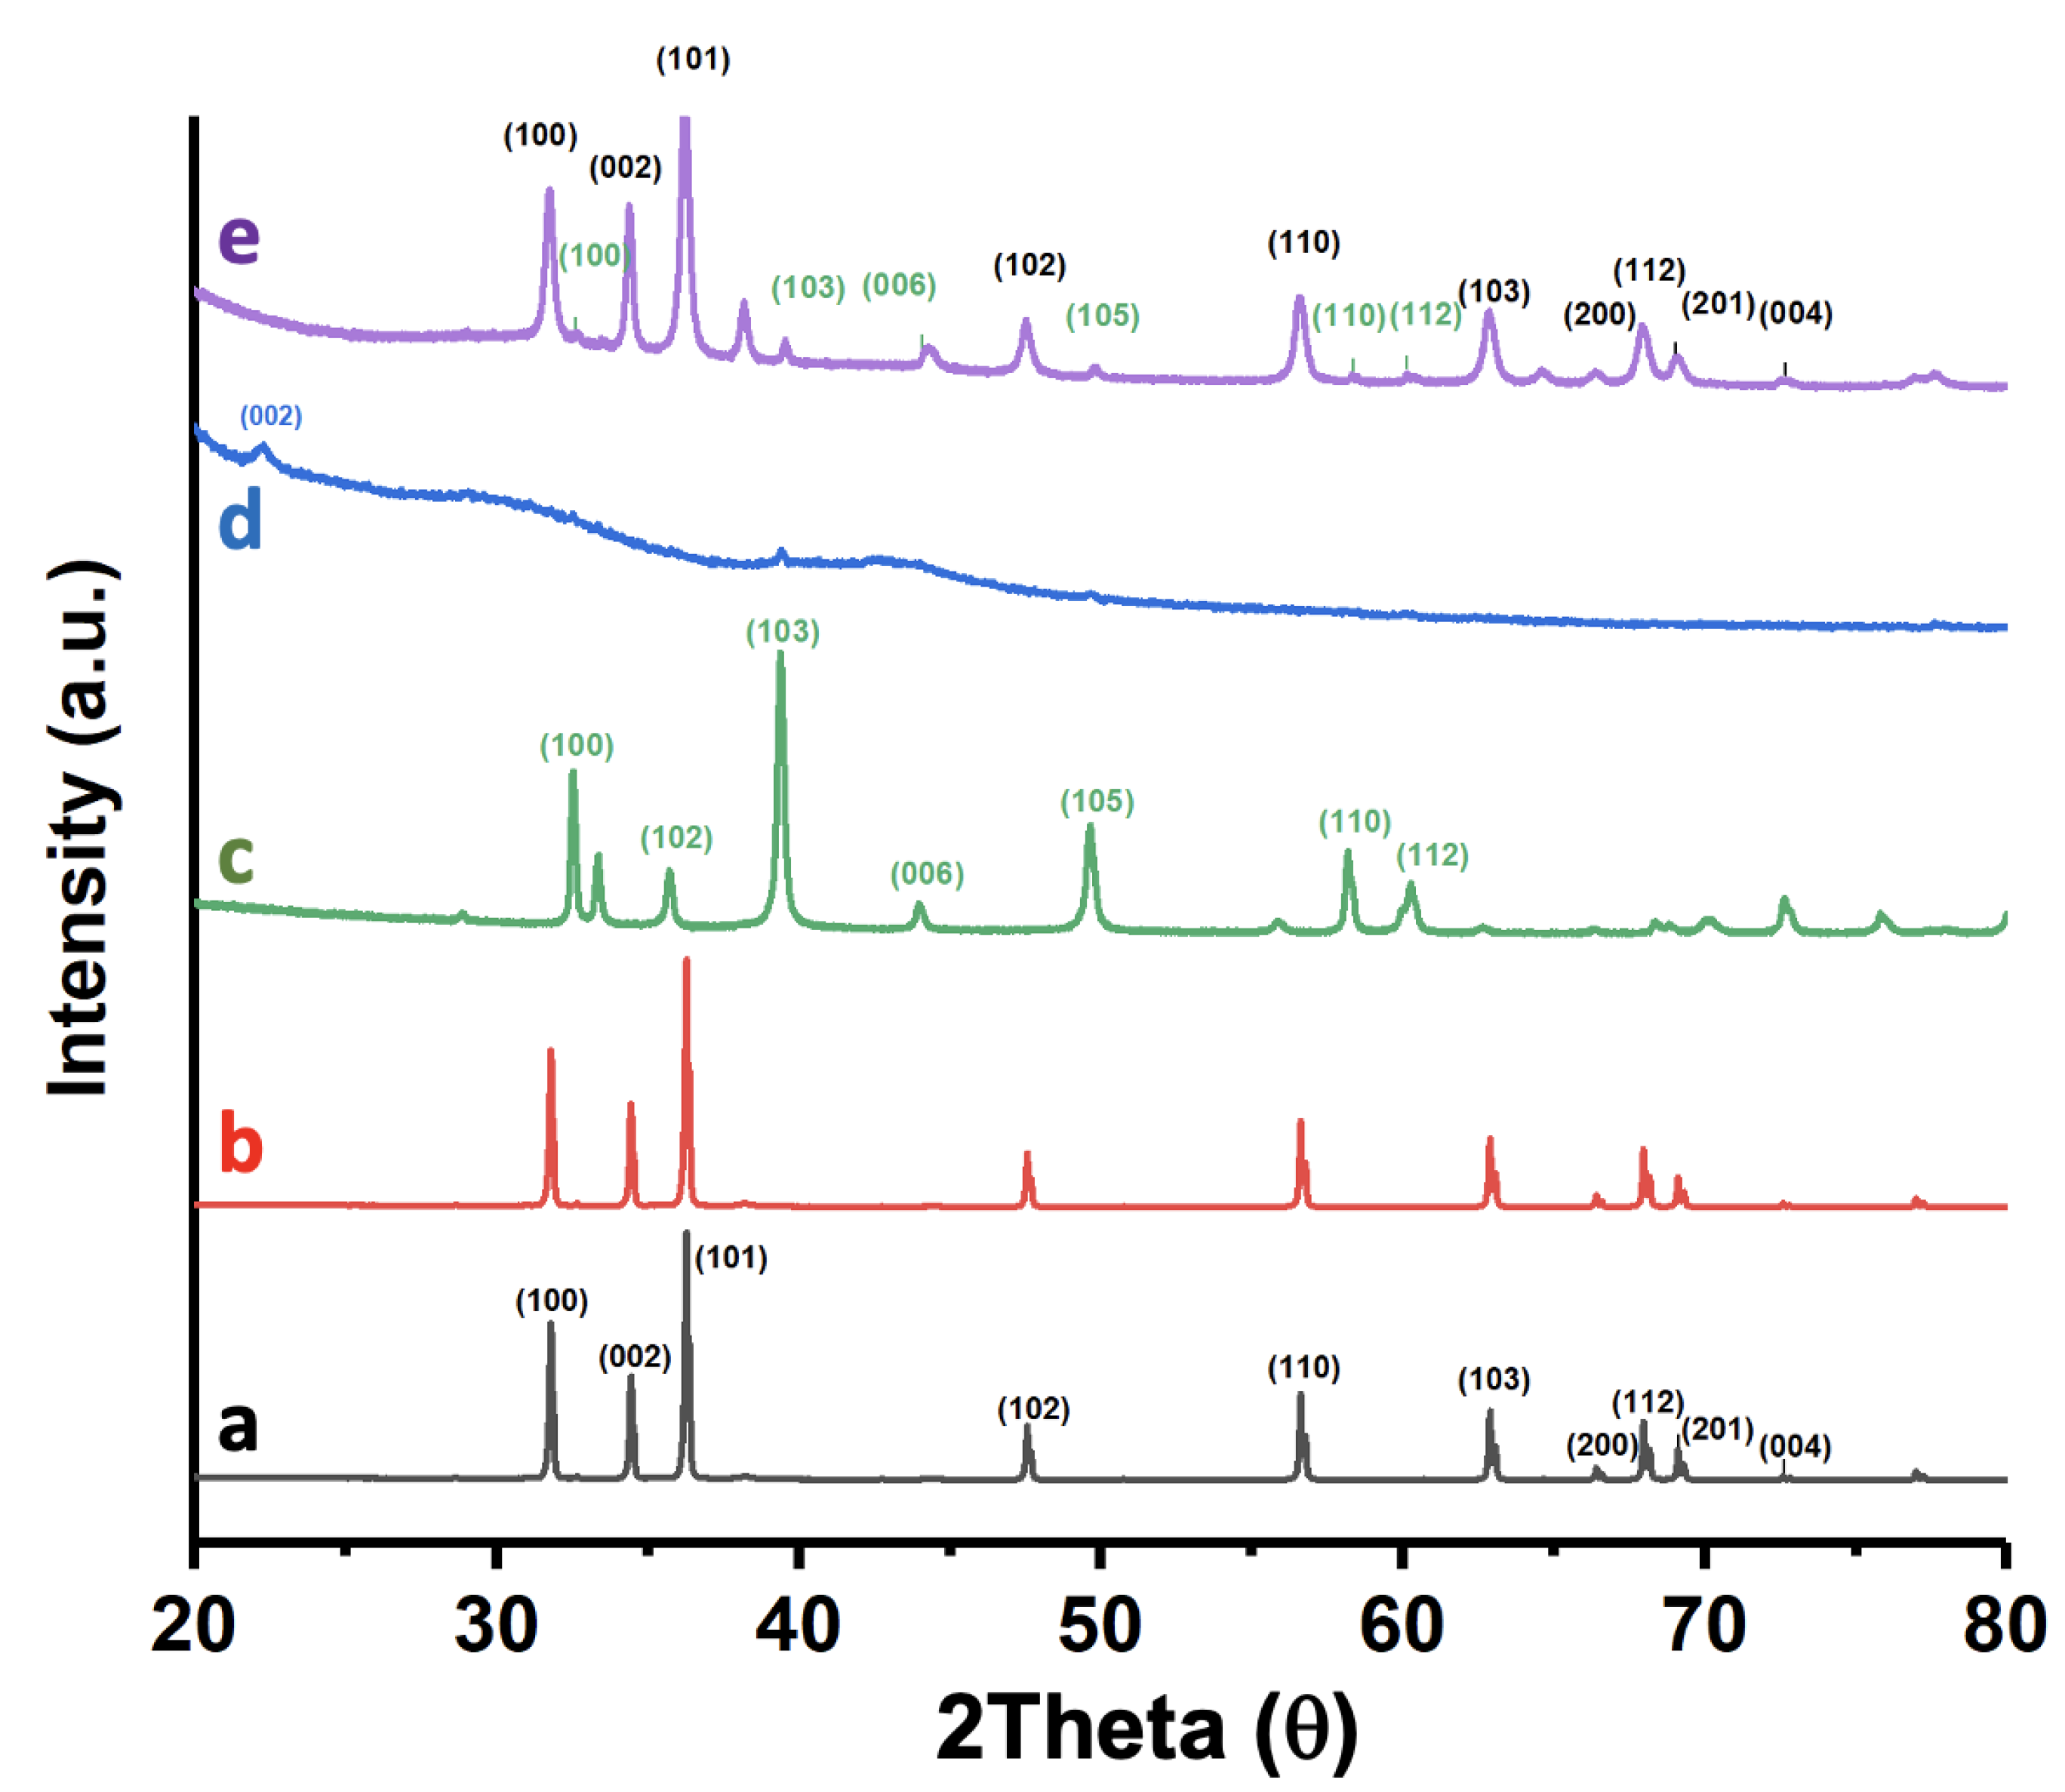
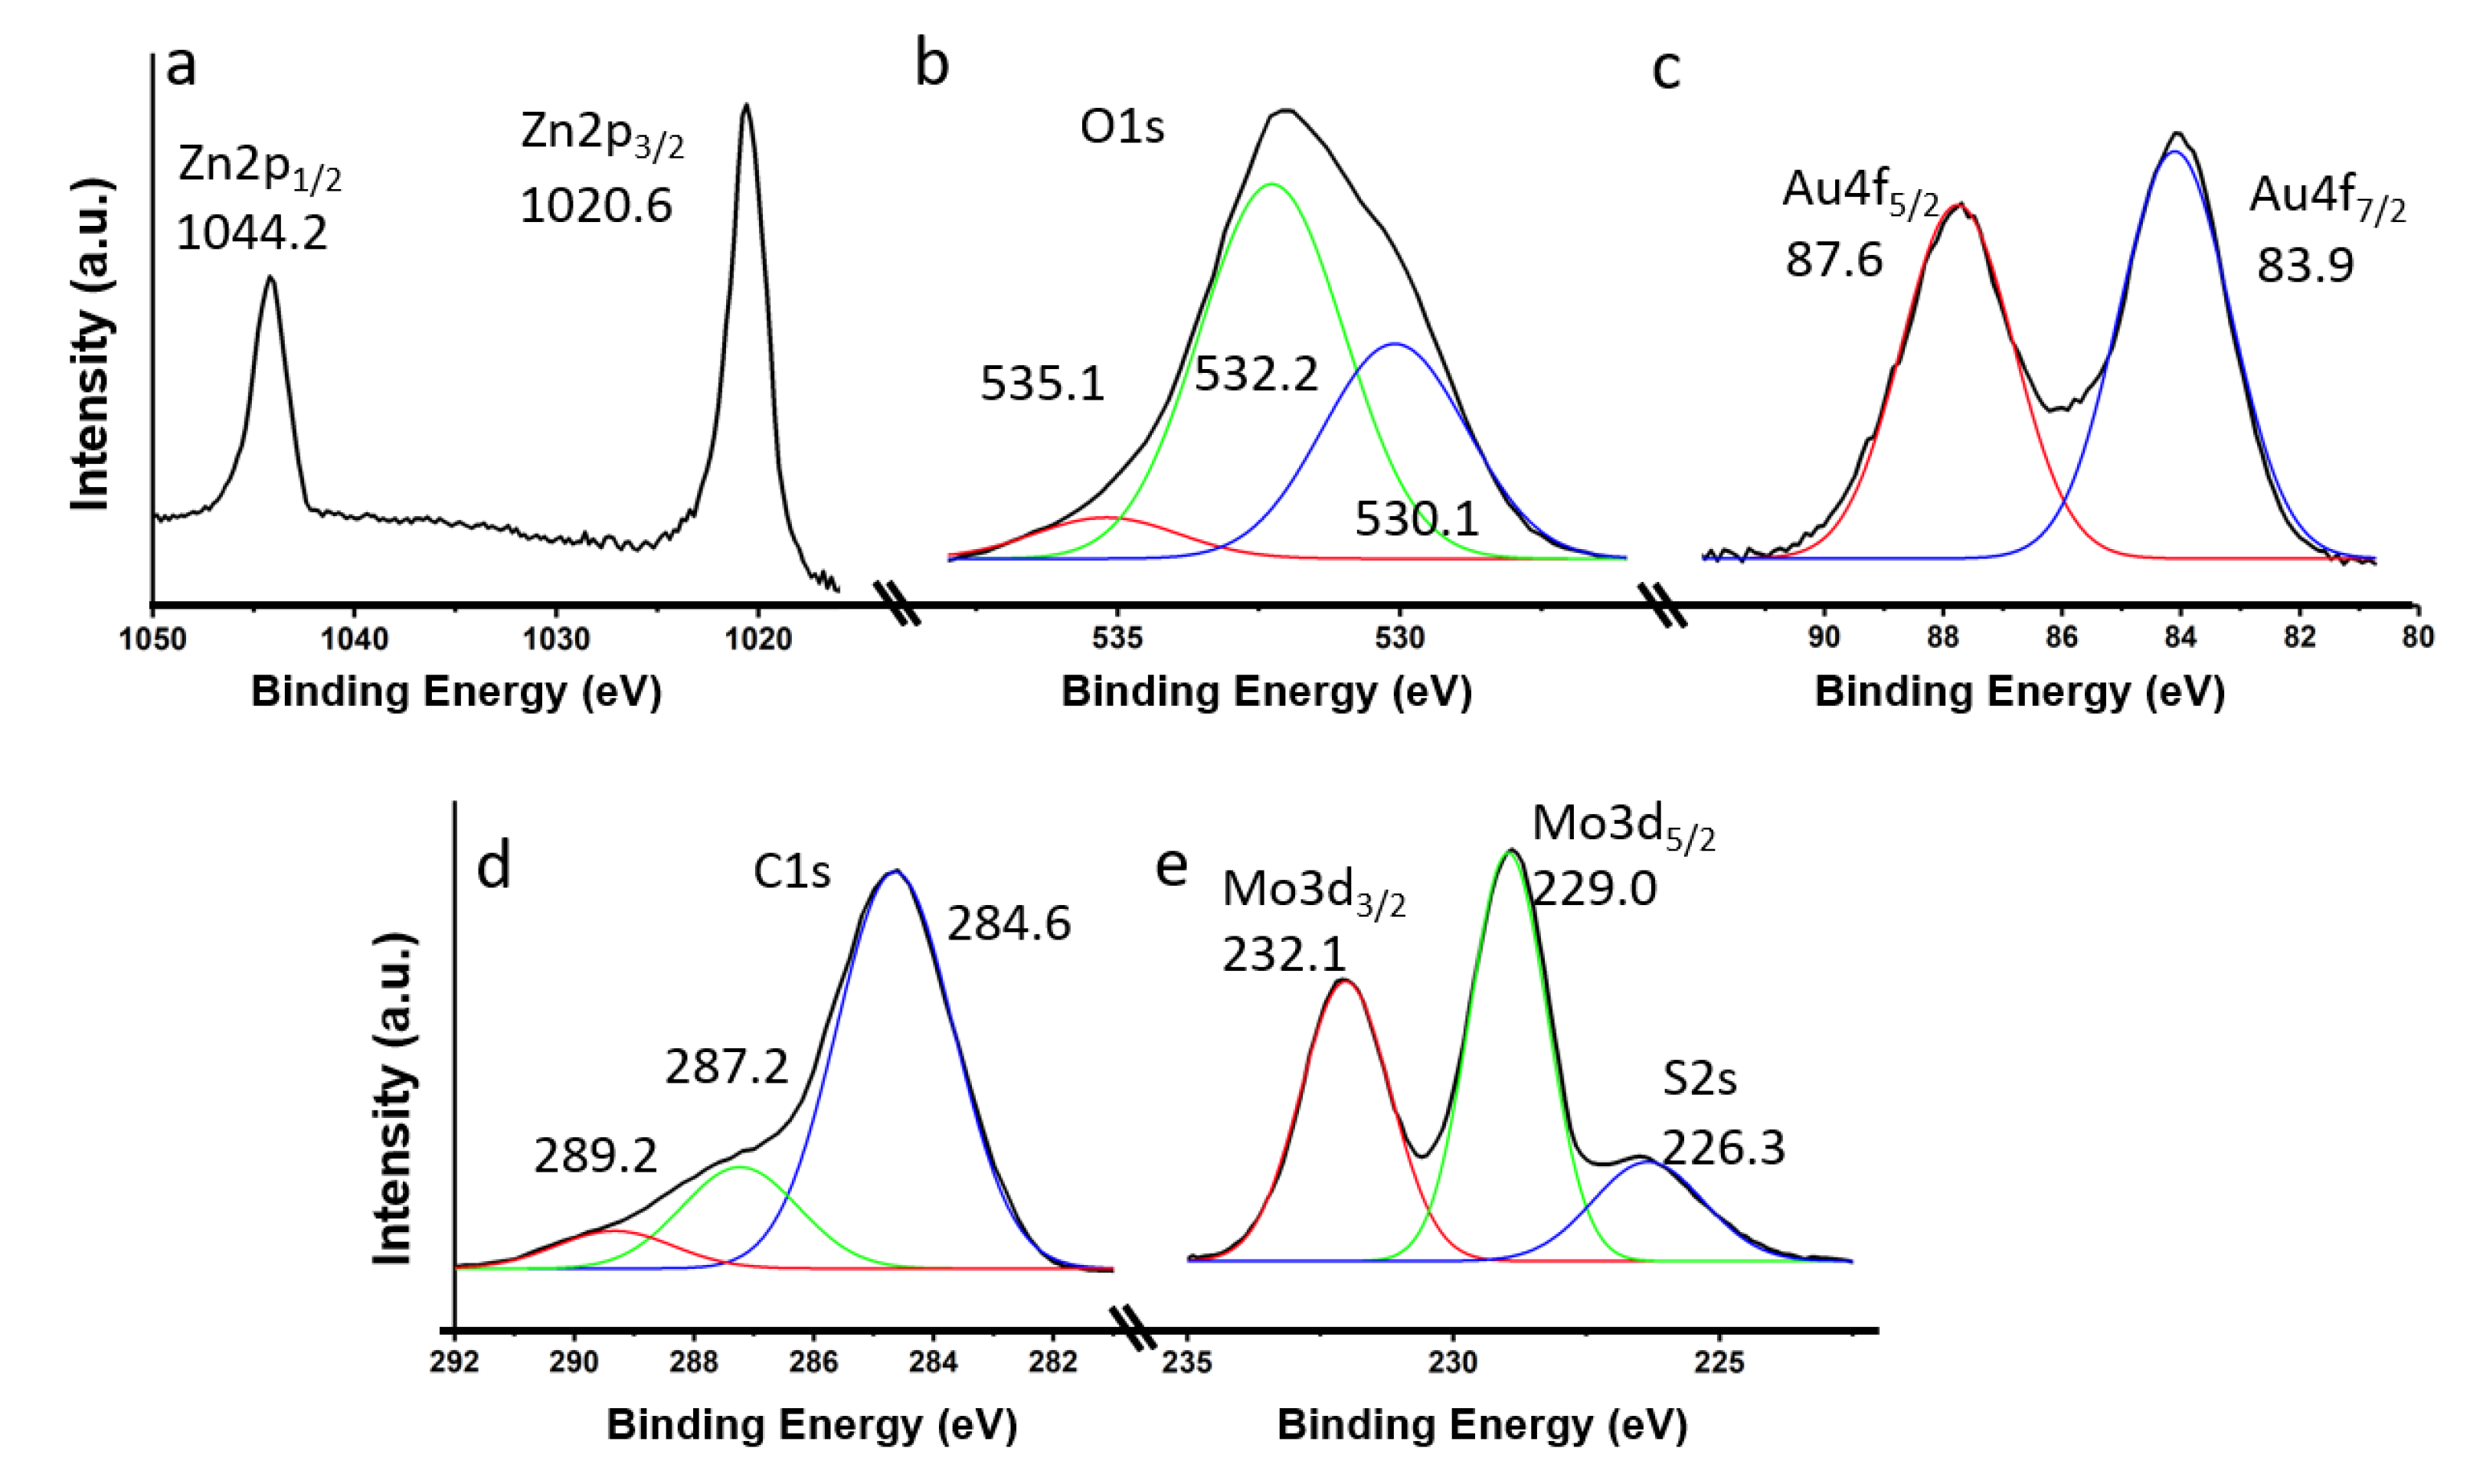
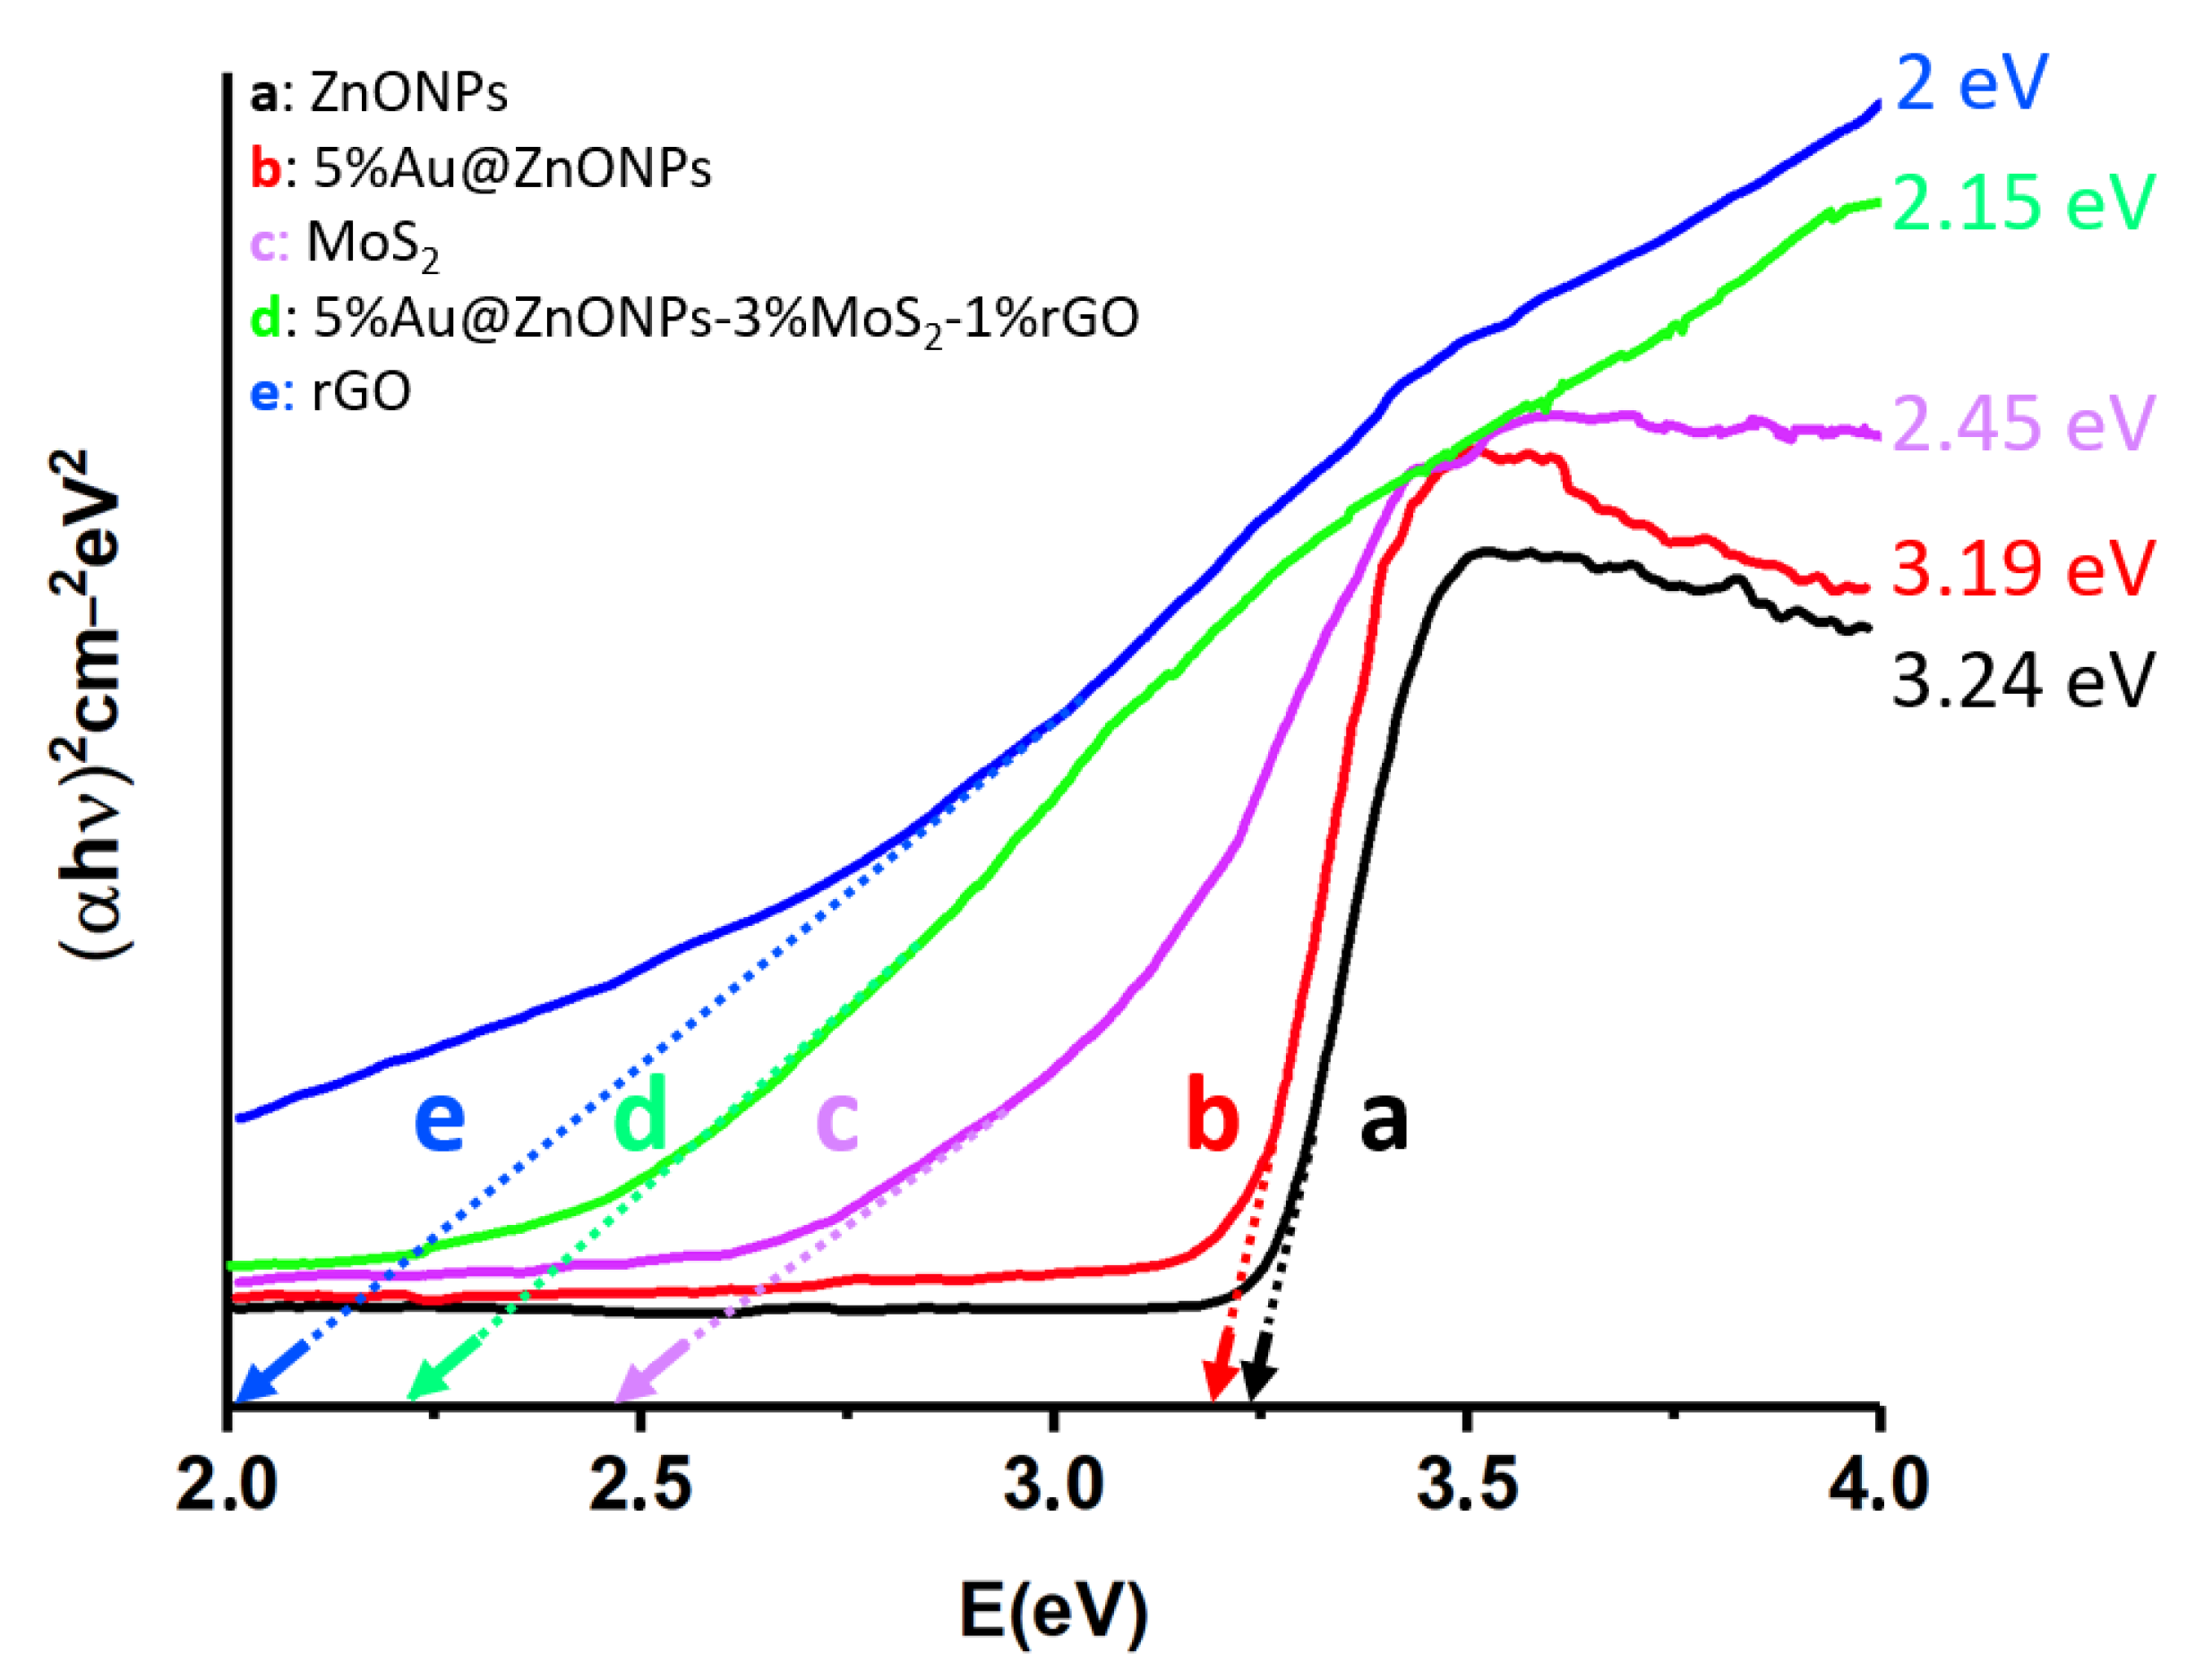
2.1. Characterization of the Photocatalysts

The synthesized photocatalysts were subject to characterization, followed by an assessment of their photocatalytic activity by means of the degradation of LFX and CFX in an aqueous solution. The most efficient photocatalyst in the degradation of LFX, 5%Au@ZnONPs-3%MoS2-1%rGO, was then selected for comprehensive characterization.
The BET surface areas of the catalysts were determined and are presented in Table S1. The bare ZnONPs exhibited a surface area of 67 m2 g−1, which increased with the addition of Au nanoparticles, MoS2, and rGO nanosheets. This phenomenon of surface area augmentation due to the incorporation of other cocatalysts has been documented previously [14,15,16,17]. The results indicate a trend wherein a higher percentage of Au and MoS2 led to an increase in the surface area of the catalyst. Specifically, the 5%Au@ZnONPs-5%MoS2-1%rGO composite manifested the highest surface area, measuring 151 m2 g−1, representing a difference of 84 m2 g−1 compared with bare ZnONPs.
The precursors of the catalysts were characterized using field-emission scanning electron microscopy, FESEM (see Figure 1). The ZnONPs at different magnifications (Figure 1a,b) show inhomogeneous particles with diameters ranging from ca. 15 to 20 nm. rGO (Figure 1c) consists of inhomogeneous particles formed by sheets that pack very close together, with different diameters (ca. 1 μm to 5 μm), similar to what has been observed in other works [29]. The MoS2 was previously delaminated via ultrasound treatment in an aqueous solution (Figure 1d). As expected, the delaminated MoS2 exhibits a layered structure with sizes ranging from ca. 1 µm to 6 µm [30].
Figure 2 shows the high-resolution transmission electron microscopy (HRTEM) images of the precursors. Figure 2a,b shows the ZnONPs after the incorporation of AuNPs. As can be seen therein, the ZnONPs are highly crystalline, showing distinct lattice fringes with an interplanar spacing of ca. 0.28 nm (inset of Figure 2b), corresponding to the d-spacing of the [001] planes [14]. This is consistent with the results shown using the selected-area electron diffraction (SAED) in the inset of Figure 2b, as well as with the XRD analysis to be discussed later. The AuNPs also present high crystallinity, with diameters of ca. 10 nm (Figure 2a,b). Figure 2c corresponds to the rGO micrograph, clearly showing the lattice fringes with an interplanar distance of ca. 0.24 nm, which represents the d-spacing of the [002] planes [31]. The atomic structure of a highly exfoliated MoS2 is shown in Figure 2d. The SAED of MoS2 (inset of Figure 2d) indicates a highly crystalline material. It is possible that due to the ultrasound exfoliation process, some structural defects may have been generated. The presence of these defects has not yet been verified, but it could influence the activity of the catalysts.
Figure 3 shows the Raman spectra of rGO, ZnONPs, MoS2, and the 5%Au@ZnONPs-3%MoS2-1%rGO catalyst. rGO (Figure 3a) shows 2 peaks at 1350 cm−1 and 1586 cm−1, corresponding to the D and G bands, respectively, and represent the presence of carbon atom lattice defects and in-plane stretching vibration from the sp2 hybridization of carbon [32]. The Raman spectrum of ZnONPs (Figure 3b) shows distinct peaks at approximately 327 cm−1, 437 cm−1, 550 cm−1, and 1125 cm−1. The 327 cm−1 band is attributed to the second-order Raman spectrum [14], while the 437 cm−1 band is assigned to the E2 modes of Zn motion, which correspond to the band characteristic of the wurtzite phase [14]. The 550 cm−1 band is assigned to the E1 mode, and it usually originates from second-order Raman scattering [33]. Finally, the band at 1125 cm−1 was assigned to overtones and/or combination bands [14]. The Raman spectrum of MoS2 (see Figure 3c) shows 2 characteristic bands at ca. 383 cm−1 and 407 cm−1, which were assigned to the E12g and A1g modes, respectively [30], being attributed to the exfoliation process and the formation of MoS2 flakes with few layers [34,35]. The 5%Au@ZnONPs-3%MoS2-1%rGO catalyst (Figure 3d) only showed the G-band of rGO, possibly due to the low concentration of rGO (1% by weight) in the sample. The Raman spectrum of the 5%Au@ZnONPs-3%MoS2-1%rGO catalyst (Figure 3d) displayed the four characteristic bands of ZnONPs, although with lower intensities and some minor modifications. These differences are attributed to the interaction of the ZnONPs with the other additives. The spectrum also revealed the presence of the two principal MoS2 bands, indicating the incorporation of MoS2 into the composite. The detection of the significant peaks of all the catalyst components confirms the heterostructured nature of the composite.
Figure 4 depicts the X-ray diffraction (XRD) pattern of the 5%Au@ZnONPs-3%MoS2-1%rGO catalyst, alongside those of ZnONPs, 5%Au@ZnONPs, MoS2, and rGO for comparative purposes. The diffraction peaks of the ZnONPs (Figure 4a) can be unambiguously indexed to the ZnO phase of hexagonal wurtzite [36], whose reflections are dominant in the diffraction pattern of the 5%Au@ZnONPs-3%MoS2-1%rGO catalyst, as observed in Figure 4e. The incorporation of 5%AuNPs (Figure 4b) does not result in the appearance of a new peak at approximately 38.1°, corresponding to Au (111), possibly due to the high dispersion of the metal [37]. The material MoS2 (depicted in Figure 4c) exhibits multiple diffraction peaks located approximately at 32°, 36°, 39°, 49°, and 58°, which were identified as the (100), (102), (103), (105), and (110) crystalline planes of the 2H-type MoS2 hexagonal phase (JCPDS # 75-1539) [30,38,39]. In contrast, rGO (illustrated in Figure 4d) displays a diffraction peak at around 23.8°, assigned to the (002) crystal plane. This peak indicates that a significant proportion of the oxygen functional groups, which are characteristic of graphene oxide, have been eliminated in the reduced material [40,41]. Furthermore, rGO shows a second diffraction peak located close to 40°, which is identified as the (100) plane of the hexagonal carbon structure. The peak is observed at a slightly lower angle than the anticipated angle of 43°. The different diffraction peaks corresponding to the most active catalyst are displayed in Figure 4e. To facilitate the identification of the constituents, the same color code has been used. As can be observed, the most prominent components are evident in the catalyst, although, as seen in Figure 4b, no peak corresponding to gold is detected.
The representative elements of the most efficient catalyst (5%Au@ZnONPs-3%MoS2-1%rGO) were characterized using X-ray photoelectron spectroscopy (XPS). Zn2p (see Figure 5a) shows 2 components at 1044.2 eV and 1020.6 eV, with a characteristic spin–orbit splitting of 23.6 eV, that were ascribed to the Zn2p1/2 and Zn2p3/2 transitions of Zn2+, respectively [42,43]. Both transitions are very symmetrical, and the fitting to other possible states of Zn did not produce results, so any additional contribution was ruled out. Figure 5b shows the transition corresponding to O1s. The transition is clearly asymmetric, and it is possible to deconvolute it into 3 components at ca. 530.1, 532.2 eV, and 535.1 eV. The peak at ca. 530.1 eV was assigned to O2- species in the ZnO network, and the one observed at 532.2 eV was assigned to O2- in oxygen-deficient regions, respectively [44]. Graphene oxide (rGO) should show a component below 530 eV, although this contribution should be masked by the peak at 530.1 eV. The component observed at the highest binding energy (535.1 eV) must correspond to the species generated by the interaction of the ZnO nanoparticles with rGO. It should be noted that O1s components have been detected in rGO at a binding energy above 535 eV, although their origin remains unclear [16]. The transition for Au4f, as shown in Figure 5c, displays peaks at 83.9 eV and 87.6 eV, which were attributed to Au4f7/2 and Au4f5/2, respectively. Both peaks, along with a characteristic spin–orbit splitting of 3.7 eV, demonstrate the presence of metallic gold [45]. The C1s spectrum, illustrated in Figure 5d, is markedly asymmetric and is deconvoluted into 3 components at approximately 284.6, 287.2, and 289.2 eV, respectively. The most significant contribution is observed at around 284.6 eV and was assigned to the sp2 carbon of rGO. The remaining 2 components, observed at approximately 287.2 and 289.2 eV, can be attributed to C-OH and O=C-OH, respectively, and are likely due to the presence of structural defects in rGO resulting from the graphite exfoliation process and subsequent reduction of graphene [46,47]. The Mo3d and S2s transitions are illustrated in Figure 5e. The Mo3d transition displays 2 well-defined and symmetrical peaks at 232.1 and 229.0 eV, respectively, which were identified as the Mo3d3/2 and Mo3d5/2 doublet, respectively, and assigned to the Mo4+ state in MoS2 [46,47]. The observed peak at approximately 226.4 eV corresponds to the contribution of S2s [47], which is characteristic of MoS2.
Diffuse reflectance spectroscopy was employed to characterize the different precursors and the most efficient catalyst (5%Au@ZnONPs-3%MoS2-1%rGO). The reflectance values in Kubelka–Munk units were obtained, and Tauc plots were generated to determine the bandgaps of the precursors and the most efficient catalyst (see Figure 6). It has been reported that the bandgap energy of the wurtzite crystalline phase of ZnO is approximately 3.37 eV [48], whereas the synthesized ZnONPs (Figure 6a) exhibited a value of 3.24 eV. This slight difference could be attributed to the morphology and particle size of the semiconductor [48]. Upon incorporating 5 wt.% of AuNPs onto bare ZnONPs, a reduction in the bandgap energy was observed, leading to a decrease in energy to 3.19 eV (as shown in Figure 6b). This reduction in the bandgap energy was previously reported and was expected [13,14,15]. Despite the decrease, the bandgap energy remains in the ultraviolet region of the electromagnetic spectrum [15]. The bandgap energy of MoS2 was found to be 2.45 eV, as shown in Figure 6c. This value is known to vary considerably, ranging from approximately 0.9 eV to values above 2.50 eV, depending on the degree of delamination and the number of layers of the material [49]. This variation has also been observed to depend on the degree of quantum confinement of the material along the c-axis [49]. The bandgap energy of reduced graphene oxide (rGO) was determined to be 2.00 eV, as shown in Figure 6e. It should be noted, however, that the degree of reduction can significantly impact this value, with reported bandgaps ranging from approximately 0.20 eV to 2.00 eV [50]. Both MoS2 and rGO possess the ability to absorb light in the visible region, thereby enhancing the catalytic properties of the composite and promoting energy absorption in the visible range. The bandgap energy of the most efficient catalyst (5%Au@ZnONPs-3%MoS2-1%rGO) was found to be 2.15 eV, as depicted in Figure 6d. This value suggests that the catalyst can efficiently utilize visible light for catalytic processes, as confirmed in the degradation studies that will be discussed later.

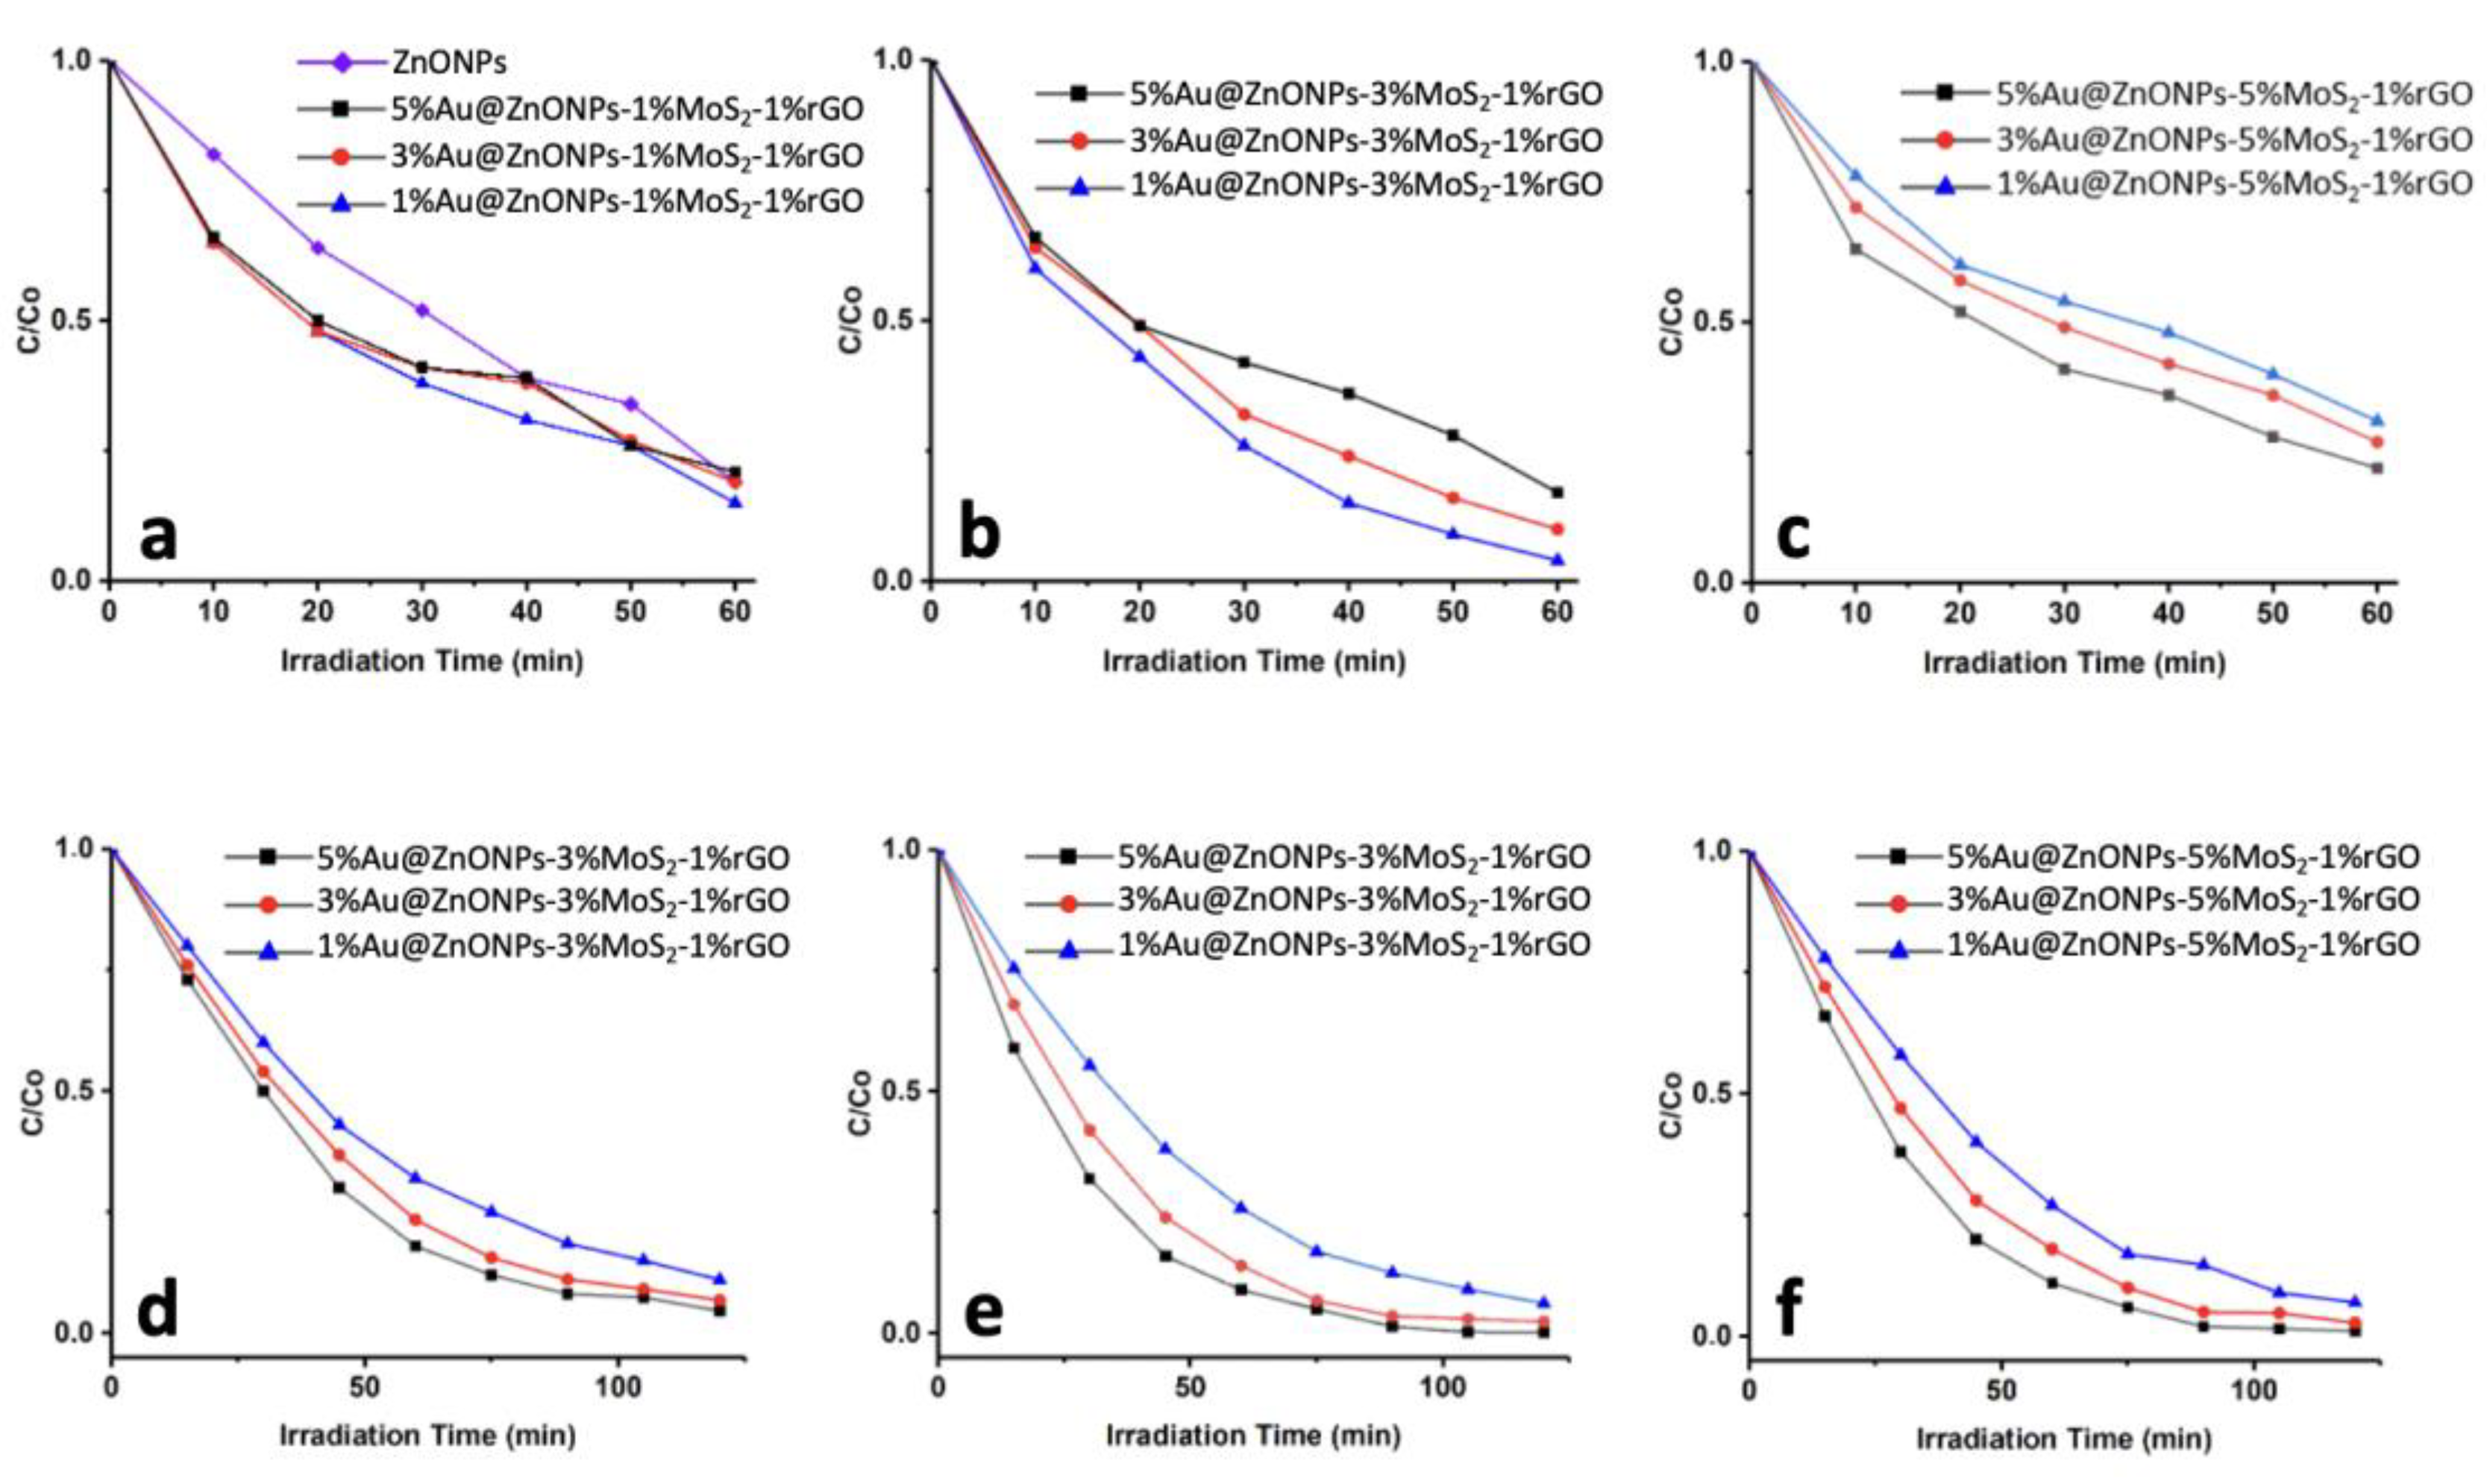
2.2. Photodegradation of Levofloxacin and Ciprofloxacin

The optimal conditions for LFX, including antibiotic concentration, catalyst loading, and pH, were determined using the 5%Au@ZnONPs-1%MoS2-1%rGO, 5%Au@ZnONPs-3%MoS2-1%rGO, and 5%Au@ZnONPs-5%MoS2-1%rGO catalysts, and the findings are available in the Supplementary Materials. In the case of CFX, these conditions have been previously determined in other studies by our research group [17,51].
Previous reports have indicated [18] that the concentration of the antibiotic must fall within a suitable range to enhance the interaction with the active sites of the catalyst while avoiding interactions between LFX molecules, which could potentially decrease the degradation rate. Therefore, the initial concentration of LFX was the first parameter investigated, as depicted in Figure S1. The catalyst loading and pH of the solution were set at 1.0 g/L and 7, respectively. As observed, the concentration of LFX ranged from 2 μM to 50 μM, with 10 μM being the concentration at which the 3 evaluated catalysts achieved the highest percentage of degradation. The photocatalytic activity increased from 2 μM to 10 μM, indicating a positive interaction between the catalyst and LFX. However, beyond 10 μM, the concentration began to decline, which was associated with the formation of byproducts during the photodegradation. These byproducts could compete for the catalyst’s active sites, reducing its efficiency. Furthermore, at higher concentrations, the catalyst’s surface can become saturated, resulting in a decrease in the degradation rate [18]. The catalyst with the highest percentage of degradation at 10 μM was 5%Au@ZnONPs-3%MoS2-1%rGO (99.8%), followed by 5%Au@ZnONPs-5%MoS2-1%rGO (98%), and 5%Au@ZnONPs-1%MoS2-1%rGO (95%).
In this study, the second parameter evaluated for LFX was the catalyst loading, which is a crucial factor that affects the degradation rate of the antibiotic (see Figure S2). The concentration of LFX was fixed at 10 μM, and the experiments were performed at pH=7. The amounts of the catalysts used varied from 0.2 g/L to 1.5 g/L, and the results show that the highest degradation percentage was obtained at 1.1 g/L for all 3 composites tested. It has been reported that the interaction between the antibiotic and the catalyst is enhanced at lower catalyst loadings, which could explain the observed trend. However, at higher loadings, a decrease in the degradation rate was observed, which could be attributed to the poor interaction between LFX and the catalyst and/or the scattering of irradiation due to the high amount of catalyst present in the solution. The catalyst with the highest degradation percentage was 5%Au@ZnONPs-3%MoS2-1%rGO (99.8%), followed by 5%Au@ZnONPs-1%MoS2-1%rGO (97.5%), and 5%Au@ZnONPs-5%MoS2-1%rGO (94.8%).
The third parameter examined was the effect of pH on LFX photodegradation (Figure S3). For this study, the most efficient catalyst, 5%Au@ZnONPs-3%MoS2-1%rGO, was used with a catalyst loading of 1.1 g/L and an LFX concentration of 10 μM. The pH was varied between 4 and 11, and the results show that pH 8 had the highest percentage of LFX degradation. At an acidic pH (<7), the photocatalytic process was unfavorable and attributed to the repulsive forces between the positively charged ZnO surface and LFX molecules [52]. At an alkaline pH (>7), the photodegradation rate increased until pH 8 and then slowly decreased until reaching pH 9 and 11, indicating attractive forces between the positively charged ZnO and the -OH ions present in the solution [52,53,54]. Therefore, the optimal conditions for LFX catalytic photodegradation were found to be an LFX concentration of 10 μM at pH 8 with a catalyst loading of 1.1 g/L. In the case of CFX photodegradation, the ideal conditions were previously determined in other studies by our research group [17,51], which consisted of 10 μM CFX at pH 7 with a catalyst loading of 1.0 g/L.
The degradation behavior of ciprofloxacin (CFX) and levofloxacin (LFX) as a function of time is depicted in Figure 7. It was observed that the photodegradation kinetics of both antibiotics were significantly influenced by the type of catalyst used. For CFX (Figure 7a–c), the degradation varied between 70% and 96% after 60 min. Among the catalysts tested, 1%Au@ZnONPs-3%MoS2-1%rGO produced the highest degradation percentage (96%), followed by 3%Au@ZnONPs-3%MoS2-1%rGO (90%), and 1%Au@ZnONPs-1%MoS2-1%rGO (86%). However, 5%Au@ZnONPs-5%MoS2-1%rGO exhibited the lowest degradation efficiency (70%). The observed results indicate that at higher percentages of AuNPs and MoS2, the degradation decreases. A possible explanation for this behavior could be that at higher loadings, AuNPs and MoS2 nanosheets can cause a slight scattering of the radiation. On the other hand, the agglomeration of the particles could improve the catalyst–catalyst contact instead of favoring the catalyst–CFX contact, which would imply a decrease in activity. [18]. In the case of LFX (Figure 7d–f), experiments were performed for 120 min instead of 60 min as conducted with CFX. This decision was made when the percentages of degradation of both antibiotics were compared at 60 min. In that time range, all catalysts could degrade 70–96% of CFX but only 65–80% of LFX. The results indicate that CFX is more readily degraded than LFX. This finding is consistent with previous reports [17], which suggest that factors such as pH and the chemical structure of the antibiotics can influence their susceptibility to degradation. The catalyst exhibiting the highest percentage of LFX degradation during a reaction time of 120 min was 5%Au@ZnONPs-3%MoS2-1%rGO, with a degradation rate of 99.8%, followed by 5%Au@ZnONPs-5%MoS2-1%rGO (99%), and 3%Au@ZnONPs-3%MoS2-1%rGO (98%). The catalyst with the lowest percentage of degradation was 1%Au@ZnONPs-1%MoS2-1%rGO (89%). In contrast with the findings with CFX, higher percentages of both AuNPs and MoS2 were found to favor LFX degradation. It is possible that the high percentages of AuNPs and MoS2 create new active sites for photocatalytic activity, thereby improving catalyst–LFX contact. Similar results have been reported by other research groups using high percentages of other cocatalysts [3].
In order to investigate the individual contributions of different parameters such as the catalyst, radiation, and the presence of oxygen on the degradation of fluoroquinolone antibiotics, control experiments were conducted for both LFX and CFX (Figure S4). For the anoxic experiments, the solution was purged with nitrogen gas (N2) for a period of 180 min, while the photolytic experiments were conducted without the presence of the catalysts. For the catalytic experiments, the radiation source was removed, and the solution was kept in the dark. As demonstrated in Figure S4, the degradation of both antibiotics was negligible when the oxygen source (anoxic), radiation source (photolysis), and catalyst (catalysis) were removed from the system. Without the oxygen source, no radicals were formed, and, therefore, the oxidation and degradation of contaminants did not occur. Similarly, in the absence of radiation sources, there was no activation of the catalyst, and electron–hole pairs (e/h+) could not be generated, preventing further degradation. Lastly, in the absence of the catalysts, the degradation process did not continue as the radiation source alone was insufficient to degrade the antibiotic molecules. The stability of these fluoroquinolones in water is consistent with previous studies, wherein CFX and LFX have been detected in surface waters [7,8].
To study the recyclability of the most efficient catalysts for the degradation of LFX and CFX, fifteen cycles were performed (Figure S5). The experiments involved the recovery of the catalyst after each cycle via centrifugation at 3000× g rpm for 20 min, followed by washing with deionized water and ethanol to remove any byproducts, and drying at 60 °C for 5 h. After drying, the same parameters were used for antibiotic degradation, as previously discussed. As shown in Figure S5a, the degradation of LFX after 15 cycles experienced only a slight decrease in efficiency, reaching a degradation percentage of 92.8%, which represents a decrease in activity of approximately 7%. In contrast, the degradation efficiency of CFX decreased more significantly, reaching a degradation percentage of ca. 85.7% after 15 cycles of use. This difference may be attributed to the different loading of gold in both catalysts. The most efficient catalyst for CFX photodegradation has only 1%AuNPs, so possible gold leaching could have a much greater effect (as observed in Figure S5b), compared with what happens with LFX, whose most efficient catalyst has 5%AuNPs (Figure S5a). The results obtained are certainly promising, taking into account that the catalysts are made up of three components whose synergistic behavior is maintained with few variations after each cycle of use. Furthermore, these results suggest that the catalysts could be used for longer cycles without excessively compromising the degradation efficiency.
One of the principal constraints in semiconductor photocatalysis is the recombination of electron–hole pairs, which limits the overall efficiency of the process. To address this issue, hole scavengers are often employed. The underlying concept involves incorporating a substance that is more prone to oxidation than the target contaminant, which is attracted to the h+ formed in the valence band of the catalyst and is subsequently oxidized, thereby diminishing the probability of recombination. The excited electrons that reach the conduction band of the catalyst can be gained by oxygen species, which generates superoxide radicals (O2) that act as even more powerful oxidizing agents than the holes in the valence band. These radicals can effectively degrade antibiotics, resulting in a higher percentage of degradation. To assess the photodegradation mechanism, several scavengers, namely, tert-butanol (t-butanol), 1,4-benzoquinone (1,4-BQ), and disodium salt of ethylenediaminetetraacetic acid, EDTA-Na2, were added to the reaction mixture (Figure S6). In this study, t-butanol, 1,4-BQ, and EDTA-Na2, were used as scavengers of hydroxyl radical (OH), superoxide radical (O2), and h+, respectively. The results obtained for LFX (Figure S6a) indicated that t-butanol noticeably inhibited photoactivity, suggesting that the hydroxyl radical reactive species plays a significant role in the photodegradation process. On the other hand, 1,4-BQ hindered the reaction to a lesser extent, indicating that the O2 radical does not have as prominent a role as the hydroxyl radical in the degradation process. The presence of EDTA-Na2, on the other hand, had practically no effect on the reaction, implying that the holes generated during the catalytic process do not interfere with the photodegradation of LFX. Similar effects were observed for CFX (see Figure S6b), although in this case, the effects of all scavengers were significantly greater.
The intermediates generated during the photodegradation of LFX and CFX by the catalysts exhibiting higher efficiency (5%Au@ZnONPs-3%MoS2-1%rGO and 1%Au@ZnONPs-3%MoS2-1%rGO, respectively) were characterized using GC-MS. Based on the results, a potential degradation pathway was established (see Figure 8). For both contaminants, photodegradation was very fast. For LFX (Figure 8a), three distinct and concurrent degradation pathways were proposed. Pathway 1 involves an initial piperazine ring cleavage (m/z 308), followed by the loss of methyl groups (m/z 279) [55,56], and, ultimately, mineralization. Pathway 2 follows a similar initial degradation stage to pathway 1 (m/z 279) [55,56], followed by decarboxylation and subsequent mineralization. In pathway 3, depiperazinylation and defluorination are observed, resulting in subsequent mineralization. In the case of CFX, photodegradation occurred at an even faster rate than with LFX, generating multiple compounds that allowed for the identification of four possible pathways (Figure 8b). The first three pathways are characterized by simultaneous depiperazinylation and defluorination, resulting in various intermediates (m/z: 284, 216, and 205) [57], which then undergo subsequent mineralization. Pathway 3 additionally experiences the loss of the cyclopropane ring. Pathway 4 involves a piperazine ring cleavage (m/z 220), followed by the cleavage of the moiety corresponding to the heterocycle with nitrogen and the cyclopropane ring (m/z 141), before continuing with subsequent mineralization.

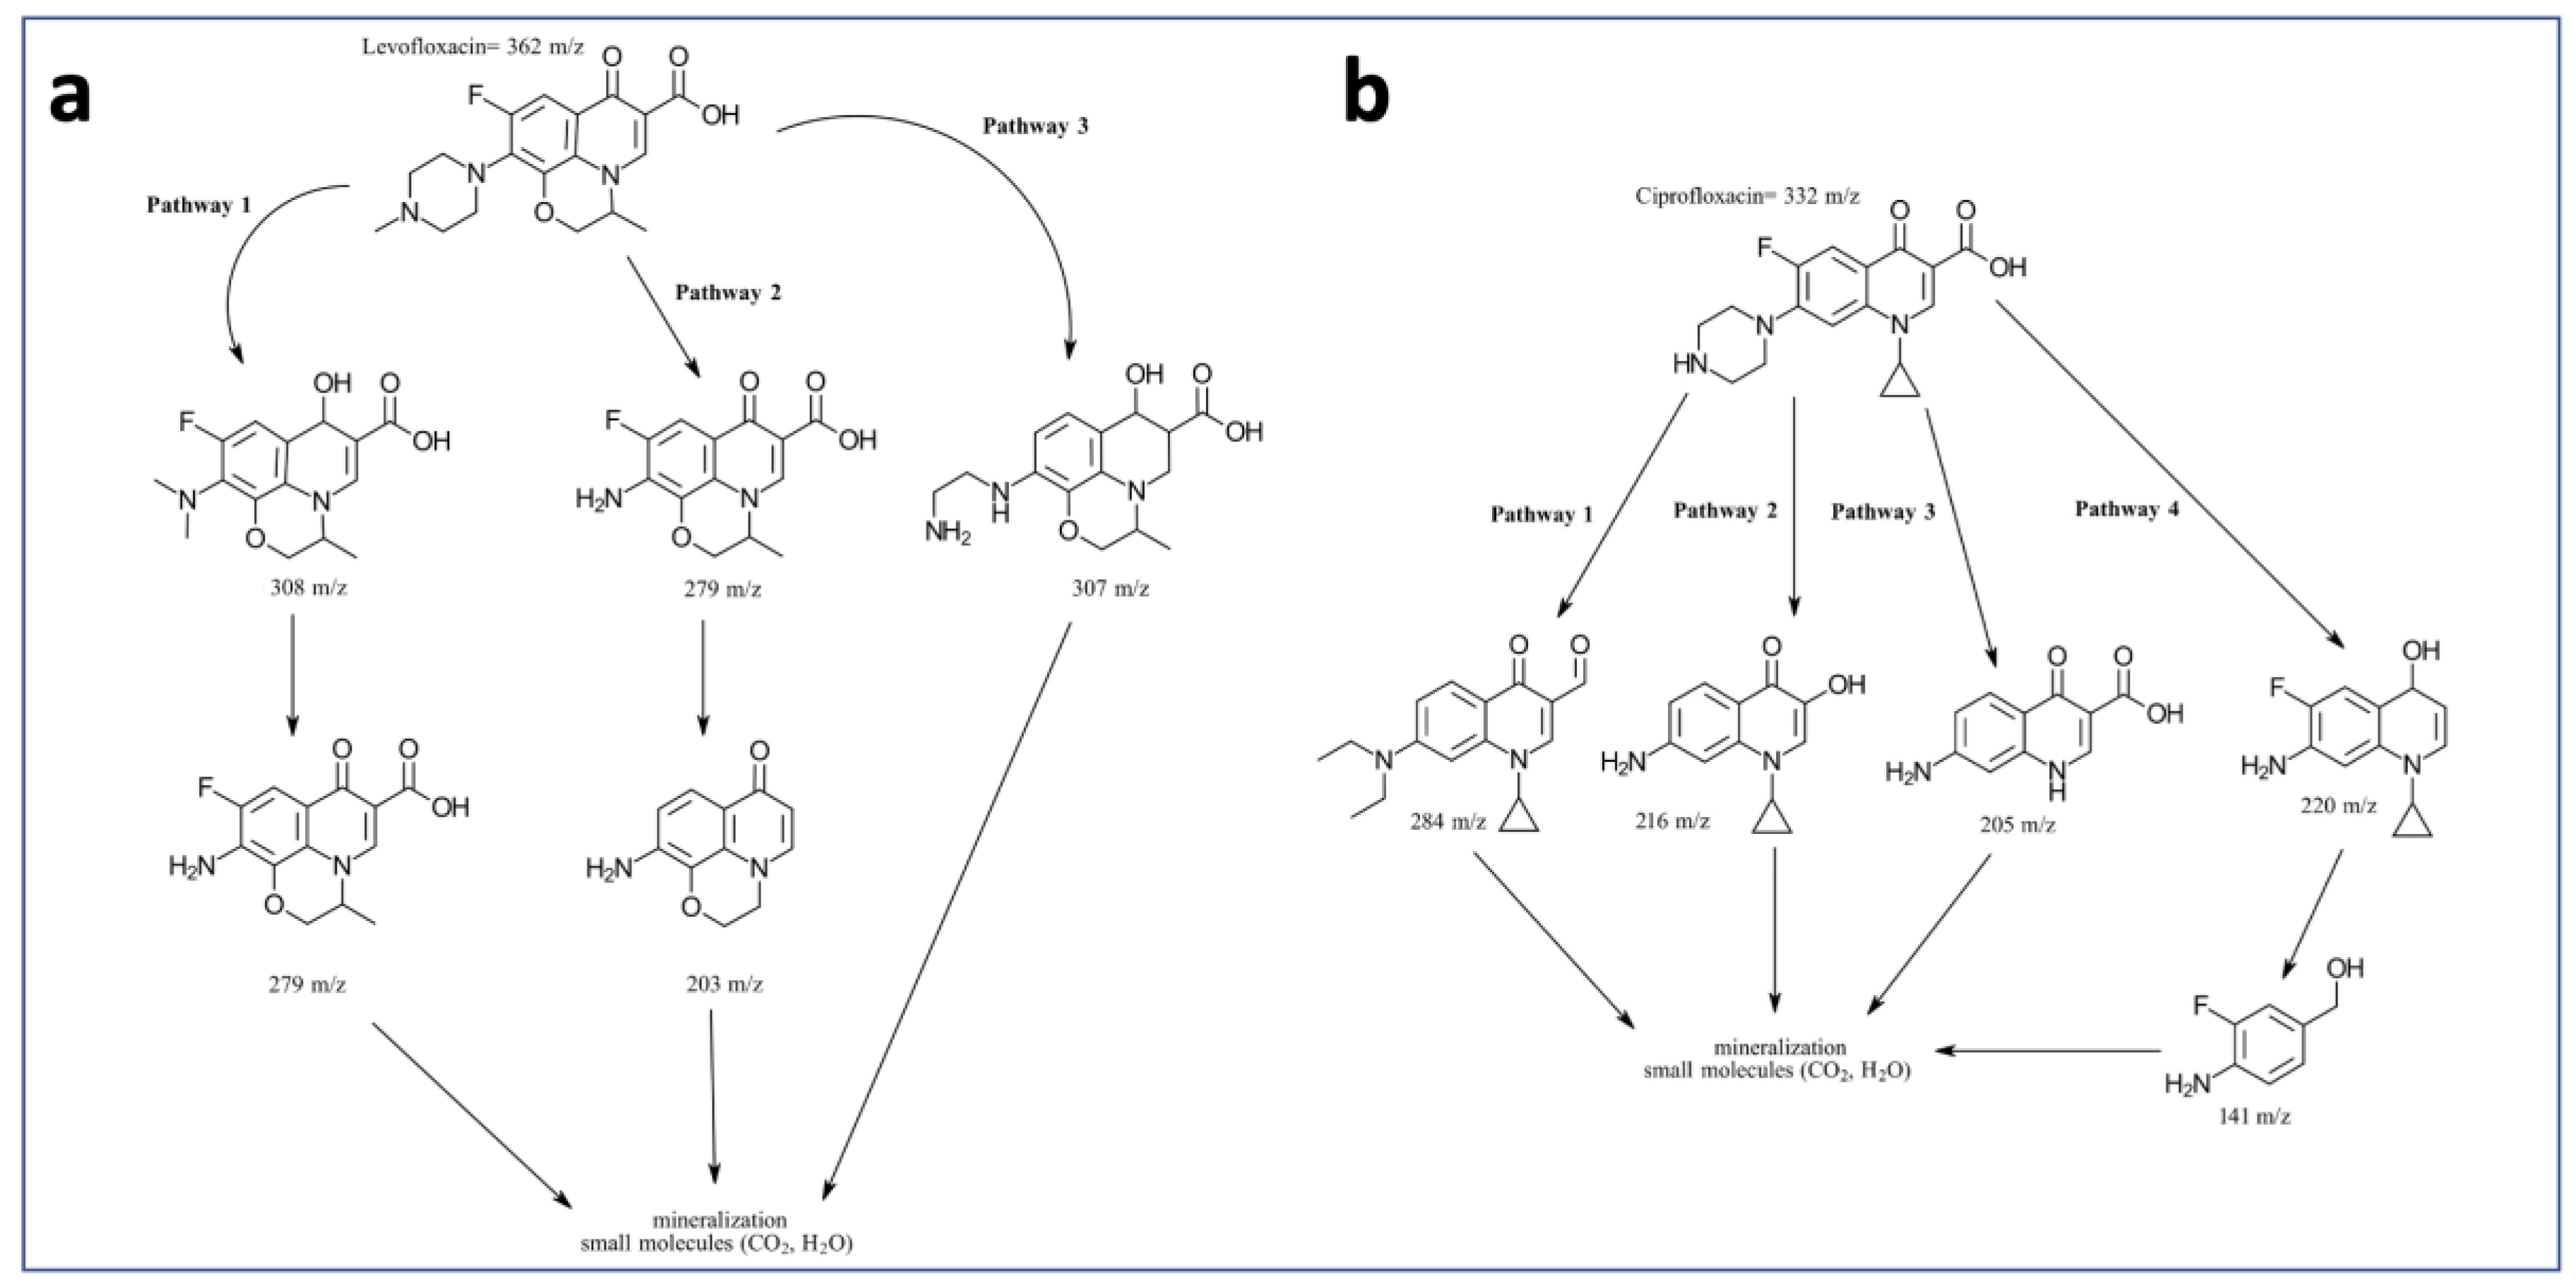
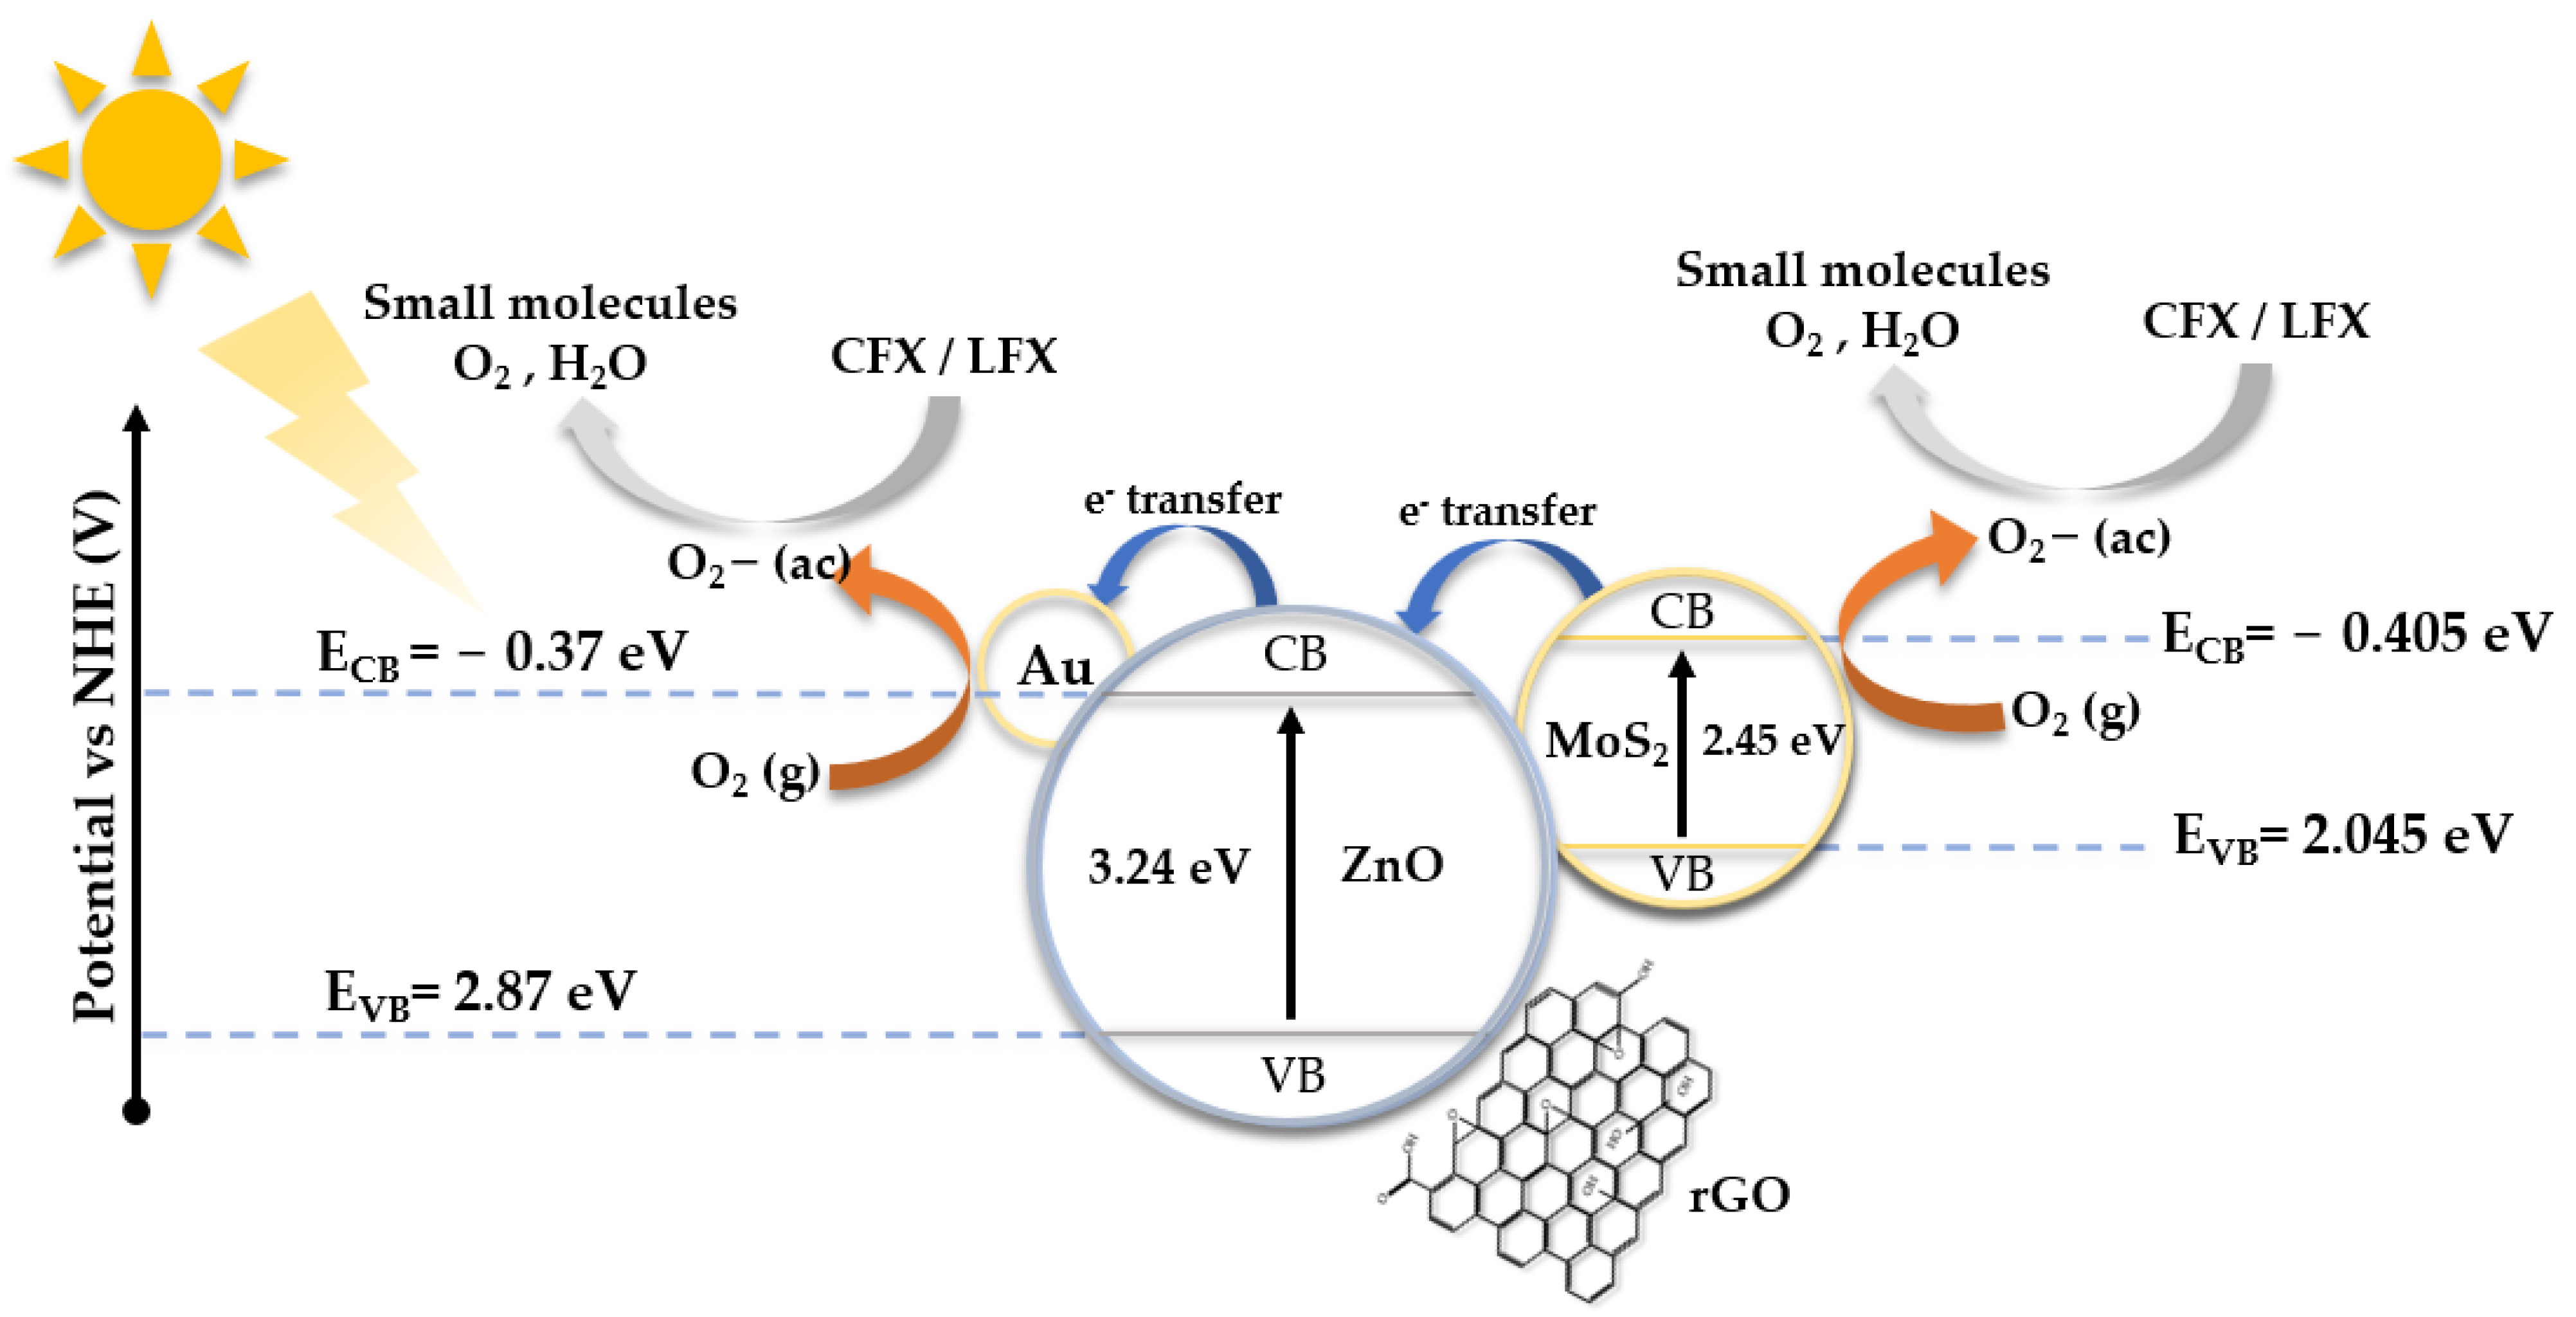
2.3. Mechanism for the Photodegradation of Levofloxacin and Ciprofloxacin

The catalytic photodegradation mechanism of LFX and CFX is proposed in Figure 9. The band edge positions and the migration directions of the photogenerated charge carriers were determined via the bandgap energies (Figure 6) and the Mulliken electronegativity theory [58], using the following equations:
ECB = X − EC − 0.5Eg
EVB = ECB + Eg
ECB is the edge potential of the conduction band, X is the absolute electronegativity, EC has a value of 4.50 eV and corresponds to the energy of free electrons on the hydrogen scale [59,60], Eg is the bandgap energy, and EVB is the edge potential of the valence band. The absolute electronegativity values for ZnO and MoS2 are 5.75 eV and 5.32 eV, respectively, whereas the ECB and EVB edge potentials for Au@ZnO were −0.37 eV and 2.87 eV. In the case of MoS2, the edge potentials were −0.405 eV (ECB) and 2.045 eV (EVB). These values are similar to those reported by other research groups [17,61].
In the context of visible light, photons lack the necessary energy to extract an electron from the valence band (VB) of ZnO. Consequently, the mechanism for degradation predominantly depends on the other constituents of the system. On the other hand, under the same conditions, MoS2 has the capability to liberate electrons from its VB to the conduction band (CB) through visible light irradiation. The resultant electrons possess sufficient energy to reduce oxygen (O2) molecules, generating superoxide radicals (O2) that subsequently react with water to produce hydroxyl radicals. These hydroxyl and superoxide radicals can facilitate the oxidative degradation of LFX and CFX. Due to the more negative edge potential of the conduction band (ECB) of MoS2 (−0.405 eV) relative to Au@ZnONPs (−0.37 eV), photoinduced electrons from the VB of MoS2 can be introduced into the CB of Au@ZnONPs. Once inside, O2 can seize these electrons to create O2 and hydroxyl radicals, which can oxidize and decompose antibiotics. Numerous investigations [62,63,64] have documented that gold nanoparticles (AuNPs) can serve as electron sinks, thus mitigating e-/h+ recombination and providing sites for catalytic reactions. As demonstrated in Figure S7, the incorporation of AuNPs leads to a significant decrease in photoluminescence, corroborating this observation. Another advantage of using AuNPs is that under visible light (~580 nm depending on the AuNPs’ particle size) the phenomenon of surface plasmon resonance (SPR) occurs [62,63,64]. The SPR provides photoexcited electrons with enough energy to reduce the O2 molecules to O2 radicals. The bandgap of reduced graphene oxide (rGO) is determined to be 2.0 eV, as indicated in Figure 6. This characteristic permits the utilization of visible light to generate h+ and photoexcited electrons, which can subsequently produce superoxide and hydroxyl radicals. Furthermore, the high surface area of rGO facilitates the creation of active sites conducive to the photocatalytic process. The impacts of distinct nanostructured components on the catalyst’s behavior was assessed through photoluminescence (PL) analysis. Figure S7 depicts the PL spectra of ZnONPs, 5%Au@ZnONPs, and the full catalyst (5%Au@ZnONPs-3%MoS2-1%rGO). The PL spectra exhibit a wide emission peak with a maximum centered at ca. 546 nm upon excitation at 340 nm. The maximal PL emission intensity is observed in ZnONPs, which decreases upon the incorporation of 5%AuNPs (Figure S7b). The complete catalyst, 5%Au@ZnONPs-3%MoS2-1%rGO (Figure S7c), shows a much lower PL intensity, implying that the integration of AuNPs partially avoids the recombination of photogenerated electrons and holes, and is highly efficient when MoS2 and rGO are also incorporated.
To place our research within the broader context of the published studies, we present a comparison of the degradation of CFX and LFX using various ZnO heterostructured photocatalysts in Table 1. To our knowledge, no studies on CFX and LFX degradation using Au@ZnO-MoS2-rGO nanocomposites have been reported. Different ZnO heterostructured nanocomposites have been used, and the results indicate that the degradation of fluoroquinolone antibiotics can be achieved at different times and with different materials under visible light. The materials investigated in our study exhibited excellent results, but additional research will be required to gain a more comprehensive understanding of the degradation mechanism of CFX and LFX with ternary ZnO-based compounds.

3. Materials and Methods

3.1. Materials

All the reactants were used as received and the solutions were prepared using deionized water (Milli-Q water; 18.2 MΩcm−1 at 25 °C). The synthesis of the ZnONPs required the use of zinc acetate (Zn(C2H3O2) ·2H2O; 98.99%) and sodium hydroxide (NaOH; 99.0%), both acquired from Sigma Aldrich (Milwaukee, WI, USA). For the incorporation of the AuNPs onto the ZnONPs, gold (III) chloride trihydrate (HAuCl4.3H2O; ACS Reagent, 49.0+% Au basis) was used as well as sodium borohydride (NaBH4; 98.9%), provided by Sigma Aldrich (Milwaukee, WI, USA) and Acros Chemical (Newark, NJ, USA), respectively. The synthesis of the Au@ZnONPs-MoS2-rGO catalysts required the use of MoS2 (nanopowder, 90 nm diameter; 99% trace metals basis) and rGO (powder; carbon > 75%, nitrogen < 5%), also provided by Sigma Aldrich (Milwaukee, WI, USA). Levofloxacin (C18H20FN3O4; 98.0–102% anhydrous basis), ciprofloxacin (C17H18FN3O3; 98%), hydrogen peroxide (H2O2; 35% w/w), ethylenediaminetetraacetic acid (EDTA-Na2; ACS reagent, 99.4–100.6% powder), tert-butanol (((CH3)3COH); ACS reagent; >99.0%), 1,4–benzoquinone (C6H4O2, reagent grade; >98%), and 0.45 μm syringe filters were provided by Sigma Aldrich (Milwaukee, WI, USA).

3.2. Synthesis of the ZnONPs

The synthesis of the ZnONPs has been described elsewhere [14] and consisted of mixing 25 mL of a 0.2 M Zn(C2H3O2)2.2H2O solution with 50 mL of deionized water at a temperature of 60 °C. After the solution reached the desired temperature, 25 mL of a 4 M NaOH solution was added dropwise. The solution was kept at 60 °C under stirring for 2 h. Then, the solution was allowed to cool, and the solid obtained was centrifuged and washed several times until a neutral pH was reached in the washing waters. The final product was then collected and dried overnight at 60 °C.

3.3. Synthesis of the Au@ZnONPs

The incorporation of the AuNPs onto the ZnONPs has been previously described [14] and consisted of dispersing 500 mg of the ZnONPs in 250 mL of deionized water. The dispersion was stirred for 1 h and after that, the desired amount of HAuCl4.3H2O was incorporated into the solution and stirred for 30 min. Then, a solution consisting of 10 mg of NaBH4 in 10 mL of deionized water was added dropwise to the reaction mixture and stirred for 1 h. The final product was collected, centrifuged, and washed several times with deionized water to remove any byproducts. The final product was dried overnight at 60 °C. The chemical composition of the prepared nanostructures and the amount of gold deposited on the ZnONPs support were measured with EDS, confirming the expected values.

3.4. Synthesis of the Au@ZnONPs-MoS2-rGO Catalysts

The incorporation of MoS2 and rGO onto the Au@ZnONPs consisted of the dispersion of 500 mg of the Au@ZnONPs with the desired percentage of Au (1 wt.%, 3 wt.%, or 5 wt.%) into 250 mL of deionized water. Then, the desired amount of MoS2 was added to the dispersion. The MoS2 was previously exfoliated. The processes of the exfoliation consisted of mixing 4 g of the commercial MoS2 with 200 mL of deionized water. Then, the dispersion was sonicated using a Cole-Palmer Tip Sonicator (Cole-Parmer 750-Watt Ultrasonic Processor) for 6 h in pulsed mode (40% amplitude; pulse on 5 s; pulse off 10 s). After that, the solution was kept static for 3 h, and the supernatant was extracted and centrifuged for 30 min at 3000× g rpm. Finally, the product was dried and sealed for use. The exfoliated MoS2 was added to the solution containing the dispersion of Au@ZnONPs, and 5 mg (1 wt.%) of rGO was incorporated into the reaction mixture. Subsequently, the solution was stirred for 1 h, centrifuged, and washed several times with deionized water. The final product was dried at 60 °C overnight and sealed until further use.

3.5. Characterization of the Photocatalysts

The BET surface areas of the catalysts were analyzed using a Micrometrics ASAP 2020, with N2 adsorption isotherms at 77 K (Norcross, GA, USA). The morphologies of the composites were characterized with field-emission scanning electron microscopy (FESEM) using an FEI Verios 460L, equipped with a Quantax EDS Analyzer (Thermo Fisher Scientific, Hillsboro, OR, USA). Characterization via high-resolution transmission electron microscopy was carried out using a JEM 3000F microscope (JEOL, Peabody, MA, USA). The crystalline phase of the catalysts was studied with X-ray diffraction (XRD) using a Bruker D8 Advance X-ray diffractometer, operating at 40 kV and 40 mA (Billerica, MA, USA). Raman spectroscopy was carried out using a DXR Thermo Raman Microscope with a 532 nm laser source at a 5 mW power and a resolution of 5 cm−1 (Waltham, MA, USA). X-ray photoelectron spectroscopy (XPS) was carried out using an ESCALAB 220i-XL spectrometer with non-monochromatic Mg Kα (1253.6 eV) radiation operating at 20 mA and 12 kV (Waltham, MA, USA). The determination of the bandgap energies of the catalysts, along with the degradation of the antibiotics, was carried out on a Perkin Elmer Lambda 365 UV-Vis Spectrophotometer (Waltham, MA, USA). The photoluminescence spectra were recorded on an Edinburgh FS900 Fluorescence Spectrometer (Edinburgh Instruments Ltd., Livingston, UK). Analysis of the photodegradation intermediates was carried out with gas chromatography–mass spectrometry (GC-MS), using a QP2020 Plus GC-MS (Shimadzu Corporation, Japan). Samples were separated using a 30 m × 0.25 mm i.d. capillary column. (Rtx-5MS, Restek Corporation, Bellefonte PA, USA), using helium (99.999%) as the carrier gas.

3.6. Photocatalytic Experiments

The ideal conditions in terms of concentration (2 μM–50 µM), catalyst loading (0.5 g/L–1.5 g/L), and pH (4–11) were determined for LFX before conducting the experiments. The photodegradation experiments consisted of preparing a solution of 10 μM of LFX and mixing it with 1.1 g/L of the desired catalyst. Then, the pH of the solution was adjusted to 8 by using sodium hydroxide (NaOH) or hydrochloric acid (HCl), and the solution was kept in the dark for 30 min under constant stirring. This was made to achieve the adsorption/desorption equilibrium between the catalyst and the solution. After that, 3 mL of a 0.005% H2O2 solution was added to the solution, and the mixture was subjected to constant air bubbling to guarantee the presence of oxygen. Subsequently, the solution was surrounded with a solar simulator composed of 2 white light bulbs (60 watts and ca. 5200 lx). Then, the solar simulator was switched on, and the reaction was conducted for 120 min at 22 °C, taking 5 mL aliquots every 10 min. The aliquots were filtered through 0.45 μm membrane filters to remove the catalyst and were subsequently analyzed.
The ideal conditions for CPX were previously determined [17], and the experiments were similar to those described for LFX, with the difference being that the catalyst loading was 1.0 g/L, the pH was adjusted to 7, and the experiments were performed for a maximum time of 60 min.
For the study of the intermediates in the photodegradation process, aliquots were obtained at different reaction times, which were filtered to eliminate the catalyst. These aliquots were diluted with 50 mL of deionized water and subjected to an extraction process with ethyl acetate via liquid–liquid extraction. The extract was evaporated to dryness using a rotary evaporator and then dissolved in 5 mL of methanol. GC-MS analysis was carried out by injecting 1 µL of the sample into a gas chromatograph/mass spectrometer (GC-MS QP2020 Plus, Shimadzu, Japan). For both contaminants, a total of 4 injections were performed, including a blank sample, using helium as the carrier gas.

4. Conclusions

The present study evaluated the photocatalytic activity of nine catalysts composed of ZnONPs, AuNPs, MoS2, and rGO in the degradation of two antibiotics, namely, ciprofloxacin (CFX) and levofloxacin (LFX). The obtained results reveal that LFX is more resistant to degradation compared with CFX and that the main degradation pathway under visible light is the formation of hydroxyl radicals. The CFX degradation percentages ranged from 70% to 96%, with 1%Au@ZnONPs-3%MoS2-1%rGO displaying the highest degradation percentage (96%) within a period of 60 min. On the other hand, the LFX degradation percentages ranged from 85% to 99.8%, with 5%Au@ZnONPs-3%MoS2-1%rGO displaying the highest percentage of degradation (99.8%) within a maximum period of 120 min. Additionally, the PL spectra analysis provided further insights into the effects of the different cocatalysts on the ZnONPs, indicating that the incorporation of AuNPs partially inhibits the photogenerated recombination of electron–holes and proves to be highly efficient when MoS2 and rGO are incorporated.
The use of t-butanol, 1,4-BQ, and EDTA-Na2 as scavengers, in conjunction with the determination of bandgap values, facilitated the identification of the potential mechanisms underlying the catalytic photodegradation of levofloxacin (LFX) and ciprofloxacin (CFX).
The reaction intermediates were analyzed with GC-MS, which enabled the establishment of a possible photodegradation route for both antibiotics leading to complete mineralization.
The recyclability tests showed that the 5%Au@ZnONPs-3%MoS2-1%rGO catalyst exhibited the highest activity in the case of LFX, maintaining ca. 93% of its efficiency after 15 cycles. For CFX, the 1%Au@ZnONPs-3%MoS2-1%rGO catalyst was the most active, and its efficiency after 15 cycles was 85.7%, which was lower than that observed for LFX. These results suggest that the catalysts have the potential to be used for many more cycles and could be evaluated for degrading other emerging organic pollutants in aqueous solutions.

Supplementary Materials

The following supporting information can be downloaded at https://www.mdpi.com/article/10.3390/catal13030538/s1. Table S1: BET surface area of the synthesized catalysts; Figure S1: evaluation of the initial concentration of LFX on the catalytic efficiency of 5%Au@ZnONPs-1%MoS2-1%rGO, 5%Au@ZnONPs-3%MoS2-1%rGO, and 5%Au@ ZnONPs-5%MoS2-1%rGO in the photodegradation reaction; Figure S2: evaluation of the catalyst loading of 5%Au@ZnONPs-1%MoS2-1%rGO, 5%Au@ZnONPs-3%MoS2-1%rGO, and 5%Au@ZnONPs-5%MoS2-1%rGO on the efficiency of the photodegradation reaction of LFX; Figure S3: photocatalytic activity of 5%Au@ZnONPs-3%MoS2-1%rGO on the degradation of LFX under irradiation at different pH values; Figure S4: control experiments for 1%Au@ZnONPs-3%MoS2-1%rGO with CFX (a) and 5%Au@ZnONPs-3%MoS2-1%rGO with LFX (b), under irradiation; Figure S5: recyclability tests for 5%Au@ZnONPs-3%MoS2-1%rGO after 15 consecutive catalytic cycles of photodegradation of LFX (a) and for 1%Au@ZnONPs-3%MoS2-1%rGO after 15 consecutive catalytic cycles of photodegradation of CFX (b); Figure S6: photocatalytic activity in the presence of different scavengers under irradiation: 5%Au@ZnONPs-3%MoS2-1%rGO on the degradation of LFX at pH = 8 (a) and 1%Au@ZnONPs-3%MoS2-1%rGO on the degradation of CFX at pH = 7 (b); and Figure S7: PL spectra of ZnONPs (a), 5%Au@ZnONPs (b), and 5%Au@ZnONPs-3%MoS2-1%rGO (c).

Author Contributions

Conceptualization, A.M. and F.M.; methodology, A.M., F.M. and C.M.; formal analysis, A.M. and F.M.; investigation, A.M., L.S.-V., E.R., M.C.C., D.G., P.J.B.-R., D.O., K.F. and C.M.; resources, A.M., F.M., M.C.C., C.M. and F.P.; writing—original draft preparation, A.M. and F.M.; writing—review and editing, A.M. and F.M.; supervision, A.M., M.C.C. and F.M.; project administration, A.M. and F.M.; funding acquisition, A.M., F.M., E.R., C.M. and F.P. All authors have read and agreed to the published version of the manuscript.

Funding

The financial support from the NSF Center for the Advancement of Wearable Technologies-CAWT (grant 1849243), from the Consortium of Hybrid Resilient Energy Systems (DE-NA0003982), and from the Spanish Ministry of Economy and Competitiveness, under NanoCat-Com Project (PID2021-124667OB-I00), are gratefully acknowledged.

Institutional Review Board Statement

Not applicable for studies not involving humans or animals.

Data Availability Statement

The data are contained in the article and are available from the corresponding authors on reasonable request.

Acknowledgments

The authors thank Raúl S García for the development of part of the catalytic measurements and some characterization techniques. The facilities provided by the National Center for Electron Microscopy at Complutense University of Madrid (Spain), by the “Instituto de Micro y Nanotecnología IMN-CNM, CSIC, CEI UAM + CSIC”, and by the Materials Characterization Center at University of Puerto Rico are gratefully acknowledged. K.F. thanks the PR NASA Space Grant Consortium for their graduate fellowship (#80NSSC20M0052). D.O. thanks the Consortium of Hybrid Resilient Energy Systems for their graduate fellowship.

Conflicts of Interest

The authors declare no conflict of interest.

References

  1. Muttarak, R.; Wilde, J. The World at 8 Billion; Population Council: New York, NY, USA, 2022; pp. 16–17. [Google Scholar]
  2. Van Vliet, M.T.H.; Jones, E.R.; Florke, M.; Franssen, W.H.P.; Hanasaki, N.; Wada, Y.; Yearsley, J.R. Global water scarcity including surface water quality and expansions of clean water technologies. Environ. Res. Lett. 2021, 16, 024020. [Google Scholar] [CrossRef]
  3. Ricart, S.; Villar-Navascués, R.A.; Hernández-Hernández, M.; Rico-Amorós, A.M.; Olcina-Cantos, J.; Moltó-Mantero, E. Extending Natural Limits to Address Water Scarcity? The Role of Non-Conventional Water Fluxes in Climate Change Adaptation Capacity: A Review. Sustainability 2021, 13, 2473. [Google Scholar] [CrossRef]
  4. Ungureanu, N.; Vlăduț, V.; Voicu, G. Water Scarcity and Wastewater Reuse in Crop Irrigation. Sustainability 2020, 12, 9055. [Google Scholar] [CrossRef]
  5. Zhang, X.; Zhang, Y.; Zhang, Q.; Liu, P.; Guo, R.; Jin, S.; Liu, J.; Chen, L.; Ma, Z.; Liu, Y. Evaluation and Analysis of Water Quality of Marine Aquaculture Area. Int. J. Environ. Res. Public Health 2020, 17, 1446. [Google Scholar] [CrossRef] [PubMed] [Green Version]
  6. De Baat, M.L.; Van der Oost, R.; Van der Lee, G.H.; Wieringa, N.; Hamers, T.; Verdonschot, P.F.M.; De Voogt, P.; Kraak, M.H.S. Advancements in effect-based surface water quality assessment. Water Res. 2020, 183, 116017. [Google Scholar] [CrossRef] [PubMed]
  7. Serwecińska, L. Antimicrobials and Antibiotic-Resistant Bacteria: A Risk to the Environment and to Public Health. Water 2020, 12, 3313. [Google Scholar] [CrossRef]
  8. Zhuang, M.; Achmon, Y.; Cao, Y.; Liang, X.; Chen, L.; Wang, H.; Siame, B.A.; Leung, K.Y. Distribution of antibiotic resistance genes in the environment. Environ. Pollut. 2021, 285, 117402. [Google Scholar] [CrossRef]
  9. Ghernaout, D.; Elboughdiri, N. Antibiotics Resistance in Water Mediums: Background, Facts, and Trends. Appl. Eng. 2020, 4, 1–6. [Google Scholar]
  10. Zheng, D.; Yin, G.; Liu, M.; Chen, C.; Jiang, Y.; Hou, L.; Zheng, Y. A systematic review of antibiotics and antibiotic resistance genes in estuarine and coastal environments. Sci. Total Environ. 2021, 777, 146009. [Google Scholar] [CrossRef]
  11. Antimicrobial Resistance Collaborators. Global burden of bacterial antimicrobial resistance in 2019: A systematic analysis. Lancet 2022, 399, 629–655. [Google Scholar] [CrossRef]
  12. Makabenta, J.M.V.; Nabawy, A.; Li, C.H.; Schmidt-Malan, S.; Patel, R.; Rotello, V.M. Nanomaterial-based therapeutics for antibiotic-resistant bacterial infections. Nat. Rev. Microbiol. 2021, 19, 23–36. [Google Scholar] [CrossRef]
  13. Pinilla, S.; Machín, A.; Park, S.-H.; Arango, J.C.; Nicolosi, V.; Márquez-Linares, F.; Morant, C. TiO2 -Based Nanomaterials for the Production of Hydrogen and the Development of Lithium-Ion Batteries. J. Phys. Chem. B 2018, 122, 972–983. [Google Scholar] [CrossRef]
  14. Machín, A.; Cotto, M.; Duconge, J.; Arango, J.C.; Morant, C.; Pinilla, S.; Soto-Vázquez, L.; Resto, E.; Márquez, F. Hydrogen Production via Water Splitting Using Different Au@ZnO Catalysts under UV–Vis Irradiation. J. Photochem. Photobiol. A Chem. 2018, 353, 385–394. [Google Scholar] [CrossRef]
  15. Machín, A.; Arango, J.C.; Fontánez, K.; Cotto, M.; Duconge, J.; Soto-Vázquez, L.; Resto, E.; Petrescu, F.I.T.; Morant, C.; Márquez, F. Biomimetic Catalysts Based on Au@ZnO–Graphene Composites for the Generation of Hydrogen by Water Splitting. Biomimetics 2020, 5, 39. [Google Scholar] [CrossRef] [PubMed]
  16. Machín, A.; Soto-Vázquez, L.; Colón-Cruz, C.; Valentín-Cruz, C.A.; Claudio-Serrano, G.J.; Fontánez, K.; Resto, E.; Petrescu, F.I.; Morant, C.; Márquez, F. Photocatalytic Activity of Silver-Based Biomimetics Composites. Biomimetics 2021, 6, 4. [Google Scholar] [CrossRef]
  17. Machín, A.; Fontánez, K.; Duconge, J.; Cotto, M.C.; Petrescu, F.I.; Morant, C.; Márquez, F. Photocatalytic Degradation of Fluoroquinolone Antibiotics in Solution by Au@ZnO-rGO-gC3N4 Composites. Catalysts 2022, 12, 166. [Google Scholar] [CrossRef]
  18. Soto-Vázquez, L.; Rolón-Delgado, F.; Rivera, K.; Cotto, M.C.; Ducongé, J.; Morant, C.; Pinilla, S.; Márquez-Linares, F.M. Catalytic Use of TiO2 Nanowires in the Photodegradation of Benzophenone-4 as an Active Ingredient in Sunscreens. J. Environ. Manag. 2019, 247, 822–828. [Google Scholar] [CrossRef] [PubMed]
  19. Martins, P.; Kappert, S.; Nga Le, H.; Sebastian, V.; Kühn, K.; Alves, M.; Pereira, L.; Cuniberti, G.; Melle-Franco, M.; Lanceros-Méndez, S. Enhanced Photocatalytic Activity of Au/TiO2 Nanoparticles against Ciprofloxacin. Catalysts 2020, 10, 234. [Google Scholar] [CrossRef] [Green Version]
  20. Kutuzova, A.; Dontsova, T.; Kwapinski, W. Application of TiO2-Based Photocatalysts to Antibiotics Degradation: Case of Sulfamethoxazole, Trimethoprim and Ciprofloxacin. Catalysts 2021, 11, 728. [Google Scholar] [CrossRef]
  21. Qin, Z.; Sun, H.; Tang, Y.; Chang, Z.; Yin, S.; Liu, Z. Bio-inspired hierarchical assembly of Au/ZnO decorated carbonized spinach leaves with enhanced photocatalysis performance. J. Alloys Comp. 2020, 829, 154393. [Google Scholar] [CrossRef]
  22. Chankhanittha, T.; Komchoo, N.; Senasu, T.; Piriyanon, J.; Youngme, S.; Hemavibool, K.; Nanan, S. Silver decorated ZnO photocatalyst for effective removal of reactive red azo dye and ofloxacin antibiotic under solar light irradiation. Colloids Surf. A Physicochem. Eng. Asp. 2021, 626, 127034. [Google Scholar] [CrossRef]
  23. Krishnan, U.; Kaur, M.; Kaur, G.; Singh, K.; Dogra, A.R.; Kumar, M.; Kumar, A. MoS2/ZnO nanocomposites for efficient photocatalytic degradation of industrial pollutants. Mater. Res. Bull. 2019, 111, 212–221. [Google Scholar] [CrossRef]
  24. Ahamad, T.; Naushad, M.I.; Al-Saeedi, S.I.; Almotairi, S.; Alshehri, S.M. Fabrication of MoS2/ZnS embedded in N/S doped carbon for the photocatalytic degradation of pesticide. Mater. Lett. 2020, 263, 127271. [Google Scholar] [CrossRef]
  25. Benavente, E.; Durán, F.; Sotomayor-Torres, C.; González, G. Heterostructured layered hybrid ZnO/MoS2 nanosheets with enhanced visible light photocatalytic activity. J. Phys. Chem. Solids 2018, 113, 119–124. [Google Scholar] [CrossRef]
  26. Govindaraj, T.; Mahendran, C.; Manikandan, V.S.; Archana, J.; Mohd Shkir, J.; Chandrasekaran, J. Fabrication of WO3 nanorods/RGO hybrid nanostructures for enhanced visible-light-driven photocatalytic degradation of Ciprofloxacin and Rhodamine B in an ecosystem. J. Alloys Comp. 2021, 868, 159091. [Google Scholar] [CrossRef]
  27. Arya, M.; Kaur, M.; Kaur, A.; Singh, S.; Devi, P.; Kansal, S.K. Hydrothermal synthesis of rGO-Bi2WO6 heterostructure for the photocatalytic degradation of levofloxacin. Opt. Mater. 2020, 107, 110126. [Google Scholar] [CrossRef]
  28. Raja, A.; Rajasekaran, P.; Selvakumar, K.; Arunpandian, M.; Kaviyarasu, K.; Bahadur, A.; Swaminathan, M. Visible active reduced graphene oxide-BiVO4-ZnO ternary photocatalyst for efficient removal of ciprofloxacin. Sep. Purif. Technol. 2020, 233, 115996. [Google Scholar] [CrossRef]
  29. Arjun, N.; Uma, K.; Pan, G.T.; Yang, T.C.K.; Sharmila, G. One-pot synthesis of covalently functionalized reduced graphene oxide–polyaniline nanocomposite for supercapacitor applications. Clean Techn. Environ. Policy 2018, 20, 2025–2035. [Google Scholar] [CrossRef]
  30. Fontánez, K.; García, D.; Ortiz, D.; Sampayo, P.; Hernández, L.; Cotto, M.; Ducongé, J.; Díaz, F.; Morant, C.; Petrescu, F.; et al. Biomimetic Catalysts Based on Au@TiO2-MoS2-CeO2 Composites for the Production of Hydrogen by Water Splitting. Int. J. Mol. Sci. 2023, 24, 363. [Google Scholar] [CrossRef]
  31. Pushkareva, I.V.; Pushkarev, A.S.; Kalinichenko, V.N.; Chumakov, R.G.; Soloviev, M.A.; Liang, Y.; Millet, P.; Grigoriev, S.A. Reduced Graphene Oxide-Supported Pt-Based Catalysts for PEM Fuel Cells with Enhanced Activity and Stability. Catalysts 2021, 11, 256. [Google Scholar] [CrossRef]
  32. Usharani, B.; Murugadoss, G.; Rajesh Kumar, M.; Gouse Peera, S.; Manivannan, V. Reduced Graphene Oxide–Metal Oxide Nanocomposites (ZrO2 and Y2O3): Fabrication and Characterization for the Photocatalytic Degradation of Picric Acid. Catalysts 2022, 12, 1249. [Google Scholar] [CrossRef]
  33. Sharma, A.; Singh, B.P.; Dhar, S.; Gondorf, A.; Spasova, M. Effect of surface groups on the luminescence property of ZnO nanoparticles synthesized by sol–gel route. Surf. Sci. 2012, 606, L13–L17. [Google Scholar] [CrossRef]
  34. Li, H.; Zhang, Q.; Yap, C.C.R.; Tay, B.K.; Edwin, T.H.T.; Olivier, A.; Baillargeat, D. From Bulk to Monolayer MoS2: Evolution of Raman Scattering. Adv. Funct. Mater. 2012, 22, 1385–1390. [Google Scholar] [CrossRef]
  35. Castellanos-Gomez, A.; Quereda, J.; van der Meulen, H.P.; Agraït, N.; Rubio-Bollinger, G. Spatially Resolved Optical Absorption Spectroscopy of Single- and Few-Layer MoS2 by Hyperspectral Imaging. Nanotechnology 2016, 27, 115705. [Google Scholar] [CrossRef] [Green Version]
  36. Ahmad, M.; Rehman, W.; Mansoob, M.; Tauseef, M.; Gul, A.; Haq, S.; Ullah, R.; Rab, A.; Menaa, F. Phytogenic Fabrication of ZnO and Gold Decorated ZnO Nanoparticles for Photocatalytic Degradation of Rhodamine B. J. Environ. Chem. Eng. 2021, 9, 104725. [Google Scholar] [CrossRef]
  37. Dediu, V.; Busila, M.; Tucureanu, V.; Bucur, F.I.; Iliescu, F.S.; Brincoveanu, O.; Iliescu, C. Synthesis of ZnO/Au Nanocomposite for Antibacterial Applications. Nanomaterials 2022, 12, 3832. [Google Scholar] [CrossRef] [PubMed]
  38. Ren, B.; Shen, W.; Li, L.; Wu, S.; Wang, W. 3D CoFe2O4 Nanorod/Flower-Like MoS2 Nanosheet Heterojunctions as Recyclable Visible Light-Driven Photocatalysts for the Degradation of Organic Dyes. Appl. Surf. Sci. 2018, 447, 711–723. [Google Scholar] [CrossRef]
  39. Ghasemipour, P.; Fattahi, M.; Rasekh, B.; Yazdian, F. Developing the Ternary ZnO Doped MoS2 Nanostructures Grafted on CNT and Reduced Graphene Oxide (rGO) for Photocatalytic Degradation of Aniline. Sci. Rep. 2020, 10, 4414. [Google Scholar] [CrossRef] [PubMed] [Green Version]
  40. Tarekegne, A.; Worku, D. Synthesis and Characterization of Reduced Graphene Oxide (rGO) Started from Graphene Oxide (GO) Using the Tour Method with Different Parameters. Adv. Mater. Sci. Eng. 2019, 14, 289–298. [Google Scholar]
  41. Jayachandiran, J.; Yesuraj, J.; Arivanandhan, M.; Raja, A.; Suthanthiraraj, A.; Jayavel, R.; Nedumaran, D. Synthesis and Electrochemical Studies of rGO/ZnO Nanocomposite for Supercapacitor Application. J. Inorg. Organomet. Polym. 2018, 28, 365–379. [Google Scholar] [CrossRef]
  42. Naseri, A.; Samadi, M.; Mahmoodi, N.M.; Pourjavadi, A.; Mehdipour, H.; Moshfegh, A.Z. Tuning Composition of Electrospun ZnO/CuO Nanofibers: Toward Controllable and Efficient Solar Photocatalytic Degradation of Organic Pollutants. J. Phys. Chem. C 2017, 121, 3327–3338. [Google Scholar] [CrossRef]
  43. Qiao, Y.; Li, J.; Li, H.; Fang, H.; Fan, D.; Wang, W. A Label-Free Photoelectrochemical Aptasensor for Bisphenol A Based on Surface Plasmon Resonance of Gold Nanoparticle-Sensitized ZnO Nanopencils. Biosens. Bioelectron. 2016, 86, 315–320. [Google Scholar] [CrossRef] [PubMed]
  44. Lee, H.J.; Kim, J.S.; Lee, K.Y.; Park, H.P.; Bae, J.S.; Mubarak, M.; Lee, H. Elucidation of an intrinsic parameter for evaluating the electrical quality of graphene flakes. Sci. Rep. 2019, 9, 557. [Google Scholar] [CrossRef] [Green Version]
  45. Briggs, D.; Seah, M. Practical Surface Analysis; Wiley: New York, NY, USA, 1994. [Google Scholar]
  46. Morimoto, N.; Kubo, T.; Nishina, Y. Tailoring the oxygen content of graphite and reduced graphene oxide for specific applications. Sci. Rep. 2016, 6, 21715. [Google Scholar] [CrossRef] [Green Version]
  47. Tan, S.M.; Ambrosi, A.; Chua, C.K.; Pumera, M. Electron transfer properties of chemically reduced graphene materials with different oxygen contents. J. Mater. Chem. A 2014, 2, 10668–10675. [Google Scholar] [CrossRef]
  48. Zagorac, D.; Zagorac, J.; Pejić, M.; Matović, B.; Schön, J.C. Band Gap Engineering of Newly Discovered ZnO/ZnS Polytypic Nanomaterials. Nanomaterials 2022, 12, 1595. [Google Scholar] [CrossRef]
  49. Rahman, I.A.; Purqon, A. First Principles Study of Molybdenum Disulfide Electronic Structure. J. Phys. Conf. Ser. 2017, 877, 012026. [Google Scholar] [CrossRef] [Green Version]
  50. Shen, Y.; Yang, S.; Zhou, P.; Sun, Q.; Wang, P.; Wan, L.; Li, J.; Chen, L.; Wang, X.; Ding, S.; et al. Evolution of the band-gap and optical properties of graphene oxide with controllable reduction level. Carbon 2013, 62, 157–164. [Google Scholar] [CrossRef]
  51. Machín, A.; Fontánez, K.; García, D.; Sampayo, P.; Colón-Cruz, C.; Claudio-Serrano, G.J.; Soto-Vázquez, L.; Resto, E.; Petrescu, F.I.; Morant, C.; et al. Hydrogen Production and Degradation of Ciprofloxacin by Ag@TiO2-MoS2 Photocatalysts. Catalysts 2022, 12, 267. [Google Scholar] [CrossRef]
  52. Soto-Vázquez, L.; Cotto, M.; Ducongé, J.; Morant, C.; Márquez, F. Synthesis and photocatalytic activity of TiO2 nanowires in the degradation of p-aminobenzoic acid: A comparative study with a commercial catalyst. J. Environ. Manag. 2016, 167, 23–28. [Google Scholar] [CrossRef] [Green Version]
  53. Prabavathi, S.L.; Saravanakumar, K.; Park, C.M.; Muthuraj, V. Photocatalytic degradation of levofloxacin by a novel Sm6WO12/g-C3N4 heterojunction: Performance, mechanism and degradation pathways. Sep. Purif. Technol. 2021, 257, 117985. [Google Scholar] [CrossRef]
  54. Jourshabani, M.; Shariatinia, Z.; Badiei, A. Synthesis and Characterization of Novel Sm2O3/S-Doped g-C3N4 Nanocomposites with Enhanced Photocatalytic Activities under Visible Light Irradiation. Appl. Surf. Sci. 2018, 427, 375–387. [Google Scholar] [CrossRef]
  55. Tsai, C.K.; Lee, Y.C.; Nguyen, T.T.; Horng, J.J. Levofloxacin Degradation under Visible-LED Photo-Catalyzing by a Novel Ternary Fe–ZnO/WO3 Nanocomposite. Chemosphere 2022, 298, 134285. [Google Scholar] [CrossRef] [PubMed]
  56. Xing, Z.; Wang, Z.; Chen, W.; Zhang, M.; Fu, X.; Gao, Y. Degradation of Levofloxacin in Wastewater by Photoelectric and Ultrasonic Synergy with TiO2/g-C3N4@AC Combined Electrode. J. Environ. Manag. 2023, 330, 117168. [Google Scholar] [CrossRef] [PubMed]
  57. Hu, X.; Hu, X.; Peng, Q.; Zhou, L.; Tan, X.; Jiang, L.; Tang, C.; Wang, H.; Liu, S.; Wang, Y.; et al. Mechanisms Underlying the Photocatalytic Degradation Pathway of Ciprofloxacin with Heterogeneous TiO2. Chem. Eng. J. 2020, 380, 122366. [Google Scholar] [CrossRef]
  58. Prabavathi, S.L.; Saravanakumar, K.; Nkambule, T.T.I.; Muthuraj, V.; Mamba, G. Enhanced Photoactivity of Cerium TungstateModified Graphitic Carbon Nitride Heterojunction Photocatalyst for the Photodegradation of Moxifloxacin. J. Mater. Sci. Mater. Electron. 2020, 31, 11434–11447. [Google Scholar] [CrossRef]
  59. Cao, J.; Li, X.; Lin, H.; Chen, S.; Fu, X. In Situ Preparation of Novel p–n Junction Photocatalyst BiOI/(BiO)2CO3 with Enhanced Visible Light Photocatalytic Activity. J. Hazard. Mater. 2012, 239–240, 316–324. [Google Scholar] [CrossRef] [PubMed]
  60. Nethercot, A.H. Prediction of Fermi Energies and Photoelectric Thresholds Based on Electronegativity Concepts. Phys. Rev. Lett. 1974, 33, 1088–1091. [Google Scholar] [CrossRef]
  61. Chen, C.; Bi, W.; Xia, Z.; Yuan, W.; Li, L. Hydrothermal Synthesis of the CuWO4/ZnO Composites with Enhanced Photocatalytic Performance. ACS Omega 2020, 5, 13185–13195. [Google Scholar] [CrossRef]
  62. Badilescu, S.; Raju, D.; Bathini, S.; Packirisamy, M. Gold Nano-Island Platforms for Localized Surface Plasmon Resonance Sensing: A Short Review. Molecules 2020, 25, 4661. [Google Scholar] [CrossRef]
  63. Bereli, N.; Bakhshpour, M.; Topçu, A.A.; Denizli, A. Surface Plasmon Resonance-Based Immunosensor for Igm Detection with Gold Nanoparticles. Micromachines 2021, 12, 1092. [Google Scholar] [CrossRef]
  64. Yang, Z.-W.; Pham, T.-T.-H.; Hsu, C.-C.; Lien, C.-H.; Phan, Q.-H. Single-Layer-Graphene-Coated and Gold-Film-Based Surface Plasmon Resonance Prism Coupler Sensor for Immunoglobulin G Detection. Sensors 2022, 22, 1362. [Google Scholar] [CrossRef] [PubMed]
  65. Rong, X.; Qiu, F.; Jiang, Z.; Rong, J.; Pan, J.; Zhang, T.; Yang, D. Preparation of ternary combined ZnO-Ag2O/porous g-C3N4 composite photocatalyst and enhanced visible-light photocatalytic activity for degradation of ciprofloxacin. Chem. Eng. Res. Des. 2016, 111, 253–261. [Google Scholar] [CrossRef]
  66. Du, C.; Song, J.; Tan, S.; Yang, L.; Yu, G.; Chen, H.; Zhou, L.; Zhang, Z.; Zhang, Y.; Su, Y.; et al. Facile synthesis of Z-scheme ZnO/Ag/Ag3PO4 composite photocatalysts with enhanced performance for the degradation of ciprofloxacin. Mat. Chem. Phys. 2021, 260, 124136. [Google Scholar] [CrossRef]
  67. Dong, G.; Chi, W.; Chai, D.F.; Zhang, Z.; Li, J.; Zhao, M.; Zhang, W.; Lv, J.; Chen, S. A novel Ag3BiO3/ZnO/BC composite with abundant defects and utilizing hemp BC as charge transfer mediator for photocatalytic degradation of levofloxacin. Appl. Surface Sci. 2023, 619, 156732. [Google Scholar] [CrossRef]
  68. Abdel Salam, M.; Mokhtar, M.; Albukhari, S.M.; Baamer, D.F.; Palmisano, L.; Jaremko, M.; Abukhadra, M.R. Synthesis and Characterization of Green ZnO@polynaniline/Bentonite Tripartite Structure (G.Zn@PN/BE) as Adsorbent for As (V) Ions: Integration, Steric, and Energetic Properties. Polymers 2022, 14, 2329. [Google Scholar] [CrossRef]
Figure 1. Field-emission scanning electron microscopy (FESEM) images of the different components of the catalysts: ZnONPs at 50,000× (a) and 100,000× (b); rGO (c); and MoS2 (d).
Catalysts 13 00538 g001
Figure 2. High-resolution transmission electron microscopy (HRTEM) micrographs of the precursors: Au@ZnONPs at a magnification of 100,000× (a); Au@ZnONPs with two insets showing the selected area electron diffraction, SAED, and a micrograph at higher magnification showing the lattice fringes (b); rGO showing the lattice fringes (c); and the exfoliated MoS2 with an inset showing the SAED (d).
Catalysts 13 00538 g002
Figure 3. Raman spectra of rGO (a); ZnONPs (b); MoS2 (c); and 5%Au@ZnONPs-3%MoS2-1%rGO (d).
Catalysts 13 00538 g003
Figure 4. XRD patterns of ZnONPs (a); 5%Au@ZnONPs (b); MoS2 (c); rGO (d); and 5%Au@ZnONPs-3%MoS2-1%rGO (e).
Catalysts 13 00538 g004
Figure 5. XPS core level spectra for 5%Au@ZnONPs-3%MoS2-1%rGO: Zn2p (a); O1s (b); Au4f (c); C1s (d); and Mo3d-S2s (e).
Catalysts 13 00538 g005
Figure 6. Tauc plots of (αhn)2 versus energy (eV), and determination of the bandgap energy of ZnONPs (a); 5%Au@ZnONPs (b); MoS2 (c); 5%Au@ZnONPs-3%MoS2-1%rGO (d); and rGO (e).
Catalysts 13 00538 g006
Figure 7. Photodegradation rates of the antibiotics CFX (ac) and LFX (df) as a function of time by the different synthesized catalysts.
Catalysts 13 00538 g007
Figure 8. Degradation pathway of LFX (a) and CFX (b) under the effects of the most active catalysts (5%Au@ZnONPs-3%MoS2-1%rGO and 1%Au@ZnONPs-3%MoS2-1% rGO, respectively).
Catalysts 13 00538 g008
Figure 9. Schematic diagram of the proposed mechanism for CFX and LFX photodegradation using Au@ZnONPs-MoS2-rGO catalysts under visible irradiation.
Catalysts 13 00538 g009
Table 1. Comparison of the degradation of CFX and LFX using different ZnO heterostructured photocatalysts.
CatalystPercentage of Degradation (%)Degradation Time (min)IrradiationReference
CFXLFX
ZnO-Ag2O/porous g-C3N497.448Visible light[65]
ZnO/Ag/Ag3PO487.1120Visible light[66]
rGO-BiVO4-ZnO98.460Visible light[28]
Ag3BiO3/ZnO/BC*95.8120Visible light[67]
ZnO@polyaniline/bentonite9945Visible light[68]
Au@ZnO-rGO-g-C3N49996180Visible light[17]
This study9699.860**, 120***Visible light
▪: Not included in the study; BC*: biochar; 60**: CFX; 120***: LFX.
Disclaimer/Publisher’s Note: The statements, opinions and data contained in all publications are solely those of the individual author(s) and contributor(s) and not of MDPI and/or the editor(s). MDPI and/or the editor(s) disclaim responsibility for any injury to people or property resulting from any ideas, methods, instructions or products referred to in the content.

