Effect of Nutrient Removal and Resource Recovery on Life Cycle Cost and Environmental Impacts of a Small Scale Water Resource Recovery Facility

 , ,
, ,
Abstract
:1. Introduction
2. Methods
2.1. Scenario Analysis
2.2. Life Cycle Inventory Model
2.3. Life Cycle Impact Assessment
2.4. Life Cycle Cost Assessment
3. Results
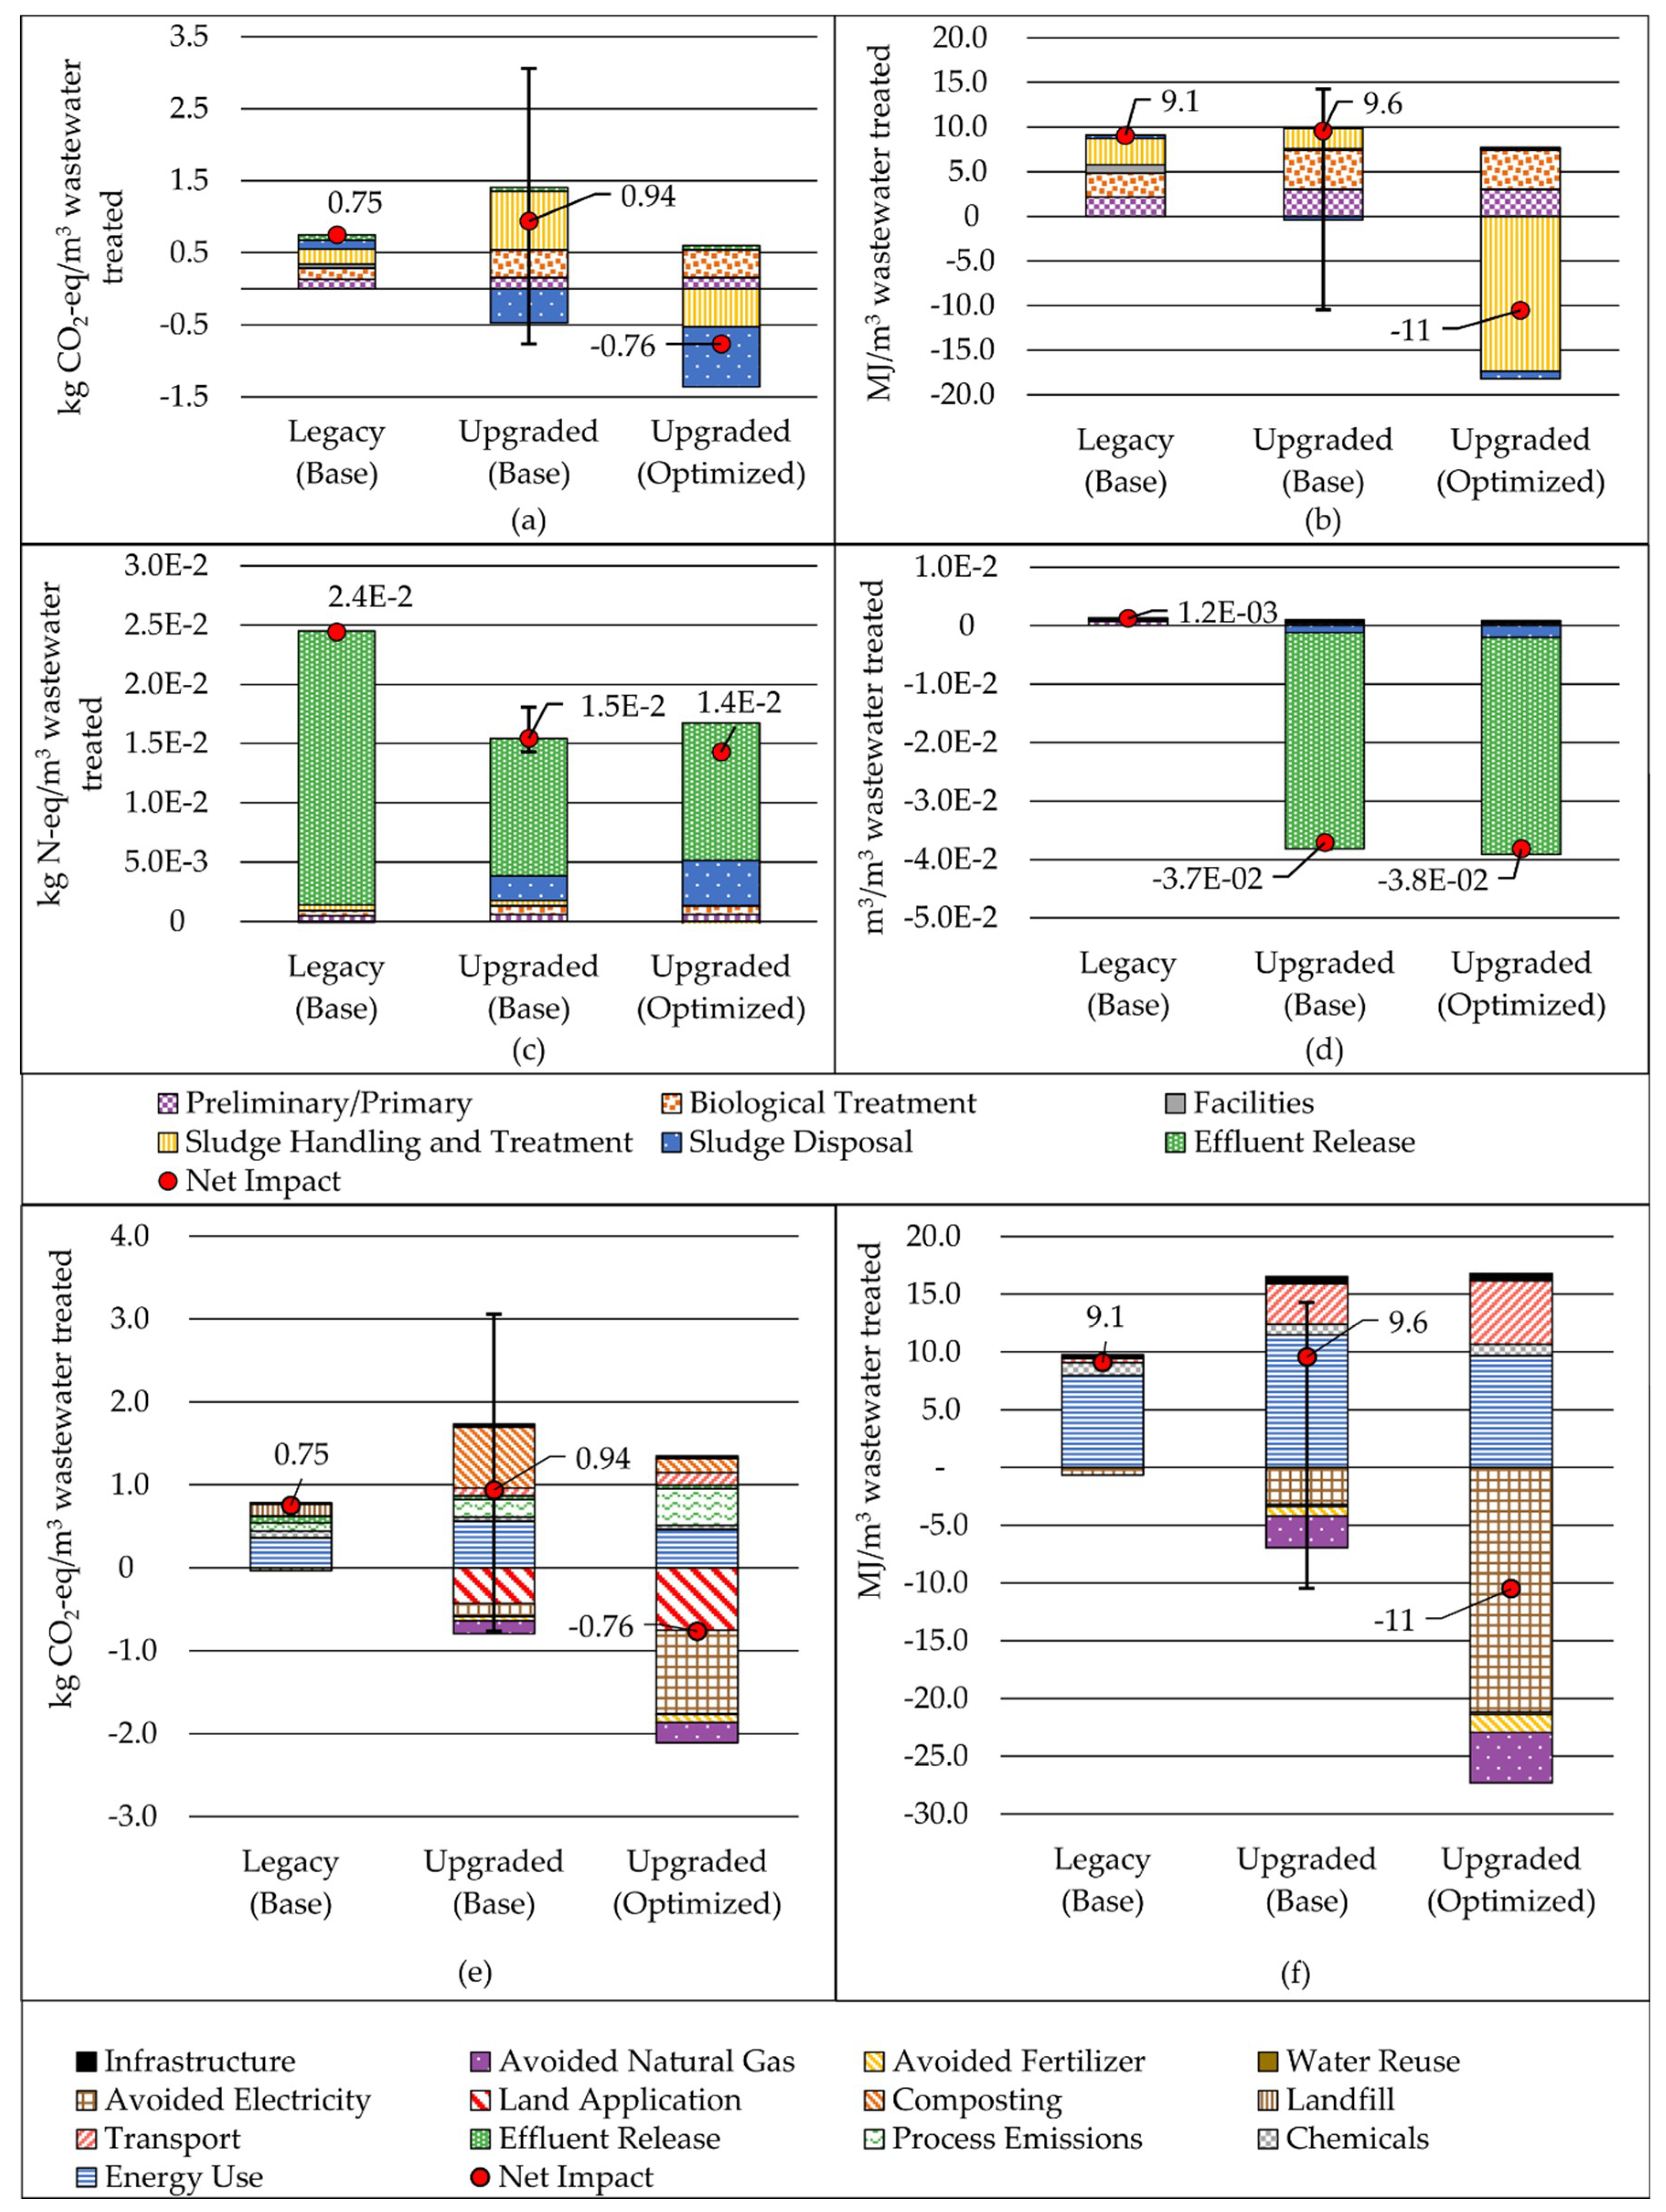
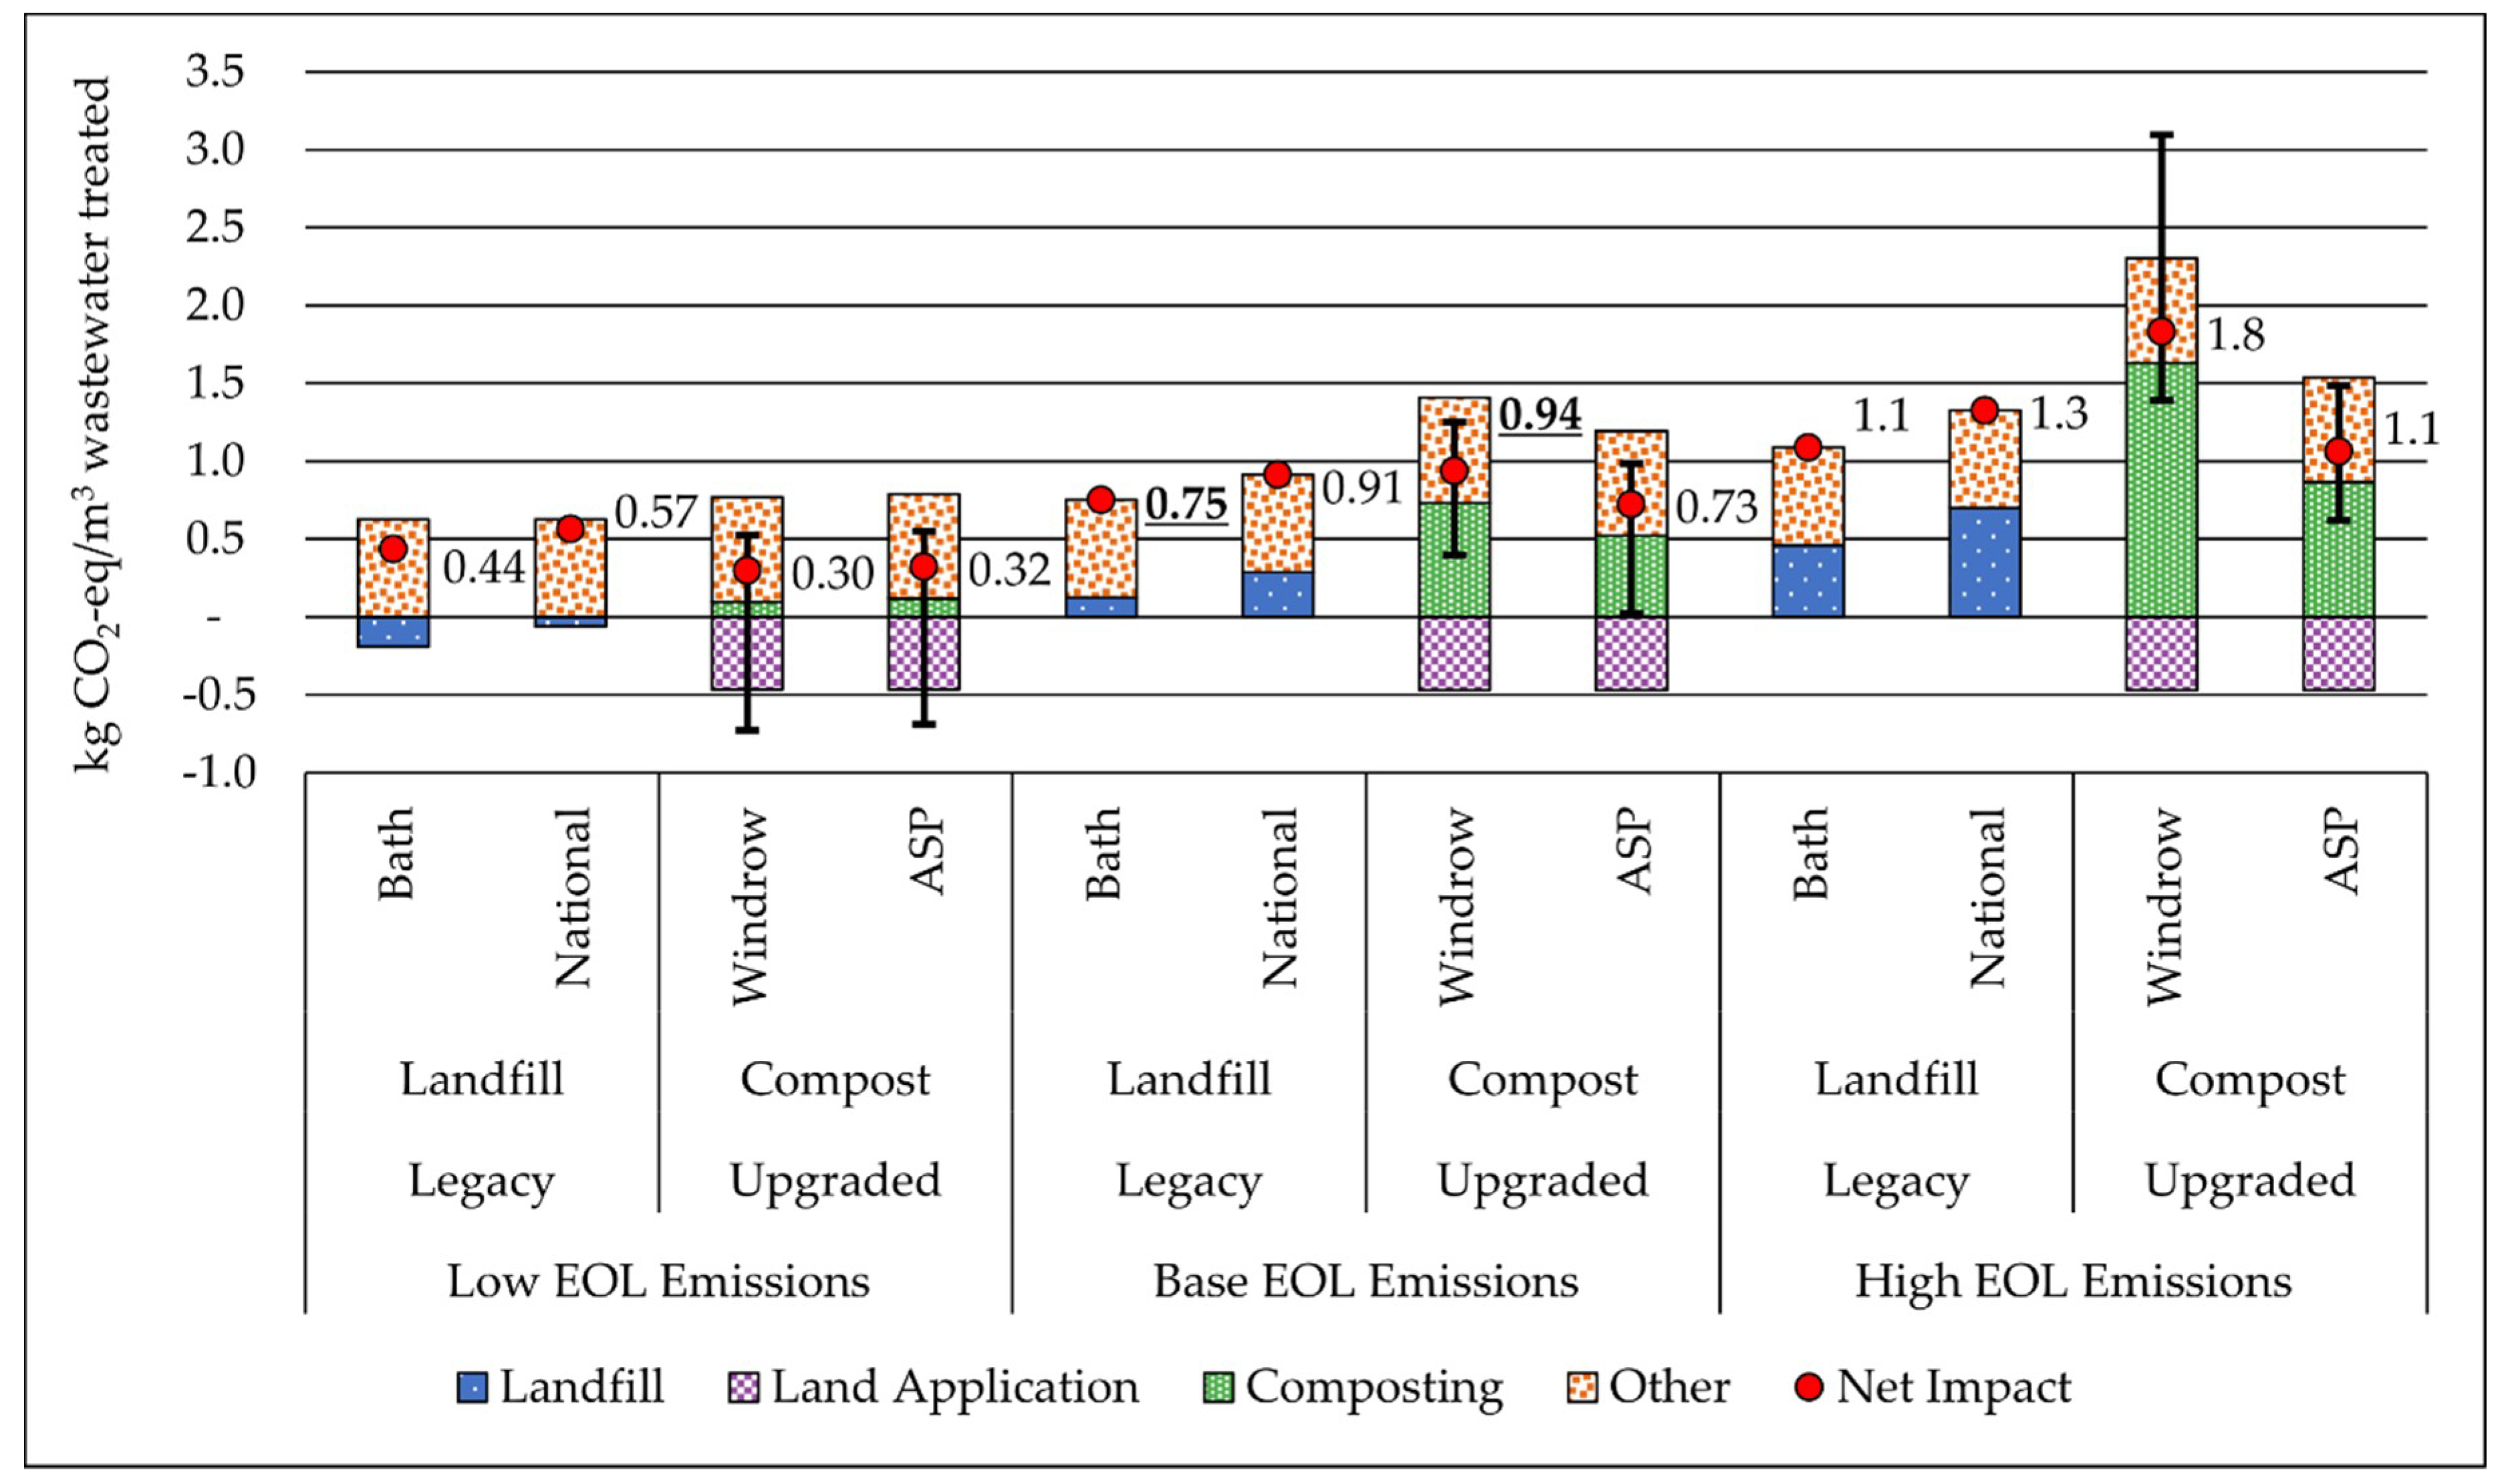
3.1. LCA Results
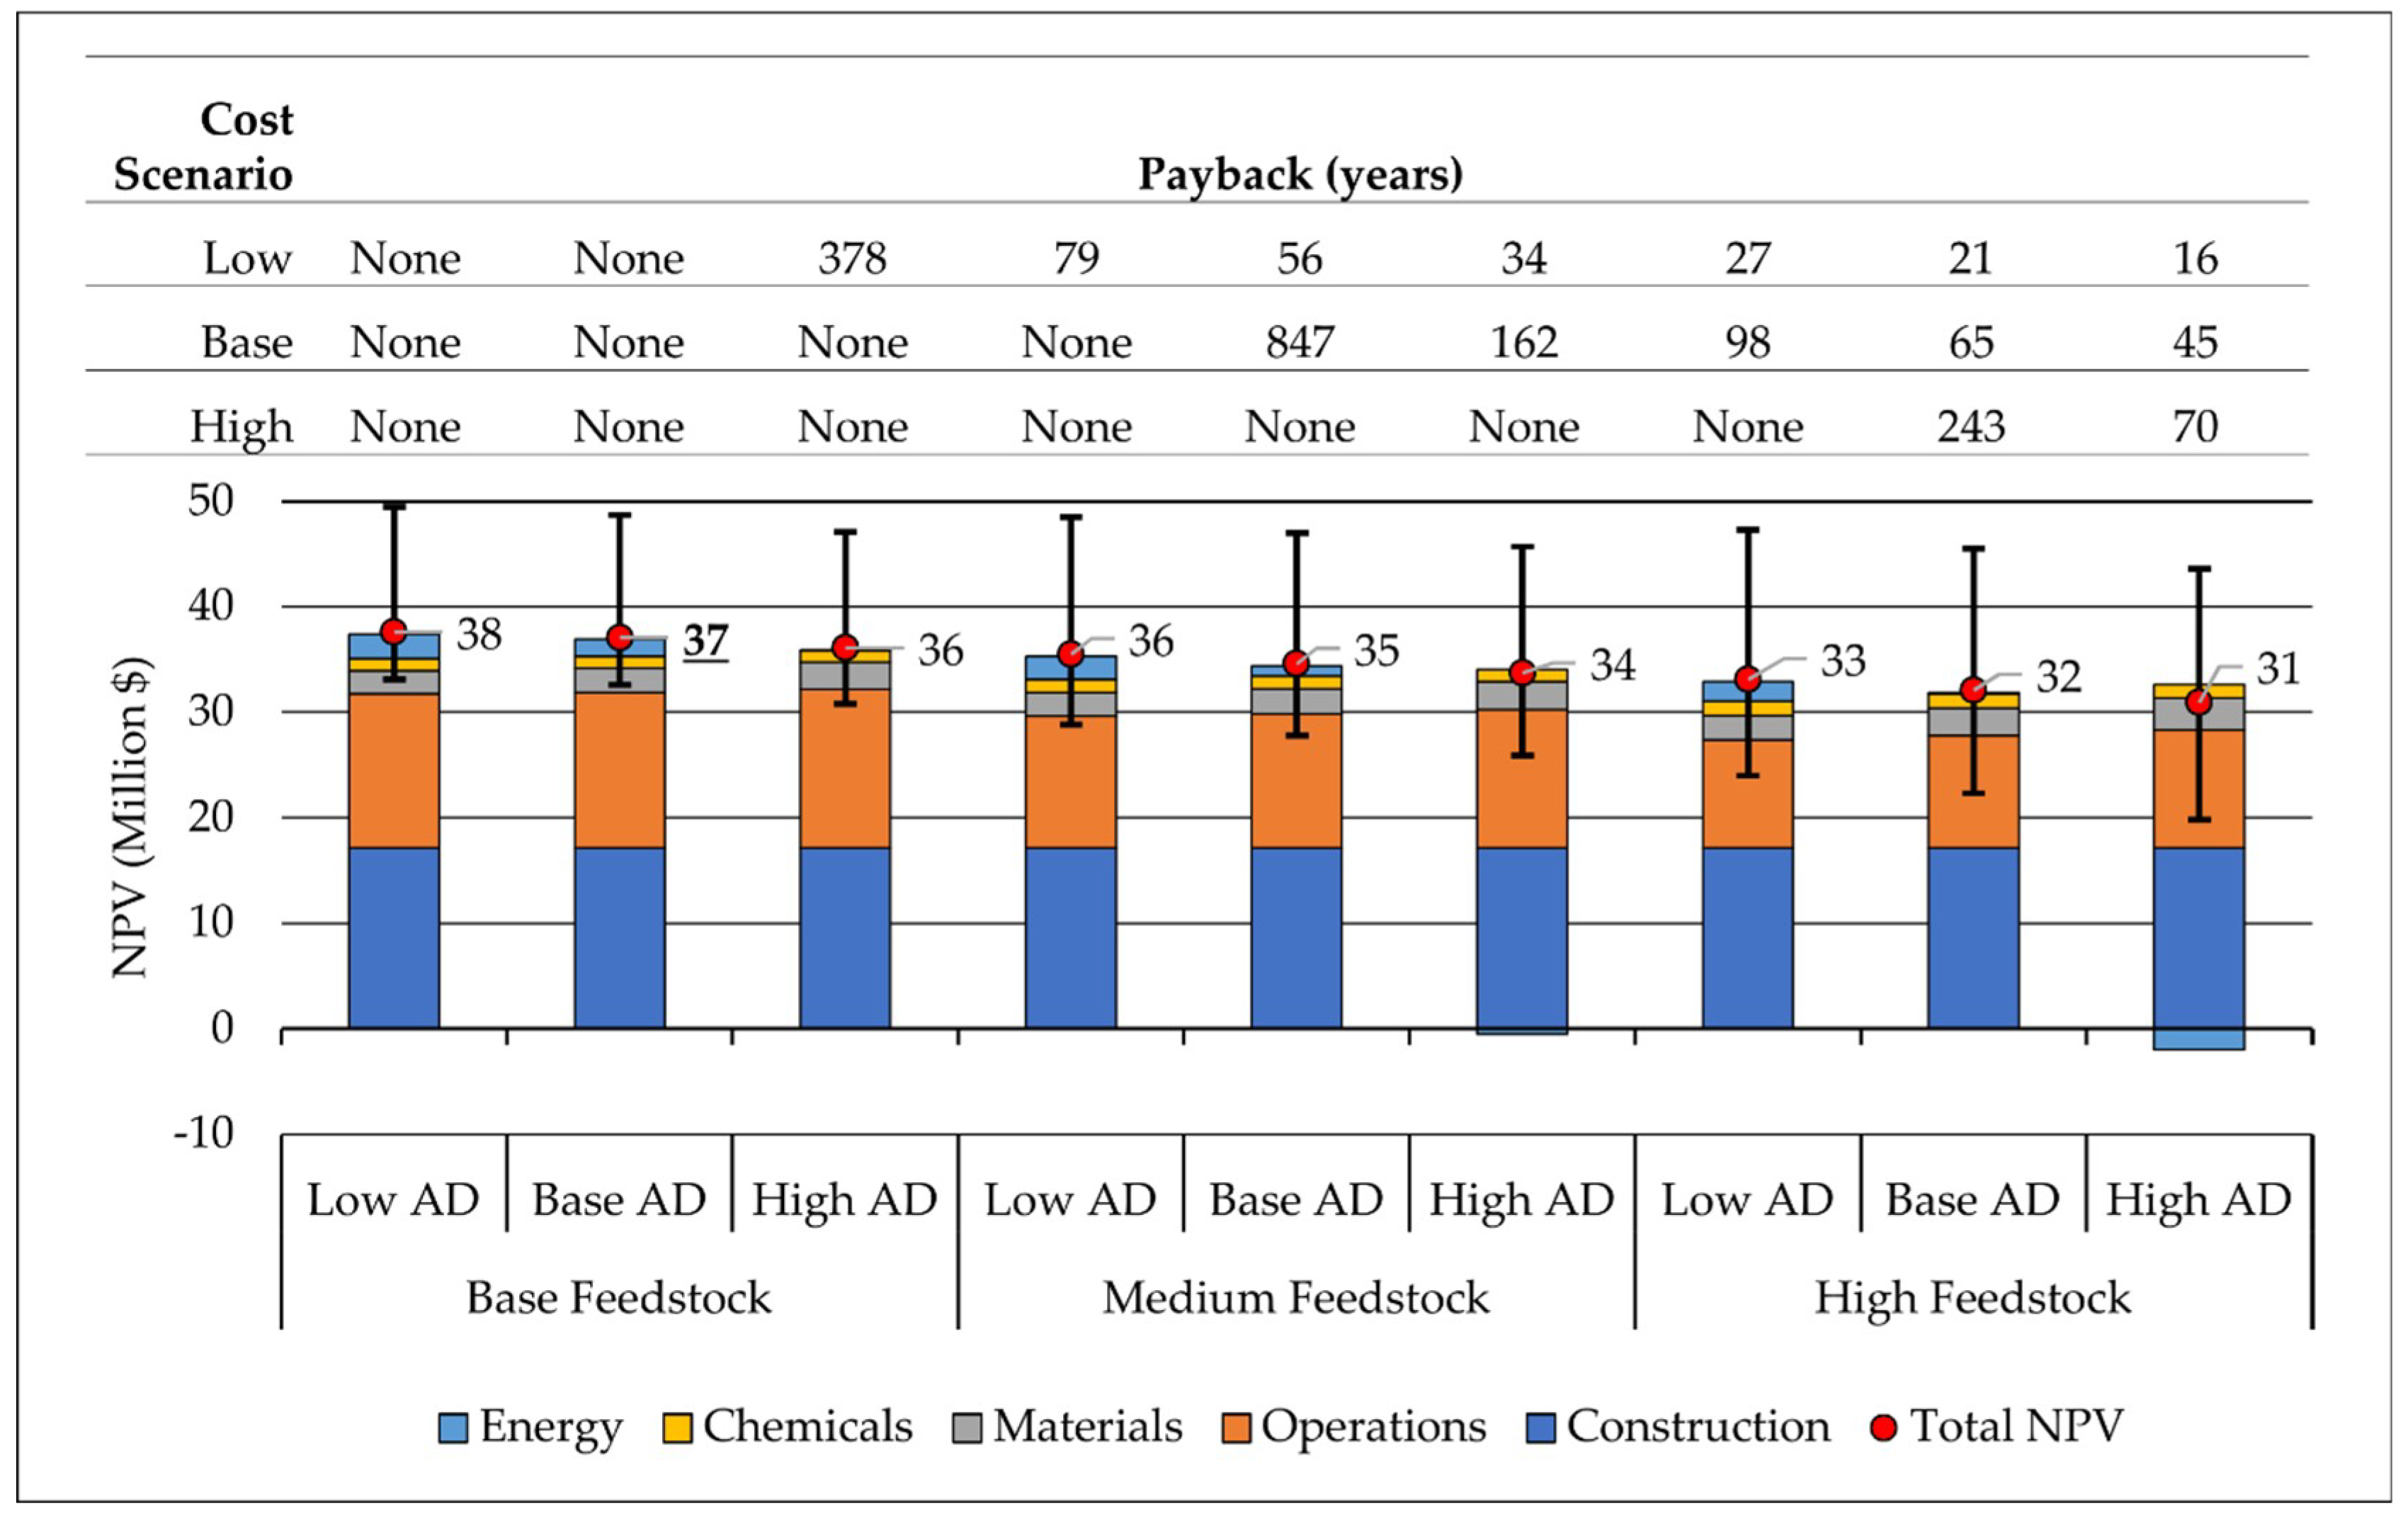
3.2. LCCA Results
4. Discussion
5. Conclusions
- Installation of AD and operation as a resource recovery hub yielded reductions in GCCP and CED that can offset increased energy and material requirements of enhanced nutrient removal.
- Sensitivity results demonstrated the environmental benefit of utilizing the full capacity of AD facilities by accepting HSOW and pursuing best management practices to achieve high AD operation performance while minimizing potential for GHG generation at composting facilities.
- The pairing of chemically enhance primary clarification with AD demonstrated the potential to increase biogas production, reducing overall plant environmental burdens.
- At the 1 MGD (3800 m3/day) scale, realization of environmental benefits from WRRF upgrades and a focus on resource recovery strategies are more reliably attainable than a monetary return on investment.
Supplementary Materials
Author Contributions
Funding
Disclaimer
Acknowledgments
Conflicts of Interest
References
- Ma, C.; Xue, X.; Gonzalez-Mejia, A.; Garland, J.; Cashdollar, J. Sustainable Water Systems for the City of Tomorrow—A Conceptual Framework. Sustainability 2015, 7, 12071–12105. [Google Scholar] [CrossRef] [Green Version]
- U.S. Environmental Protection Agency National Pollutant Discharge Elimination System (NPDES): Nutrient Permitting. Available online: https://www.epa.gov/npdes/nutrient-permitting (accessed on 6 September 2018).
- ASCE (American Society of Civil Engineers) 2017 Infrastructure Report Card: America’s Grades. Available online: https://www.infrastructurereportcard.org/americas-grades/ (accessed on 6 September 2018).
- Schoen, M.; Hawkins, T.; Xue, X.; Ma, C.; Garland, J.; Ashbolt, N.J. Technologic resilience assessment of coastal community water and wastewater service options. Sustain. Water Qual. Ecol. 2015, 6, 75–87. [Google Scholar] [CrossRef]
- Xue, X.; Schoen, M.E.; Ma, X.; Hawkins, T.R.; Ashbolt, N.J.; Cashdollar, J.; Garland, J. Critical insights for a sustainability framework to address integrated community water services: Technical metrics and approaches. Water Res. 2015, 77, 155–169. [Google Scholar] [CrossRef] [PubMed]
- Augustin, K.; Skambraks, A.K.; Li, Z.; Giese, T.; Rakelmann, U.; Meinzinger, F.; Schonlau, H.; Günner, C. Towards sustainable sanitation—The Hamburg Water Cycle in the settlement Jenfelder Au. Water Sci. Technol. 2014, 14, 13–21. [Google Scholar] [CrossRef]
- Grant, S.B.; Saphores, J.D.; Feldman, D.L.; Hamilton, A.J.; Fletcher, T.D.; Cook, P.L.M. Taking the “Waste” Out of “Wastewater” for human water security and ecosystem sustainability. Science 2012, 337, 681–686. [Google Scholar] [CrossRef] [PubMed]
- Guest, J.S.; Skerlos, S.J.; Barnard, J.L.; Beck, M.B.; Daigger, G.T.; Hilger, H.; Jackson, S.J.; Karvazy, K.; Kelly, L.; Macpherson, L.; et al. A new planning and design paradigm to achieve sustainable resource recovery from wastewater. Environ. Sci. Technol. 2009, 43, 6126–6130. [Google Scholar] [CrossRef] [PubMed]
- McCarty, P.L.; Bae, J.; Kim, J. Domestic wastewater treatment as a net energy producer—Can this be achieved? Environ. Sci. Technol. 2011, 45, 7100–7106. [Google Scholar] [CrossRef] [PubMed]
- U.S. Environmental Protection Agency. Case Study Primer for Participant Discussion: Biodigesters and Biogas; U.S. Environmental Protection Agency: Washington, DC, USA, 2012.
- Berger, M.; Finkbeiner, M. Water footprinting: How to address water use in life cycle assessment? Sustainability 2010, 2, 919–944. [Google Scholar] [CrossRef]
- Muñoz, I.; Rodríquez, A.; Rosal, R.; Fernández-Alba, A.R. Life cycle assessment of urban wastewater reuse with ozonation as tertiary treatment: A focus on toxicity-related impacts. Sci. Total Environ. 2009, 407, 1245–1256. [Google Scholar] [CrossRef] [PubMed]
- Hester, E.T.; Little, J.C. Measuring environmental sustainability of water in watersheds. Environ. Sci. Technol. 2013, 47, 8083–8090. [Google Scholar] [CrossRef] [PubMed]
- Fulcher, J. Changing the Terms. Available online: https://news.wef.org/changing-the-terms/ (accessed on 3 August 2018).
- New York State Department of Environmental Conservation. State Pollutant Discharge Elimination System Permit for Village of Bath Wastewater Treatment Plant; New York State Department of Environmental Conservation: New York, NY, USA, 2014.
- Chesapeake Bay Foundation about the Bay: The Issues. Available online: http://www.cbf.org/about-the-bay/issues (accessed on 24 May 2017).
- Conestoga-Rovers and Associates. Village of Bath WWTP Upgrades Final Engineering Report; Bath Electric, Gas & Water Systems: Bath, NY, USA, 2015. [Google Scholar]
- Comela, R. Navalis Construction Announces Completion of Renewable Landfill Gas-to-Energy Plant in Upstate New York; Navalis Construction: Rochester, NY, USA, 2010. [Google Scholar]
- Tchobanoglous, G.; Burton, F.L.; Stensel, H.D.; Tsuchihashi, R.; Abu-Orf, M.; Bowden, G.; Pfrang, W. Wastewater Engineering: Treatment and Resource Recovery, 5th ed.; McGraw-Hill Education: New York, NY, USA, 2014; ISBN 978-0-07-340118-8. [Google Scholar]
- Cornejo, P.K.; Zhang, Q.; Mihelcic, J.R. How does scale of implementation impact the environmental sustainability of wastewater treatment integrated with resource recovery? Environ. Sci. Technol. 2016, 50, 6680–6689. [Google Scholar] [CrossRef] [PubMed]
- Machado, A.P.; Urbano, L.; Brito, A.G.; Janknecht, P.; Salas, J.J.; Nogueira, R. Life cycle assessment of wastewater treatment options for small and decentralized communities. Water Sci. Technol. 2007, 56, 15–22. [Google Scholar] [CrossRef] [PubMed] [Green Version]
- Chiu, S.L.H.; Lo, I.M.C.; Woon, K.S.; Yan, D.Y.S. Life cycle assessment of waste treatment strategy for sewage sludge and food waste in Macau: Perspectives on environmental and energy production performance. Int. J. Life Cycle Assess. 2016, 21, 176–189. [Google Scholar] [CrossRef]
- Edwards, J.; Othman, M.; Crossin, E.; Burn, S. Anaerobic co-digestion of municipal food waste and sewage sludge: A comparative life cycle assessment in the context of a waste service provision. Bioresour. Technol. 2017, 223, 237–249. [Google Scholar] [CrossRef] [PubMed]
- Krupp, M.; Schubert, J.; Widmann, R. Feasibility study for co-digestion of sewage sludge with OFMSW on two wastewater treatment plants in Germany. Waste Manag. 2005, 25, 393–399. [Google Scholar] [CrossRef] [PubMed]
- Righi, S.; Oliviero, L.; Pedrini, M.; Buscaroli, A.; Della Casa, C. Life Cycle Assessment of management systems for sewage sludge and food waste: Centralized and decentralized approaches. J. Clean. Prod. 2013, 44, 8–17. [Google Scholar] [CrossRef]
- US EPA, O. Small Wastewater Systems Research. Available online: https://www.epa.gov/water-research/small-wastewater-systems-research-0 (accessed on 25 September 2018).
- ISO. ISO 14044: 2006 Environmental Management—Life Cycle Assessment—Requirements and Guidelines; ISO 14044; The International Organization for Standardization: Geneva, Switzerland, 2006; p. 54. [Google Scholar]
- BEGWS (Bath Electric Gas & Water Systems). Bath Wastewater Treatment Plant Influent and Effluent Water Quality Data: October 2011 to November 2015; BEGWS: Bath, NY, USA, 2011–2015. [Google Scholar]
- U.S. Environmental Protection Agency. Inventory of U.S. Greenhouse Gas Emissions and Sinks: 1990–2013; U.S. Environmental Protection Agency: Washington, DC, USA, 2015.
- Research Triangle Institute. Greenhouse Gas Emissions Estimation Methodologies for Biogenic Emissions from Selected Source Categories: Solid Waste Disposal, Wastewater Treatment, Ethanol Fermentation; U.S. Environmental Protection Agency: Washington, DC, USA, 2010.
- Appleton, A.R.; Rauch-Williams, T. Co-Digestion of Organic Waste Addressing Operational Side-Effects; Water Environment Research Foundation: Alexandria, VA, USA, 2017. [Google Scholar]
- Wiser, J.R.; Schettler, J.W.; Willis, J.L. Evaluation of Combined Heat and Power Technologies for Wastewater Treatment Facilities; U.S. Environmental Protection Agency: Washington, DC, USA, 2010.
- SYLVIS Environmental. The Biosolids Emissions Assessment Model (BEAM); Canadian Council of Ministers of the Environment: Winnipeg, MB, Canada, 2011. [Google Scholar]
- Hellmann, B.; Zelles, L.; Palojarvi, A.; Bai, Q. Emission of climate-Relevant trace gases and succession of microbial communities during open-Windrow composting. Appl. Environ. Microbiol. 1997, 63, 1011–1018. [Google Scholar] [PubMed]
- Hellebrand, H.J. Emission of nitrous oxide and other trace gases during composting of grass and green waste. J. Agric. Eng. Res. 1998, 69, 365–375. [Google Scholar] [CrossRef]
- Fukumoto, Y.; Osada, T.; Hanajima, D.; Haga, K. Patterns and quantities of NH3, N2O and CH4 emissions during swine manure composting without forced aeration––Effect of compost pile scale. Bioresour. Technol. 2003, 89, 109–114. [Google Scholar] [CrossRef]
- Hydromantis. CAPDETWorks Version 3.0 Software: Rapid Design and Costing Solution for Wastewater Treatment Plants; Hydromantis Environmental Software Solution: Hamilton, ON, Canada, 2014. [Google Scholar]
- CDM Smith. Technical Memorandum Report Greater Lawrence Sanitary District Organics to Energy Feasibility Study; CDM Smith: Boston, MA, USA, 2013; p. 95. [Google Scholar]
- Czepiel, P.M.; Crill, P.M.; Harriss, R.C. Nitrous oxide emissions from municipal wastewater treatment. Environ. Sci. Technol. 1995, 29, 2352–2356. [Google Scholar] [CrossRef] [PubMed]
- Intergovernmental Panel on Climate Change. IPCC Guidelines for National Greenhouse Gas Inventories, Prepared by the IPCC, National Greenhouse Gas Inventories Programme; IGES: Kanagawa, Japan, 2006; ISBN 4-88788-032-4. [Google Scholar]
- Czepiel, P.M.; Crill, P.M.; Harriss, R.C. Methane emissions from municipal wastewater treatment processes. Environ. Sci. Technol. 1993, 27, 2472–2477. [Google Scholar] [CrossRef]
- Daelman, M.R.; van Voorthuizen, E.M.; van Dongen, L.G.; Volcke, E.; van Loosdrecht, M.C. Methane and nitrous oxide emissions from municipal wastewater treatment–Results from a long-Term study. Water Sci. Technol. 2013, 67, 2350–2355. [Google Scholar] [CrossRef] [PubMed]
- Chandran, K. Greenhouse Nitrogen Emissions from Wastewater Treatment Operation: Phase I; Water Environment Research Foundation: Alexandria, VA, USA, 2012; ISBN 978-1-78040-481-3. [Google Scholar]
- Smith, K.A.; Jeffrey, W.A.; Metcalfe, J.P.; Sinclair, A.H.; Williams, J.R. Nutrient Value of Digestate from Farm-Based Biogas Plants; Scottish Executive Environmental and Rural Affairs Department: Edinburgh, UK, 2007. [Google Scholar]
- NREL U.S. Life Cycle Inventory Database 2012. Available online: https://www.lcacommons.gov/lca-collaboration/search/page=1&group=National_Renewable_Energy_Laboratory (accessed on 1 October 2018).
- Frischknecht, R.; Jungbluth, N.; Althaus, H.-J.; Doka, G.; Dones, R.; Heck, T.; Hellweg, S.; Hischier, R.; Nemecek, T.; Rebitzer, G.; et al. The ecoinvent database: Overview and methodological framework. Int. J. Life Cycle Assess. 2005, 10, 3–9. [Google Scholar] [CrossRef]
- Bare, J. TRACI 2.0: The Tool for the reduction and assessment of chemical and other environmental impacts. Clean Technol. Environ. Policy 2011, 13, 687–696. [Google Scholar] [CrossRef]
- Bare, J.; Norris, G.A.; Pennington, D.W.; McKone, T. TRACI: The Tool for the reduction and assessment of chemical and other environmental Impacts. J. Ind. Ecol. 2002, 6, 49–78. [Google Scholar] [CrossRef]
- Goedkoop, M.; Heijungs, R.; Huijbregts, M.; De Schryver, A.; Struijs, J.; van Zelm, R. ReCiPe 2008: A Life Cycle Impact Assessment Method Which Comprises Harmonised Category Indicators at the Midpoint and the Endpoint Level: Report 1 Characterization; ReCiPe: Bilthoven, The Netherlands, 2009. [Google Scholar]
- Althaus, H.-J.; Bauer, C.; Doka, G.; Dones, R.; Frischknecht, R.; Hellweg, S.; Humbert, S.; Jungbluth, N.; Kollner, T.; Loerincik, Y.; et al. Implementation of Life Cycle Impact Assessment Methods: Data v2.2 (2010); Ecoinvent Centre: St. Gallen, Switzerland, 2010. [Google Scholar]
- GHD Engineering. Life Cycle Cost Analysis Evaluation: Preliminary and Primary Treatment; Bath Electric, Gas & Water Systems: Bath, NY, USA, 2016. [Google Scholar]
- RSMeans; Building Construction Cost Data 2016. Available online: https://www.rsmeans.com/ (accessed on 1 October 2018).
- Canadian Council of Ministers of the Environment. Biosolids Emissions Assessment Model (BEAM): User Guide; Canadian Council of Ministers of the Environment: Winnipeg, MB, Canada, 2009. [Google Scholar]
- Bolzonella, D.; Battistoni, P.; Susini, C.; Cecchi, F. Anaerobic codigestion of waste activated sludge and OFMSW: The experiences of Viareggio and Treviso plants (Italy). Water Sci. Technol. 2006, 53, 203–211. [Google Scholar] [CrossRef] [PubMed]
- Remy, C.; Jekel, M. Energy analysis of conventional and source-separation systems for urban wastewater management using life cycle assessment. Water Sci. Technol. 2012, 65, 22–29. [Google Scholar] [CrossRef] [PubMed]


| Characteristic | Influent [28] | Effluent, Legacy [28] | Effluent, Upgraded [17] | Effluent, Permitted [15] | Units |
|---|---|---|---|---|---|
| Suspended Solids | 437 | 7.9 | 5 | 30 | mg/L |
| CBOD5 1 | 279 | 7.4 | 2 | 25 | mg/L |
| Total Kjeldahl Nitrogen | 56 | 16 | 4.4 | n.a. 2 | mg/L N |
| Ammonia | 32 | 6.7 | 3.6 | 3.6 3 | mg/L NH3 |
| Total Phosphorus | 8 | 0.7 | 0.6 | 0.6 | mg/L P |
| Nitrite | <1 | 2.8 | 0.8 | n.a. 2 | mg/L N |
| Nitrate | <1 | 13 | 14 | n.a. 2 | mg/L N |
| Organic Nitrogen | 29 | 9 | 0.8 | n.a. 2 | mg/L N |
| Total Nitrogen | 57 | 31 | 20 | 20 | mg/L N |
| Feedstock Type 1 | Legacy 2 | Low (Base) * | Medium | High | Units |
|---|---|---|---|---|---|
| Feedstock Quantity | |||||
| Primary Sludge | 67 | 71 | 71 | 71 | m3/day |
| Waste Activated Sludge | 290 | 300 | 300 | 300 | m3/day |
| Septage | 30 | 61 | 61 | 61 | m3/day |
| High Strength Organic Waste | - | - | 15 | 30 | m3/day |
| Anaerobic Digestion Parameter | Low | Base * | High | |
|---|---|---|---|---|
| AD Performance | Units | |||
| Loading Rate 1 | 220 | 270 | 350 | kg VS/m3/day |
| Biogas Yield 2 | 0.75 | 0.94 | 2.2 | m3/kg VS destroyed |
| Volatile Solids Reduction [31] | 45 | 60 | 65 | % |
| Methane Content of Biogas [32] | 60 | 65 | 70 | % v/v |
| Biogas Heat Content [32] | 0.55 | 0.59 | 0.61 | MJ/ft3 |
| CHP Electrical Efficiency | 30 [32] | 36 [17] | 42 [32] | % |
| CHP Thermal Efficiency | 41 [32] | 51 [17] | 43 [32] | % |
| EOL Treatment Option | Low | Base * | High | |
|---|---|---|---|---|
| Landfill—with Methane Capture 1 | GHG Emissions | Units | ||
| Carbon Content of Dry Solids | 38 [33] | 48 | 57 [33] | % |
| Degradable Organic Carbon [30] | 5.0 | 5.0 | 5.0 | % wet mass 2 |
| Degradable Carbon Decomposed [33] | 50 | 65 | 80 | % |
| Degraded Carbon to CH4 [30,33] | 50 | 50 | 50 | % |
| Methane to CO2 in landfill cover [33] | 25 | 10 [30] | 3 | % |
| k, degradation rate | 0.10 | 0.18 | 0.23 | unitless |
| EOL Treatment Option | Low | Base * | High | |
| Composting 3 | GHG Emissions | Units | ||
| CH4 Emissions 4 | 0.11 [34] | 0.82 | 2.5 [35] | % incoming C |
| N2O Emissions 5 | 0.34 [34] | 2.7 | 4.7 [36] | % incoming N |
| Treatment Stage | Material and Energy Inputs 1 | Process Emissions | Avoided Products | |||||||
|---|---|---|---|---|---|---|---|---|---|---|
| Electricity | Natural Gas | Transport | Chemicals | Methane | Nitrous Oxide | Electricity | Natural Gas | Fertilizer | Effluent Reuse | |
| kWh/m3 | MJ/m3 | tkm/m3 | kg/m3 | kg/m3 | kg/m3 | kWh/m3 | MJ/m3 | kg/m3 | m3/m3 | |
| Legacy WRRF (Base Scenario) | ||||||||||
| Primary Treatment | 0.15 | - | - | 0.55 | - | - | - | - | - | - |
| Secondary Treatment | 0.36 | - | - | - | 6. 3 × 10⁻⁴ | 2.5 × 10⁻⁵ | - | - | - | - |
| Sludge Processing | 0.39 | - | - | 5.4 × 10⁻⁴ | 2. 4 × 10⁻³ | 5.7 × 10⁻⁵ | - | - | - | - |
| End-of-Life | - | - | 0.05 | - | 0.02 | 6.1 × 10⁻⁴ | 0.09 | - | - | - |
| Effluent Release | 9. 3 × 10⁻⁵ | - | - | - | - | 2.5 × 10⁻⁴ | - | - | - | - |
| Facilities | - | 0.71 | - | - | - | - | - | - | - | - |
| Total | 0.90 | 0.71 | 0.05 | 0.55 | 0.02 | 9.4 × 10⁻⁴ | 0.09 | - | - | - |
| Upgraded WRRF (Base Scenario) | ||||||||||
| Primary Treatment | 0.32 | - | - | 0.03 | - | - | - | - | - | - |
| Secondary Treatment | 0.61 | - | - | 4. 8 × 10⁻³ | 5. 3 × 10⁻³ | 1.1 × 10⁻⁴ | - | - | - | 0.04 |
| Sludge Processing | 0.38 | 0.56 | 0.40 | 5.0 × 10⁻³ | 1. 8 × 10⁻³ | - | 0.45 | 2.2 | - | - |
| End-of-Life | 5. 5 × 10⁻⁴ | - | 0.05 | - | 0.01 | 1.7 × 10⁻³ | - | - | 0.03 | - |
| Effluent Release | 0.03 | - | - | - | - | 1.5 × 10⁻⁴ | - | - | - | - |
| Facilities | - | 1.1 | - | - | - | - | - | - | - | - |
| Total | 1.3 | 1.7 | 0.45 | 0.04 | 0.02 | 2.0 × 10⁻³ | 0.45 | 2.2 | 0.03 | 0.04 |
© 2018 by the authors. Licensee MDPI, Basel, Switzerland. This article is an open access article distributed under the terms and conditions of the Creative Commons Attribution (CC BY) license (http://creativecommons.org/licenses/by/4.0/).
Share and Cite
Morelli, B.; Cashman, S.; Ma, X.; Garland, J.; Turgeon, J.; Fillmore, L.; Bless, D.; Nye, M. Effect of Nutrient Removal and Resource Recovery on Life Cycle Cost and Environmental Impacts of a Small Scale Water Resource Recovery Facility. Sustainability 2018, 10, 3546. https://doi.org/10.3390/su10103546
Morelli B, Cashman S, Ma X, Garland J, Turgeon J, Fillmore L, Bless D, Nye M. Effect of Nutrient Removal and Resource Recovery on Life Cycle Cost and Environmental Impacts of a Small Scale Water Resource Recovery Facility. Sustainability. 2018; 10(10):3546. https://doi.org/10.3390/su10103546
Chicago/Turabian StyleMorelli, Ben, Sarah Cashman, Xin (Cissy) Ma, Jay Garland, Jason Turgeon, Lauren Fillmore, Diana Bless, and Michael Nye. 2018. "Effect of Nutrient Removal and Resource Recovery on Life Cycle Cost and Environmental Impacts of a Small Scale Water Resource Recovery Facility" Sustainability 10, no. 10: 3546. https://doi.org/10.3390/su10103546