 Melise C. Lecheta1*
 David N. Awde1
 Thomas S. O’Leary2
 Laura N. Unfried1
 Nicholas A. Jacobs1Miles H. Whitlock1Eleanor McCabe1Beck Powers2Katie Bora2James S. Waters3
 Heather J. Axen4
 Seth Frietze5Brent L. Lockwood2
 Nicholas M. Teets1Sara H. Cahan2
- 1Department of Entomology, University of Kentucky, Lexington, KY, United States
- 2Department of Biology, University of Vermont, Burlington, VT, United States
- 3Department of Biology, Providence College, Providence, RI, United States
- 4Department of Biology and Biomedical Sciences, Salve Regina College, Providence, RI, United States
- 5Department of Biomedical and Health Sciences, University of Vermont, Burlington, VT, United States
Thermal tolerance of an organism depends on both the ability to dynamically adjust to a thermal stress and preparatory developmental processes that enhance thermal resistance. However, the extent to which standing genetic variation in thermal tolerance alleles influence dynamic stress responses vs. preparatory processes is unknown. Here, using the model species Drosophila melanogaster, we used a combination of Genome Wide Association mapping (GWAS) and transcriptomic profiling to characterize whether genes associated with thermal tolerance are primarily involved in dynamic stress responses or preparatory processes that influence physiological condition at the time of thermal stress. To test our hypotheses, we measured the critical thermal minimum (CTmin) and critical thermal maximum (CTmax) of 100 lines of the Drosophila Genetic Reference Panel (DGRP) and used GWAS to identify loci that explain variation in thermal limits. We observed greater variation in lower thermal limits, with CTmin ranging from 1.81 to 8.60°C, while CTmax ranged from 38.74 to 40.64°C. We identified 151 and 99 distinct genes associated with CTmin and CTmax, respectively, and there was strong support that these genes are involved in both dynamic responses to thermal stress and preparatory processes that increase thermal resistance. Many of the genes identified by GWAS were involved in the direct transcriptional response to thermal stress (72/151 for cold; 59/99 for heat), and overall GWAS candidates were more likely to be differentially expressed than other genes. Further, several GWAS candidates were regulatory genes that may participate in the regulation of stress responses, and gene ontologies related to development and morphogenesis were enriched, suggesting many of these genes influence thermal tolerance through effects on development and physiological status. Overall, our results suggest that thermal tolerance alleles can influence both dynamic plastic responses to thermal stress and preparatory processes that improve thermal resistance. These results also have utility for directly comparing GWAS and transcriptomic approaches for identifying candidate genes associated with thermal tolerance.
Introduction
Temperature directly affects performance, survival, fitness, and consequently, the geographic distribution of organisms (Angilletta, 2009; Dowd et al., 2015). Ectotherms are particularly vulnerable to changes in temperature, and these organisms have evolved a suite of adaptations to cope with thermal variability. An ectotherm’s thermal tolerance is determined by both fixed genetic factors and plastic changes in behavior, morphology, physiology, and gene expression. Genetic variation in thermal tolerance is well-documented (e.g., Sørensen et al., 2001; McMillan et al., 2005; Rako et al., 2007) and can occur through changes in basal stress tolerance and/or changes in the ability to quickly respond to thermal challenges (Ayrinhac et al., 2004). These heritable differences within populations permit evolutionary shifts in thermal response as selection acts (Hoffmann et al., 2003), and adaptive differences in thermal tolerance across latitudinal gradients and thermal environments are common (Hoffmann et al., 2002; Fallis et al., 2014). Specifically, populations from higher latitudes often are more tolerant of low temperatures than populations from lower latitudes, and the same pattern is also seen for heat stress, where populations that extend to lower latitudes often have improved survival at high temperatures (e.g., Calosi et al., 2010; but see Castañeda et al., 2015). Thus, thermal tolerance is a trait that is both highly plastic and highly adaptable, and understanding the genetic basis of thermal tolerance is critical for predicting future responses to environmental change.
Genome Wide Association Studies (GWAS) and other quantitative genetic approaches have characterized the genetic architecture of thermal tolerance and identified genes that regulate temperature-dependent traits (e.g., Morgan and Mackay, 2006; Rako et al., 2007; Svetec et al., 2011; Rohde et al., 2016). A series of recent studies with the Drosophila Genetic Reference Panel (DGRP; Mackay et al., 2012) have identified a number of candidate loci associated with thermal tolerance. Rolandi et al. (2018) found 12 SNPs associated with variation in critical thermal maximum (CTmax), and most of these SNPs were located within intronic regions, suggesting that variation in the heat stress response could be mediated by regulatory changes in gene expression or splicing. For cold, distinct but related traits often have non-overlapping genetic architectures, suggesting these traits have the capacity to evolve independently. For example, two plastic responses to cold, rapid cold hardening and developmental cold acclimation, have non-overlapping SNPs associated with them, although the genes associated with these traits share some functional similarities (Gerken et al., 2015). Similarly, Teets and Hahn (2018) found minimal overlap in genes associated with cold shock response and chill coma recovery, and Freda et al. (2017) found no overlap in genes associated with adult and larval cold hardiness. The candidate genes identified in Teets and Hahn (2018) were functionally tested with RNAi, and knockdown of most genes affected cold tolerance, indicating that GWAS is a robust method for identifying genes with functional roles in thermal tolerance. Taken together, the various GWAS studies of thermal traits indicate that the thermal stress response is a highly polygenic trait, but additional studies linking these polymorphisms to their functional consequences are needed to clarify their role in thermal tolerance.
One way the genetic makeup of an organism influences thermal tolerance is by modifying gene expression changes in response to temperature change (Stucki et al., 2017). Transcriptional responses to thermal variability have been described at various levels, including whole transcriptomic studies of specific stress treatments (e.g., Qin et al., 2005; Sørensen et al., 2005, 2016; Teets et al., 2012), targeted experiments for specific candidate genes (e.g., Frost in Goto, 2001; Sinclair et al., 2007; Zhu et al., 2017), and comparisons of transcriptomic responses to thermal stressors both among (e.g., in damselflies; Lancaster et al., 2016) and within populations (e.g., Telonis-Scott et al., 2009). A consistent theme from these studies is that changing temperatures can cause substantial changes in gene expression. For example, in D. melanogaster, acclimation that enhanced the cold response led to nearly one third of the transcriptome being differentially regulated (with around 60% of these genes being downregulated; MacMillan et al., 2016). This cold acclimation included upregulation of genes already known to have an association with stress and temperature responses, such as Frost and many genes encoding for heat shock proteins. Similar sets of genes are also upregulated following brief cold shock in D. melanogaster and the flesh fly Sarcophaga bullata (Qin et al., 2005; Teets et al., 2012), indicating that anticipatory acclimation responses share some mechanisms with dynamic responses that occur during and after stress. For heat stress, most genes that are differentially expressed following short-term heat hardening (Sørensen et al., 2005) and heat shock (Telonis-Scott et al., 2013) in D. melanogaster are downregulated, with the exception of heat shock proteins, which are generally upregulated. However, despite the large body of literature on transcriptional responses to thermal stress, additional work is needed to clarify the functional consequences of these transcriptomic changes and determine how segregating variation in thermal tolerance relates to these transcriptional mechanisms.
Thermal tolerance is a combination of dynamic plastic changes that occur during and after a stress event (i.e., processes that actively counter, repair or minimize the consequences of damage) and preparative processes that enhance stress resistance (i.e., processes that prevent damage; Roy and Kirchner, 2000; Wos and Willi, 2015). Plastic processes that occur during and after thermal stress largely involve production of stress proteins (e.g., heat shock proteins), often at the expense of other biological processes (Feder and Hofmann, 1999). Preparative processes that enhance thermal resistance include production of protective osmolytes (e.g., cryoprotectants; Yancey, 2005; Storey and Storey, 2012), changes in membrane composition and cell structure that permit membrane function at extreme temperature (Sinensky, 1974; Koštál, 2010), and anticipatory production of stress proteins during dormancy and/or thermal acclimation (Manjunatha et al., 2010; Colinet et al., 2013; MacMillan et al., 2016). Thus, an allelic variant may contribute to basal tolerance to extreme temperature by altering either of these two components: enhancing the plastic ability to adjust to stress by participating in or regulating the dynamic temperature response, or by better preparing the organism for that stress. However, for genes associated with variation in thermal tolerance, whether these genes primarily affect dynamic plastic processes or preparative processes is unclear.
Here, we used a combination of GWAS and RNA-seq to address the extent to which genes associated with thermal tolerance variation are involved in the dynamic stress response and preparative responses. We measured critical thermal minimum (CTmin) and CTmax (Schou et al., 2017) in 100 lines from the DGRP, and the resulting phenotypic data were used in conjunction with genome-wide polymorphism data to identify genes associated with variation in thermal limits. These candidate genes were then compared to differentially expressed genes identified via transcriptomic assays of a single genotype exposed to heat and cold shock treatments to identify their roles in the stress response. Three non-mutually exclusive hypotheses were considered. To identify candidates involved in dynamic stress responses, we tested the following two specific hypotheses: (H1) Genes associated with thermal tolerance are part of the dynamic response, and are directly up- or downregulated during thermal stress; (H2) Genes associated with thermal tolerance are transcription factors and regulatory genes that regulate the dynamic transcriptional response to thermal stress. In support of H1, we predict that GWAS candidates will be more likely to be up- or downregulated in response to thermal stress, and these candidates will include genes directly activated during the stress response (e.g., heat shock proteins) as well as genes downregulated because they are incompatible with stressful temperatures (e.g., certain metabolic processes and reproduction). To identify genes involved in preparative processes that enhance thermal stress resistance, we tested the following hypothesis: (H3) Genes associated with thermal tolerance are involved in preparatory developmental and physiological processes that influence the condition of the organism at the time of thermal stress. Here we predict that specific GWAS candidates will be involved in the stress resistance processes discussed above (e.g., cell membrane remodeling, osmolyte production, etc.), but these candidates will not necessarily be part of the dynamic stress response. Our results indicate that genes associated with the thermal response have diverse functional roles that contribute to thermal tolerance in all three of these ways. There is considerable overlap between the genes associated with quantitative variation in thermal tolerance and those that are differentially expressed in response to thermal stress, and our GWAS analysis indicated an abundance of genes involved in developmental processes and cell morphogenesis that may have a role in enhancing stress resistance. Testing these hypotheses will advance our understanding of the functional consequences of genes polymorphisms associated with thermal tolerance. Furthermore, these results also have utility for directly comparing two commonly used methods for identifying and characterizing candidate genes associated with thermal tolerance.
Materials and Methods
Insect Rearing
The Drosophila Genetic Reference Panel (DGRP) was established from a natural population in Raleigh, North Carolina, and isofemale lines were isogenized with 20 generations of full-sib mating (Mackay et al., 2012). DGRP lines were obtained from the Bloomington Drosophila Stock Center, maintained at 25°C on a 12:12 light–dark cycle, and fed a standard cornmeal/soy flour diet consisting of 0.58% agar, 1.73% yeast, 7.31% cornmeal, 1.00% soy flour, 0.13% Tegosept (w/v), 7.69% light corn syrup, and 0.48% propionic acid (v/v) in H2O. To generate flies for CTmin and CTmax assays, 15 females and 10 males were added to vials containing food and dry active yeast and were allowed to mate and lay eggs for 4 days. Restricting the number of adults in each vial and limiting the time to lay eggs prevented vials from becoming overcrowded, as extremely high larval densities can impact thermal tolerance (Sørensen and Loeschcke, 2001). Ten days after removing the parental adults, adults of the resulting progeny were removed and held for 24 h to ensure that all flies had an opportunity to mate. After 24 h, males and females were sorted and placed into separate vials in groups of 20. Flies were held in the vials for 3–4 days prior to measuring CTmin. For CTmax, flies were held for 2–3 days, and 24 h prior to the experiment, flies were lightly anesthetized with CO2 and individually transferred to small screw-top vials with food. All flies were between 4 and 9 days old at the time of the experiment.
Seven-day-old D. melanogaster Canton-S female flies were used to characterize gene expression responses after a cold or heat shock. Only females were used to minimize confounding variation due to sex differences in gene expression and to include gene expression responses associated with protection of egg production, which is strongly related to fitness and may be expected to be under selection in nature. We selected the Canton-S background for these experiments to (1) address the extent to which GWAS candidates predict gene expression in a standard, well-characterized genetic background, to increase the generalizability of our results, and (2) provide candidate genes for future functional experiments, as most mutant and transgenic strains are in the Canton-S background. To generate flies of known age for RNA-seq assays, all adults were removed from mixed-sex stock vials that had been maintained at approximately 50 flies per vial and all newly eclosed adults were sampled daily. Same-day cohorts were maintained in mixed-sex vials at a density of ∼30 flies/vial on a nutrient-rich medium, consisting of 0.88% agar, 8.33% yeast, 10% cornmeal, 0.33% Tegosept (w/v), 4.66% molasses, and 0.66% propionic acid (v/v) in dH2O (Buchanan et al., 2018), at 25°C on a 12:12 light–dark cycle. Cohorts were transferred to fresh food vials after 4 days.
Phenotypic Assays
To measure CTmin and CTmax, we used a dynamic ramping approach in which flies were gradually cooled or heated until motor function was lost. To assess CTmin, we used a vertical jacketed column (modified from Huey et al., 1992) connected to a temperature-controlled fluid bath, and the temperature was monitored inside the column with a type T thermocouple (Supplementary Figure 1A). For detailed assembly instructions for the jacketed column, see Awde et al. (2020). For each line, ∼20 males and ∼20 females were combined in the column and submitted to the following thermal program: 25°C for 5 min, 25°C to 10°C at 0.5°C min–1, 10°C for 2 min, then 10°C to −10°C at 0.25°C min–1. The ramping rates are in line with other studies of CTmin and were designed to maximize throughput and prevent cold hardening during the procedure (e.g., Sinclair et al., 2015). At 10°C we began collecting flies as they reached their CTmin and fell through the column into collection vials containing 70% ethanol. New vials were placed under the column at 0.25°C intervals as the temperature decreased. Flies were typically at the top or on the walls of the column at the beginning of a trial (since they are negatively geotropic), and any flies that remained at the bottom of the column were discarded once the temperature reached 10°C. Flies from each vial were then sexed and counted, and the CTmin was recorded as the maximum temperature for a given interval (e.g., flies collected between 10°C and 9.75°C had a CTmin of 10°C). CTmin for each line was estimated by averaging the CTmin of all flies tested across two independent cohorts. Due to variation in line productivity, escaping flies, and discarded flies, the total number of flies measured per line ranged from 15 to 44 for males (median = 28 and mode = 28) and from 9 to 38 for females (median = 26 and mode = 26).
CTmax was assessed using the same apparatus as CTmin, except the jacketed column was arranged horizontally and flies were contained individually in 2 ml screw-top vials to prevent them from voluntarily walking out of the column as temperature increased (Supplementary Figure 1B). For each line, ∼18 males and ∼18 females were individually placed in vials attached to a wooden dowel (Supplementary Figure 1B). The wooden dowel with the vials was placed inside the column and submitted to the following ramping program: 25°C for 5 min, 25°C to 35°C at 0.5°C min–1, then 35°C to 45°C at 0.25°C min–1. Flies were checked for movement after the temperature reached 35°C by flicking the wooden dowel every 0.2°C. The CTmax of flies was recorded when flies were motionless and no longer responded to stimulus. As with CTmin, CTmax for each line was estimated by averaging the CTmax of all flies tested across two independent cohorts. Due to variation in line productivity and escaping flies, the total number of flies per line ranged from 23 to 53 for males (median = 33 and mode = 33) and from 24 to 51 for females (median = 33 and mode = 32).
We also tested the extent to which CTmin and CTmax were correlated with other life-history parameters and other measures of thermal tolerance using previously collected phenotype data for the DGRP. We obtained data for lifespan and fecundity from Durham et al. (2014), Wolbachia infection status and chill coma recovery time from Mackay et al. (2012), rapid cold hardening and chronic and acute survival from cold from Gerken et al. (2015), CTmin from Ørsted et al. (2018), cumulative cold tolerance from Teets and Hahn (2018), heat knockdown from Rohde et al. (2016), CTmax from Rolandi et al. (2018), and cold and heat hardness from Freda et al. (2019). We used Pearson correlations (cor.test) to test for linear correlation between these measures in R (version 3.6.1; R Core Team, 2019).
Heritability and Genome Wide Association Study (GWAS)
Broad sense heritability (H2), defined as the proportion of the total phenotypic variation that is due to all genetic factors, was estimated as H2 = σ2L/(σ2L + σ2ε), where σ2L is among-line and σ2ε is within-line variance components (Mackay and Huang, 2018). Variance components were estimated using a linear mixed model and treating line as a random effect, with the lme4 package (Bates et al., 2015) in R.
Genome wide associative mapping was used to identify genetic polymorphisms associated with CTmin and CTmax using the GWAS platform available on the DGRP website1 (Mackay et al., 2012). This analysis associates the phenotypic variation of DGRP lines with single nucleotide polymorphisms (SNPs), insertions, deletions, and multiple nucleotide polymorphisms (MNPs). One of the lines tested (208) was removed from the GWAS analysis by the DGRP server, thus the GWAS analysis included 99 lines. Variants with p-value < 1E-4 (using the average mixed p-value of the two sexes) were considered significant and were annotated to genes using FlyBase annotation v5.57. The average mixed p-value of the two sexes for GWAS analysis was chosen because both CTmin and CTmax were significantly correlated across sexes (see the section “Results”). To identify transcriptional regulators of thermal stress in support of H2 (see the section “Introduction”), we compared GWAS candidates to annotated transcription factors in FlyBase annotation v5.57.
As an alternative to GWAS on individual variants, we also conducted gene-based GWAS to test the aggregated effect of a set of SNPs (e.g., SNPs within a gene) on CTmin and CTmax phenotypes. Gene-based p-values were calculated by contrasting the observed T value to an empirical distribution generated from resampling under the null hypothesis with permutations using PLINK (version 1.9; Purcell et al., 2007; Liu et al., 2010). We controlled for confounding genetic relatedness between the DGRP lines used in this study, and used the Tracy-Windom test in the AssocTests package (Wang et al., 2015) to evaluate eigenvalues from 20 principal components (PCs) of genotype. We retained the first eight PCs as covariates in the PLINK model as described above (Patterson et al., 2006). As inversions and Wolbachia infection status can also influence the phenotypes of the DGRP lines, we used the adjusted phenotypes for these factors outputted from the DGRP2 website. Variants with MAF ≥ 5% and a genotype rate of 20% were used as well as the FlyBase v5.57 gene annotations. A total of 1,939,313 variants were tested over 8,954 and 8,270 genes with at least one significant variant for CTmin and CTmax, respectively. Genome-wide significance was determined by controlling for FDR using the q value method (Storey and Tibshirani, 2003).
RNA-Sequencing and Differential Gene Expression
To characterize gene expression responses to thermal shock, three replicates of three females each were exposed to cold or heat shock conditions by placing flies in sealed 15 × 150 mm glass test tubes and submerging in a circulating water bath programmed to cool or heat at a rate of 0.25°C min–1 until the temperature reached 4°C or 37°C, respectively. Flies were held at the final temperature for 5 min and then collected into pre-filled bead homogenization tubes (Benchmark Scientific) under CO2 anesthesia, immediately snap-frozen in liquid nitrogen and held at −80°C. Control flies were similarly handled but remained at 25°C until collection and flash-freezing. Whole flies were homogenized using a Bullet Blender Bead Homogenizer (Next Advance) in 300 μL TRIzol Reagent (Life Technologies) followed by purification with a Direct-zol RNA MicroPrep Kit (Zymo Research #R2060) according to the manufacturer’s instructions. DNA was removed using DNAse I on the column followed by two washes with RNA Wash Buffer. Total RNA was eluted with 15 μL DNAse/RNAse-free water, quantified using a Qubit 2.0 Fluorometer (Thermo Fisher), and RNA quality was assessed using an Agilent 2100 Bioanalyzer (Agilent Technologies). RNA-seq libraries were generated from 1 ug of rRNA-depleted total RNA using the NuQuant Universal RNA-Seq Library Preparation Kit (Nugen #M01506) according to the manufacturer’s protocol with 12 cycles of PCR. A total of nine libraries were pooled and sequenced on a single lane of an Illumina HiSeq1500 single-read flow cell. The sequence quality of the resulting raw Illumina reads was assessed using FastQC (version 0.11.4) and reads were aligned to the D. melanogaster reference genome (Release 6) using STAR aligner (Dobin et al., 2013). Genes were quantified using featureCounts (part of the Rsubread package, version 2.0.0, Liao et al., 2019) against the DM6 build. Differential expression was performed using the DESeq2 package (version 1.24.0; Love et al., 2014) in R. All data have been deposited into the NCBI SRA database with accession Bioproject PRJNA612361.
Pathway Enrichment Analysis
Overrepresentation analysis (ORA) of significantly differentially expressed genes (Benjamini–Hochberg corrected p-value < 0.01, fold-change > 2) and the GWAS genes (p-value < 1E-4) was performed using WebGestalt (Wang et al., 2017; minimum five genes per category, maximum 2,000 genes) and a false discovery rate cut-off of 0.05. The results of the overrepresentation analysis were the primary means by which we identified GWAS candidates in support of H3 (see the section “Introduction”).
Integration of Differential Gene Expression With GWAS
Genes associated with SNPs identified using GWAS were matched with corresponding genes in the expression data set. For cases where multiple genes were associated with a single SNP, each gene was included. The distribution of log-fold changes of the expression of all genes in the heat shock and cold shock versus control was compared to the fold-change distribution of the genes significantly associated with the corresponding thermal performance limit with Kolmogorov–Smirnov tests implemented in R. These analyses were the primary means by which we identified inducible genes in support of H1 (see the section “Introduction”).
Results
Genetic Variation in Thermal Tolerance
In this study we measured thermal limits (CTmin and CTmax) in a subset of lines from the DGRP. CTmin values across the DRGP lines varied considerably more than CTmax (Figures 1A,B). CTmin ranged from 0.81 to 8.55°C for males and from 2.29 to 8.64°C for females, while CTmax ranged from 38.63 to 40.72°C for males and from 38.51 to 40.80°C for females (Supplementary Table 1). The sex of the flies did not affect CTmin (p = 0.39), but it did affect CTmax (p < 0.001), with the males being slightly more heat tolerant than the females. However, the effect size was small (effect size: 0.13°C). The interaction of sex and line was also significant for both CTmin and CTmax (p < 0.01 and p < 0.001, respectively). Within each phenotype, values were significantly correlated across sexes (CTmin, r = 0.85, p-value < 0.001; CTmax, r = 0.52, p-value < 0.001; Supplementary Figures 2A,B). The sex-averaged CTmin and CTmax values were not significantly correlated across lines (r = 0.06, p-value = 0.54; Figure 1C).
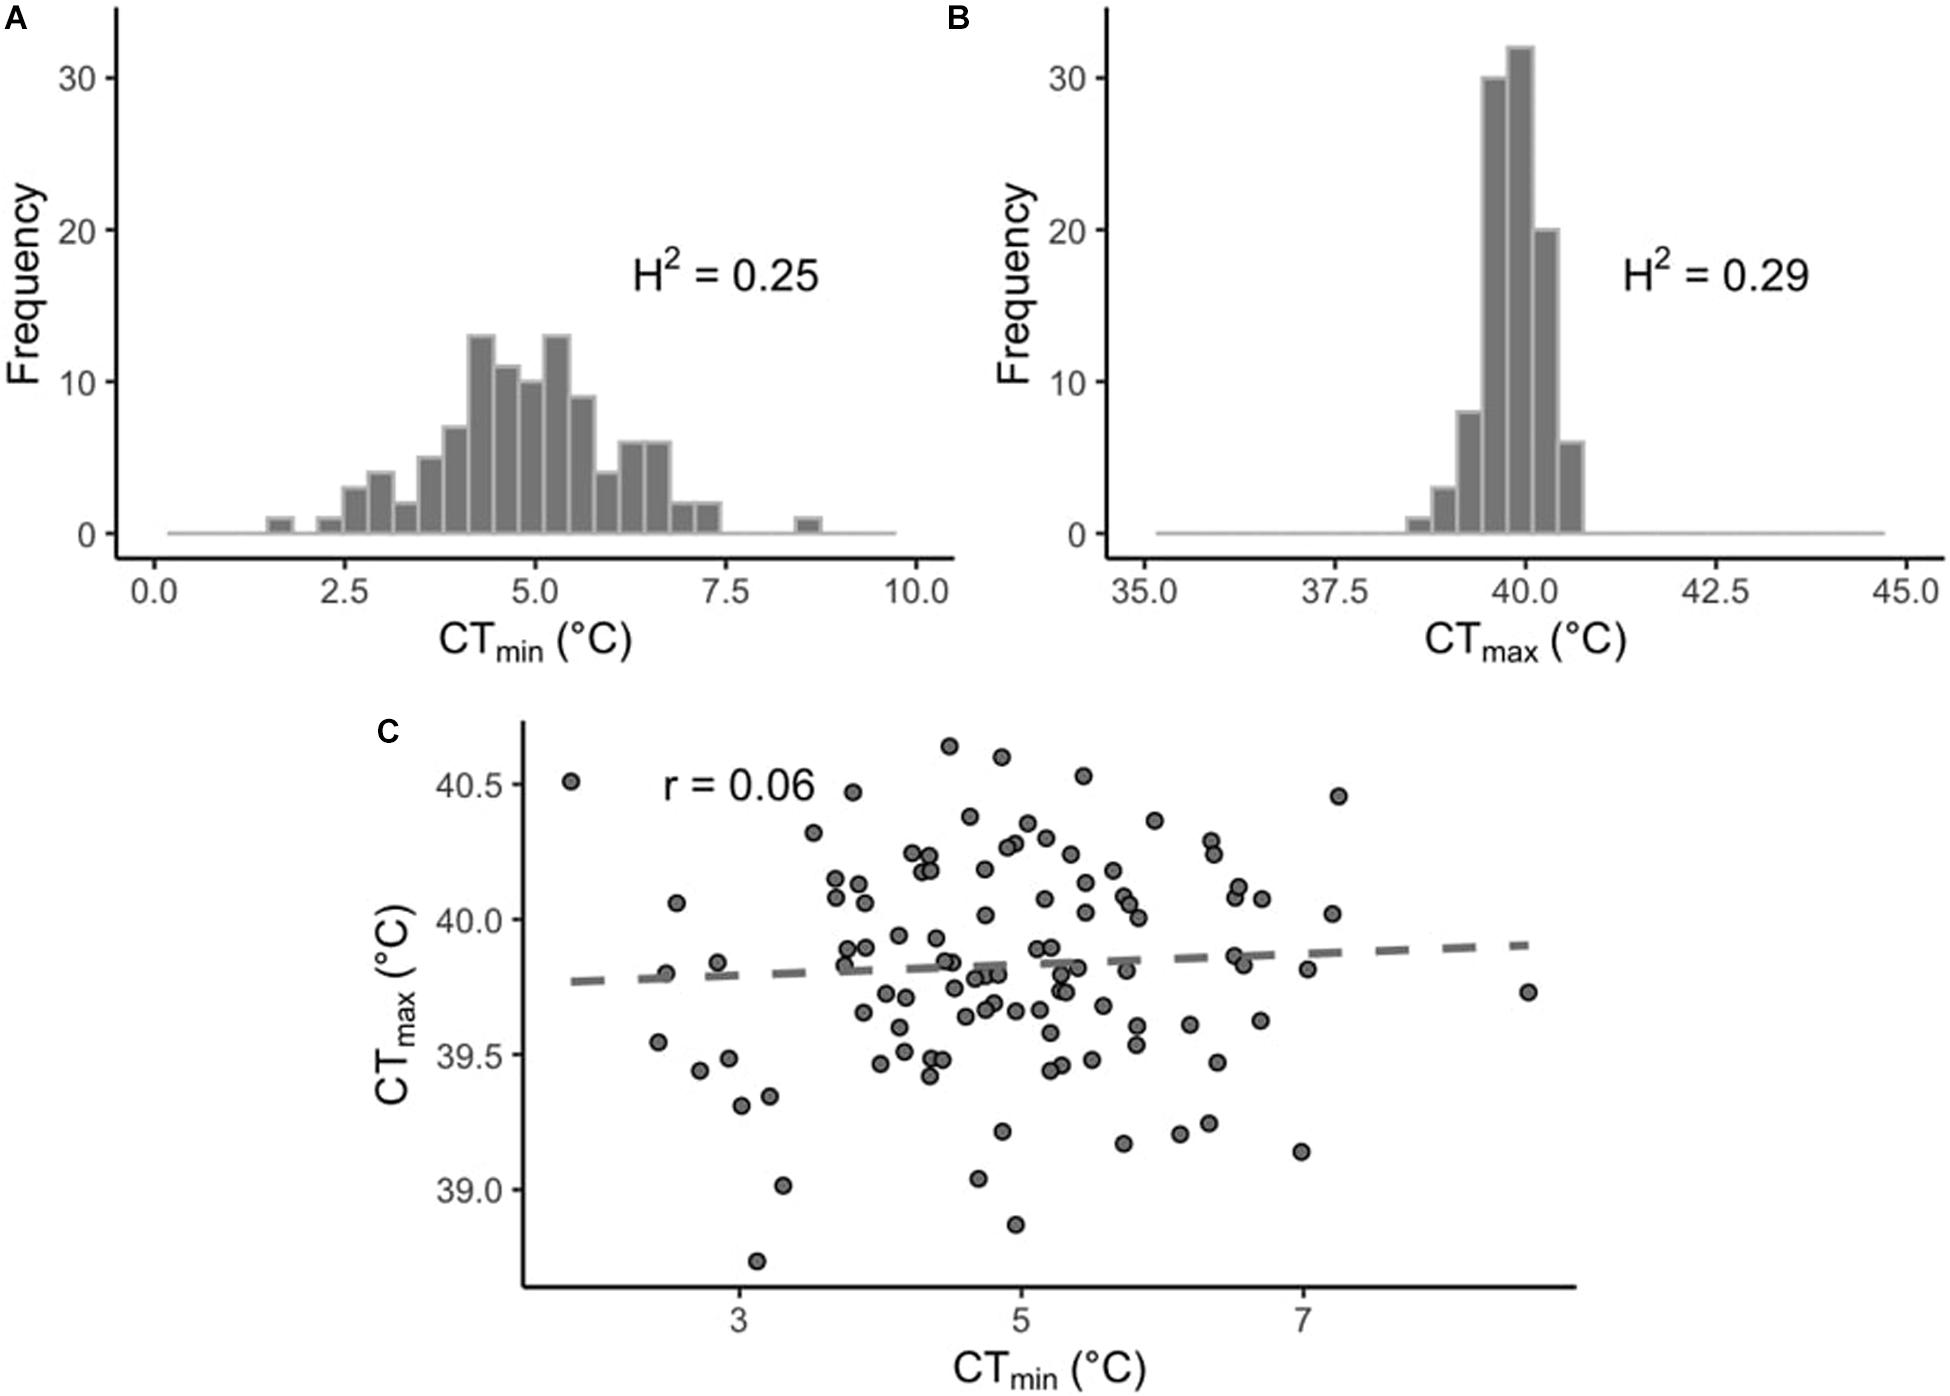
Figure 1. Distribution of thermal limits in the DGRP. Histograms of mean phenotypes across 100 DGRP lines for (A) CTmin and (B) CTmax. (C) Correlation between line-means of CTmin and CTmax.
We tested for trade-offs associated with thermal tolerance by comparing CTmin and CTmax with previously collected lifespan and fecundity data (Durham et al., 2014); however, we found no evidence of trade-offs among these traits, as neither thermal tolerance measurement was correlated with longevity or fecundity (Supplementary Table 2). DGRP lines have variable infection status by Wolbachia pipientis, a ubiquitous endosymbiont in insects that can significantly modulate physiology (Werren, 1997). Within the lines studied, we found no evidence that Wolbachia infection impacts CTmin or CTmax (p = 0.07 and p = 0.19, respectively). We also performed correlations between our data and other measures of thermal tolerance, and we found no correlation among our results and chill coma recovery time (Mackay et al., 2012), measures of thermal plasticity (i.e., rapid cold hardening and survival from cold; Gerken et al., 2015), cumulative cold tolerance (Teets and Hahn, 2018), and heat knockdown time (Rohde et al., 2016; Supplementary Table 2). Ørsted et al. (2018) measured CTmin in males reared at 26°C (using a ramping method of 0.1°C min–1), and we found significant correlations among their CTmin values with our CTmin values for males and females (r = 0.60, p-value < 0.01 and r = 0.61, p-value < 0.01, respectively; Supplementary Table 2). As in our study, Rolandi et al. (2018) also measured CTmax using a ramping method (0.25°C min–1). We found significant correlations between their CTmax values for males with our CTmax values for males and females (r = 0.59, p-value < 0.01 and r = 0.55, p-value < 0.01, respectively; Supplementary Table 2).
Genetic Architecture of Thermal Limits
The estimated broad sense heritability (H2) for CTmax was 0.29 and for CTmin was 0.25.
Using available genomic data for the DGRP, we identified genetic polymorphisms associated with CTmin and CTmax. For the 99 lines measured, more than 1.9 million variants were analyzed (mostly SNPs), and we found ∼550 unique allelic variants associated with these traits (p-value threshold of 1E-4; Supplementary Table 3). We identified 348 allelic variants (319 SNPs, 15 deletions, 13 insertions, and 1 MNP) significantly associated with CTmin, and 193 allelic variants (173 SNPs, 9 deletions, 8 insertions, and 3 MNPs) with CTmax (Table 1). Polymorphisms associated with CTmin and CTmax were identified on all chromosomes (Figures 2A,B). CTmin and CTmax did not share any allelic variants (Figure 2C). Among these allelic variants, 262 mapped to 151 unique genes for CTmin, and 169 mapped to 99 unique genes for CTmax. Three genes (iab8, Btk29A and Sp1) were common between both traits (Figure 2D). From all the genes associated with the allelic variants, 8% of the CTmin and 9% of the CTmax genes encode transcription factors (Table 1), including one of the genes common to both traits (Sp1). Most of the allelic variants significantly associated with both traits were located in introns (55% for CTmin and 71% for CTmax; Supplementary Table 4). The distribution of the direction of effect sizes differed between SNPs that underlined CTmin vs. SNPs that underlined CTmax (Figure 3A; Kolmogorov–Smirnov test, D = 0.87, p-value < 1E-9), such that the CTmin-associated alleles that were most common in the DGRP population caused individuals to have higher CTmin (i.e., worse cold tolerance; Figure 3B), whereas the CTmax-associated alleles that were most common in the population overwhelmingly caused individuals to have higher CTmax (i.e., better heat tolerance; Figure 3B). Additionally, there was a negative exponential relationship between effect size and minor allele frequency for both CTmin- and CTmax-associated SNPs (Figure 3B).
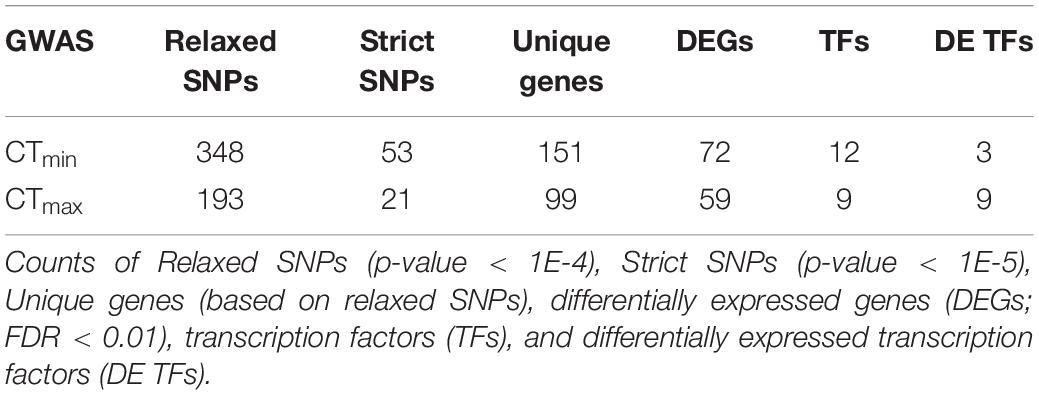
Table 1. Overlap between the CTmin and CTmax SNPs and expression data.
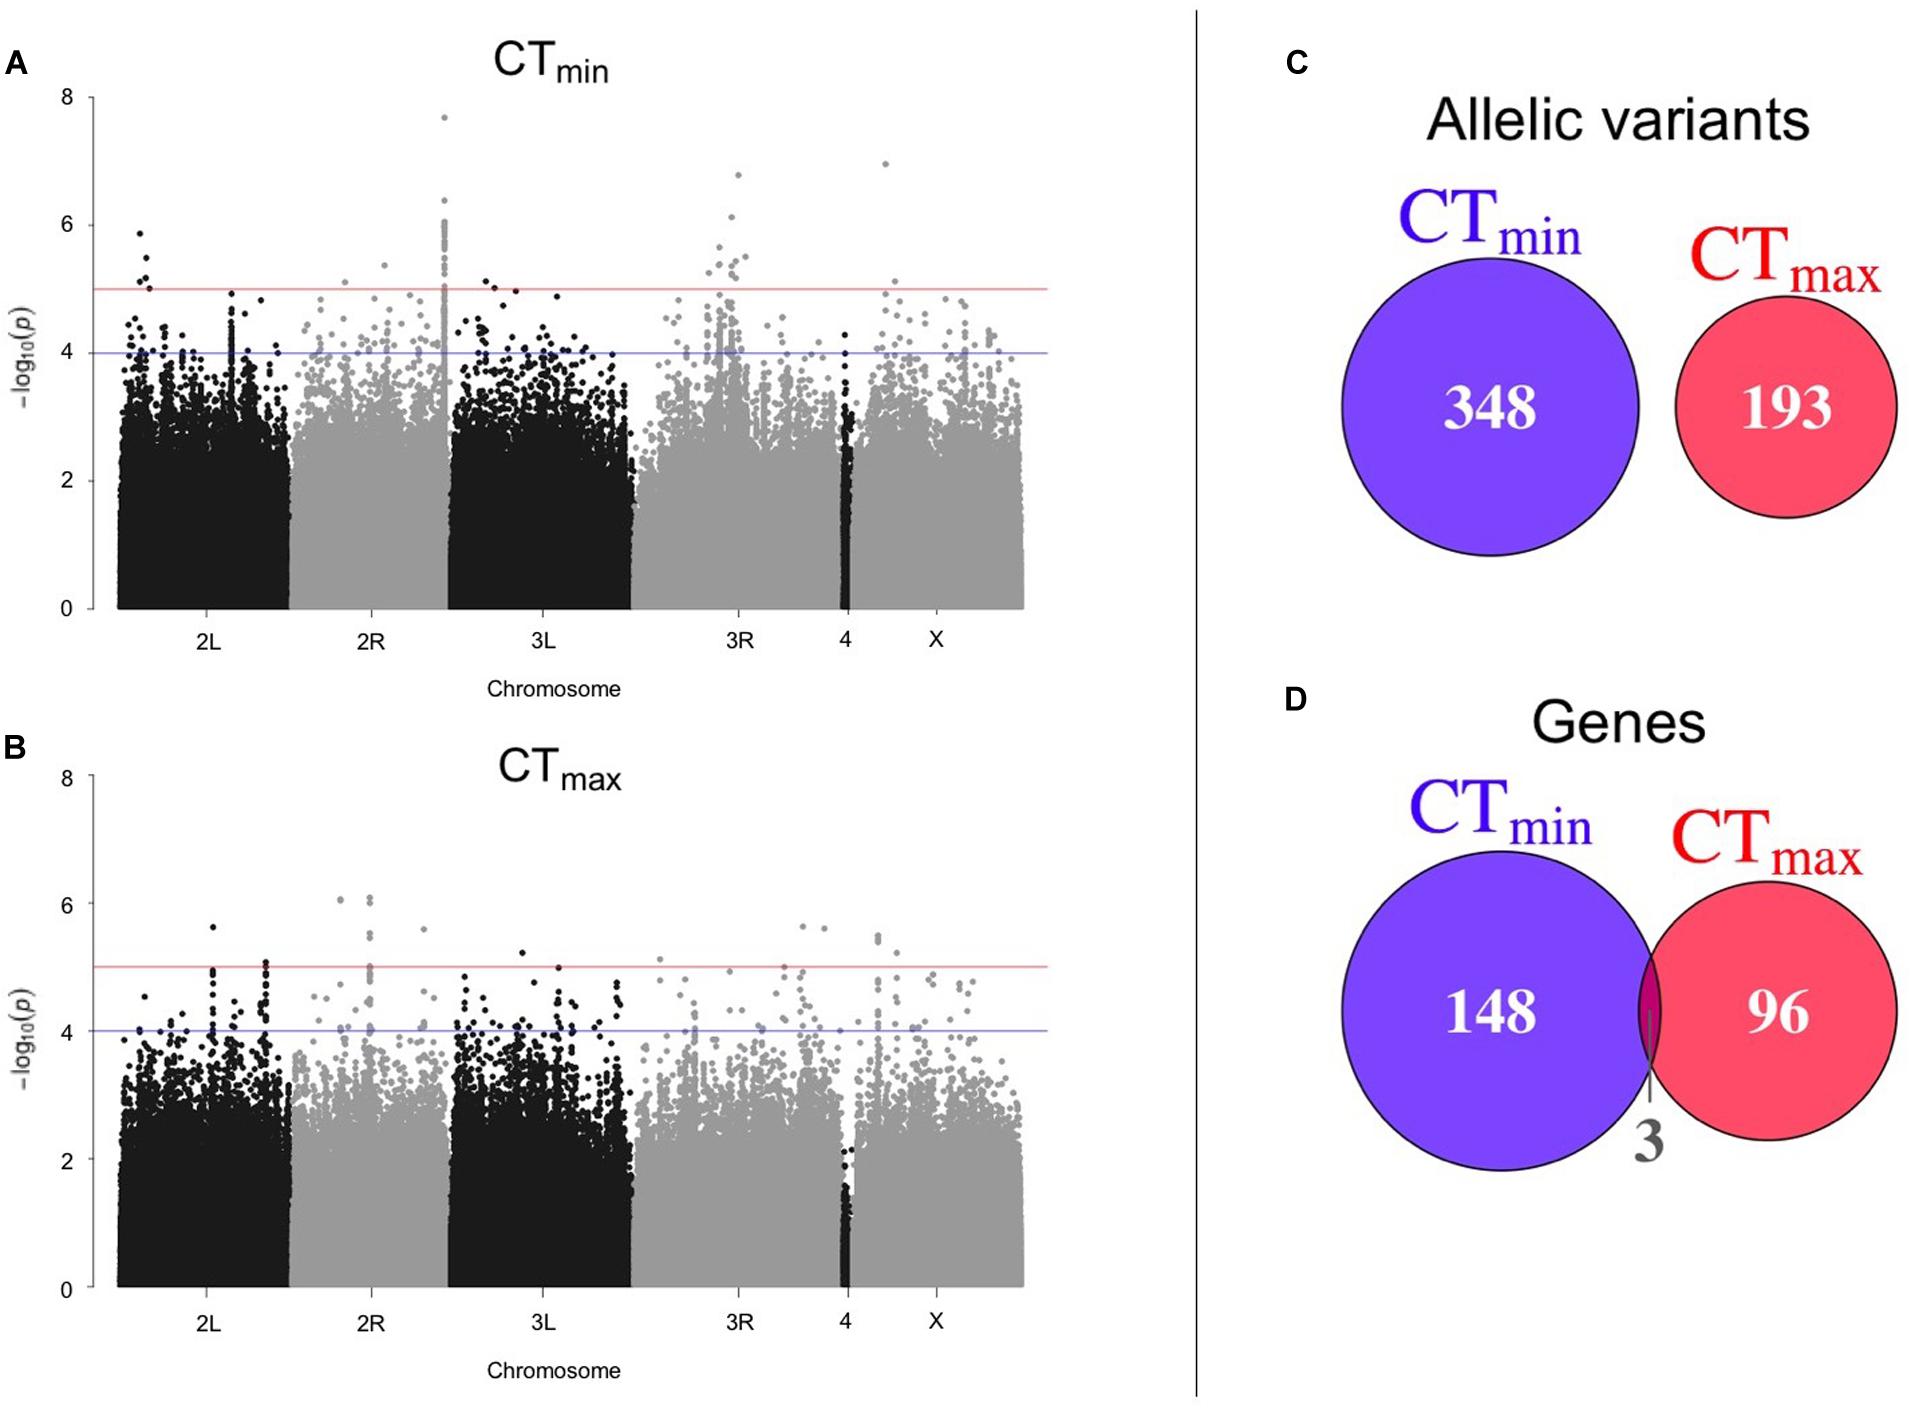
Figure 2. Results of GWAS to identify polymorphisms associated with thermal tolerance. Manhattan plots of the results from the GWAS for (A) CTmin and (B) CTmax. The blue line corresponds to p-value < 1E-4 and the red line corresponds to p-value < 1E-5. The overlap of (C) allelic variants and (D) unique genes between CTmin and CTmax is also shown.
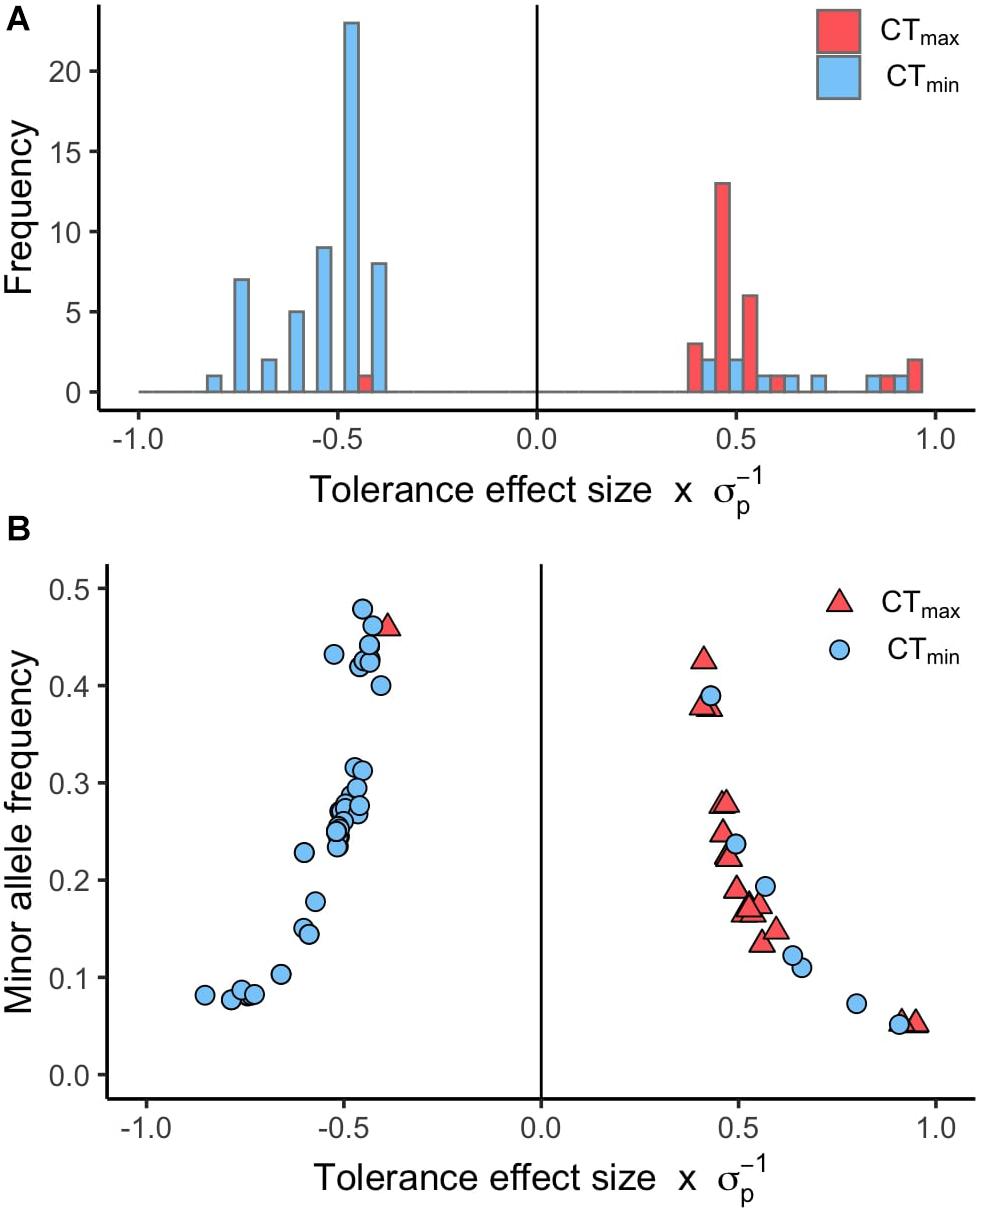
Figure 3. Distribution of effect sizes for SNPs associated with CTmin and CTmax. (A) Histogram of the tolerance effect size scaled by the phenotypic standard deviation (σp) for the same allelic variants. (B) Scatter plot of the minor allele frequency versus the tolerance effect size scaled by the phenotypic standard deviation (σp) for the allelic variants associated with CTmin and CTmax (p-value < 1E-5).
There is some evidence that low abundance alleles can be underpowered in the DGRP (Ivanov et al., 2015), so as an alternative to the variant-based GWAS performed above, we also conducted gene-based GWAS. However, in the gene-based GWAS analysis, almost no genes were detected as significant using the p-value threshold of 1E-4 (three for CTmin and one for CTmax; Supplementary Table 5). Thus, for the remainder of the paper, we will focus on the results of the variant-based GWAS described above.
Differential Gene Expression Following Acute Thermal Exposures
RNA-seq and differential expression analysis were used to determine the gene expression responses of the Canton-S strain of D. melanogaster under ramped cold shock and heat shock conditions. In total, 15,844 genes were expressed across all treatment groups. Principal component analysis (PCA) of expressed genes showed clustering of replicates for each condition (Supplementary Figure 3). Pairwise comparison of cold shock and heat shock to controls revealed a large number of significantly differentially expressed genes (p-adj. < 0.05, fold-change > 2; Figure 4). Among the differentially expressed genes, more were downregulated (5,126 in cold shock and 6,241 in heat shock) and fewer were upregulated relative to controls (1,826 in cold shock and 2,314 in heat shock). The direction of regulation for most differentially expressed genes was consistent across treatments, with 6,081 genes changing similarly in both magnitude and direction in response to cold and heat shock conditions (Figure 4).
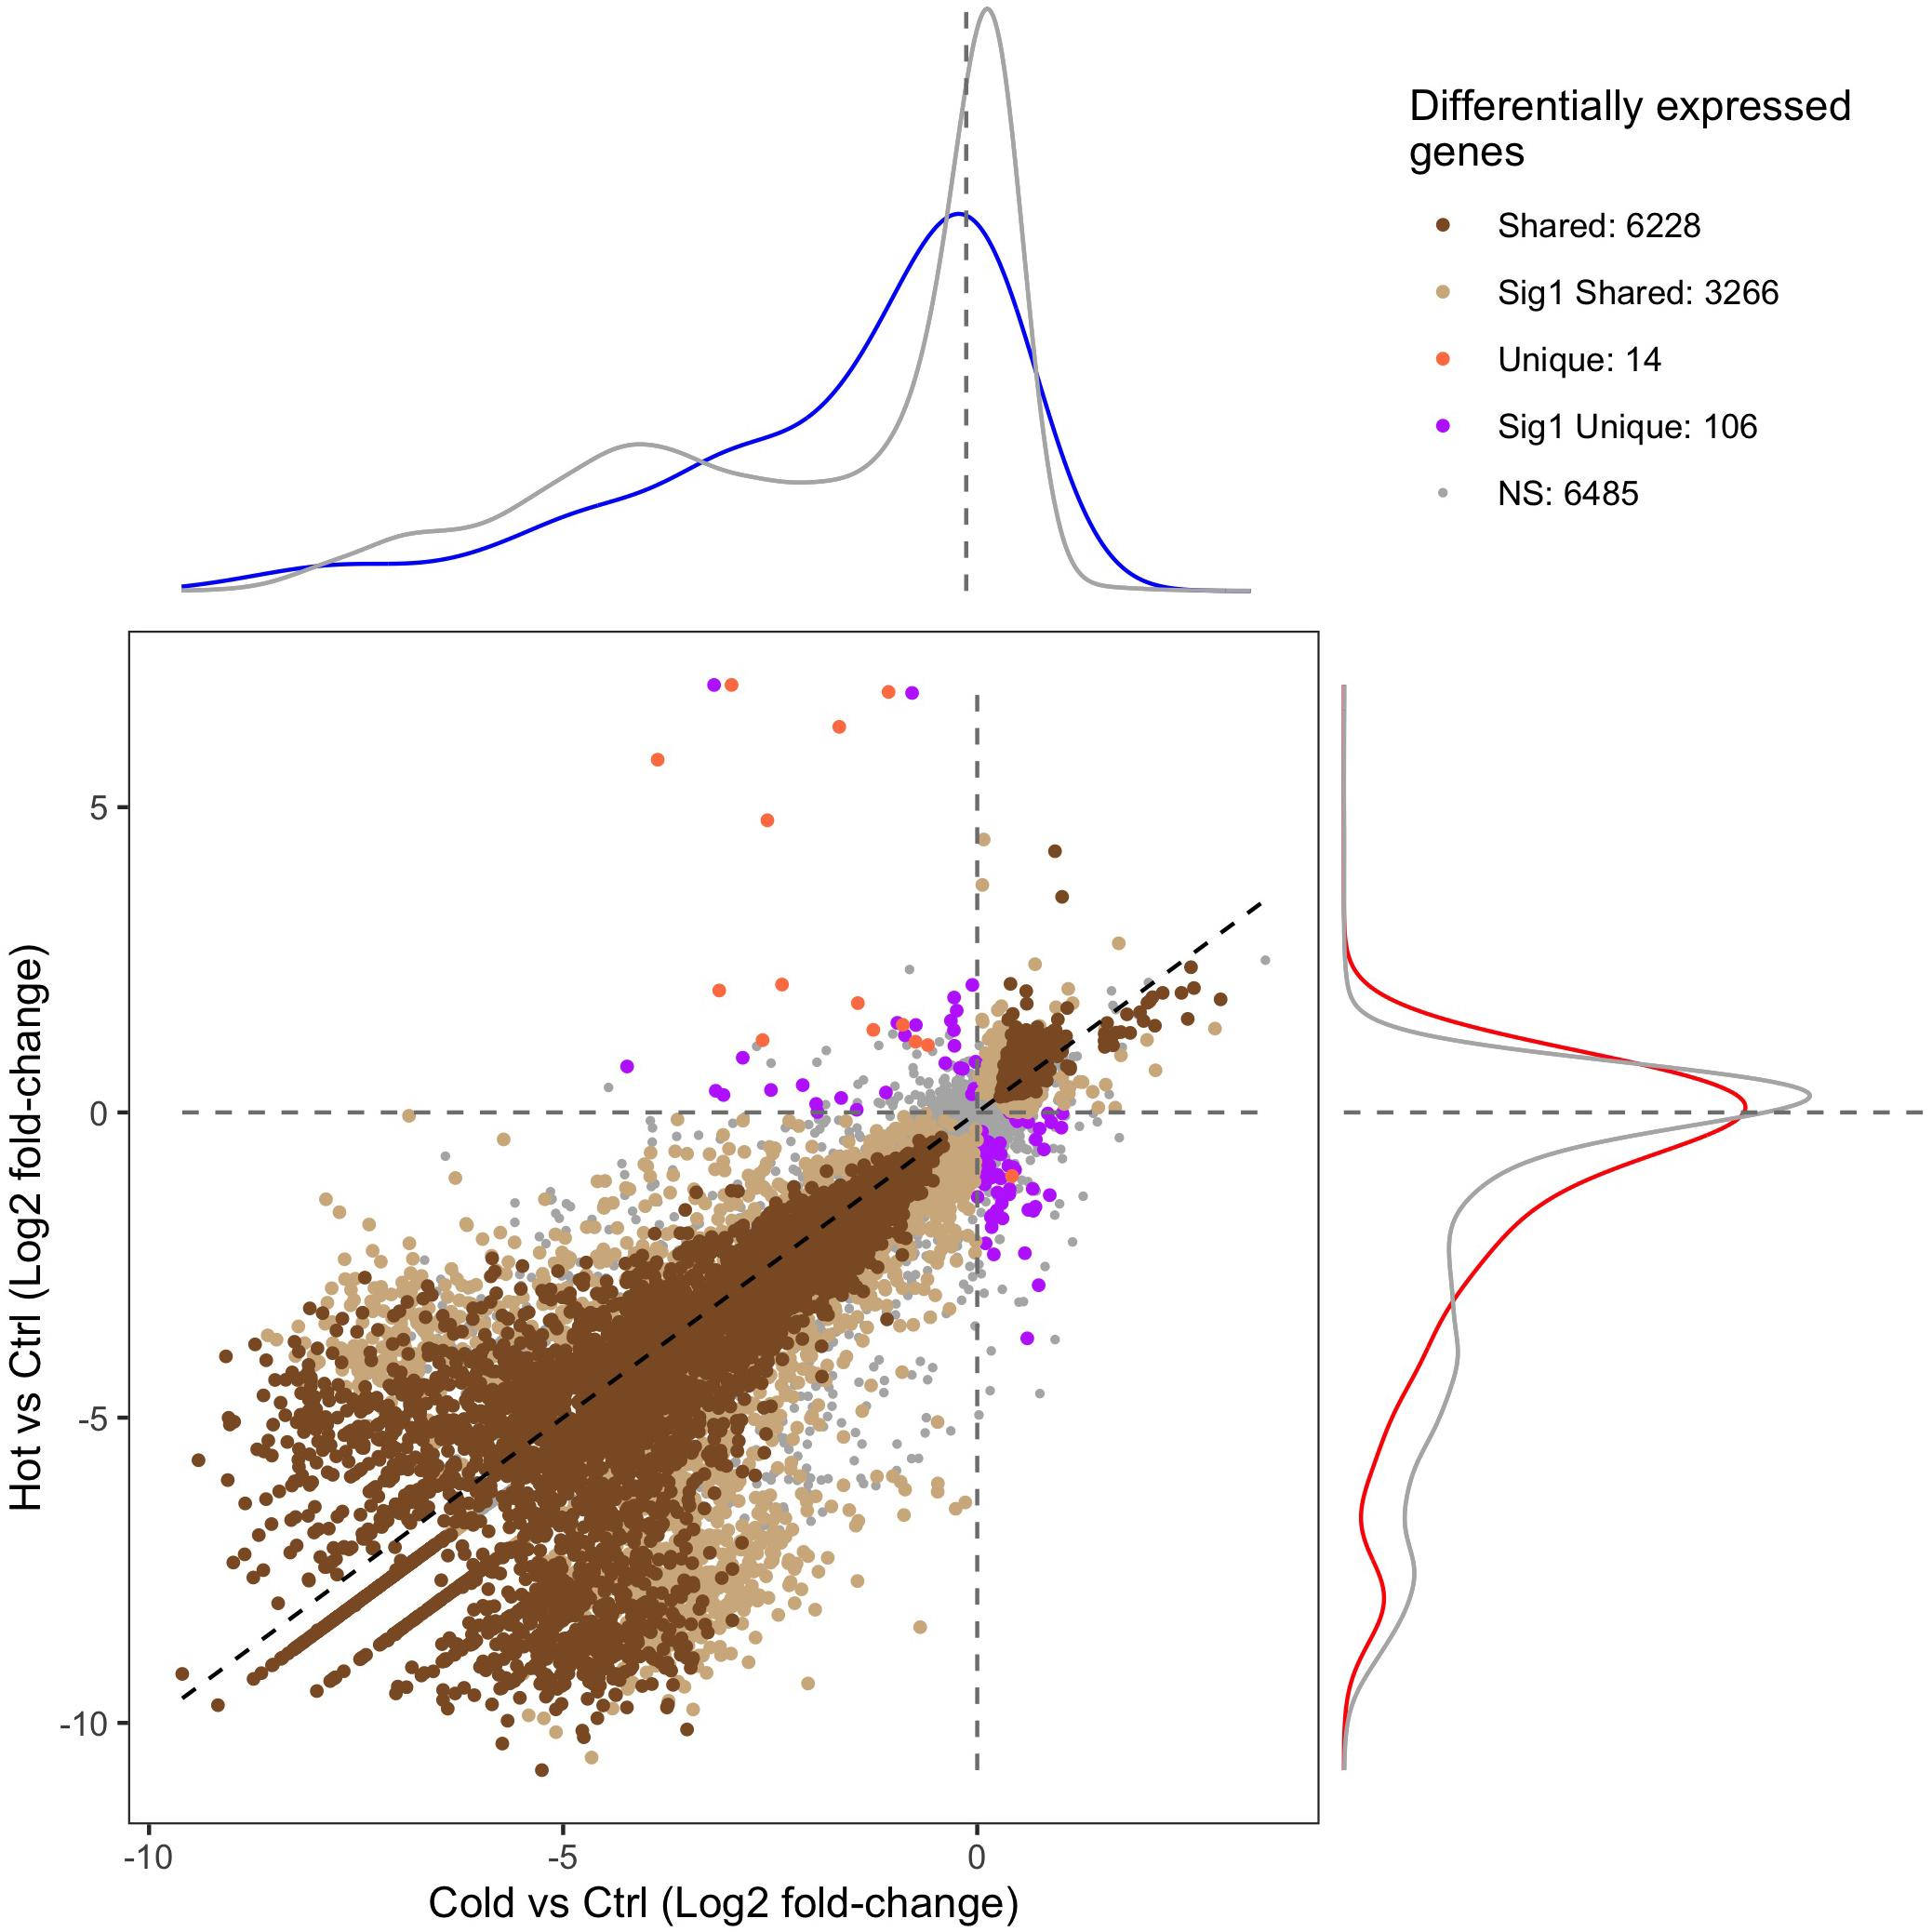
Figure 4. Scatter plot of the gene expression log2 fold-change of heat-shock (37°C) and cold-shock (4°C) relative to the 25°C control. “Shared” DEGs indicate a significant expression relative fold-change in the same direction in both heat and cold shock. “Sig1 Shared” genes indicate that the relative fold-change is the same under heat shock and cold shock, but only significantly differentially expressed in one condition. “Unique” DEGs indicate that the genes were differentially expressed in each condition but in opposite directions. “Sig1 Unique” genes indicate that the genes are expressed in opposite directions relative to the control, but only significantly so in one condition. “NS” indicates genes that are not differentially expressed in both heat shock and cold shock. The density plots surrounding the figure indicate the density of the expression of genes that are associated with CTmin (top; blue) or CTmax (right; red) relative to the log2 fold-change expression of all other genes (gray).
Integration of Transcriptomics and GWAS
Of the 151 unique genes found for CTmin, 72 (47.7%) were differentially expressed under cold shock. Of the 99 unique genes associated with CTmax, 59 (59.6%) were differentially expressed under heat shock. The distribution of log-fold change expression of heat shock versus control for the GWAS candidates associated with CTmax significantly differed from the distribution of all other genes under heat shock (Figure 4; p-value < 0.01). For the genes associated with CTmin, there was a similar trend, but the log-fold change distribution of those genes only marginally differed from the background expression of all other genes (Figure 4; p-value = 0.062).
Overrepresentation Analysis
Among the GWAS candidates, we identified six overrepresented GO biological process categories for CTmin and 17 categories for CTmax that met the FDR cut-off of 0.05 (Figure 5). For both traits we found many enriched GO terms related to development, differentiation, and morphogenesis. Among the differentially expressed genes from the RNA-seq experiments, we identified 99 enriched GO biological process categories for cold shock and 113 enriched categories for heat shock (Supplementary Table 6). Many of these categories were also related to development and differentiation. There was overlap between the enriched categories for GWAS and gene expression data. Five of the six categories enriched among genes associated with CTmin were also significantly enriched among genes differentially expressed under cold shock, and 13 of the 17 categories identified for CTmax were also enriched under heat shock (Figure 5).
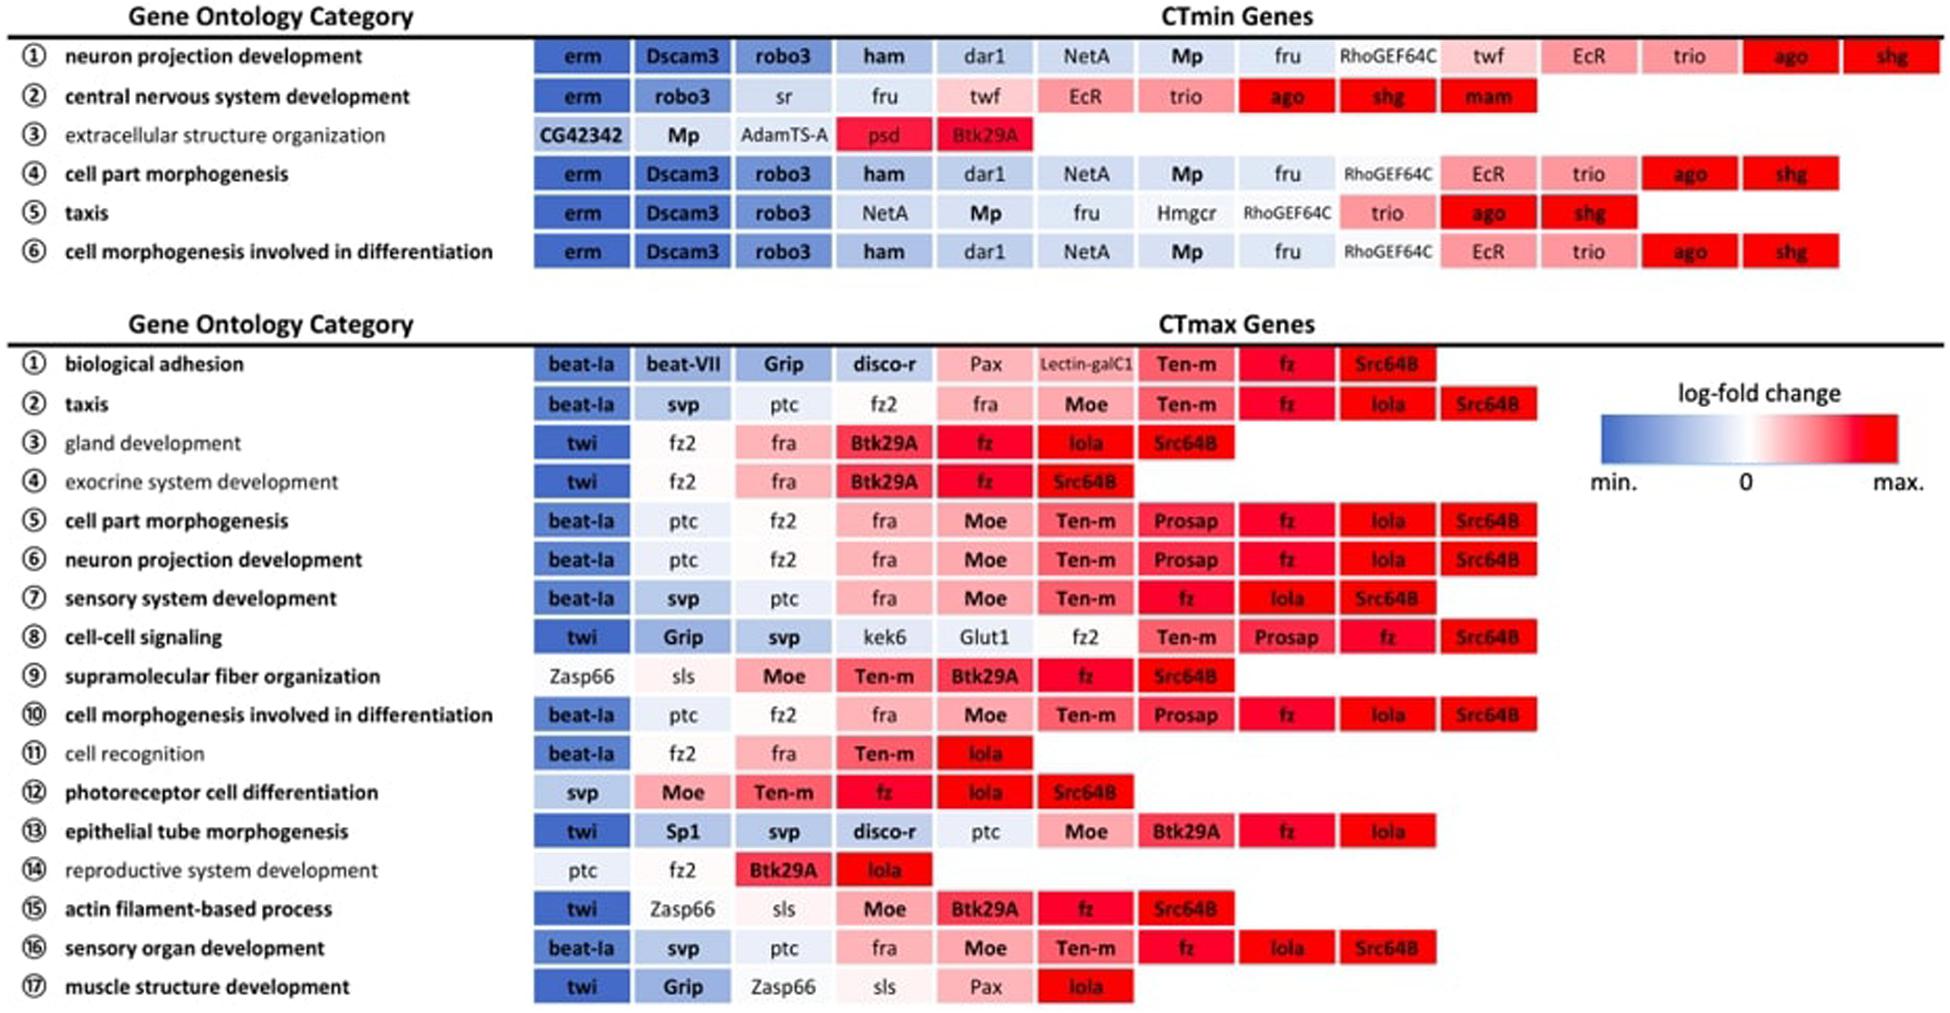
Figure 5. Expression patterns of GWAS genes within significantly overrepresented GO biological process categories. All expression patterns are expressed relative to the 25°C control. Bolded categories indicate those also over-represented in the full DEG dataset for the corresponding temperature extreme. Bolded genes indicate significant differential gene expression at an FDR < 0.01.
Discussion
Here, we characterized the genetic architecture of thermal tolerance and identified candidate genes that contribute to both dynamic responses to thermal stress and preparative processes that enhance stress resistance. Our study suggests that GWAS candidates are involved in both dynamic stress responses and preparative processes that influence the condition of the insect at the time of thermal stress. Together, our results indicate diverse functions for genes involved in thermal tolerance and allow us to generate new hypotheses for the genetic basis of thermal tolerance. Below, we discuss the genetic architecture of thermal tolerance in general, followed by a discussion of our three specific hypotheses to test the relative contribution of dynamic and preparative processes in shaping thermal tolerance.
Genetic Architecture of Thermal Tolerance
While several studies have separately assessed the genetic basis of cold and heat tolerance, here we measured both CTmin and CTmax across 100 lines of the DGRP. We found variation in both measures, although CTmin varied considerably more than CTmax (Figure 1). This pattern of variation in upper and lower thermal limits is also seen across species and populations with distinct geographic ranges, for both latitudinal and altitudinal gradients (e.g., Gaston and Chown, 1999; Addo-Bediako et al., 2000; Chown, 2001; Hoffmann et al., 2002; Nyamukondiwa et al., 2011; Sunday et al., 2011, 2019; Kellermann et al., 2012a, b). These patterns of variation in thermal limits, both within and across species, likely reflect stronger latitudinal and interannual variation in winter conditions relative to summer conditions (Williams et al., 2015). In addition, our results are consistent with previous studies indicating that upper and lower limits have distinct underlying mechanisms (e.g., Chown, 2001; Nyamukondiwa et al., 2011), as we found no phenotypic correlation between CTmin and CTmax across lines.
The variation in both CTmin and CTmax had a strong genetic component. Broad sense heritability was high for both CTmax (H2 = 0.29) and CTmin (H2 = 0.25), which is consistent with previous heritability estimates for thermal responses in the DGRP. Our heritability estimate for CTmax was higher than a previous estimate for a smaller subset of the DGRP population (H2 = 0.14, Rolandi et al., 2018). For CTmin, heritability was within the range observed by Gerken et al. (2015) for acute and chronic cold exposure (H2 = 0.15 and 0.44, respectively). The strong heritability for both traits suggests high evolutionary capacity for thermal tolerance in the mid-latitude population from which the DGRP was derived.
While variation in CTmin and CTmax was explained by distinct allelic variants, some variants mapped to the same genes, suggesting that some genes can affect both heat and cold tolerance. Of the 247 total unique genes, three genes were common to both traits: iab-8 (a non-coding regulatory RNA), Btk29A (a tyrosine kinase involved in cellularization and morphogenesis), and Sp1 (a zinc finger transcription factor involved in ventral thoracic appendage specification, leg growth and in the development of type-II neuroblasts). At the gene level, there were also some candidate genes in common between our study and previous work. The gene CG42673 was associated with CTmax in this study and also with chill coma recovery time in Mackay et al. (2012). CG42673 is a putative nitric-oxide synthase binding protein, and while nitric oxide has not been linked to thermal tolerance in insects, nitric oxide is an important mediator of both heat and cold tolerance in plants (Parankusam et al., 2017; Costa-Broseta et al., 2018). In both our study and in Ørsted et al. (2018), Mur89F was associated with CTmin, and this gene is involved in chitin metabolic process and extracellular matrix.
Several patterns in our data suggest that thermal tolerance, especially heat tolerance, is an important component of organismal fitness in nature. Alleles that enhance heat tolerance (i.e., raise CTmax) were more common in the DGRP population than alleles that impair heat tolerance (Figure 3A). However, the pattern is opposite for cold tolerance; most alleles that improve cold tolerance (i.e., lower CTmin) were relatively infrequent in the population (Figure 3A). These results were counter to our expectations, since there is generally stronger latitudinal variation in cold tolerance than heat tolerance (see above). However, intraspecific latitudinal clines for heat tolerance have been observed in D. melanogaster (Hoffmann et al., 2002; Sgrò et al., 2010), indicating that there is selection for heat tolerance in this species. In the case of the DGRP, which originates in mid-latitude North Carolina, selection for cold tolerance may be lower than for heat tolerance, which could explain the relative rarity of alleles that improve cold tolerance. Alternatively, alleles that improve cold tolerance may have negative effects on other fitness-related traits, which would prevent these alleles from increasing in frequency in the population. Further, some polymorphisms in D. melanogaster oscillate in allele frequency across seasons (Bergland et al., 2014), so depending on when the DGRP was collected (presumably summer, although exact details are not provided in Mackay et al., 2012), cold tolerance alleles might be less common in the panel. Previously, a similar pattern was shown for oxidative stress resistance in the DGRP – i.e., most alleles that improve oxidative stress response are present at low frequency in the population (Weber et al., 2012). Finally, our study did not address plasticity in thermal tolerance, which may be an important means of response to cold challenges. Thus, the rarity of alleles improving basal cold tolerance may not be relevant in this population if the population possesses alleles for thermal plasticity. However, regardless of the reason for these results, these allele frequency patterns between heat and cold tolerance are not random and suggest that different forces may be affecting patterns of standing genetic variation for the two traits despite their similar overall heritabilities.
We also observed a negative exponential relationship between effect sizes and minor allele frequencies for SNPs that underlie both CTmin and CTmax (Figure 3B). Overwhelmingly, the SNPs that have the greatest effect sizes in both directions are present at the lowest frequencies in the population. Many other studies have reported this same pattern for genetic polymorphisms that underlie a wide range of different traits in the DGRP, including oxidative stress resistance, startle response, starvation resistance, chill coma recovery time, and position effect variegation (Mackay et al., 2012; Weber et al., 2012; Kelsey and Clark, 2017). Overall, this pattern suggests that large-effect alleles that underlie CTmin or CTmax have undergone selection, either to increase the frequency of large-effect alleles in the population by positive selection (Barton and Keightley, 2002), thus driving the alternative allele to low frequency, or to remove large-effect alleles from the population by purifying selection (Keightley and Lynch, 2003).
Some of the genes underlying variation in CTmin and CTmax in the DGRP are also likely important for temperature adaptation in natural populations. Previous work by Fabian et al. (2012) and Bergland et al. (2016) used FST outlier analyses to identify loci across the genome that are likely to be undergoing adaptive divergence among populations of D. melanogaster that inhabit different thermal environments in eastern North America and eastern Australia. Among the 109 candidate genes that showed convergent patterns of clinal latitudinal differentiation in North America and Australia (Fabian et al., 2012; Bergland et al., 2016), seven of these genes were associated with CTmax and one was associated with CTmin in the DGRP. The clinal genes associated with CTmax were beat-VII, dpr8, CG33970, CG42322, Tsp66E, A2bp1, and Moe, and the sole clinal gene associated with CTmin was fru. Most of these clinal CTmax genes also changed expression following heat stress: three genes were downregulated (beat-VII, dpr8, and CG42322), two genes were upregulated (Tsp66E and Moe), and two genes (CG33970 and A2bp1) were not differentially expressed (Supplementary Table 7). These genes are involved in a myriad of cellular and developmental processes, but a general theme is the potential role of neuronal processes in the thermal adaptation of heat tolerance (see below for additional discussion on the nervous system). It is also interesting to note the potential role of regulatory genes in thermal adaptation. Specifically, the CTmax clinal gene A2bp1 is an RNA-binding Fox protein that regulates transcription and mRNA translation (Usha and Shashidhara, 2010; Carreira-Rosario et al., 2016), and the sole CTmin clinal gene fru is a zinc finger transcription factor known to be a regulator of transcriptional activity of many genes across various tissues (Sato and Yamamoto, 2020). While these genes did not dynamically respond to heat or cold stress (Supplementary Table 7), they may be important for setting up the developmental and/or cellular contexts in which stress responses operate.
H1: Genes Associated With Thermal Tolerance Are Involved in Dynamic Stress Responses
Thermal tolerance is shaped by a combination of preparative processes that improve stress resistance and dynamic changes in gene expression and activity that occur during and after stress. Dynamic changes in gene expression are well-established responses to thermal stress, and here we observed sweeping changes in gene expression in response to temperature change. Ramping at 0.25°C min–1 toward both temperature extremes elicited transcriptome-wide gene expression changes, with 43.9% and 54.0% of detected genes differentially expressed under cold and heat shock, respectively. These values are substantially larger than those reported in other studies, which range from minimal transcriptional response to ∼15% of the transcriptome, depending on the methodology used (Zhou et al., 2012; Telonis-Scott et al., 2013; von Heckel et al., 2016; Königer and Grath, 2018).
By pairing GWAS and RNA-seq using similar ramping methodologies, we can assess the extent to which GWAS candidates are directly involved in dynamic stress responses. GWAS-associated CTmax genes were significantly more temperature-responsive than the transcriptome at large and CTmin genes were marginally so (Figure 4), suggesting that genes associated with thermal tolerance are involved in the dynamic response to thermal stress. This congruence was also mirrored in the intersection of overrepresented GO terms in the two datasets, with five of six categories overrepresented in the CTmin GWAS also enriched among genes of cold shock response, and 13 of 17 CTmax categories shared with the heat shock response (Figure 5).
Despite a lower total number of genes identified that underlie CTmax, the total set of overrepresented biological process categories was more diverse than for CTmin and included cell signaling, muscle structure and function, and the sensory system (Figure 5). This may indicate a stronger role of active defensive responses in setting CTmax. At the individual gene level, the majority of top GWAS hits for CTmax were thermally responsive (Table 1) and were similarly diverse in function, including genes involved in neuropeptide signaling, mRNA processing, and protein dephosphorylation and catabolism. In contrast to the cold response, which included a mix of downregulated and upregulated genes, the majority of CTmax GWAS hits found within thermally responsive categories were upregulated under heat ramp conditions, suggesting that they are involved in active protection from or in response to heat damage (Figure 4). Thus, although the magnitude of phenotypic variation in CTmax is substantially lower than that of CTmin, standing genetic variation may be mediated via a wider range of defensive mechanisms, each of small effect.
Interestingly, the GWAS analysis did not indicate a role for the genes most commonly associated with thermal tolerance in experimental work. Much of the early literature on thermal limits focused on the effects of copy number and regulatory control of the heat shock protein (hsp) genes (Welte et al., 1993; Feder et al., 1996), and natural selection may also affect hsp allele frequencies (e.g., hsp70; Bettencourt et al., 2002). However, neither hsp genes nor their regulatory factors (e.g., hsf-1) were identified from the GWAS analysis as causal drivers of variation for either heat or cold limits within the DGRP. These hsp genes and their regulatory factors (hsf) did increase in expression in response to both cold and heat shock, so while these canonical stress genes had clear roles in dynamic stress responses, polymorphisms in these genes were not associated with thermal limits in the DGRP. For cold tolerance, Frost (Fst) is commonly upregulated in response to cold acclimation and during recovery from cold stress (Goto, 2001; Qin et al., 2005; Sinclair et al., 2007; Colinet et al., 2010), and it is also located within a QTL for chill coma recovery time (Morgan and Mackay, 2006). In our study, Frost was not associated with variation for thermal limits. Further, it was not differentially expressed following cold shock but was upregulated after the heat shock. The lack of upregulation during cold stress is likely due to flies being sampled at 4°C, as Frost expression typically only increases during recovery from cold stress (Bing et al., 2012). The unexpected upregulation during a heat ramp suggests that Frost may be involved in heat stress, in addition to its role for cold and desiccation stress (Sinclair et al., 2007). Likewise, Starvin (stv), a poorly studied gene that is strongly upregulated during recovery from cold stress (Colinet and Hoffmann, 2010), was not associated with thermal tolerance but was upregulated after heat shock in this study.
H2: Genes Associated With Thermal Tolerance Have Regulatory Functions
Changes in gene transcription are one of the primary cellular responses to cold and heat stress in this and other studies (Gasch et al., 2000; Leemans et al., 2000; Gracey, 2007; Lockwood et al., 2010; Brown et al., 2014; Sørensen et al., 2016). Moreover, there is a direct connection between whole-organism stress tolerance and the ability to transcriptionally respond to stress, as organisms with limited transcriptional stress responses have lower survival following exposure to stress (Welte et al., 1993; Feder et al., 1996; Hofmann et al., 2000). Therefore, we expected to find candidate genes for thermal tolerance that have gene regulatory functions, such as transcription factors. Polymorphisms in regulatory genes or genomic regions may modify transcriptional responses to thermal stress, and thereby confer phenotypic differences in whole-organism thermal tolerance (Zatsepina et al., 2001; Bettencourt et al., 2002; Lerman et al., 2003). We report evidence for this potential regulatory effect among the SNPs that underlie both heat and cold tolerance, but consistent with the stronger pattern of upregulation in the dynamic response to heat, our results suggest a larger role of transcription factors in driving genetically based variation in CTmax than in CTmin.
Overall, there were nine CTmax-associated transcription factor genes (Table 1), and all were differentially expressed in response to heat stress (Supplementary Table 7). Indeed, the top four SNPs that were associated with CTmax (lowest p-value; Supplementary Table 3) were in two genes that encode transcription factors, Oaz and lola. Oaz encodes a transcription factor known to be involved in spiracle development (Krattinger et al., 2007), and thus may mediate developmental mechanisms that impact heat tolerance, especially since spiracles facilitate gas exchange and failings of aerobic respiration may set upper thermal limits (Dahlhoff and Somero, 1993; Pörtner, 2002). Oaz may also be involved in regulating the dynamic transcriptional response to heat stress, as it was the most strongly downregulated transcription factor following heat stress (Supplementary Table 7). lola is involved in a diverse array of cellular and developmental processes (Thurmond et al., 2019), and is represented among several GO categories in Figure 5. All four of the top CTmax SNPs lie in introns of the coding sequences of Oaz or lola, suggesting that these polymorphisms influence gene regulation (Bicknell et al., 2012). Indeed, in the case of lola both mutations lie in a region that is a putative transcription factor binding site. While previous work also showed that these two genes respond to heat stress in D. melanogaster (Brown et al., 2014), to our knowledge no previous studies have identified a functional role for these genes in heat tolerance. Another notable CTmax-associated SNP lies in two overlapping genes that encode the transcription factors HmgD and HmgZ; the CTmax SNP lies in the 5′ UTR intron of HmgZ and in the putative upstream regulatory region of HmgD. These genes encode proteins that belong to the family of high mobility group box transcription factors that are known to facilitate gene transcription by promoting DNA structural flexibility via chromatin remodeling (Štros, 2010), and both of these genes were differentially expressed following heat stress (Supplementary Table 7). Interestingly, high mobility group proteins have previously been reported to show expression patterns that track environmental temperature in killifish, Austrofundulus limnaeus (Podrabsky and Somero, 2004). Thus, the regulation of gene transcription may be a key aspect of heat tolerance in D. melanogaster.
The genetic architecture of cold tolerance also included genetic variation in transcription factor genes, but most of the CTmin-associated transcription factor genes did not change expression following cold stress, suggesting a qualitative difference in the role of transcription factors in heat vs. cold tolerance. While there were 12 transcription factor genes with significant associations with CTmin (Table 1), only three of these genes changed expression following cold stress (Supplementary Table 7). Importantly, one of the top SNPs in association with CTmin lies in the gene blistered (bs) (Supplementary Table 3). bs encodes a transcription factor known to be involved in a variety of developmental processes, including wing morphogenesis (Dworkin and Gibson, 2006), tracheal development (Affolter et al., 1994), and neural system development (Donlea et al., 2009; Thran et al., 2013). Similar to lola, the thermal tolerance SNP in bs lies in an intron with a transcription factor binding site; however, in contrast to lola and the other CTmax-associated transcription factor genes, bs did not change expression in response to cold shock (Supplementary Table 7).
One of the three genes associated with both CTmin and CTmax, the long non-coding RNA (lncRNA) iab-8, was downregulated in both cold and heat shock. LncRNAs have been implicated in a range of biological processes and are emerging as key regulators of gene expression at transcriptional and post-transcriptional levels (Li et al., 2019). In vivo studies of lncRNAs revealed that dysregulated expression of lncRNAs in Drosophila may result in poor stress resistance (Lakhotia et al., 2012). The iab-8 lncRNA, expressed in the embryonic abdominal segment 8, represses the expression of the abd-A gene in the posterior central nervous system (Li et al., 2019). The abd-A gene is linked with neural system development (Bello et al., 2003; Cenci and Gould, 2005), and as discussed below, the nervous system likely plays an important role in thermal tolerance.
H3: Genes Involved in Thermal Tolerance Affect the Developmental and Structural Context
Thermal tolerance occurs within a developmental and structural context, making physiological systems more or less resistant to temperature challenges (González-Tokman et al., 2020). Thus, genes associated with thermal tolerance may do so by altering the physiological condition of the organism at the time of thermal stress. Because these genes alter baseline preparedness prior to application of cold or heat, the expression of these genes may not directly respond to temperature changes. Moreover, we would expect their biological function to be concentrated in processes underlying thermal stability of physiological functions, such as the central and peripheral nervous system, cell membrane composition, and proteome stability (Cossins and Prosser, 1978; Gu and Hilser, 2009; Cooper et al., 2012; Fields et al., 2015; MacMillan et al., 2015a; Willot et al., 2017).
Our results suggest that although segregating variation in both heat and cold tolerance is likely to include some structural effects, preparative processes that enhance thermal stress resistance appear to play a stronger role for CTmin. Fully half of the CTmin GWAS genes did not change significantly in expression in response to cold exposure, regardless of the significance cutoff used (Table 1). These included a cluster of functionally related genes (dar1, fru, NetA, RhoGEF64C, trio, twf) involved in nervous system development, which was reflected in overrepresentation of the nervous system and cell morphogenesis and differentiation GO categories in the CTmin GWAS gene set. Neuronal failure operationally defines both CTmin and CTmax (Andersen et al., 2018; Andersen and Overgaard, 2019; Jørgensen et al., 2019), and dynamic stabilization of the neuromuscular circuit under temperature stress is a likely mechanism for altering thermal limits. Indeed, previous investigation of the genetic architecture of cold hardiness and electrophysiological analyses of the rapid hardening response both suggest an important role for stabilization of ion channels and cytoskeletal structures supporting the synapse and neuromuscular junction (Klose and Robertson, 2004; Robertson and Money, 2012; Freda et al., 2017). Aside from genes involved in neural morphogenesis, the GO term extracellular structure organization was overrepresented among cold tolerance genes, and this was the only overrepresented category that did not overlap with the differential expression categories. The glial-derived extracellular matrix is integrally involved in development, stabilization and plasticity of neuronal synapses, and is involved in promoting cell survival, facilitating repair, and maintaining synaptic current amplitude under stress conditions (Dityatev et al., 2010; Faissner et al., 2010; Wang et al., 2018). Together, these results suggest that stabilization of nervous function is an important component of cold tolerance, which is consistent with recent physiological literature (reviewed by Overgaard and MacMillan, 2017).
For CTmax, more of the GWAS candidate genes were differentially expressed, especially when considering the strongest candidates (Supplementary Table 7). Relatively few of the non-responsive genes were found within overrepresented categories, with a range of only 0–3 included in each of the 17 enriched CTmax GO categories (Figure 5). The few genes that consistently appeared in overrepresented categories, fra, fz2 and ptc, are also functionally associated with the nervous system, including axon and dendrite guidance and synapse organization. Spreading depolarization of the central nervous system (triggered by failure to maintain ion gradients between the intra- and extracellular compartments) is linked with heat tolerance across Drosophila species (Jørgensen et al., 2019), indicating that neuronal failure is an important component of heat tolerance in addition to cold tolerance. An additional set of three genes, Pax, sls and Zasp66, co-occurred in several associated categories of muscle structure and development (Figure 5). Depolarization of muscles has been associated with lower thermal limits (e.g., MacMillan et al., 2014, 2015b) but to our knowledge has not been linked to upper limits.
Conclusion
Several studies have separately assessed the genetic architecture and plastic transcriptional responses to thermal stress, but the extent to which genes associated with thermal tolerance are involved in preparative and dynamic stress responses has not been assessed. Here, we show that genes associated with variation in thermal tolerance, identified via GWAS, included differentially expressed genes directly involved in the dynamic stress response, as well as a number of transcription factors that likely regulate these processes. However, while GWAS candidate genes were more likely to be differentially expressed, genes commonly associated with thermal stress, such as heat shock proteins (hsp), were not identified among GWAS genes. These core stress genes tend to be highly conserved, so it is likely that these genes have little genetic variation, especially in functional regions. In addition, consistent with previous studies (e.g., Sørensen et al., 2005; Telonis-Scott et al., 2013; MacMillan et al., 2016), most of the differentially expressed genes were downregulated for both hot and cold stresses. This result suggests an important role for shutting down certain biological processes during stress, and future studies should address these processes that are incompatible with stress tolerance, in addition to the well-studied protective pathways that are activated by stress.
A noteworthy finding of our study is a prominent role for genes involved in preparatory physiological processes that influence the condition of the organism at the time of thermal stress. While we did not observe an abundance of genes involved in processes commonly associated with preparation for thermal stress, such as cell membrane, circadian function, and immune response (Sinensky, 1974; Koštál, 2010; Teets and Hahn, 2018), we found a strong representation of nervous system processes for both CTmin and CTmax GWAS genes. Many of these genes have defined roles in development or morphogenesis, suggesting that developmental processes can influence thermal tolerance later in life, or that some of these genes are co-opted for thermal tolerance later in life. Future validation with other tools, such as RNA interference and transgenic overexpression, can clarify the precise role of these genes in thermal tolerance.
While all three of our hypotheses were supported for both cold and heat tolerance, genes associated with upper thermal limits tended to be more involved in dynamic stress responses than those associated with cold tolerance. Furthermore, some genes associated with thermal tolerance appear to play multiple roles, highlighting that our three hypotheses are not mutually exclusive and that some genes likely have pleiotropic roles to shape thermal tolerance. Both upper and lower thermal limits had a strong genetic component, but the genetic signatures for these traits were largely distinct, with no overlapping SNPs and only three overlapping genes. Thus, heat and cold tolerance involve distinct molecular processes and can likely independently involve in response to changing environmental conditions.
Data Availability Statement
All datasets generated for this study are included in the article/Supplementary Material. Sequencing data have been deposited into the NCBI SRA database with accession Bioproject PRJNA612361.
Author Contributions
NT, BL, SC, JW, and HA acquired the financial support for the project leading to this publication. NT, BL, and SC conceived and designed the study. ML, DA, LU, NJ, MW, EM, BP, and KB performed the experiments and data collection. ML, DA, TO’L, SF, BL, NT, and SC analyzed the data. ML, DA, TO’L, SF, BL, NT, and SC wrote the manuscript. All authors approved the final version of the manuscript.
Funding
This work was supported by the National Science Foundation grant OIA-1826689 to NT, BL, SF, JW, HA, and SC, Hatch Project 1010996 from the USDA National Institute of Food and Agriculture to NT. ML was partially supported by the National Science Foundation I/UCRC, The Center for Arthropod Management Technologies, under grant IIP-1821936, and by industry partners to NT.
Conflict of Interest
The authors declare that the research was conducted in the absence of any commercial or financial relationships that could be construed as a potential conflict of interest.
Acknowledgments
We thank Mark Garcia for help constructing and maintaining the apparatuses used for CTmin and CTmax measurements. We also thank Alison Gerken for providing their DGRP data.
Supplementary Material
The Supplementary Material for this article can be found online at: https://www.frontiersin.org/articles/10.3389/fgene.2020.00658/full#supplementary-material
Footnotes
References
Addo-Bediako, A., Chown, S. L., and Gaston, K. J. (2000). Thermal tolerance, climatic variability and latitude. Proc. R. Soc. B 267, 739–745. doi: 10.1098/rspb.2000.1065
Affolter, M., Montagne, J., Walldorf, U., Groppe, J., Kloter, U., LaRosa, M., et al. (1994). The Drosophila SRF homolog is expressed in a subset of tracheal cells and maps within a genomic region required for tracheal development. Development 120, 743–753.
Andersen, M. K., Jensen, N. J. S., Robertson, R. M., and Overgaard, J. (2018). Central nervous system shutdown underlies acute cold tolerance in tropical and temperate Drosophila species. J. Exp. Biol. 221:jeb179598. doi: 10.1242/jeb.179598
Andersen, M. K., and Overgaard, J. (2019). The central nervous system and muscular system play different roles for chill coma onset and recovery in insects. Comp. Biochem. Physiol. Part A 233, 10–16. doi: 10.1016/j.cbpa.2019.03.015
Angilletta, M. (2009). Thermal Adaptation: A Theoretical and Empirical Synthesis. Oxford: Oxford University Press.
Awde, D. N., Fowler, T. E., Pérez-Gálvez, F., Garcia, M. J., and Teets, N. M. (2020). High throughput assays of critical thermal limits in insects. J. Vis. Exp. e61186. doi: 10.3791/61186
Ayrinhac, A., Debat, V., Gibert, P., Kister, A.-G., Legout, H., Moreteau, B., et al. (2004). Cold adaptation in geographical populations of Drosophila melanogaster: phenotypic plasticity is more important than genetic variability. Funct. Ecol. 18, 700–706. doi: 10.1111/j.0269-8463.2004.00904.x
Barton, N. H., and Keightley, P. D. (2002). Understanding quantitative genetic variation. Nat. Rev. Genet. 3, 11–21. doi: 10.1038/nrg700
Bates, D., Mächler, M., Bolker, B., and Walker, S. (2015). Fitting Linear Mixed-Effects Models using lme4. J. Stat. Softw. 67:48. doi: 10.18637/jss.v067.i01
Bello, B. C., Hirth, F., and Gould, A. P. (2003). A Pulse of the Drosophila Hox protein abdominal-a schedules the end of neural proliferation via neuroblast apoptosis. Neuron 37, 209–219. doi: 10.1016/S0896-6273(02)01181-9
Bergland, A. O., Behrman, E. L., O’Brien, K. R., Schmidt, P. S., and Petrov, D. A. (2014). Genomic evidence of rapid and stable adaptive oscillations over seasonal time scales in drosophila. PLoS Genetics 10:e1004775. doi: 10.1371/journal.pgen.1004775
Bergland, A. O., Tobler, R., González, J., Schmidt, P., and Petrov, D. (2016). Secondary contact and local adaptation contribute to genome-wide patterns of clinal variation in Drosophila melanogaster. Mol. Ecol. 25, 1157–1174. doi: 10.1111/mec.13455
Bettencourt, B. R., Kim, I., Hoffmann, A. A., and Feder, M. E. (2002). Response to natural and laboratory selection at the Drosophila Hsp70 genes. Evolution 56, 1796–1801. doi: 10.1111/j.0014-3820.2002.tb00193.x
Bicknell, A. A., Cenik, C., Chua, H. N., Roth, F. P., and Moore, M. J. (2012). Introns in UTRs: Why we should stop ignoring them. Bioessays 34, 1025–1034. doi: 10.1002/bies.201200073
Bing, X., Zhang, J., and Sinclair, B. J. (2012). A comparison of Frost expression among species and life stages of Drosophila. Insect Mol. Biol. 21, 31–39. doi: 10.1111/j.1365-2583.2011.01108.x
Brown, J. B., Boley, N., Eisman, R., May, G. E., Stoiber, M. H., Duff, M. O., et al. (2014). Diversity and dynamics of the Drosophila transcriptome. Nature 512, 393–399. doi: 10.1038/nature12962
Buchanan, J. L., Meiklejohn, C. D., and Montooth, K. L. (2018). Mitochondrial dysfunction and infection generate immunity-fecundity tradeoffs in Drosophila. Integr. Comp. Biol. 58, 591–603. doi: 10.1093/icb/icy078
Calosi, P., Bilton, D. T., Spicer, J. I., Votier, S. C., and Atfield, A. (2010). What determines a species’ geographical range? Thermal biology and latitudinal range size relationships in European diving beetles (Coleoptera: Dytiscidae). J. Anim. Ecol. 79, 194–204. doi: 10.1111/j.1365-2656.2009.01611.x
Carreira-Rosario, A., Bhargava, V., Hillebrand, J., Kollipara, R. K., Ramaswami, M., and Buszczak, M. (2016). Repression of Pumilio protein expression by Rbfox1 promotes germ cell differentiation. Dev. Cell 36, 562–571. doi: 10.1016/j.devcel.2016.02.010
Castañeda, L. E., Rezende, E. L., and Santos, M. (2015). Heat tolerance in Drosophila subobscura along a latitudinal gradient: contrasting patterns between plastic and genetic responses. Evolution 69, 2721–2734. doi: 10.1111/evo.12757
Cenci, C., and Gould, A. P. (2005). Drosophila Grainyhead specifies late programmes of neural proliferation by regulating the mitotic activity and Hox-dependent apoptosis of neuroblasts. Development 132, 3835–3845. doi: 10.1242/dev.01932
Chown, S. L. (2001). Physiological variation in insects: hierarchical levels and implications. J. Insect Physiol. 47, 649–660. doi: 10.1016/S0022-1910(00)00163-3
Colinet, H., Fai Lee, S., and Hoffmann, A. (2010). Functional characterization of the frost gene in Drosophila melanogaster: importance for recovery from Chill Coma. PLoS One 5:e10925. doi: 10.1371/journal.pone.0010925
Colinet, H., and Hoffmann, A. (2010). Gene and protein expression of Drosophila Starvin during cold stress and recovery from chill coma. Insect Biochem. Mol. Biol. 40, 425–428. doi: 10.1016/j.ibmb.2010.03.002
Colinet, H., Overgaard, J., Com, E., and Sørensen, J. G. (2013). Proteomic profiling of thermal acclimation in Drosophila melanogaster. Insect Biochem. Mol. Biol. 43, 352–365. doi: 10.1016/j.ibmb.2013.01.006
Cooper, B. S., Hammad, L. A., Fisher, N. P., Karty, J. A., and Montooth, K. L. (2012). In a variable thermal environment selection favor greater plasticity of cell membranes in Drosophila melanogaster. Evolution 66, 1976–1984. doi: 10.1111/j.1558-5646.2011.01566.x
Cossins, A. R., and Prosser, C. L. (1978). Evolutionary adaptation of membranes to temperature. Proc. Natl. Acad. Sci. U.S.A. 75, 2040–2043. doi: 10.1073/pnas.75.4.2040
Costa-Broseta, Á, Perea-Resa, C., Castillo, M.-C., Ruíz, M. F., Salinas, J., and León, J. (2018). Nitric oxide controls constitutive freezing tolerance in Arabidopsis by attenuating the levels of osmoprotectants, stress-related hormones and anthocyanins. Sci. Rep. 8:9268. doi: 10.1038/s41598-018-27668-8
Dahlhoff, E. A., and Somero, G. N. (1993). Effects of temperature on mitochondria from Abalone (genus Haliotis): adaptive plasticity and its limits. J. Exp. Biol. 185, 151–168.
Dityatev, A., Schachner, M., and Sonderegger, P. (2010). The dual role of the extracellular matrix in synaptic plasticity and homeostasis. Nat. Rev. Neurosci. 11, 735–746. doi: 10.1038/nrn2898
Dobin, A., Davis, C. A., Schlesinger, F., Drenkow, J., Zaleski, C., Jha, S., et al. (2013). STAR: ultrafast universal RNA-seq aligner. Bioinformatics 29, 15–21. doi: 10.1093/bioinformatics/bts635
Donlea, J. M., Ramanan, N., and Shaw, P. J. (2009). Use-dependent plasticity in clock neurons regulates sleep need in Drosophila. Science 324, 105–108. doi: 10.1126/science.1166657
Dowd, W. W., King, F. A., and Denny, M. W. (2015). Thermal variation, thermal extremes and the physiological performance of individuals. J. Exp. Biol. 218, 1956–1967. doi: 10.1242/jeb.114926
Durham, M. F., Magwire, M. M., Stone, E. A., and Leips, J. (2014). Genome-wide analysis in Drosophila reveals age-specific effects of SNPs on fitness traits. Nat. Commun. 5:4338. doi: 10.1038/ncomms5338
Dworkin, I., and Gibson, G. (2006). Epidermal growth factor receptor and transforming growth factor-beta signaling contributes to variation for wing shape in Drosophila melanogaster. Genetics 173, 1417–1431. doi: 10.1534/genetics.105.053868
Fabian, D. K., Kapun, M., Nolte, V., Kofler, R., Schmidt, P. S., Schlötterer, C., et al. (2012). Genome-wide patterns of latitudinal differentiation among populations of Drosophila melanogaster from North America. Mol. Ecol. 21, 4748–4769. doi: 10.1111/j.1365-294X.2012.05731.x
Faissner, A., Pyka, M., Geissler, M., Sobik, T., Frischknecht, R., Gundelfinger, E. D., et al. (2010). Contributions of astrocytes to synapse formation and maturation - Potential functions of the perisynaptic extracellular matrix. Brain Res. Rev. 63, 26–38. doi: 10.1016/j.brainresrev.2010.01.001
Fallis, L. C., Fanara, J. J., and Morgan, T. J. (2014). Developmental thermal plasticity among Drosophila melanogaster populations. J. Evol. Biol. 27, 557–564. doi: 10.1111/jeb.12321
Feder, M. E., Cartaño, N. V., Milos, L., Krebs, R. A., and Lindquist, S. L. (1996). Effect of engineering Hsp70 copy number on Hsp70 expression and tolerance of ecologically relevant heat shock in larvae and pupae of Drosophila melanogaster. J. Exp. Biol. 199, 1837–1844.
Feder, M. E., and Hofmann, G. E. (1999). Heat-Shock proteins, molecular chaperones, and the stress response: evolutionary and ecological physiology. Annu. Rev. Physiol. 61, 243–282. doi: 10.1146/annurev.physiol.61.1.243
Fields, P. A., Dong, Y., Meng, X., and Somero, G. N. (2015). Adaptations of protein structure and function to temperature: there is more than one way to ‘skin a cat’. J. Exp. Biol. 218, 1801–1811. doi: 10.1242/jeb.114298
Freda, P. J., Alex, J. T., Morgan, T. J., and Ragland, G. J. (2017). Genetic decoupling of thermal hardiness across metamorphosis in Drosophila melanogaster. Integr. Comp. Biol. 57, 999–1009. doi: 10.1093/icb/icx102
Freda, P. J., Ali, Z. M., Heter, N., Ragland, G. J., and Morgan, T. J. (2019). Stage-specific genotype-by-environment interactions for cold and heat hardiness in Drosophila melanogaster. Heredity 123, 479–491. doi: 10.1038/s41437-019-0236-9
Gasch, A. P., Spellman, P. T., Kao, C. M., Carmel-Harel, O., Eisen, M. B., Storz, G., et al. (2000). Genomic expression programs in the response of yeast cells to environmental changes. Mol. Biol. Cell 11, 4241–4257. doi: 10.1091/mbc.11.12.4241
Gaston, K. J., and Chown, S. L. (1999). Elevation and climatic tolerance: A test using dung beetles. Oikos 86, 584–590. doi: 10.2307/3546663
Gerken, A. R., Eller, O. C., Hahn, D. A., and Morgan, T. J. (2015). Constraints, independence, and evolution of thermal plasticity: probing genetic architecture of long- and short-term thermal acclimation. Proc. Natl. Acad. Sci. U.S.A. 112, 4399–4404. doi: 10.1073/pnas.1503456112
González-Tokman, D., Córdoba-Aguilar, A., Dáttilo, W., Lira-Noriega, A., Sánchez-Guillén, R. A., and Villalobos, F. (2020). Insect responses to heat: physiological mechanisms, evolution and ecological implications in a warming world. Biol. Rev. 95, 802–821. doi: 10.1111/brv.12588
Goto, S. G. (2001). A novel gene that is up-regulated during recovery from cold shock in Drosophila melanogaster. Gene 270, 259–264. doi: 10.1016/S0378-1119(01)00465-6
Gracey, A. Y. (2007). Interpreting physiological responses to environmental change through gene expression profiling. J. Exp. Biol. 210, 1584–1592. doi: 10.1242/jeb.004333
Gu, J., and Hilser, V. J. (2009). Sequence-based analysis of protein energy landscapes reveals nonuniform thermal adaptation within the proteome. Mol. Biol. Evol. 26, 2217–2227. doi: 10.1093/molbev/msp140
Hoffmann, A. A., Anderson, A., and Hallas, R. (2002). Opposing clines for high and low temperature resistance in Drosophila melanogaster. Ecol. Lett. 5, 614–618. doi: 10.1046/j.1461-0248.2002.00367.x
Hoffmann, A. A., Sørensen, J. G., and Loeschcke, V. (2003). Adaptation of Drosophila to temperature extremes: bringing together quantitative and molecular approaches. J. Therm. Biol. 28, 175–216. doi: 10.1016/S0306-4565(02)00057-8
Hofmann, G. E., Buckley, B. A., Airaksinen, S., Keen, J. E., and Somero, G. N. (2000). Heat-shock protein expression is absent in the antarctic fish Trematomus bernacchii (family Nototheniidae). J. Exp. Biol. 203, 2331–2339.
Huey, R. B., Crill, W. D., Kingsolver, J. G., and Weber, K. E. (1992). A method for rapid measurement of heat or cold resistance of small insects. Funct. Ecol. 6, 489–494.
Ivanov, D. K., Escott-Price, V., Ziehm, M., Magwire, M. M., Mackay, T. F. C., Partridge, L., et al. (2015). Longevity GWAS Using the Drosophila Genetic Reference Panel. J. Gerontol. A Biol. Sci. Med. Sci. 70, 1470–1478. doi: 10.1093/gerona/glv047
Jørgensen, L. B., Meldrum Robertson, R., and Overgaard, J. (2019). Neural dysfunction correlates with heat coma and CTmax in Drosophila but does not set the boundaries for heat stress survival. bioRxiv[Preprint] doi: 10.1101/844316
Keightley, P. D., and Lynch, M. (2003). Toward a realistic model of mutations affecting fitness. Evolution 57, 683–685. doi: 10.1111/j.0014-3820.2003.tb01561.x
Kellermann, V., Loeschcke, V., Hoffmann, A. A., Kristensen, T. N., Fløjgaard, C., David, J. R., et al. (2012a). Phylogenetic constrains in key functional traits behind species’ climate niches: patterns of desiccation and cold resistance across 95 Drosophila species. Evolution 66, 3377–3389. doi: 10.1111/j.1558-5646.2012.01685.x
Kellermann, V., Overgaard, J., Hoffmann, A. A., Fløjgaard, C., Svenning, J.-C., and Loeschcke, V. (2012b). Upper thermal limits of Drosophila are linked to species distributions and strongly constrained phylogenetically. Proc. Natl. Acad. Sci. USA 109, 16228–16233. doi: 10.1073/pnas.1207553109
Kelsey, K. J. P., and Clark, A. G. (2017). Variation in position effect variegation within a natural population. Genetics 207, 1157–1166. doi: 10.1534/genetics.117.300306
Klose, M. K., and Robertson, R. M. (2004). Stress-induced thermoprotection of neuromuscular transmission. Integr. Comp. Biol. 44, 14–20. doi: 10.1093/icb/44.1.14
Königer, A., and Grath, S. (2018). Transcriptome analysis reveals candidate genes for cold tolerance in Drosophila ananassae. Genes 9:624. doi: 10.3390/genes9120624
Koštál, V. (2010). “Cell structural modifications in insects at low temperatures,” in Low Temperature Biology of Insects, eds D. L. Denlinger and J. R. E. Lee (Cambridge: Cambridge University Press), 116–140. doi: 10.1017/cbo9780511675997.006
Krattinger, A., Gendre, N., Ramaekers, A., Grillenzoni, N., and Stocker, R. F. (2007). DmOAZ, the unique Drosophila melanogaster OAZ homologue is involved in posterior spiracle development. Dev. Genes Evol. 217, 197–208. doi: 10.1007/s00427-007-0134-7
Lakhotia, S. C., Mallik, M., Singh, A. K., and Ray, M. (2012). The large noncoding hsrω-n transcripts are essential for thermotolerance and remobilization of hnRNPs. HP1 and RNA polymerase II during recovery from heat shock in Drosophila. Chromosoma 121, 49–70. doi: 10.1007/s00412-011-0341-x
Lancaster, L. T., Dudaniec, R. Y., Chauhan, P., Wellenreuther, M., Svensson, E. I., and Hansson, B. (2016). Gene expression under thermal stress varies across a geographical range expansion front. Mol. Ecol. 25, 1141–1156. doi: 10.1111/mec.13548
Leemans, R., Egger, B., Loop, T., Kammermeier, L., He, H., Hartmann, B., et al. (2000). Quantitative transcript imaging in normal and heat-shocked Drosophila embryos by using high-density oligonucleotide arrays. Proc. Natl. Acad. Sci. U.S.A. 97, 12138–12143. doi: 10.1073/pnas.210066997
Lerman, D. N., Michalak, P., Helin, A. B., Bettencourt, B. R., and Feder, M. E. (2003). Modification of heat-shock gene expression in Drosophila melanogaster populations via transposable elements. Mol. Biol. Evol. 20, 135–144. doi: 10.1093/molbev/msg015
Li, K., Tian, Y., Yuan, Y., Fan, X., Yang, M., He, Z., et al. (2019). Insights into the Functions of LncRNAs in Drosophila. Int. J. Mol. Sci. 20:4646. doi: 10.3390/ijms20184646
Liao, Y., Smyth, G. K., and Shi, W. (2019). The R package Rsubread is easier, faster, cheaper and better for alignment and quantification of RNA sequencing reads. Nucleic Acids Res. 47, e47–e47. doi: 10.1093/nar/gkz114
Liu, J. Z., McRae, A. F., Nyholt, D. R., Medland, S. E., Wray, N. R., Brown, K. M., et al. (2010). A versatile gene-based test for genome-wide association studies. Am. J. Hum. Genet. 87, 139–145. doi: 10.1016/j.ajhg.2010.06.009
Lockwood, B. L., Sanders, J. G., and Somero, G. N. (2010). Transcriptomic responses to heat stress in invasive and native blue mussels (genus Mytilus): molecular correlates of invasive success. J. Exp. Biol. 213, 3548–3558. doi: 10.1242/jeb.046094
Love, M. I., Huber, W., and Anders, S. (2014). Moderated estimation of fold change and dispersion for RNA-seq data with DESeq2. Genome Biol. 15:550. doi: 10.1186/s13059-014-0550-558
Mackay, T. F. C., and Huang, W. (2018). Charting the genotype–phenotype map: lessons from the Drosophila melanogaster Genetic Reference Panel. WIREs Dev. Biol. 7:e289. doi: 10.1002/wdev.289
Mackay, T. F. C., Richards, S., Stone, E. A., Barbadilla, A., Ayroles, J. F., Zhu, D., et al. (2012). The Drosophila melanogaster genetic reference panel. Nature 482, 173–178. doi: 10.1038/nature10811
MacMillan, H. A., Andersen, J. L., Loeschcke, V., and Overgaard, J. (2015a). Sodium distribution predicts the chill tolerance of Drosophila melanogaster raised in different thermal conditions. Am. J. Physiol. Regul. Integr. Comp. Physiol. 308, R823–R831. doi: 10.1152/ajpregu.00465.2014
MacMillan, H. A., Baatrup, E., and Overgaard, J. (2015b). Concurrent effects of cold and hyperkalaemia cause insect chilling injury. Proceedings. Biol. Sci. 282:20151483. doi: 10.1098/rspb.2015.1483
MacMillan, H. A., Findsen, A., Pedersen, T. H., and Overgaard, J. (2014). Cold-induced depolarization of insect muscle: differing roles of extracellular K+ during acute and chronic chilling. J. Exp. Biol. 217, 2930–2938. doi: 10.1242/jeb.107516
MacMillan, H. A., Knee, J. M., Dennis, A. B., Udaka, H., Marshall, K. E., Merritt, T. J. S., et al. (2016). Cold acclimation wholly reorganizes the Drosophila melanogaster transcriptome and metabolome. Sci. Rep. 6:28999. doi: 10.1038/srep28999
Manjunatha, H. B., Rajesh, R. K., and Aparna, H. S. (2010). Silkworm thermal biology: a review of heat shock response, heat shock proteins and heat acclimation in the domesticated silkworm. Bombyx mori. J. Insect Sci. 10:204. doi: 10.1673/031.010.20401
McMillan, D. M., Fearnley, S. L., Rank, N. E., and Dahlhoff, E. P. (2005). Natural temperature variation affects larval survival, development and Hsp70 expression in a leaf beetle. Funct. Ecol. 19, 844–852. doi: 10.1111/j.1365-2435.2005.01031.x
Morgan, T. J., and Mackay, T. F. C. (2006). Quantitative trait loci for thermotolerance phenotypes in Drosophila melanogaster. Heredity 96, 232–242. doi: 10.1038/sj.hdy.6800786
Nyamukondiwa, C., Terblanche, J. S., Marshall, K. E., and Sinclair, B. J. (2011). Basal cold but not heat tolerance constrains plasticity among Drosophila species (Diptera: Drosophilidae). J. Evol. Biol. 24, 1927–1938. doi: 10.1111/j.1420-9101.2011.02324.x
Ørsted, M., Rohde, P. D., Hoffmann, A. A., Sørensen, P., and Kristensen, T. N. (2018). Environmental variation partitioned into separate heritable components. Evolution 72, 136–152. doi: 10.1111/evo.13391
Overgaard, J., and MacMillan, H. A. (2017). The Integrative Physiology of Insect Chill Tolerance. Annu. Rev. Physiol. 79, 187–208. doi: 10.1146/annurev-physiol-022516-034142
Parankusam, S., Adimulam, S. S., Bhatnagar-Mathur, P., and Sharma, K. K. (2017). Nitric oxide (NO) in plant heat stress tolerance: current knowledge and perspectives. Front. Plant Sci. 8:1582. doi: 10.3389/fpls.2017.01582
Patterson, N., Price, A. L., and Reich, D. (2006). Population structure and eigenanalysis. PLoS Genet. 2:e190. doi: 10.1371/journal.pgen.0020190
Podrabsky, J. E., and Somero, G. N. (2004). Changes in gene expression associated with acclimation to constant temperatures and fluctuating daily temperatures in an annual killifish Austrofundulus limnaeus. J. Exp. Biol. 207, 2237–2254. doi: 10.1242/jeb.01016
Pörtner, H. O. (2002). Climate variations and the physiological basis of temperature dependent biogeography: systemic to molecular hierarchy of thermal tolerance in animals. Comp. Biochem. Physiol. Part A 132, 739–761. doi: 10.1016/S1095-6433(02)00045-4
Purcell, S., Neale, B., Todd-Brown, K., Thomas, L., Ferreira, M. A. R., Bender, D., et al. (2007). PLINK: a tool set for whole-genome association and population-based linkage analyses. Am. J. Hum. Genet. 81, 559–575. doi: 10.1086/519795
Qin, W., Neal, S. J., Robertson, R. M., Westwood, J. T., and Walker, V. K. (2005). Cold hardening and transcriptional change in Drosophila melanogaster. Insect Mol. Biol. 14, 607–613. doi: 10.1111/j.1365-2583.2005.00589.x
R Core Team (2019). R: A Language and Environment for Statistical Computing. Vienna: R Foundation for Statistical Computing.
Rako, L., Blacket, M. J., McKechnie, S. W., and Hoffmann, A. A. (2007). Candidate genes and thermal phenotypes: identifying ecologically important genetic variation for thermotolerance in the Australian Drosophila melanogaster cline. Mol. Ecol. 16, 2948–2957. doi: 10.1111/j.1365-294X.2007.03332.x
Robertson, R. M., and Money, T. G. A. (2012). Temperature and neuronal circuit function: compensation, tuning and tolerance. Curr. Opin. Neurobiol. 22, 724–734. doi: 10.1016/j.conb.2012.01.008
Rohde, P. D., Krag, K., Loeschcke, V., Overgaard, J., Sørensen, P., and Kristensen, T. N. (2016). A quantitative genomic approach for analysis of fitness and stress related traits in a Drosophila melanogaster model population. Int. J. Genom. 2016, 1–11. doi: 10.1155/2016/2157494
Rolandi, C., Lighton, J. R. B., de la Vega, G. J., Schilman, P. E., and Mensch, J. (2018). Genetic variation for tolerance to high temperatures in a population of Drosophila melanogaster. Ecol. Evol. 8, 10374–10383. doi: 10.1002/ece3.4409
Roy, B. A., and Kirchner, J. W. (2000). Evolutionary dynamics of pathogen resistance and tolerance. Evolution 54, 51–63. doi: 10.1111/j.0014-3820.2000.tb00007.x
Sato, K., and Yamamoto, D. (2020). The mode of action of Fruitless: is it an easy matter to switch the sex? Genes Brain Behav. 19:e12606. doi: 10.1111/gbb.12606
Schou, M. F., Mouridsen, M. B., Sørensen, J. G., and Loeschcke, V. (2017). Linear reaction norms of thermal limits in Drosophila: predictable plasticity in cold but not in heat tolerance. Funct. Ecol. 31, 934–945. doi: 10.1111/1365-2435.12782
Sgrò, C. M., Overgaard, J., Kristensen, T. N., Mitchell, K. A., Cockerell, F. E., and Hoffmann, A. A. (2010). A comprehensive assessment of geographic variation in heat tolerance and hardening capacity in populations of Drosophila melanogaster from eastern Australia. J. Evol. Biol. 23, 2484–2493. doi: 10.1111/j.1420-9101.2010.02110.x
Sinclair, B. J., Coello Alvarado, L. E., and Ferguson, L. V. (2015). An invitation to measure insect cold tolerance: methods, approaches, and workflow. J. Ther. Biol. 53, 180–197. doi: 10.1016/j.jtherbio.2015.11.003
Sinclair, B. J., Gibbs, A. G., and Roberts, S. P. (2007). Gene transcription during exposure to, and recovery from, cold and desiccation stress in Drosophila melanogaster. Insect Mol. Biol. 16, 435–443. doi: 10.1111/j.1365-2583.2007.00739.x
Sinensky, M. (1974). Homeoviscous adaptation–a homeostatic process that regulates the viscosity of membrane lipids in Escherichia coli. Proc. Natl. Acad. Sci. U.S.A. 71, 522–525. doi: 10.1073/pnas.71.2.522
Sørensen, J. G., Dahlgaard, J., and Loeschcke, V. (2001). Genetic variation in thermal tolerance among natural populations of Drosophila buzzatii: down regulation of Hsp70 expression and variation in heat stress resistance traits. Funct. Ecol. 15, 289–296. doi: 10.1046/j.1365-2435.2001.00525.x
Sørensen, J. G., and Loeschcke, V. (2001). Larval crowding in Drosophila melanogaster induces Hsp70 expression, and leads to increased adult longevity and adult thermal stress resistance. J. Insect Physiol. 47, 1301–1307. doi: 10.1016/S0022-1910(01)00119-6
Sørensen, J. G., Nielsen, M. M., Kruhøffer, M., Justesen, J., and Loeschcke, V. (2005). Full genome gene expression analysis of the heat stress response in Drosophila melanogaster. Cell Stress Chaperones 10, 312–328. doi: 10.1379/csc-128r1.1
Sørensen, J. G., Schou, M. F., Kristensen, T. N., and Loeschcke, V. (2016). Thermal fluctuations affect the transcriptome through mechanisms independent of average temperature. Sci. Rep. 6:30975. doi: 10.1038/srep30975
Storey, J. D., and Tibshirani, R. (2003). Statistical significance for genomewide studies. Proc. Natl. Acad. Sci. U.S.A. 100, 9440–9445. doi: 10.1073/pnas.1530509100
Storey, K. B., and Storey, J. M. (2012). Insect cold hardiness: metabolic, gene, and protein adaptation. Can. J. Zool. 90, 456–475. doi: 10.1139/z2012-011
Štros, M. (2010). HMGB proteins: Interactions with DNA and chromatin. Biochim. Biophys. Acta 1799, 101–113. doi: 10.1016/j.bbagrm.2009.09.008
Stucki, D., Freitak, D., and Sundström, L. (2017). Survival and gene expression under different temperature and humidity regimes in ants. PLoS One 12:e0181137. doi: 10.1371/journal.pone.0181137
Sunday, J., Bennett, J. M., Calosi, P., Clusella-Trullas, S., Gravel, S., Hargreaves, A. L., et al. (2019). Thermal tolerance patterns across latitude and elevation. Philos. Trans. R. Soc. B 374:20190036. doi: 10.1098/rstb.2019.0036
Sunday, J. M., Bates, A. E., and Dulvy, N. K. (2011). Global analysis of thermal tolerance and latitude in ectotherms. Proc. R. Soc. B 278, 1823–1830. doi: 10.1098/rspb.2010.1295
Svetec, N., Werzner, A., Wilches, R., Pavlidis, P., Álvarez-Castro, J. M., Broman, K. W., et al. (2011). Identification of X-linked quantitative trait loci affecting cold tolerance in Drosophila melanogaster and fine mapping by selective sweep analysis. Mol. Ecol. 20, 530–544. doi: 10.1111/j.1365-294X.2010.04951.x
Teets, N. M., and Hahn, D. A. (2018). Genetic variation in the shape of cold-survival curves in a single fly population suggests potential for selection from climate variability. J. Evol. Biol. 31, 543–555. doi: 10.1111/jeb.13244
Teets, N. M., Peyton, J. T., Ragland, G. J., Colinet, H., Renault, D., Hahn, D. A., et al. (2012). Combined transcriptomic and metabolomic approach uncovers molecular mechanisms of cold tolerance in a temperate flesh fly. Physiol. Genomics 44, 764–777. doi: 10.1152/physiolgenomics.00042.2012
Telonis-Scott, M., Hallas, R., McKechnie, S. W., Wee, C. W., and Hoffmann, A. A. (2009). Selection for cold resistance alters gene transcript levels in Drosophila melanogaster. J. Insect Physiol. 55, 549–555. doi: 10.1016/j.jinsphys.2009.01.010
Telonis-Scott, M., van Heerwaarden, B., Johnson, T. K., Hoffmann, A. A., and Sgrò, C. M. (2013). New levels of transcriptome complexity at upper thermal limits in wild Drosophila revealed by exon expression analysis. Genetics 195, 809–830. doi: 10.1534/genetics.113.156224
Thran, J., Poeck, B., and Strauss, R. (2013). Serum response factor-mediated gene regulation in a Drosophila visual working memory. Curr. Biol. 23, 1756–1763. doi: 10.1016/j.cub.2013.07.034
Thurmond, J., Goodman, J. L., Strelets, V. B., Attrill, H., Gramates, L. S., Marygold, S. J., et al. (2019). FlyBase 2.0: the next generation. Nucleic Acids Res. 47, D759–D765. doi: 10.1093/nar/gky1003
Usha, N., and Shashidhara, L. S. (2010). Interaction between Ataxin-2 Binding Protein 1 and Cubitus-interruptus during wing development in Drosophila. Dev. Biol. 341, 389–399. doi: 10.1016/j.ydbio.2010.02.039
von Heckel, K., Stephan, W., and Hutter, S. (2016). Canalization of gene expression is a major signature of regulatory cold adaptation in temperate Drosophila melanogaster. BMC Genomics 17:574. doi: 10.1186/s12864-016-2866-0
Wang, J., Vasaikar, S., Shi, Z., Greer, M., and Zhang, B. (2017). WebGestalt 2017: a more comprehensive, powerful, flexible and interactive gene set enrichment analysis toolkit. Nucleic Acids Res. 45, W130–W137. doi: 10.1093/nar/gkx356
Wang, L., Zhang, W., Li, Q., and Zhu, W. (2015). AssocTests: Genetic Association Studies. R package version 0.0-3. Available online at: https://CRAN.R-project.org/package=AssocTests (accessed April, 2020).
Wang, T., Sinha, A. S., Akita, T., Yanagawa, Y., and Fukuda, A. (2018). Alterations of GABAergic neuron-associated extracellular matrix and synaptic responses in Gad1-heterozygous mice subjected to prenatal stress. Front. Cell. Neurosci. 12:284. doi: 10.3389/fncel.2018.00284
Weber, A. L., Khan, G. F., Magwire, M. M., Tabor, C. L., Mackay, T. F. C., and Anholt, R. R. H. (2012). Genome-wide association analysis of axidative stress resistance in Drosophila melanogaster. PLoS One 7:e34745. doi: 10.1371/journal.pone.0034745
Welte, M. A., Tetrault, J. M., Dellavalle, R. P., and Lindquist, S. L. (1993). A new method for manipulating transgenes: engineering heat tolerance in a complex, multicellular organism. Curr. Biol. 3, 842–853. doi: 10.1016/0960-9822(93)90218-D
Werren, J. H. (1997). Biology of Wolbachia. Annu. Rev. Entomol. 42, 587–609. doi: 10.1146/annurev.ento.42.1.587
Williams, C. M., Henry, H. A. L., and Sinclair, B. J. (2015). Cold truths: how winter drives responses of terrestrial organisms to climate change. Biol. Rev. 90, 214–235. doi: 10.1111/brv.12105
Willot, Q., Gueydan, C., and Aron, S. (2017). Proteome stability, heat hardening and heat-shock protein expression profiles in Cataglyphis desert ants. J. Exp. Biol. 220, 1721–1728. doi: 10.1242/jeb.154161
Wos, G., and Willi, Y. (2015). Temperature-stress resistance and tolerance along a latitudinal cline in North American Arabidopsis lyrata. PLoS One 10:e0131808. doi: 10.1371/journal.pone.0131808
Yancey, P. H. (2005). Organic osmolytes as compatible, metabolic and counteracting cytoprotectants in high osmolarity and other stresses. J. Exp. Biol. 208, 2819–2830. doi: 10.1242/jeb.01730
Zatsepina, O. G., Velikodvorskaia, V. V., Molodtsov, V. B., Garbuz, D., Lerman, D. N., Bettencourt, B. R., et al. (2001). A Drosophila melanogaster strain from sub-equatorial Africa has exceptional thermotolerance but decreased Hsp70 expression. J. Exp. Biol. 204, 1869–1881.
Zhou, S., Campbell, T. G., Stone, E. A., Mackay, T. F. C., and Anholt, R. R. H. (2012). Phenotypic plasticity of the Drosophila transcriptome. PLoS Genet. 8:e1002593. doi: 10.1371/journal.pgen.1002593
Keywords: thermal limit, CTmin, CTmax, heat shock, cold shock, genomics, transcriptomics
Citation: Lecheta MC, Awde DN, O’Leary TS, Unfried LN, Jacobs NA, Whitlock MH, McCabe E, Powers B, Bora K, Waters JS, Axen HJ, Frietze S, Lockwood BL, Teets NM and Cahan SH (2020) Integrating GWAS and Transcriptomics to Identify the Molecular Underpinnings of Thermal Stress Responses in Drosophila melanogaster. Front. Genet. 11:658. doi: 10.3389/fgene.2020.00658
Received: 06 April 2020; Accepted: 29 May 2020;
Published: 23 June 2020.
Edited by:
Ana Sofia Quina, Universidade de Lisboa, PortugalReviewed by:
Mary Anna Carbone, North Carolina State University, United StatesJesper Givskov Sørensen, Aarhus University, Denmark
Copyright © 2020 Lecheta, Awde, O’Leary, Unfried, Jacobs, Whitlock, McCabe, Powers, Bora, Waters, Axen, Frietze, Lockwood, Teets and Cahan. This is an open-access article distributed under the terms of the Creative Commons Attribution License (CC BY). The use, distribution or reproduction in other forums is permitted, provided the original author(s) and the copyright owner(s) are credited and that the original publication in this journal is cited, in accordance with accepted academic practice. No use, distribution or reproduction is permitted which does not comply with these terms.
*Correspondence: Melise C. Lecheta, melise.lecheta@uky.edu