This report is based on population estimates released prior to the 2020 Census. Updated statistics and analyses based on the 2020 census can be found here.
Newly released Census Bureau population estimates through mid-year 2020 reveal record lows in U.S. population growth, both annually and for the 2010-to-2020 decade. While these estimates are done independently from the yet-to-be released 2020 decennial census, they provide the most recent preview of what that census may show for the population totals of the nation and individual states, as well as for congressional reapportionment.
The new estimates indicate that over the period from July 1, 2019 to July 1, 2020, the nation grew by just 0.35%. This is the lowest annual growth rate since at least 1900. The new data also shows that when the 2020 census numbers are announced, the 2010-to-2020 decade growth rate could be the lowest in any decade since the first census was conducted in 1790.
These statistics paint a portrait of a nation that is experiencing unprecedented growth stagnation, even before the COVID-19 pandemic hit. The exceptionally low growth rate from 2019 to 2020 reflects the pandemic’s impact over part of that year. The new statistics also provide estimates of state-level population growth between 2010 and 2020.
Finally, this data permits an educated estimate of how members of the House of Representatives could be reapportioned across states as a result of the 2020 census. Consistent with earlier prognostications, it shows that California could lose a House seat for the first time in the state’s history.
The lowest annual population growth since at least 1900
Figure 1 depicts annual U.S. population growth rates from 1900-01 to 2019-20. The most recent growth rate of 0.35% is the lowest of any single year since the beginning of the twentieth century, and likely for most of the nation’s history.
Over this period, the nation’s growth experienced ups and downs during wars, economic upheavals, and immigration waves. This includes a dip to below 0.5% during the 1918 Spanish flu pandemic and rises to almost 2% during the post-World War II “baby boom.” After sagging to annual levels closer to 1% during the 1970s and 1980s, there was uptick in the 1990s as a consequence of higher immigration.
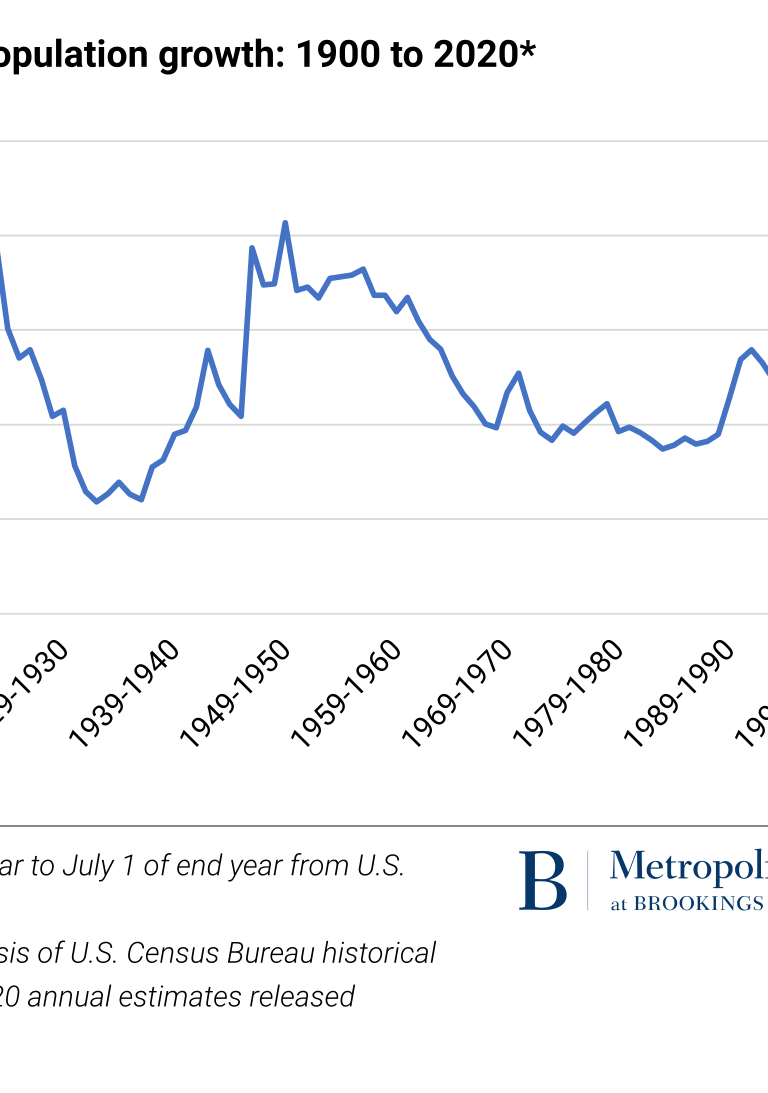
Since 2000, national population growth started to dip again, especially after the Great Recession, and in recent years due to new immigration restrictions. Yet the 2019-to-2020 rate is well below most growth rates over the past 102 years, and less than half the level observed as recently as 2000 (see downloadable Table A).
Part of last year’s sharp decline can be attributed to the COVID-19 pandemic, which brought with it more deaths and further restrictions in immigration. Among states, 16 lost population in 2019-20 including California for the first time, and 34 showed lower growth or greater declines than in the previous year (downloadable Table B).
The lowest decade growth in U.S. history
The new statistics permit an estimate of the U.S. population on Census Day (April 1, 2020) to have been 329.2 million people.[1] If that turns out to be the case, the decade growth rate between 2010 and 2020 will be the lowest decade growth in U.S. history.[2]
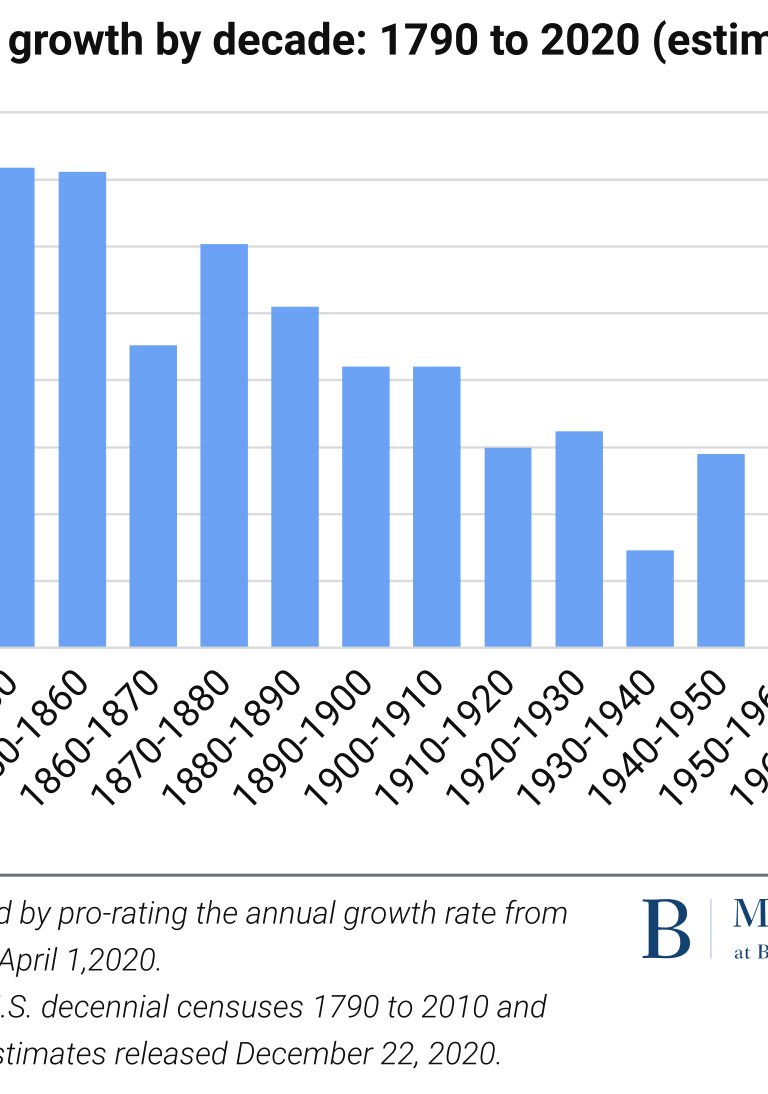
Figure 2 displays population growth rates for 10-year periods between the first U.S. census (taken in 1790) and projected results for the 2020 census (downloadable Table A). The projected growth of 6.6% between 2010 and 2020 is lower than in any previous decade, including the Great Depression years of the 1930s, when the nation registered 7.3% growth. It is roughly half the growth rate of the 1990s, a time of rising immigration and millennial-generation births.
The 2010s decade was one of fewer births, more deaths, and uneven immigration (downloadable Table C). Although immigration may have become unusually low due to recent federal restrictions that led to a decline in the noncitizen foreign-born population, low natural increase levels—fewer births, more deaths—will likely continue regardless of federal policy, as a result of the aging of the population. Some of this change can be attributed to lower fertility rates and the aging into adulthood of the last of the millennial population. However, census projections show older populations—especially those over age 65—will continue to display far higher rates of growth than youth.
A preview of congressional reapportionment
The constitutionally mandated purpose for taking the decennial census is to apportion members of the U.S. House of Representatives across states based on population. As a consequence, some states gain seats and some states lose them. While the Census Bureau is mandated to deliver these population totals to the president by December 31, various delays associated with this year’s pandemic and court cases will likely postpone delivery until sometime in January.
Still, it is possible to use the new state-level data (determined separately from 2020 census) to make educated estimates of which states will gain or lose congressional seats, as shown in Table 1 and downloadable Table D.[3]

This projected reapportionment shows two states—Texas (+3) and Florida (+2)—would gain multiple seats. Five others—all in the West (Arizona, Colorado, Oregon, and Montana) and South (North Carolina)—gain one.
Ten states are projected to lose one seat each. The most noteworthy of these is California, which has never lost a House seat via reapportionment. Other states projected to lose seats are in the Midwest (Minnesota, Illinois, Michigan, and Ohio), the Northeast (Pennsylvania, New York, and Rhode Island) and slow-growing parts of the South (West Virginia and Alabama).
This reapportionment will also affect the Electoral College in future presidential elections. There are a mix of “red” and “blue” states among those gaining and losing seats. Thus, it is difficult to predict how these changes will benefit future Republican and Democratic presidential candidates, especially since Democrats seem to be making strides in growing, formerly Republican states in the West and the South.
The decade ahead
These new census estimates reveal a nation grappling with demographic stagnation to a degree it has not experienced in quite some time. While COVID-19 has surely accentuated this in ways that will continue in the near term, population projections taken prior to the pandemic reveal that our long-term demographic future is characterized by only modest levels of natural increase (births minus deaths), and more pronounced aging. Meanwhile, youth and young adult working-age populations will grow modestly at best, leading to greater “age dependency” as the growing older population becomes dependent on younger workers.
Clearly, the nation’s overall growth—and especially that of its younger population—will depend on a return to healthy immigration levels, as immigrants and their children will become the greatest long-term source of youthful growth. As we rebound from the pandemic, serious attention needs to be given to the crucial role immigration will play in halting even further national growth declines, as well as immigrants’ vital contribution to America’s future economic and demographic viability.
Notes
- This estimate of the April 1, 2020 population of 329.2 million is calculated by adding three-quarters of the population gain from July 1, 2019 to July 1, 2020 (as reported in the new estimates) to the July 1, 2019 estimate.
- This value of 329.2 million population, calculated from the new Census Bureau estimates, falls below the range of alternative April 1, 2020 estimates (with low, middle, and high values of 330.7 million, 332.6 million, and 335.5 million populations) using the Census Bureau’s demographic analysis technique. The alternative estimates would result in 2010-to-2020 growth rates of 7.1%, 7.7%, and 8.7%, respectively. As indicated above, each of these estimated April 1, 2020 populations were derived independently from the 2020 census results, which are yet to be reported.
- State populations used for this estimation were calculated for April 1, 2020 by prorating newly released Census Bureau state estimates for July 1, 2019 and July 1, 2020, as discussed in footnote 1. These population estimates pertain to all persons, including both legal and undocumented immigrants.
Related Content


Authors


Commentary
The 2010s saw the lowest population growth in US history, new census estimates show
December 22, 2020