Note: This column contains updates to the Center for American Progress’ September 2019 columns on the national and state-by-state impacts of DACA recipients.
Since 2012, more than 825,000 people who came to the country at a young age many years ago have been able to take advantage of Deferred Action for Childhood Arrivals (DACA), and the protection from deportation and work permits that the initiative brings. Over the nearly eight years since DACA began, recipients have been able to go back to school; get better and better-paying jobs; buy houses and cars; and start businesses, creating jobs and economic prosperity for all Americans. Even so, and in the midst of the COVID-19 pandemic—as more than 200,000 DACA recipients work on the front lines of the response, serving their communities and the health of the nation—the Trump administration is pushing ahead with its attempt to end DACA.
This column looks at the national and state-by-state demographic and economic impacts of individuals who currently hold DACA. Taken together, this group of people is thriving and giving back to their communities even as their well-being and contributions are at risk.
Methodology
The data in this column are based on CAP analysis of three years of pooled American Community Survey (ACS) microdata: the 2016 1-year, 2017 1-year, and 2018 1-year ACS, accessed via the University of Minnesota’s IPUMS USA. It also contains data on the number of DACA recipients filed as evidence in Regents of the University of California, et al. v. U.S. Department of Homeland Security, et al.; the data are on file with the author and show 643,430 active DACA recipients as of March 31, 2020. Some of the numbers presented here are lower than in previous iterations of this analysis, which can likely be attributed to the quarterly decline in the number of active DACA recipients.
More information on the economic contribution calculations can be found in “What We Know About DACA Recipients in the United States” by Nicole Prchal Svajlenka.
DACA recipients at the national level
On average, DACA recipients arrived in the United States in 1999, at age 7. And more than one-third of DACA recipients—37 percent—arrived before age 5. Given this, and the many years that DACA recipients have waited for Congress to come together and pass a solution that would put them on a pathway to citizenship, the average DACA recipient is now 28 years old. Many have started families: 254,000 U.S.-born children have at least one parent who holds DACA. In total, 1.5 million people live with a DACA recipient.
Nationally, according to CAP analysis, DACA recipients and their households pay $5.6 billion in federal taxes, and $3.1 billion in state and local taxes, each year. That money comes on top of the contributions that DACA recipients make to the health of the Social Security and Medicare funds through their payroll tax contributions. After taxes, DACA recipients and their households have a combined $24 billion in spending power to put back into their communities.
Additionally, DACA recipients own 56,000 homes, making an annual $566.9 million in mortgage payments. Other DACA recipients pay $2.3 billion in rental payments each year.
DACA recipients at the state level
Breaking these data down at the state level shows significant economic activity and contributions in all 50 states.
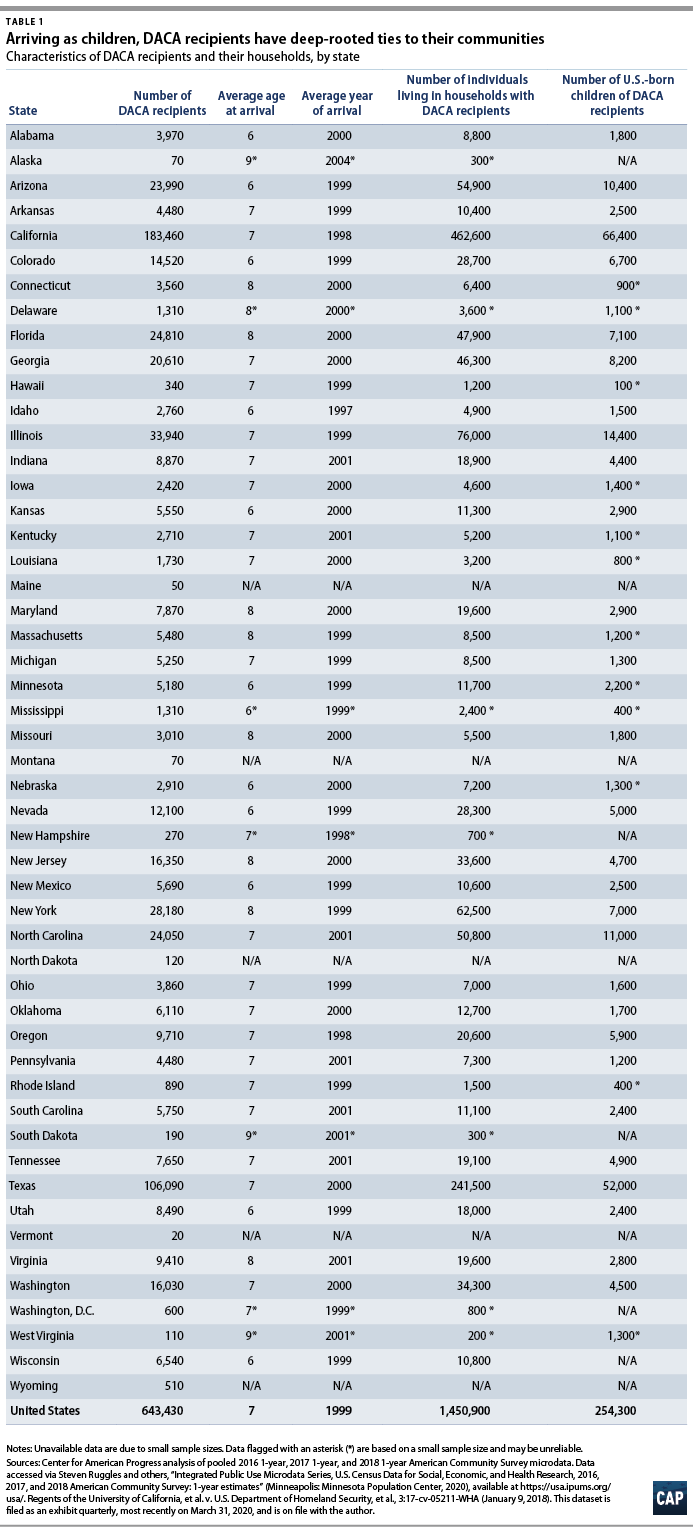
Half of U.S. states have more than 10,000 people living in households with DACA recipients, meaning that the end of DACA would reverberate well beyond recipients themselves.
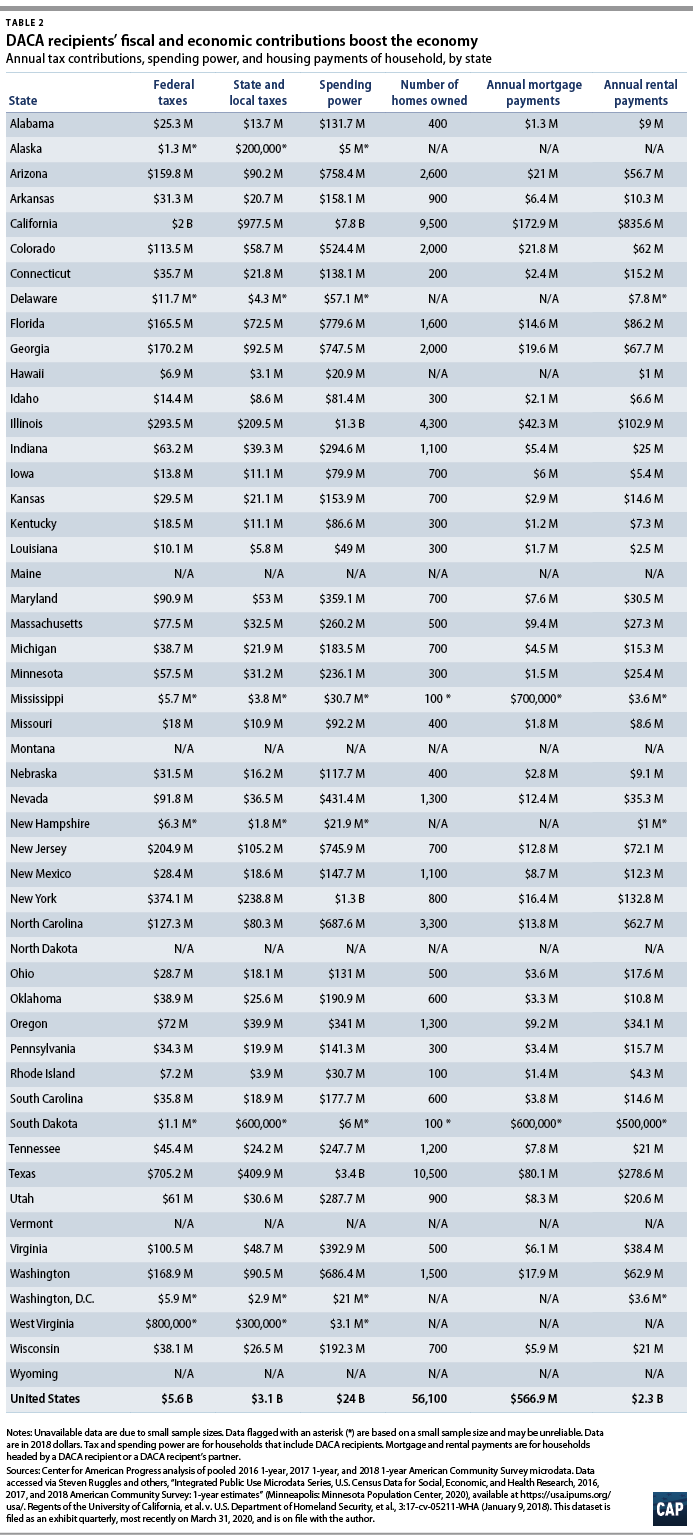
In 42 states and Washington, D.C., DACA recipients and their households pay more than $1 million in state and local taxes each year, with significantly higher contributions—more than $50 million—in a dozen states. At a time when state budgets are deeply constrained by the response to the COVID-19 pandemic, this economic activity is critical to their continued functioning.
Conclusion
In the midst of one of the greatest challenges the nation has ever faced, now is not the time to end DACA and kick recipients out of the workforce. Their families, their communities, and the nation as a whole cannot afford to see DACA end.
Nicole Prchal Svajlenka is an associate director for research on the Immigration Policy team at the Center for American Progress. Philip E. Wolgin is the managing director of Immigration Policy at the Center.