Climate Matters•April 11, 2018
Locally Heavy Precipitation
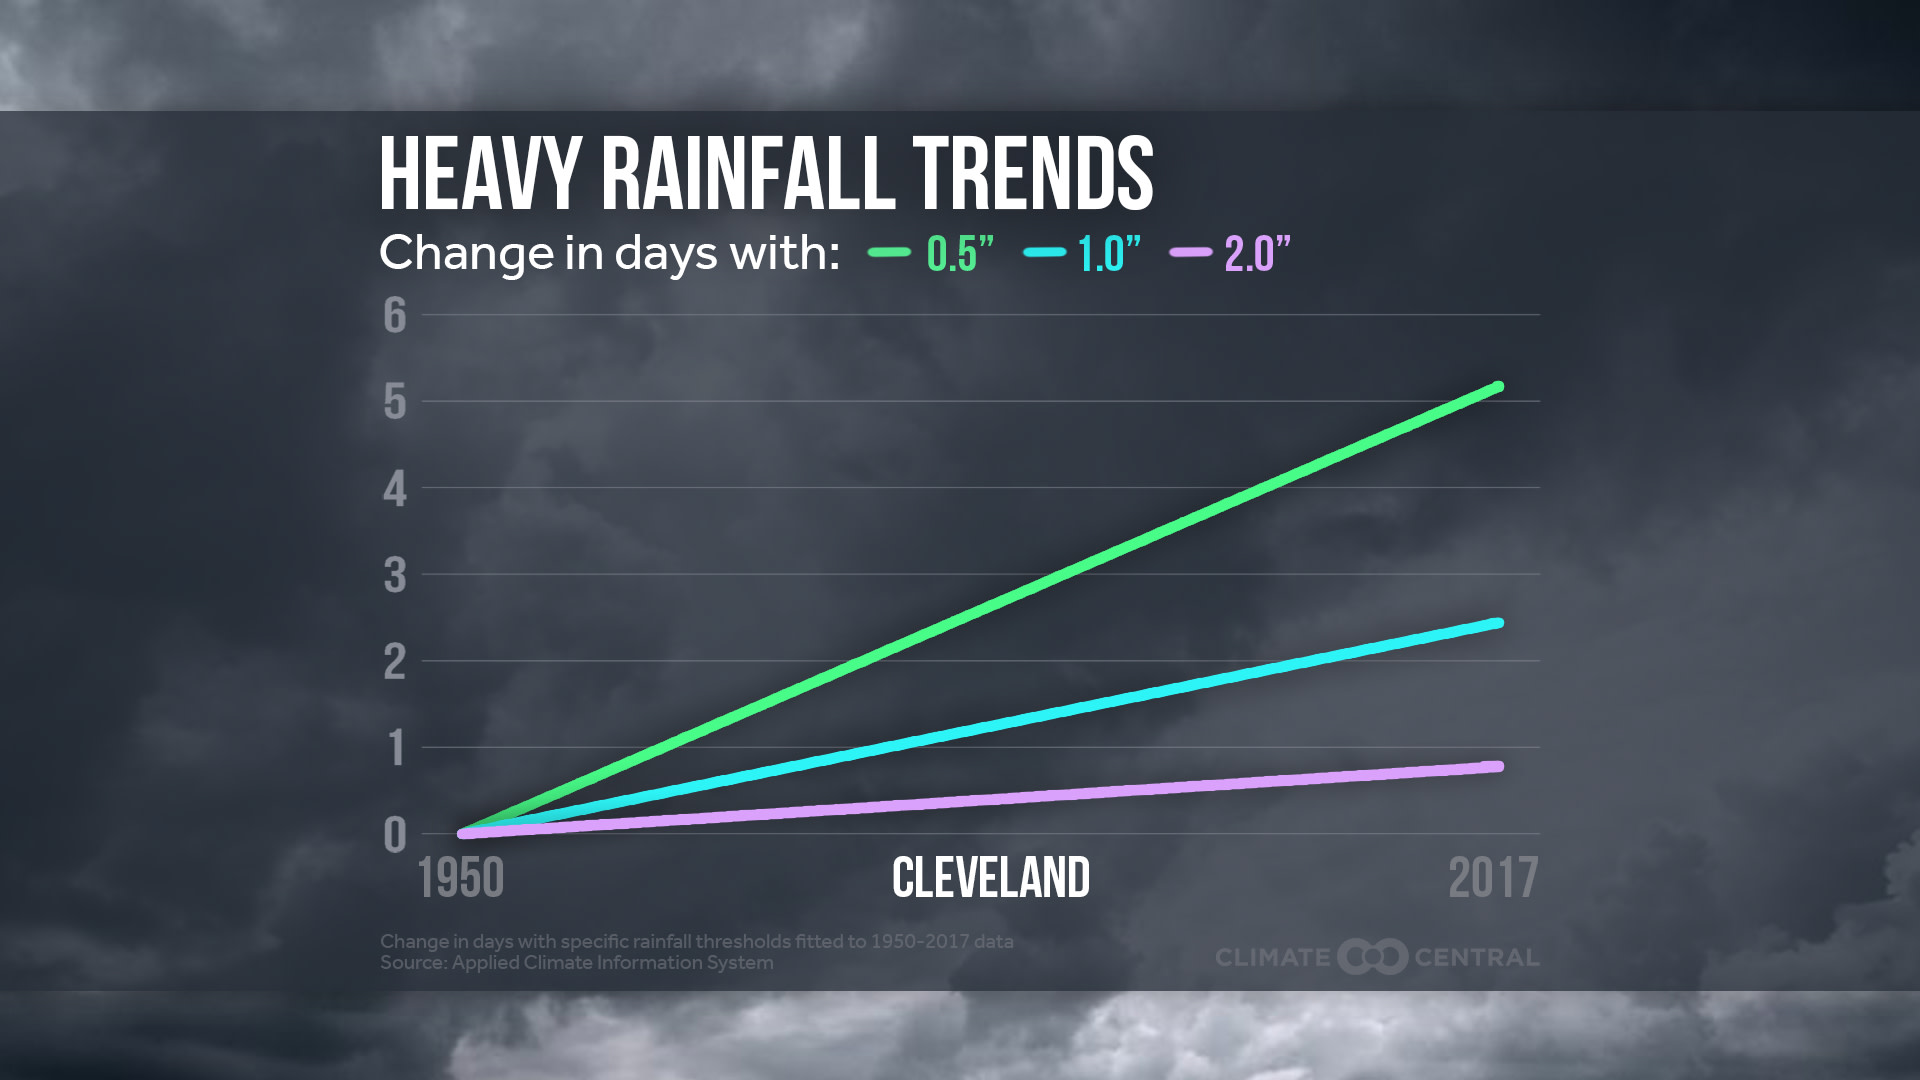
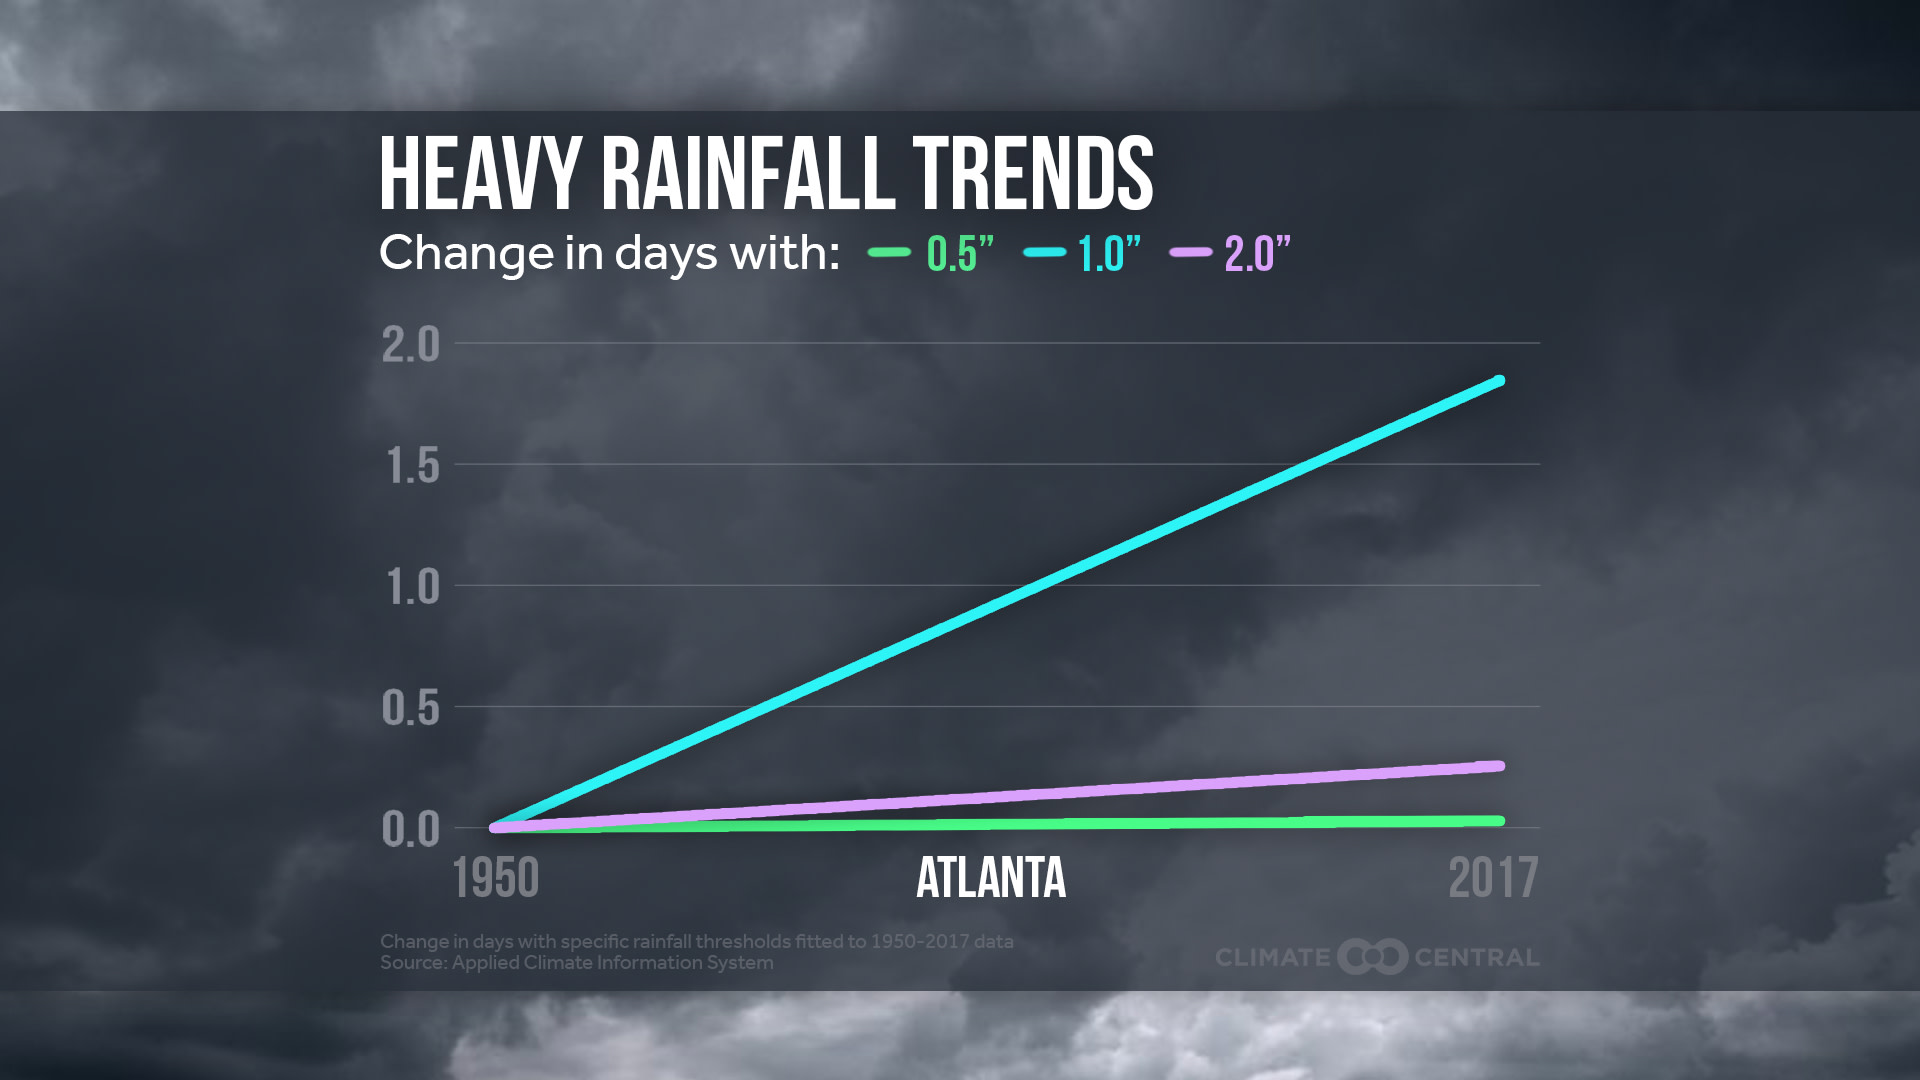
Change in number of days with heavy precipitation in these U.S. cities.
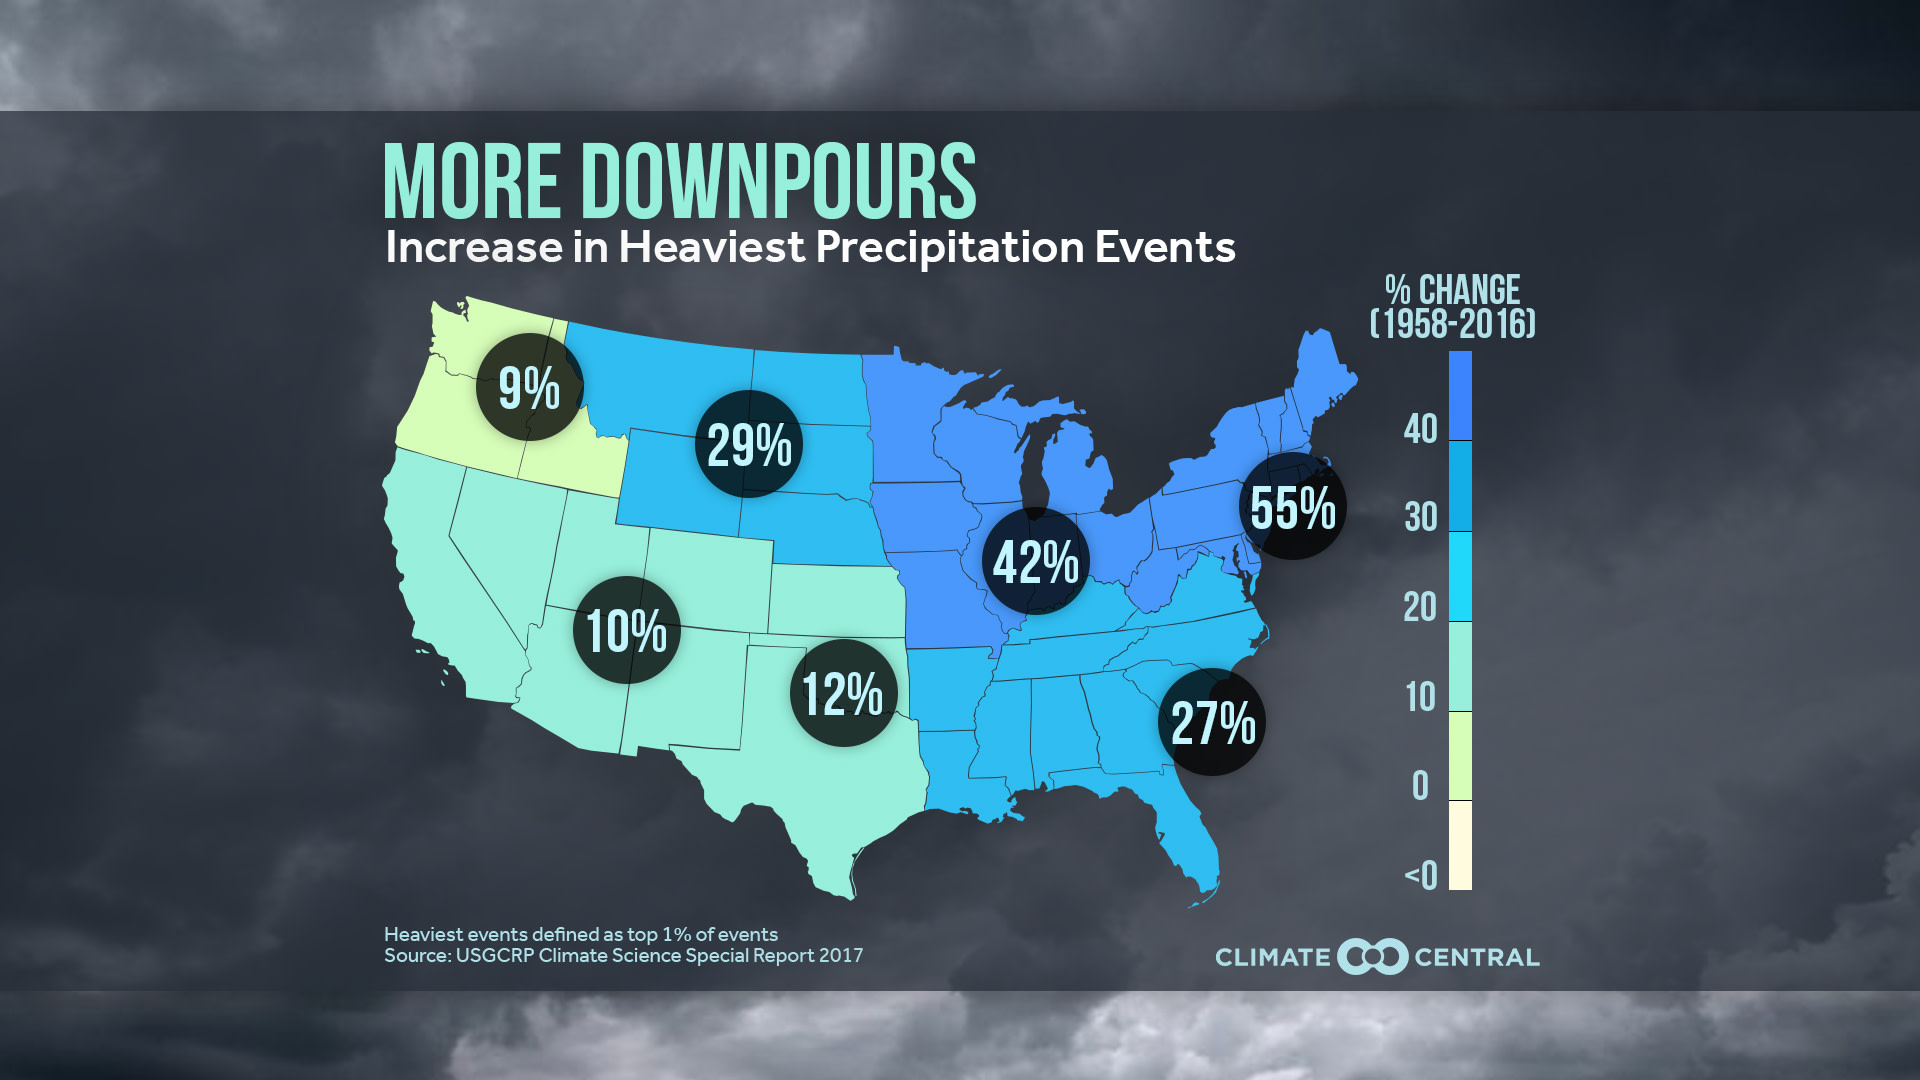
With flooding in parts of the Mississippi Valley and a strong Pacific storm coming into the Northwest, we examined the trend in the number of days each year with heavy precipitation at 244 individual sites in the U.S. This expands our nationwide-averaged heavy precipitation analysis from earlier this year, complementing the 2017 Climate Science Special Report which indicated the heaviest precipitation events are increasing in all regions of the U.S.
As the world warms from the increase of greenhouse gases in our atmosphere, there is more evaporation from oceans, lakes, rivers, and even transpiring plants. For every 1°F of warming, the saturation level of the atmosphere increases by about four percent. This means more water is available to condense into precipitation, and it can come down in heavier downpours.
Heavier rain means more flooding — both flash flooding and larger river flooding. This can lead to more property damage, and in the long term, historical flooding maps may need to be redrawn to address this risk, affecting property values and insurance rates. Excluding tropical cyclones, individual billion-dollar flooding events in the U.S. have added up to $39 billion in losses since 2010. Including tropical cyclone damage estimates (which also factor in storm surge and wind damage) makes the total balloon to over $400 billion since that time.
More and more, scientists can attribute the role of climate change in individual extreme rainfall events. Analyses from the World Weather Attribution project indicated that the rain from from Hurricane Harvey over parts of Texas and Louisiana was about three times more likely and 15 percent more intense from human-caused climate change and found that the rain in the Louisiana deluge of August 2016 was about 10 percent heavier.
Methodology: For each location, we examined the number of calendar days each year that had more than 0.25, 0.50, 1, and 2 inches of rain (or liquid equivalent) from 1950 to 2017. For arid climates, we displayed the trends in those lower three thresholds. Locations that did not average one 2”+ rain event every two years were defined as arid. Trends in 0.50, 1, and 2 inches were displayed for moderate and wetter climates. For clarity, we have omitted the scatter plots for each year and displayed only the linear trend. Precipitation amounts are highly variable, so not all markets have positive trends in all thresholds. Please contact us if you would like to see the full data set.