The best airlines in the US for 2023


As the busy summer travel season approaches, Americans are finalizing their trip details. For many, that starts with choosing an airline. There are several factors that can influence this decision — cost, availability, reliability and frequent flyer perks, to name a few.
But is there a single best airline?
Well, every year at The Points Guy, we attempt to answer that question by compiling objective data across a wide variety of metrics for the biggest U.S. airlines. The end goal is to identify the carriers that are flying higher than the rest when it comes to meeting the needs of consumers.
Today, we're out with this year's analysis — and a familiar tailfin takes the top spot.
Here's a look at 2023's list of the best U.S. airlines.
Best US airlines of 2023
1. Delta Air Lines.
2. United Airlines.
3. Alaska Airlines.
4. American Airlines.
5. Southwest Airlines.
6. Hawaiian Airlines.
7. JetBlue Airways.
8. Spirit Airlines.
9. Allegiant Air.
10. Frontier Airlines.
Keep reading for a full analysis of this year's data that landed Delta in the top spot for the fifth year in a row.
Overall rankings and key takeaways
Let's start with a quick breakdown of the overall scores for this year, including each airline's highest- and lowest-performing categories. We'll also note where each one fell last year (in parentheses).
| Airline (2022 rank) | Total score (out of 100)* | Top-performing areas | Lowest-performing areas |
|---|---|---|---|
| 1. Delta (1) | 66.31 | Timeliness, involuntary bumps. | Affordability. |
| 2. United (3) | 62.47 | Family travel, route network, frequent flyer program. | Baggage, affordability. |
| 3. Alaska (5) | 60.54 | Lounges, customer satisfaction. | Baggage. |
| 4. American (4) | 59.83 | Route network, award availability. | Baggage, affordability. |
| 5. Southwest (2) | 56.29 | Bag/change fees, award availability. | Cancellations, lounges. |
| 6. Hawaiian (6) | 54.71 | Cancellations, involuntary bumps. | Route network. |
| 7. JetBlue (7) | 47.68 | Cabin features. | Timeliness, cancellations, wheelchairs/scooters. |
| 8. Spirit (10) | 38.99 | Affordability. | Wheelchairs/scooters, route network. |
| 9. Allegiant (9) | 37.04 | Involuntary bumps, baggage, wheelchairs/scooters. | Timeliness, cabin features, family. |
| 10. Frontier (8) | 27.74 | Affordability. | Involuntary bumps, customer satisfaction, bag/change fees, award availability. |
* All data was based on the 12-month period from Jan. 1, 2022, through Dec. 31, 2022.

Here are some overall takeaways from this year's analysis.
- Delta retained its title for the fifth straight year: Once again, the Atlanta-based carrier performed solidly across multiple categories — only taking low marks for its affordability (or lack thereof).
- Southwest's holiday meltdown took a toll: The carrier's operational performance caused it to drop from second last year to fifth this year. Across just four criteria that would've been impacted by those issues — timeliness, cancellations, baggage handling and customer satisfaction — Southwest scored a combined 4.63 points lower than last year. If you erase that drop, it would've retained the second spot.
- Alaska and Spirit both jumped multiple spots: Alaska improved its affordability (in both airfare and ancillary fees), while Spirit saw notable improvements in customer satisfaction.
- Most airlines scored lower than last year: Spirit (+8.1) and Alaska (+2.57 points) were joined by United (+1.93) and American (+1.34) as the only airlines scoring higher than last year. The other six all had lower scores, including Delta, which dropped by more than four points.
- As a whole, airlines did a worse job in 2022 than 2021: Many elements show overall drops in performance when you combine data across all 10 airlines. Customer complaints were up 87.6% year over year, while prices per 1,000 passenger miles rose 22.67%. Meanwhile, the data showed increases in involuntary bumps (up 87.45%), cancellations (up 54%) and mishandled bags (up 25%) — all of which demonstrate the ongoing struggle to meet the high demand for air travel.
There's a lot more to unpack here, so let's take a closer look at each broad category we used to rate the airlines (the full methodology is provided at the end of the report).
Best US airlines for reliability
There are many things that can make your air travel more comfortable — from lounge access to first-class upgrades. But ultimately, the most important function of an airline is to get you where you want (or need) to be with minimal issues.
That's why operational reliability plays a large role in our analysis each year, making up 30% of our total analysis. In our ratings, we considered the following five factors:
- Timeliness: How frequently a flight on the airline was delayed.
- Cancellations: How frequently a flight on the airline was canceled.
- Bumps/involuntarily denied boardings: How frequently an airline bumped a traveler against their will on an oversold flight.
- Baggage: How frequently an airline mishandled a piece of checked luggage.
- Wheelchairs/scooters: How frequently an airline mishandled a mobility device.
For the third year in a row, Hawaiian Airlines scored the top spot as the most reliable U.S. carrier across these metrics. It had the lowest cancellation rate (fewer than 1% of its scheduled flights were canceled) and bumped just four passengers out of the nearly 10 million people it carried in 2022.
Delta was a close second here, as it earned the top score for timeliness (with nearly 84% of its flights arriving on time) and bumped just two flyers out of almost 161 million Delta passengers.
But for the second year in a row, Allegiant put up numbers that tell two very different tales of reliability.
For starters, the carrier batted a perfect 1.000 in the involuntary bumps category, as zero of the 16.8 million Allegiant flyers were bumped from their flights in 2022. It also mishandled the fewest bags (just 1.55 per 1,000 checked) and the fewest mobility devices (0.39 per 100).
However, it was abysmal with on-time arrivals, as fewer than two-thirds of its departures arrived within 15 minutes of the scheduled arrival time. Allegiant also canceled 3.52% of its scheduled flights — beating only JetBlue, which canceled 3.74%.
Meanwhile, the worst carrier for checked baggage was once again American Airlines, which misplaced bags at a rate of 1 out of every 114 it accepted. In other words, you were more than five-and-a-half times more likely to deal with lost or delayed bags on American than Allegiant.
Spirit was last in handling mobility devices, misplacing roughly 1 out of every 17 it accepted (a rate nearly 15 times worse than Allegiant).
Finally, Frontier once again brought up the rear in terms of involuntary bumps. The carrier reported that a total of over 6,000 passengers were involuntarily denied boarding, which translates to more than 16 every day and an average of roughly 1 out of every 3,752 travelers. This was more than two-and-a-half times the airline's 2022 figures.
Best US airlines for the travel experience

Beyond wanting an airline that is generally reliable, travelers are often drawn to carriers that provide a comfortable experience on board. Whether it's more legroom, family-friendly perks or inflight Wi-Fi, airlines try to ensure that the actual act of flying is enjoyable enough that travelers want to return.
The travel experience category made up 25% of our analysis across these four factors:
- Cabin features: What you'll experience on board, including Wi-Fi, seat pitch/width and inflight entertainment.
- Lounges: How widespread (and numerous) an airline's lounges are, and how affordable it is to access them.
- Family: How well an airline caters to families traveling with children.
- Customer satisfaction: How frequently customers complain to the U.S. Department of Transportation about the carrier.
Once again, JetBlue was the top airline for cabin features, with complimentary Wi-Fi across its entire fleet plus seatback TVs and the largest economy seats in the U.S.
Meanwhile, Alaska scored top marks for lounge access (members not only enjoy the nine Alaska Lounge locations but 40-plus American Airlines Admirals Clubs and even three United Clubs) and customer satisfaction, with just 2.54 complaints per every 100,000 passengers.
On the other end of the spectrum, Allegiant was at the bottom of the list for cabin features, with minimal amenities and the narrowest seats among the 10 carriers.
The airline with the highest rate of complaints was Frontier, with 22.6 per every 100,000 travelers in 2022. That's more than twice the numbers for the second-to-last carrier in this category (Spirit) and almost nine times higher than Alaska's.
There's one final note on customer satisfaction: As a whole, U.S. airlines saw a notable increase in complaints compared to 2021. This statistic rose from 3.14 complaints per 100,000 passengers to 5.89 per 100,000. That's a jump of 87.6% year over year.
Best US airlines for cost and reach
There are other major factors that go into selecting an airline. Does it get you where you want (or need) to go, and how much does it charge you for that service?
Our "cost and reach" category attempts to answer these questions by looking at the prices you pay — both in airfare and common ancillary fees — along with how widespread a given airline's route network is across the U.S. This makes up 20% of our analysis, and it covers these elements:
- Route network: How many domestic airports an airline serves.
- Affordability: How far (in distance) you can fly for the money you're paying, based on financial data from the Bureau of Transportation Statistics.
- Ancillary fees: How much a typical passenger pays in bag and change/cancellation fees.
Not surprisingly, the large legacy carriers excelled in their respective route networks. Based on monthly reports to the D.O.T., United, American and Delta served the highest number of destinations during the year — an average of 235, 228 and 210, respectively.
On the other side of the coin was (yet again) Hawaiian, with an average of fewer than 22 airports served.
That said, the major U.S. airlines were the least affordable out there, with Delta coming in last followed by American in ninth and United in eighth. This opened the door for the low-cost carriers on the list — and this is where they hit it out of the park.
Spirit Airlines was once again the most affordable U.S. airline, taking in just $126.15 for every 1,000 miles flown per passenger. Frontier was just behind, at $131.24, and Allegiant was third at $150.32.
However, the most fascinating aspect of the affordability numbers is the year-over-year change. It's not just you; flight prices are more expensive than the previous year.
In fact, every one of the 10 airlines we analyzed saw increases in costs for every 1,000 passenger miles. Allegiant was the lowest (at 7.06%), but American, Frontier, Southwest and Spirit all saw this number climb by more than 25% in 2022 compared to 2021. The average increase was $44.05 (or 22.67%).
Finally, the ancillary fee category saw Southwest assume a familiar spot at the top of the heap, as it allows each passenger two free checked bags and imposes no change or cancellation fees. When you factor in excess baggage fees, Southwest charged an average of just 43 cents per passenger. Meanwhile, the low-cost carriers added a ton here — $26.35 per passenger on Allegiant, $28.99 per passenger on Spirit and a whopping $43.81 per passenger on Frontier.
Best US airlines for loyalty

The final category of our report (which made up 25% of the analysis) is loyalty — a topic near and dear to TPG's editorial team. To rate the 10 airlines in this category, we considered two specific factors:
- Frequent flyer program: How rewarding an airline's loyalty program is, including TPG's valuations, elite status, cobranded credit cards, partner airlines and expiration policies.
- Award availability: How easy and valuable it is to redeem your rewards across popular travel times.
United once again excelled in rewarding frequent flyers, boasting the widest number of partner airlines (including a new tie-up with Emirates) along with four different consumer credit cards. Delta was a close second here and just edged out American, which is in a shrinking minority of loyalty programs that allow miles to expire (excluding those under the age of 21).
However, American scored tops in award availability, as the vast majority of the dates we searched saw high redemption values.
Meanwhile, loyalty was a category where the low-cost carriers fell short, with few partners, punitive expiration policies and limited award availability. Frontier brought up the rear, followed by Allegiant, Hawaiian and Spirit.
Methodology
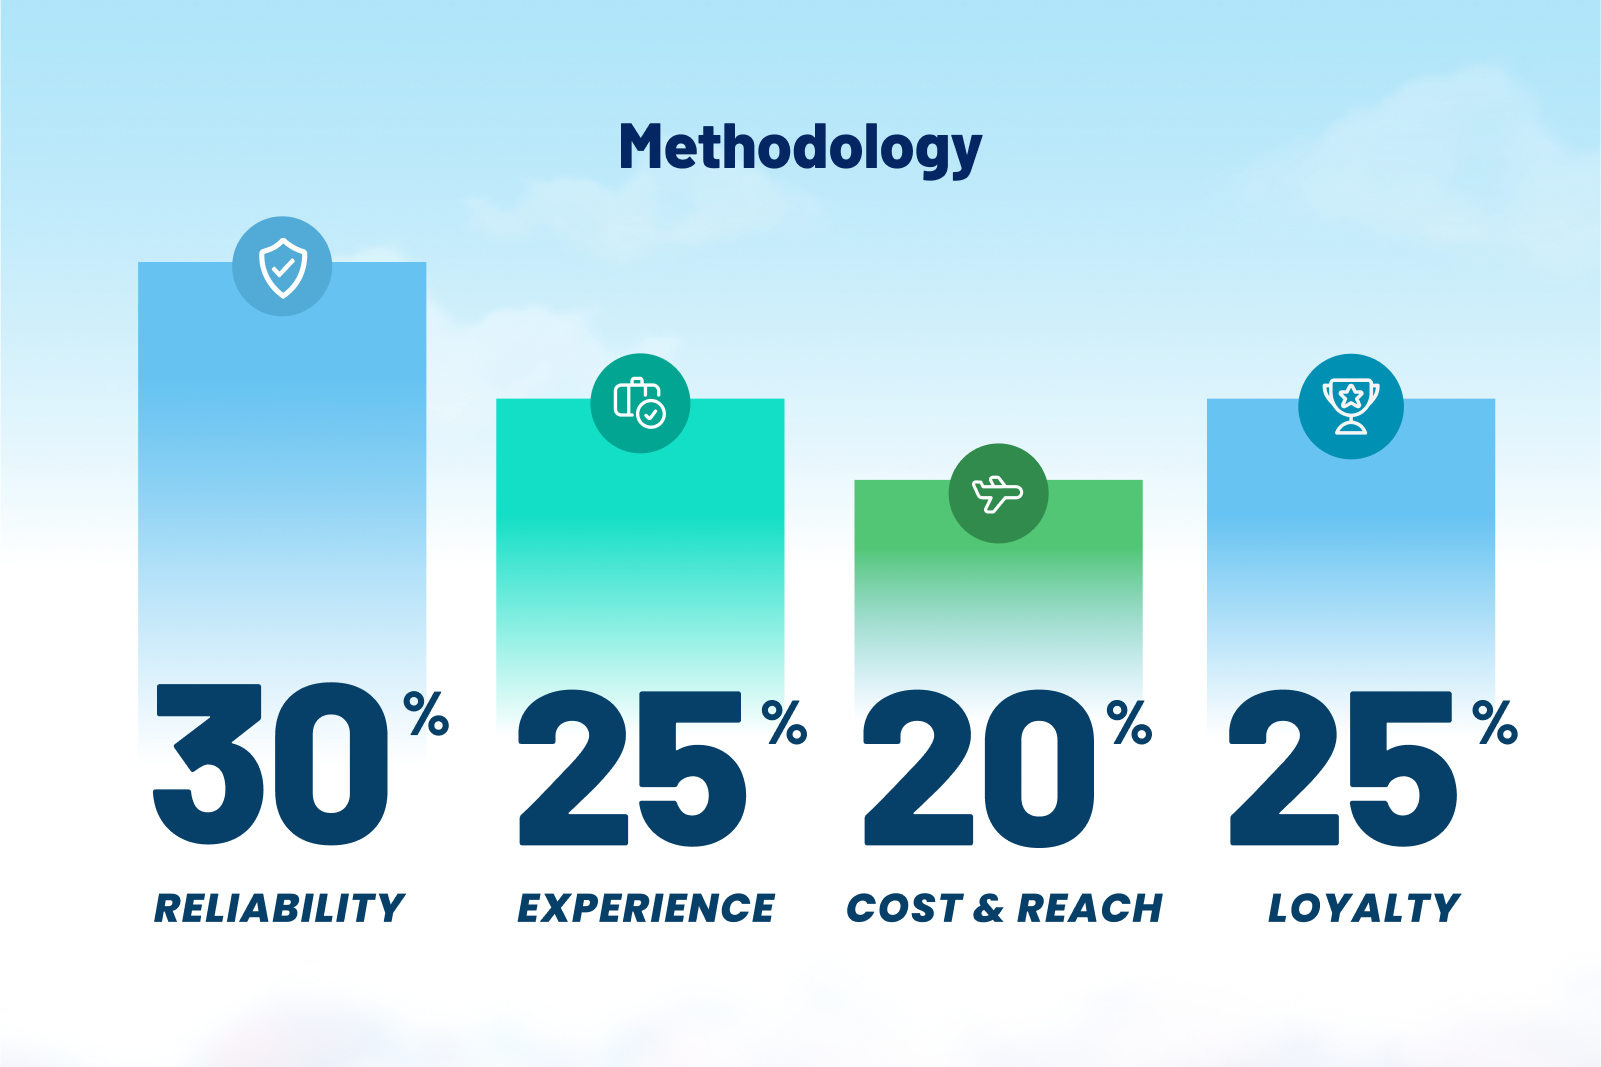
As noted above, there were four broad sections in this analysis, each of which consisted of multiple criteria. All data points were based on flights operated during the 12-month period that ran from Jan. 1, 2022, through Dec. 31, 2022.
Here's a full breakdown of the methodology and the data used for each:
Reliability (30%)
- Timeliness (using data on delayed flights from the D.O.T.).
- Cancellations (using data on canceled flights from the D.O.T.).
- Involuntary bumps (using data on involuntary denied boardings from the D.O.T.).
- Baggage (using data on mishandled baggage from the D.O.T.).
- Wheelchairs/scooters (using data on mishandled baggage from the D.O.T.).
Experience (25%)
- Cabin features (using data from SeatGuru and inflight amenity offerings from each carrier's website).
- Lounges (using data on the number of lounges, number of cities and price of membership for each applicable lounge network).
- Family (using a 0-to-5 score based on boarding, perks and food/entertainment available on board).
- Customer satisfaction (using data on customer complaints from the DOT).
Costs and reach (20%)
- Route network (using the monthly average of domestic cities served by each airline from the DOT).
- Affordability (using financial data from the BTS).
- Bag/change fees (using financial data from the BTS).
Loyalty (25%)
- Frequent flyer (using data from our monthly valuations, elite status reports and each carrier's website).
- Award availability (using real-time award inventory for popular domestic routes across three distinct time periods).
For all criteria, the raw scores from the data were converted into scaled scores from zero to 10. In most cases, a score of zero was assigned to the lowest-performing carrier, and where possible, a score of 10 was assigned to a "perfect" airline — for example, Allegiant and Delta both scored a 10 on involuntary bumps since they had zero (or effectively zero) last year.
However, when there was no clear way to determine perfection, a 10 was given to the highest-performing airline.
By using scaled scores (rather than a simple ranking system), we essentially "graded" each airline relative to the others. The score for each airline on each individual element was thus a numerical reflection of how much better said airline did compared to the lowest-scoring carrier.
As an example, Alaska just edged out Delta in the lowest number of D.O.T. complaints (2.54 per 100,00 passengers versus 2.87). We normalized these numbers by comparing them to the lowest-performing airline (Frontier, with 22.6 per 100,000) and the highest possible score (0 per 100,000), and the resulting scaled score conversion gave Alaska a "grade" of 8.88 out of 10 and Delta an 8.73 out of 10.
Then, each individual score was weighted using the above percentages to arrive at the final, cumulative score included in the table.
Final thoughts
There's a lot that goes into selecting an airline for your next trip — price, reliability, elite status and what you'll experience on the flight itself. While there's no carrier that will meet the needs of every traveler out there, our annual report uses objective data to identify the company that's best meeting the needs of customers.
For the fifth straight year, Delta Air Lines has earned the title of TPG's best U.S. airline.
However, it's worth noting that Delta's overall score dropped by nearly 6% over last year, and its three closest rivals (Alaska, American and United) all scored higher this year. Only time will tell if this was an aberration or if Delta's reign at the top is at risk of coming to an end.
Additional data collection and reporting by Kyle Olsen, Ryan Wilcox and Summer Hull.