
The big news from the U.S. Census Bureau’s May new home sales report is that sales inventory has increased to 5.1 months, which brings the three-month average to 4.63 months. That begins to change the equation for some homebuilders, who were absolutely thriving in an ultra-low-inventory housing market environment.
As a reminder, when the three-month average for inventory is 4.3 months or lower, builders have the confidence to continue to build. When inventory is between 4.4 and 6.4 months, builders need to see sales growth to continue to build. When inventory is 6.5 months or above, builders will exercise caution and even halt new projects.
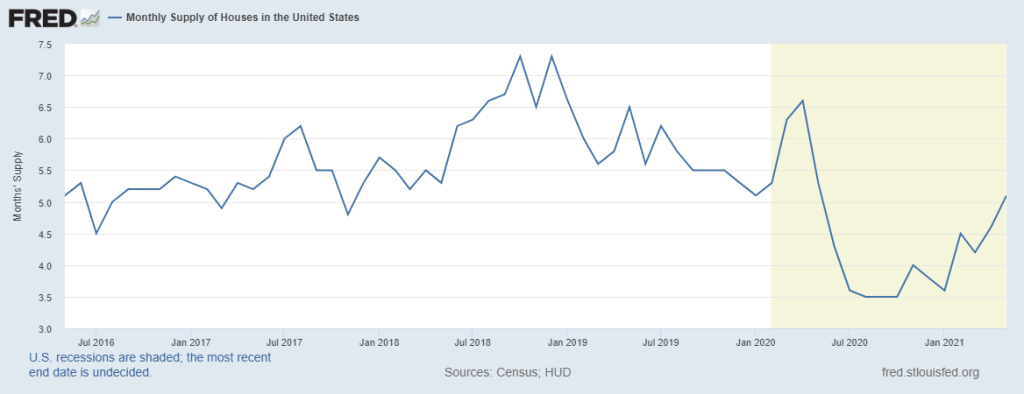
Census: For Sale Inventory and Months’ Supply, The seasonally‐adjusted estimate of new houses for sale at the end of May was 330,000. This represents a supply of 5.1 months at the current sales rate.
The headline monthly supply of 5.1 months is what we saw during decent housing market demand in the previous cycle. So although inventory has increased, it is not at a level of concern. Mother Economics is a serial killer who wants to get caught. She leaves plenty of evidence for those who are interested in discovering her next moves. Tracking the data over many years will show you the way.
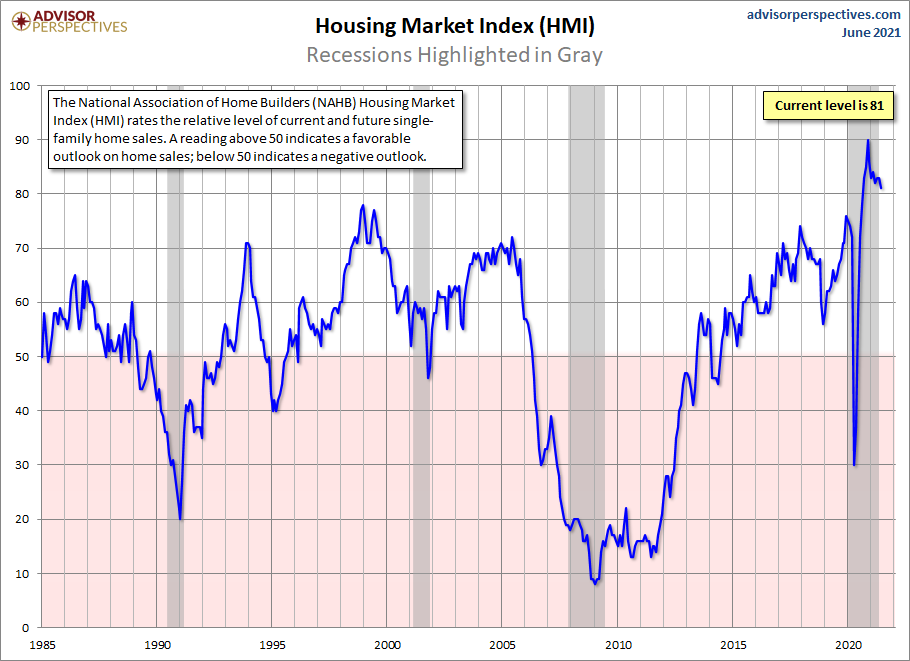
The builder’s confidence index tends to correlate with inventory. Historically speaking, the current level of builder confidence is relatively high. The index shows a parabolic move in 2020 from the lows of the COVID-19 crisis, and has since moderated. Because this index tracks confidence, a somewhat subjective measure, it doesn’t make sense to look at the total levels and compare them to other cycles. The direction of the trend is more valuable than any number. For example, the index may approach 70, which is a respectable number, but when we consider that it peaked near 90, the drop tells what the builder is thinking.
We all know the cost of materials, land, and labor is rising and that builders deal with supply restraints. Robert Dietz, the chief economist of National Association of Home Builders, tweeted this on Wednesday.
The builders only build homes if they know they can sell them; they are focused on the bottom line. Homebuilders increased their profit margins when lumber prices were rising because they could. The inventory shortage in the existing home sales market gave the builders some extra demand to keep profit margins in place even when costs were escalating. Interest rates are a different matter. The new home sales market is much more sensitive to higher mortgage rates than the existing home sales market.
For now, mortgage rates are not an issue for the new home sales market. As bullish as I have been on the American comeback, I couldn’t forecast a 10-year yield over 1.94% for 2021. That is the level where I start to keep a closer watch on demand in the new home sales market – but I don’t expect to get there in 2021.
Still, total home sales in 2021 looks like it will end at higher than 2020 levels. More Americans are buying homes in 2020/2021 than any period from 2008-2019. We still have many variables to deal with due to the lasting effects of COVID-19 on our economy, but the builders should be able to continue to build homes as long as new home sales can grow each year. For now, the monthly supply data indicates that things are okay for the builders. We will just have to keep watching for the crumbs mother economics leaves behind, showing us her next steps.
The Census also reported that new home sales fell 5.9% since the April report but is 9.2% higher than in May of last year.
New Home Sales: Sales of new single‐family houses in May 2021 were at a seasonally adjusted annual rate of 769,000, according to estimates released jointly today by the U.S. Census Bureau and the Department of Housing and Urban Development. This is 5.9% (±18.6%)* below the revised April rate of 817,000, but is 9.2% (±28.7%)* above the May 2020 estimate of 704,000.
The parabolic moves we saw in housing data following the worst of the COVID-19-crisis were some of the most bizarre actions I’ve seen in my lifetime tracking housing. These crazy spikes in data are the reasons I have stressed that the data will moderate in time.
It’s important to remember that the housing market data broke out in February 2020, just before COVID-19 hit. We were on our way to a terrific year for home sales. New home sales, housing starts, existing home sales, and purchase application data accelerated before COVID-19 hit. That demand, although it was stalled, doesn’t just dry up and blow away. After the pause in sales, we saw a parabolic rebound in the data that we will never see again (unless we have another economic shock that stalls sales during a year in which housing sales are growing). The timing of the COVID-19 crisis wasn’t ideal for the great American housing bears. They were faked into thinking that it would lead to a crash, then all hell broke loose. The bears blindly put their faith in the collapse of America and housing, instead of where it should have been — in a better future.
HousingWire published the AB Economic Model on April 7th, 2020. In that article, I wrote:
“I believe the months of April and May are going to tell an epic story of America’s start in defeating this virus. If we do this right and document the cause and effect of our efforts, future generations will be able to look to this period in time for how to handle a global pandemic.“
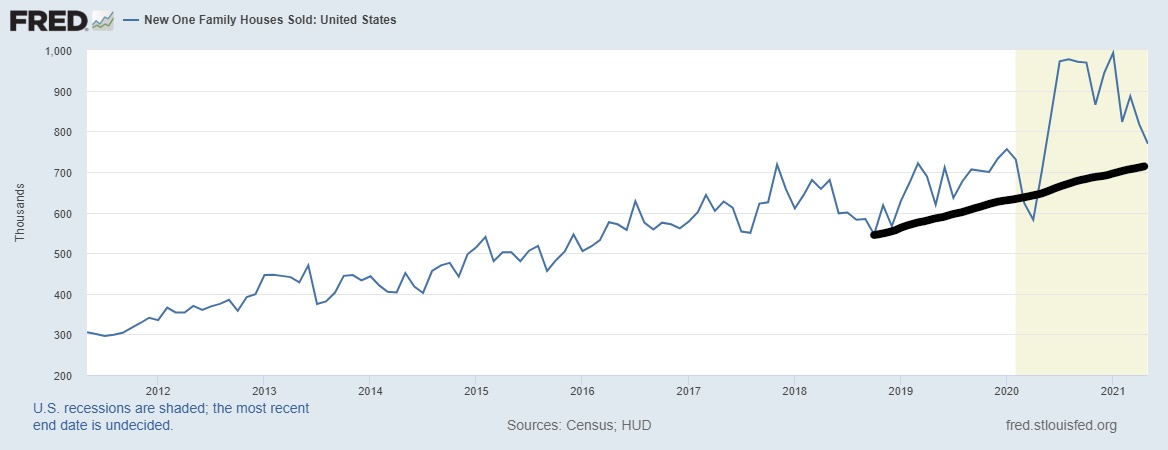
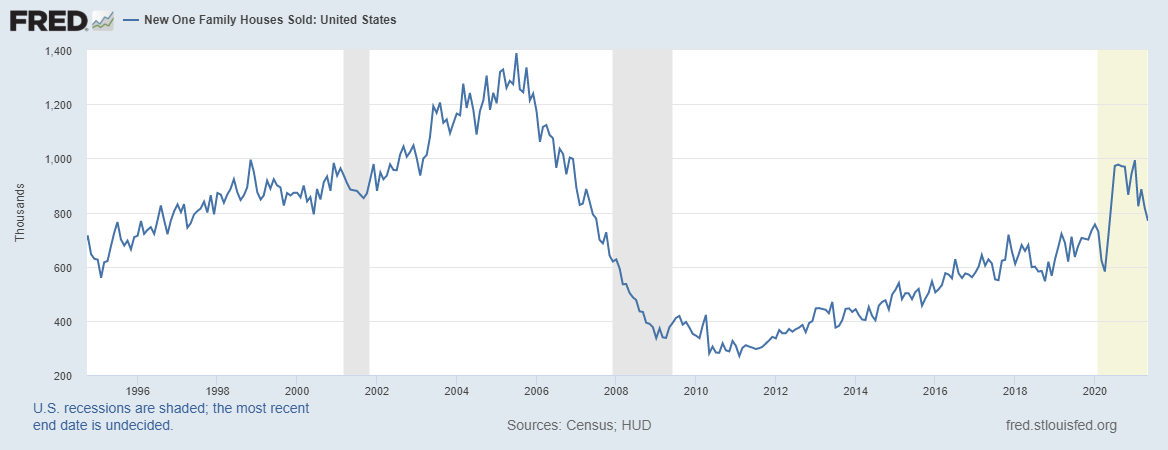
The new home sales chart below shows the initial fall in sales followed by a massive move higher. Sales are now moderating from that peak level.
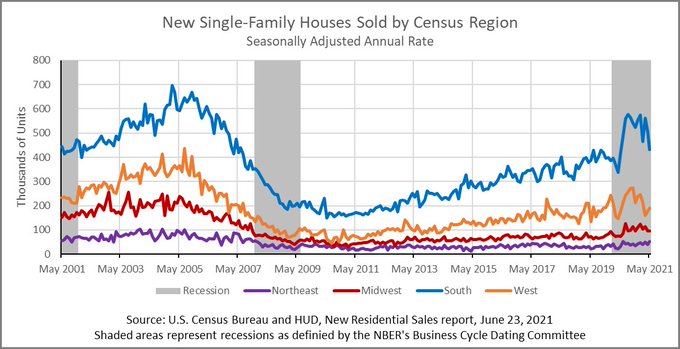
This chart shows a more comprehensive view of new home sales over time. The 2020/2021 data is a lot more wild than what we saw in the previous expansion. Before that expansion, recent home sales fell roughly 82% from the peak in 2005. The expansion after that was not a boom in demand – just slow and steady growth as we went into the Covid-crisis. Now, housing was moderating from that parabolic move last year, but that uptrend in sales is still going.
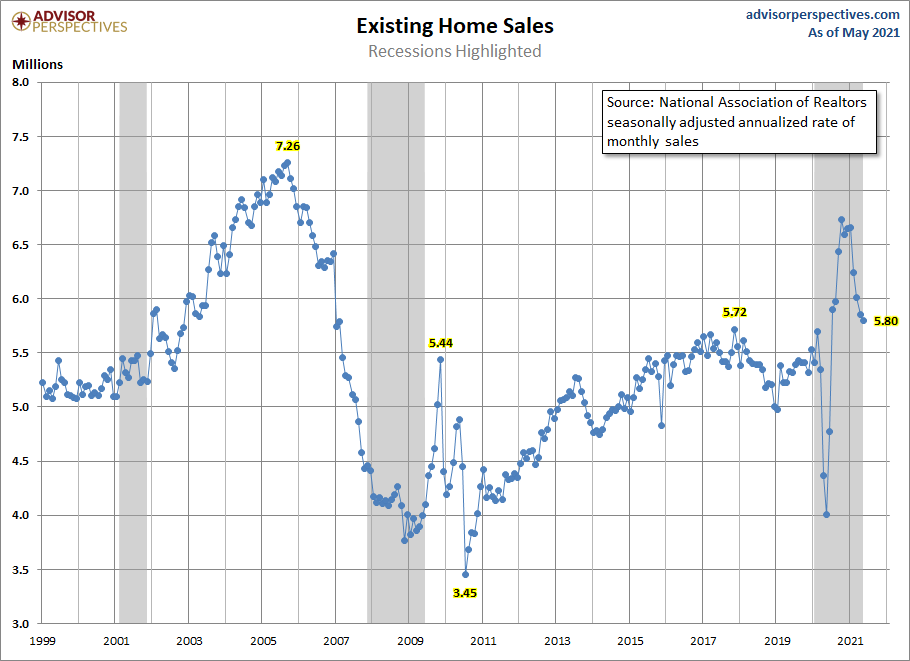
The existing home sales market is showing a similar pattern. This market is a much bigger marketplace than the new home sales market. I talked about this yesterday.
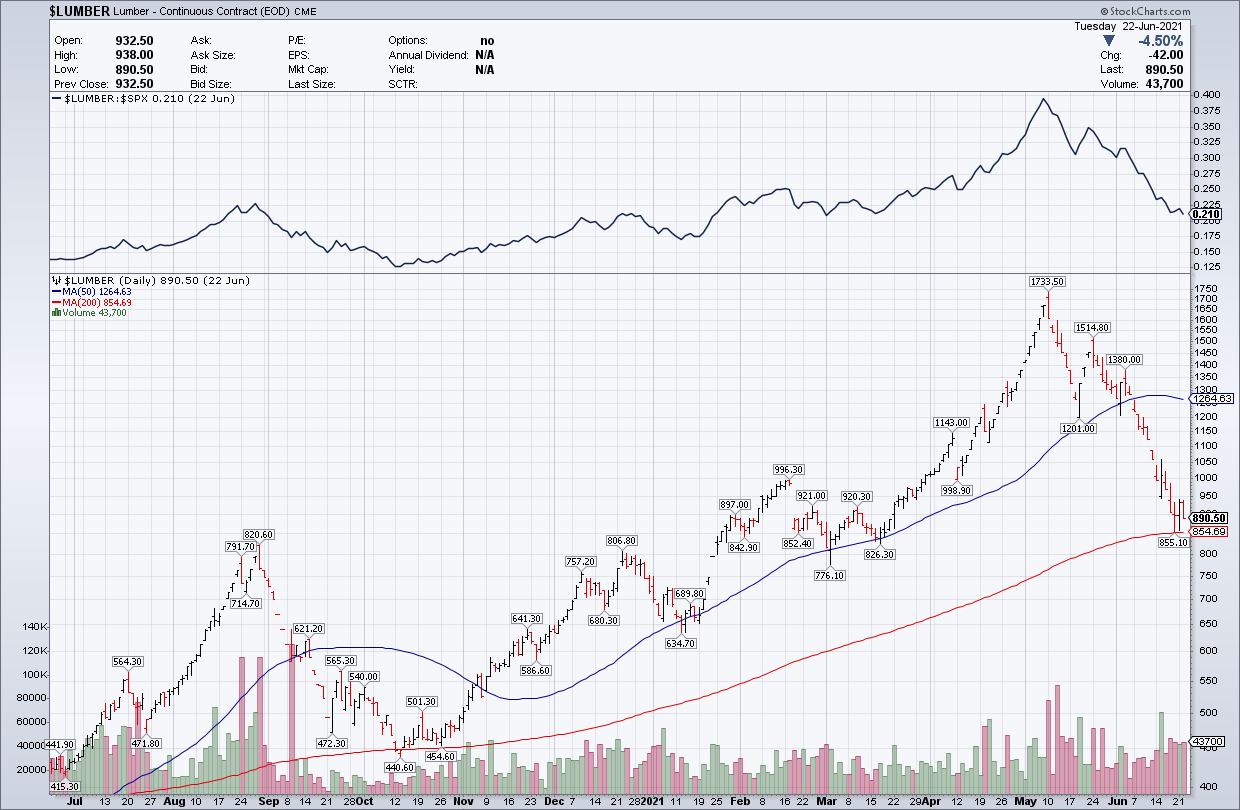
My concern for the new home sales sector is just the overall price inflation that has occurred quickly so the builders could make sure they made as much money as they could with rising costs. Of course, lumber prices have fallen a lot recently, and that is nothing but a positive for the U.S. housing market.
So, for now, not too much is happening in the housing market, but things are just getting more expensive. You can see why I call this the unhealthiest housing market since 2008, yet they are first-world problems. Keep an eye on that monthly supply data, and the crumbs will lead you toward mother economics.