
Welcome to the Shore Stations Program
Long-term monitoring of sea surface temperature and salinity along the California coast
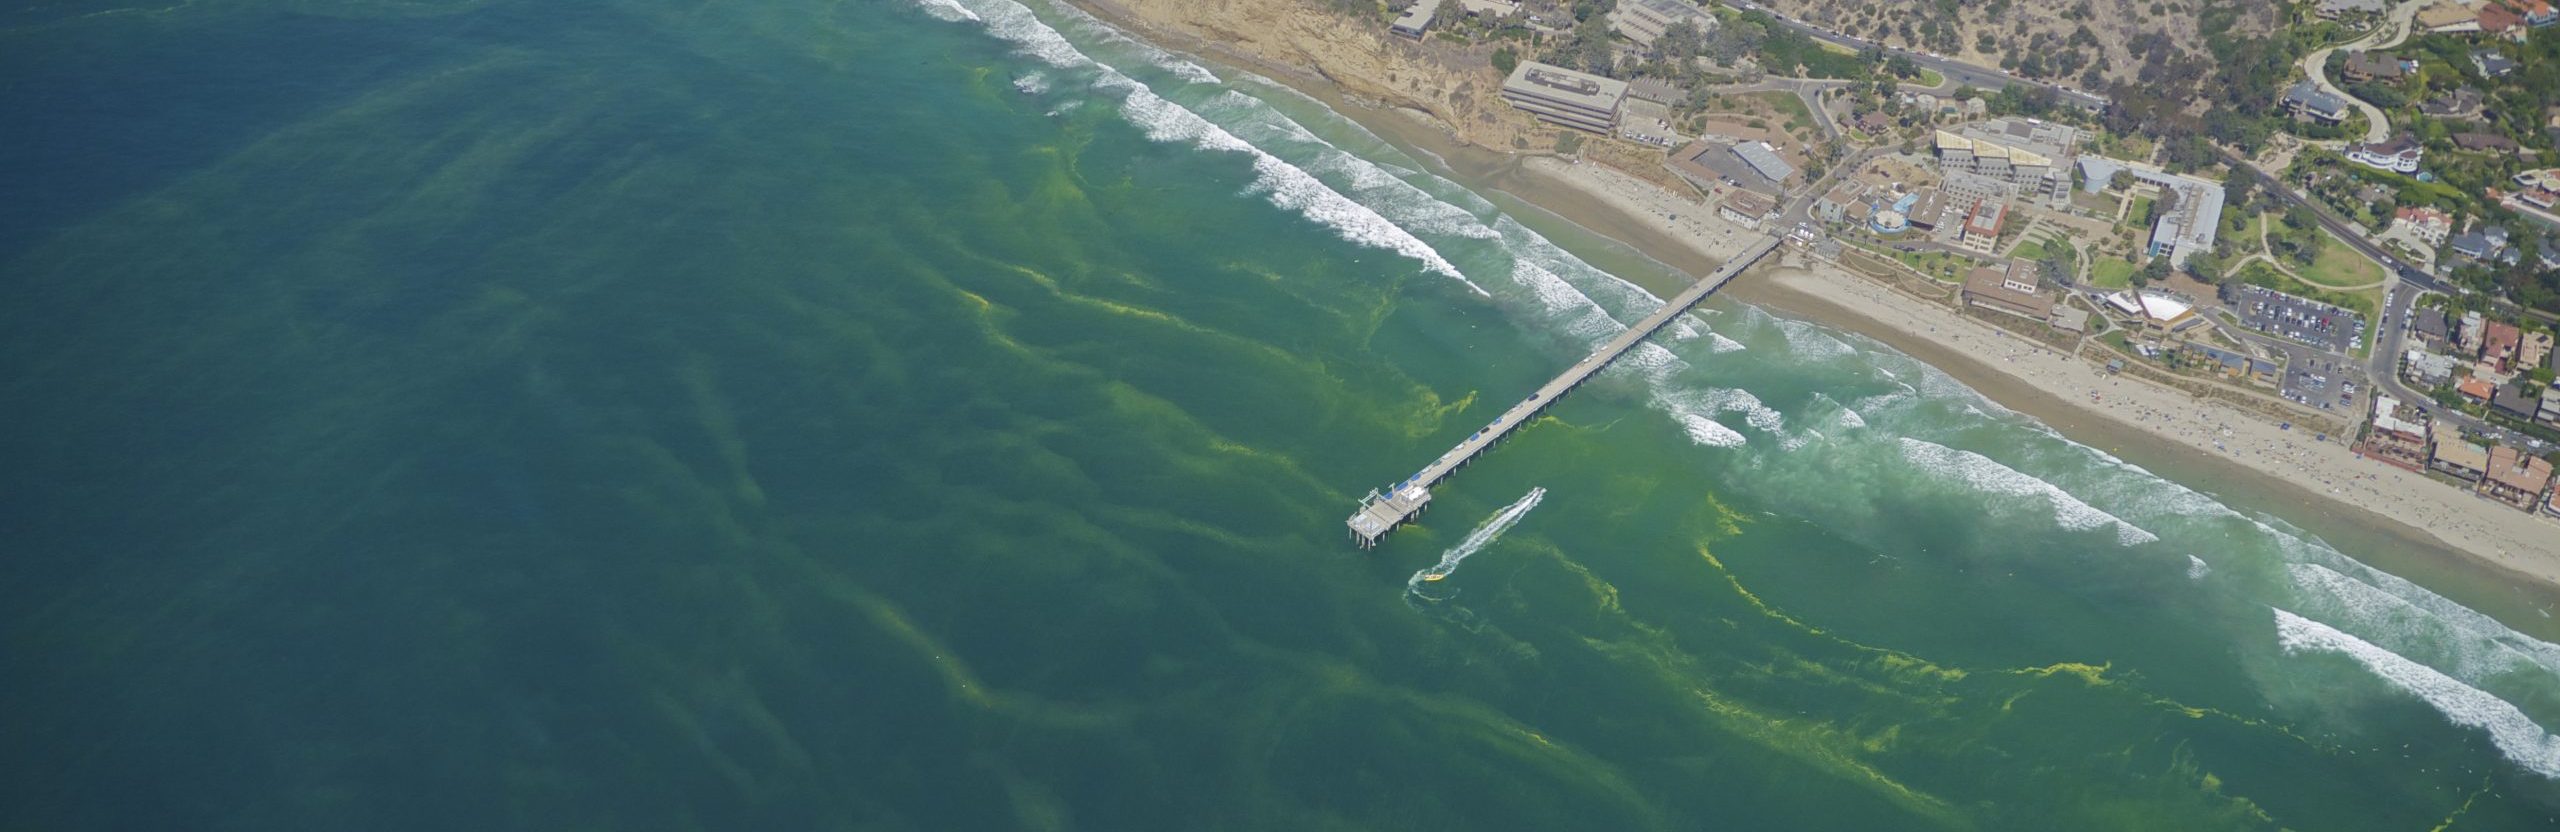
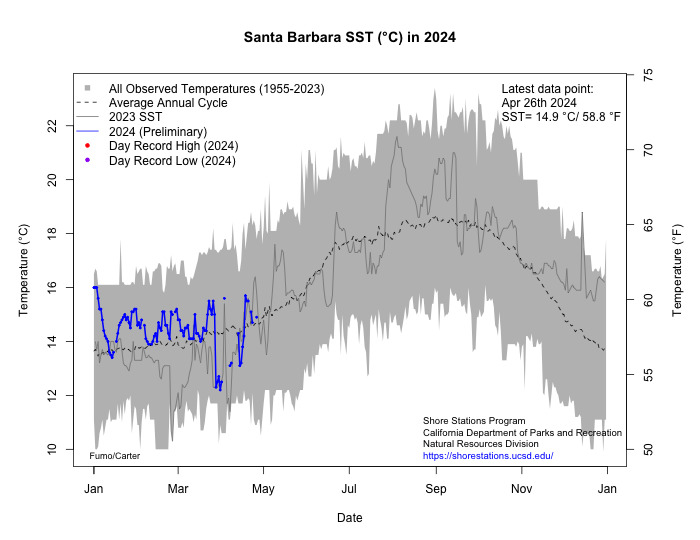
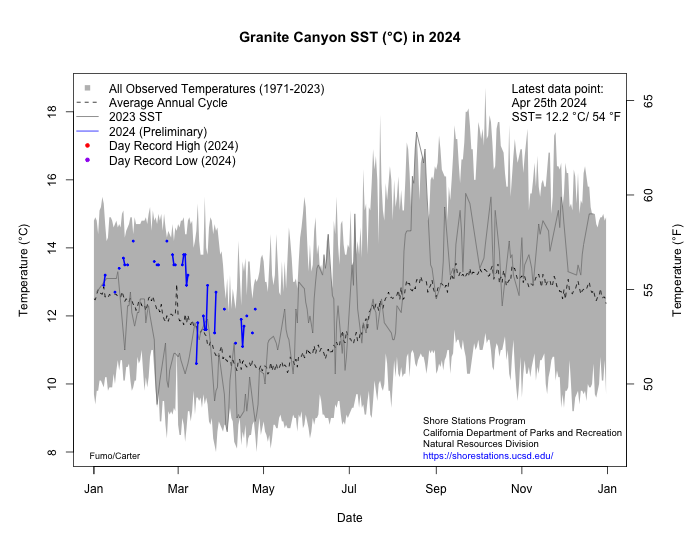
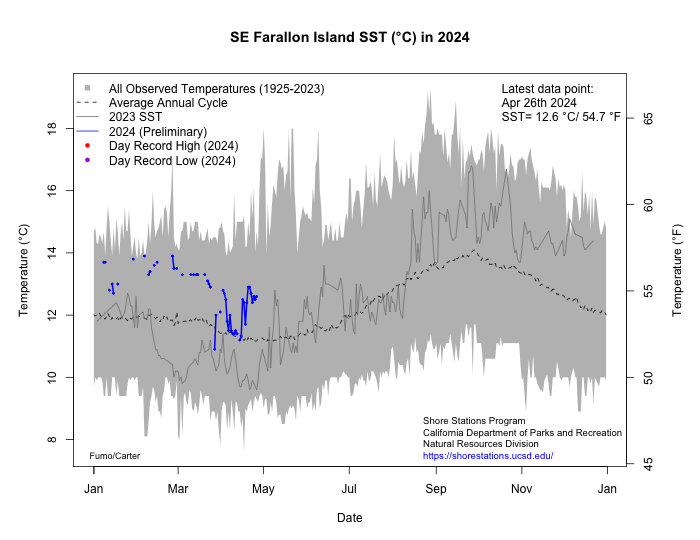
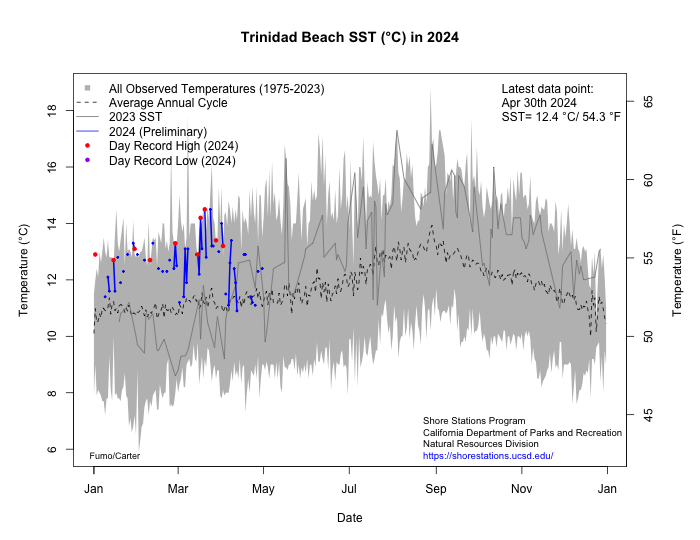
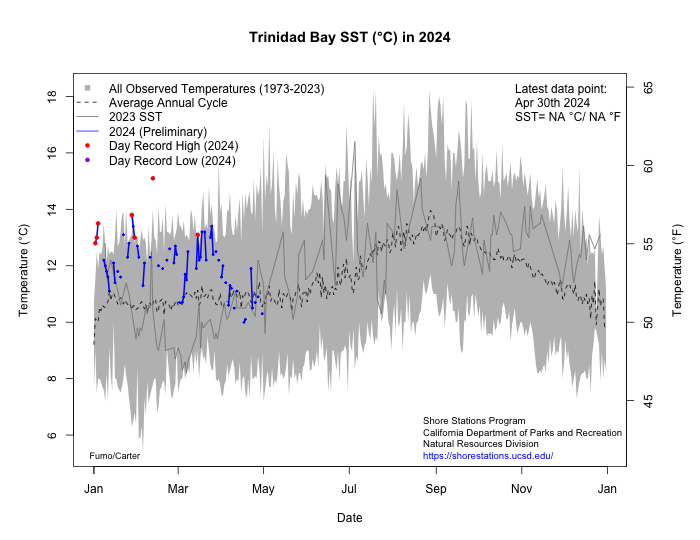
The Shore Stations Program collects and provides access to current and historical daily sea surface temperature (SST) and salinity (SSS) measurements observed at shoreline locations along the west coast of the United States. Currently, there are 10 active stations are located along the California coast, ranging from La Jolla to Trinidad.
Want to know current ocean temperature at these stations?
Click each station name to view current temperature and put it into context with long-term data:
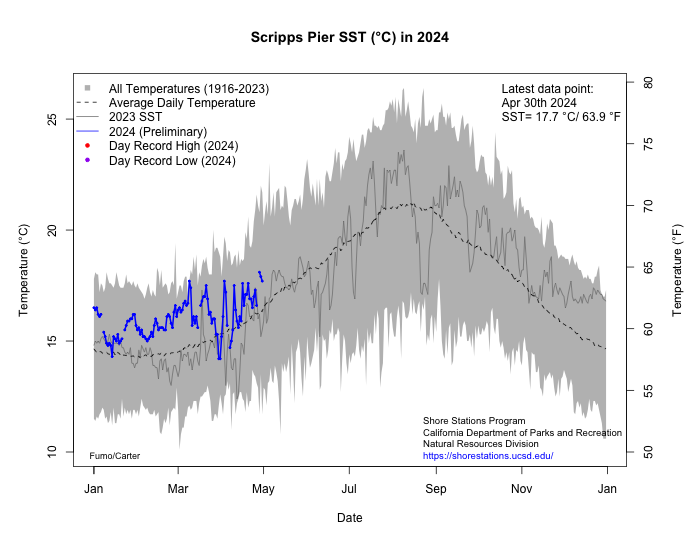


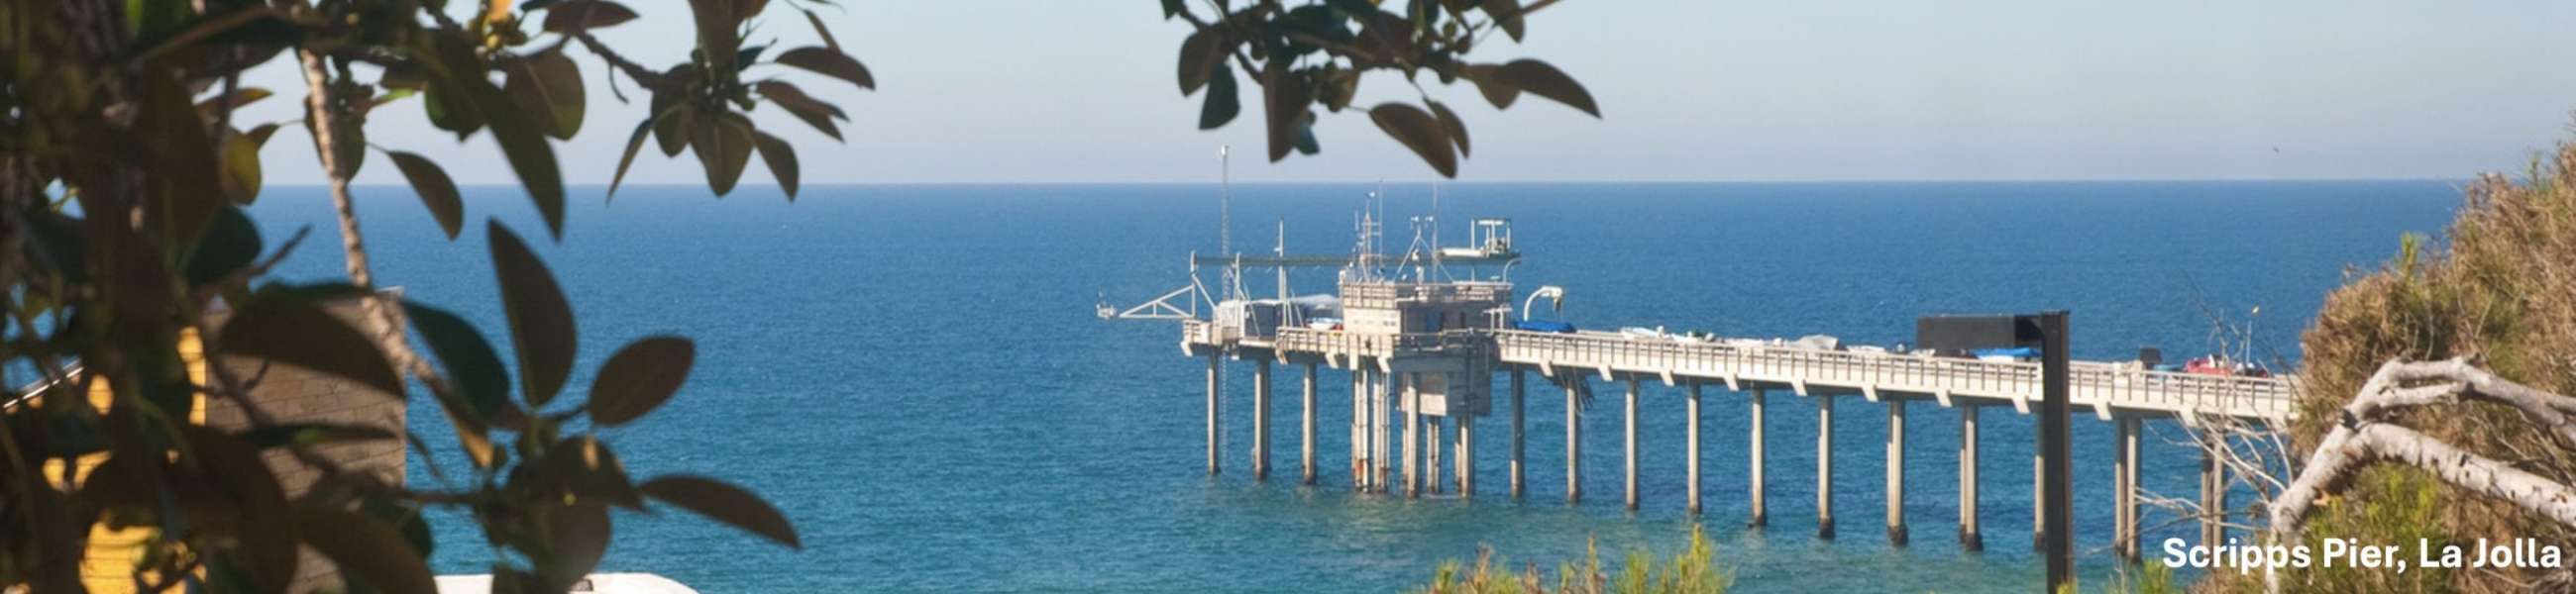
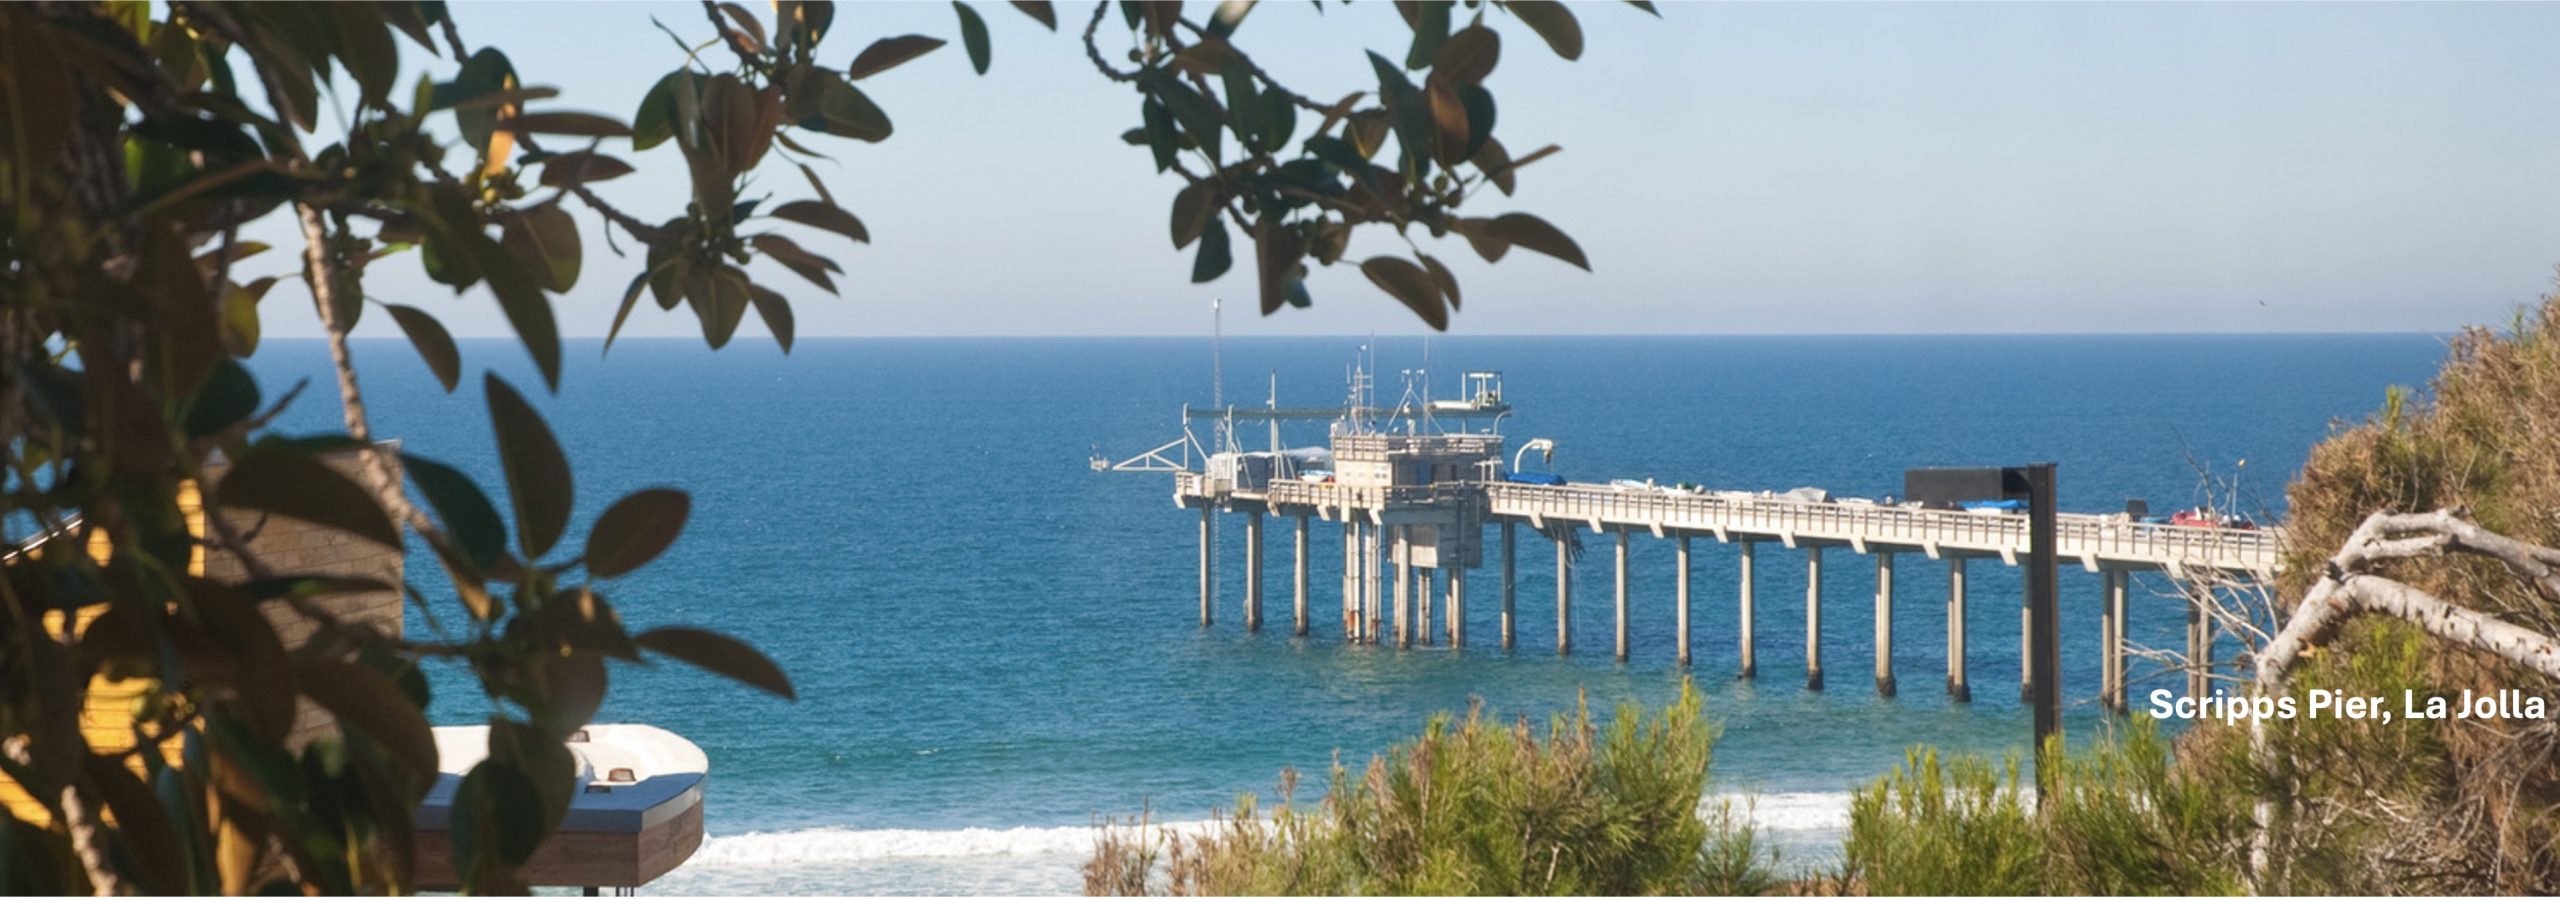
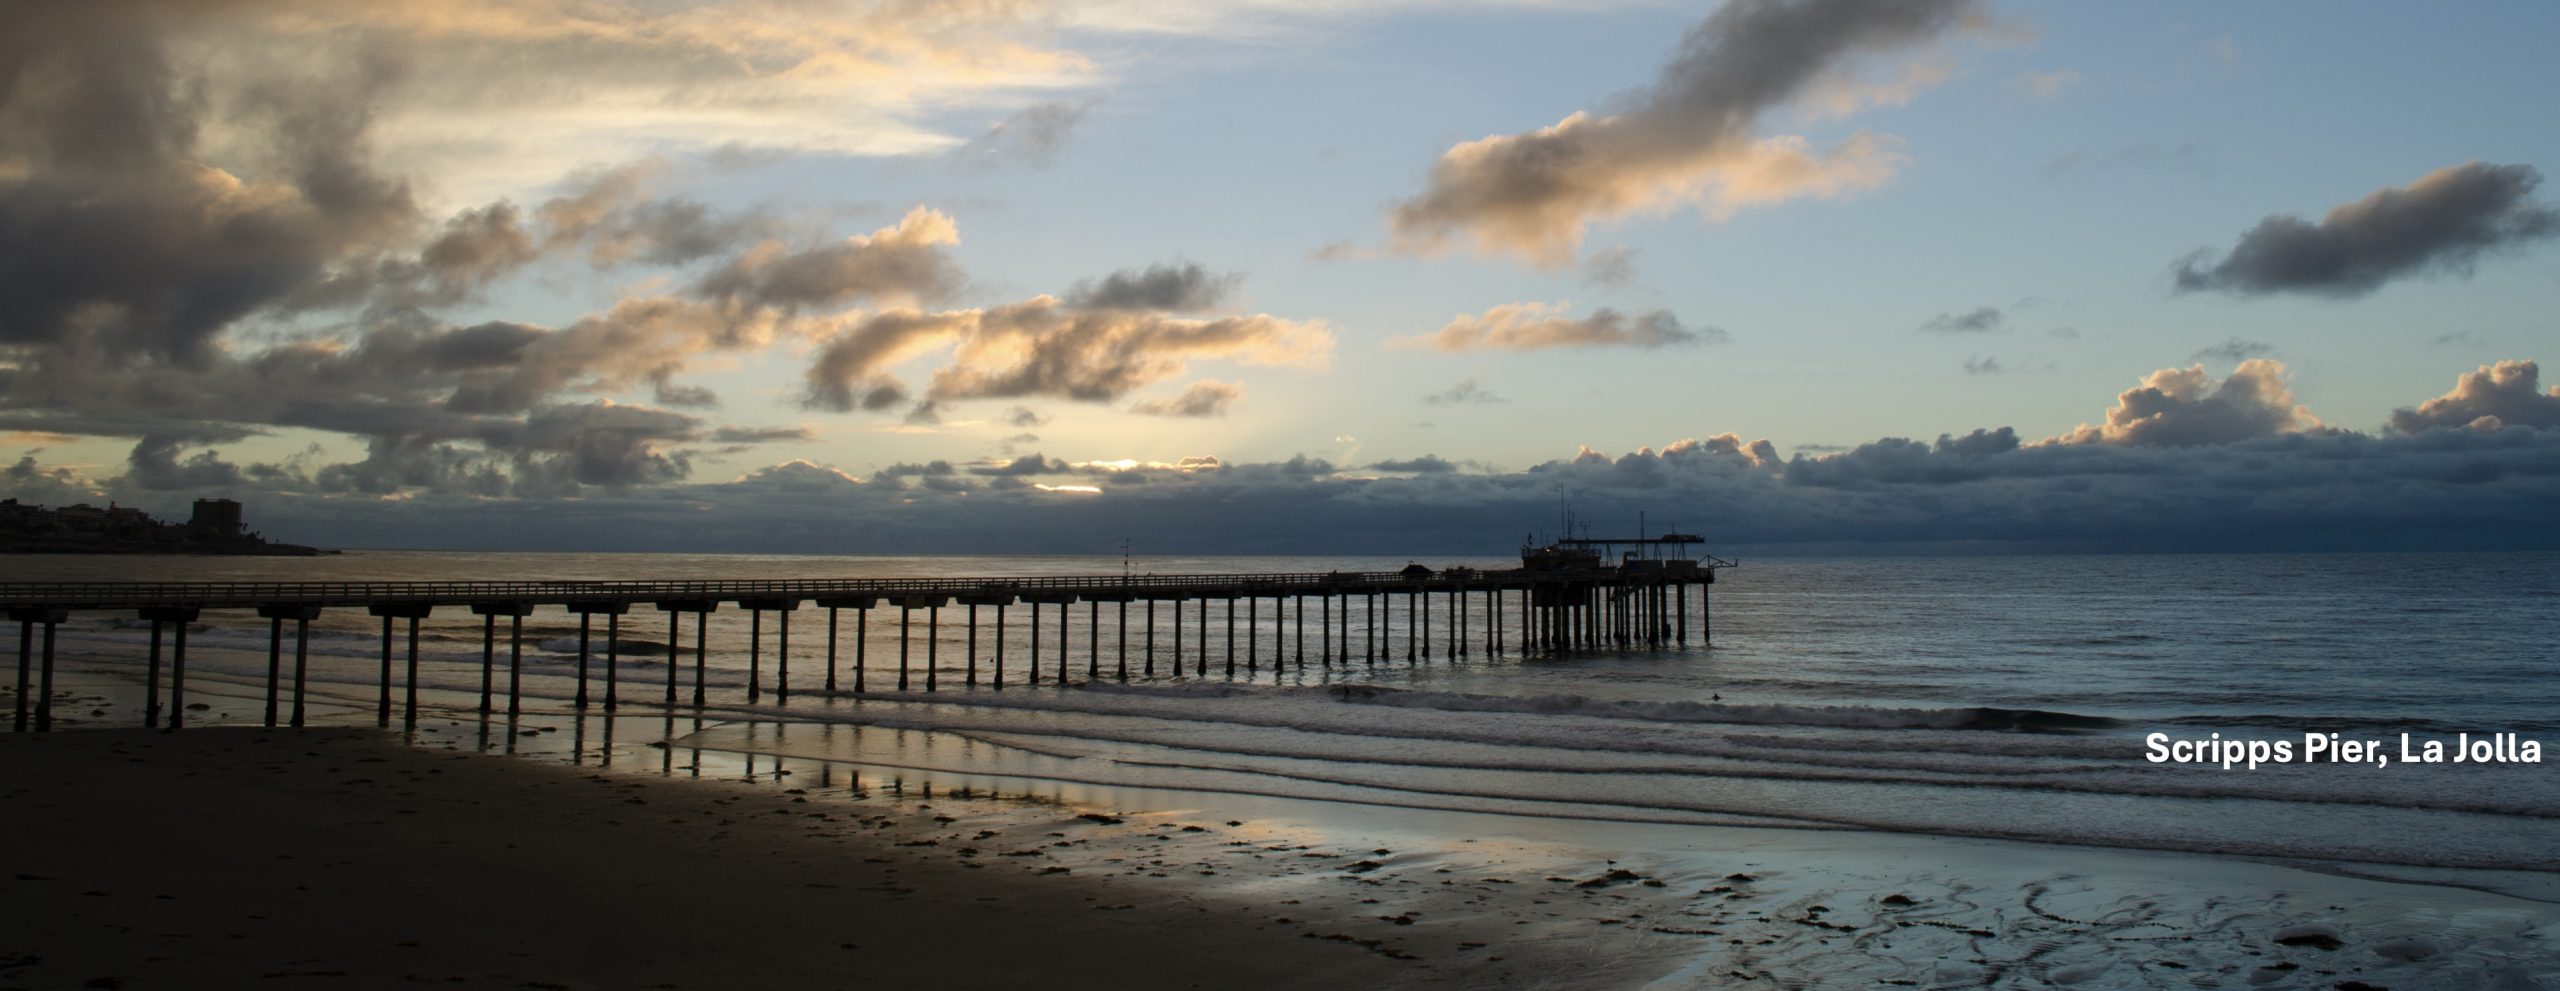
View under Ellen Browning Scripps Memorial Pier
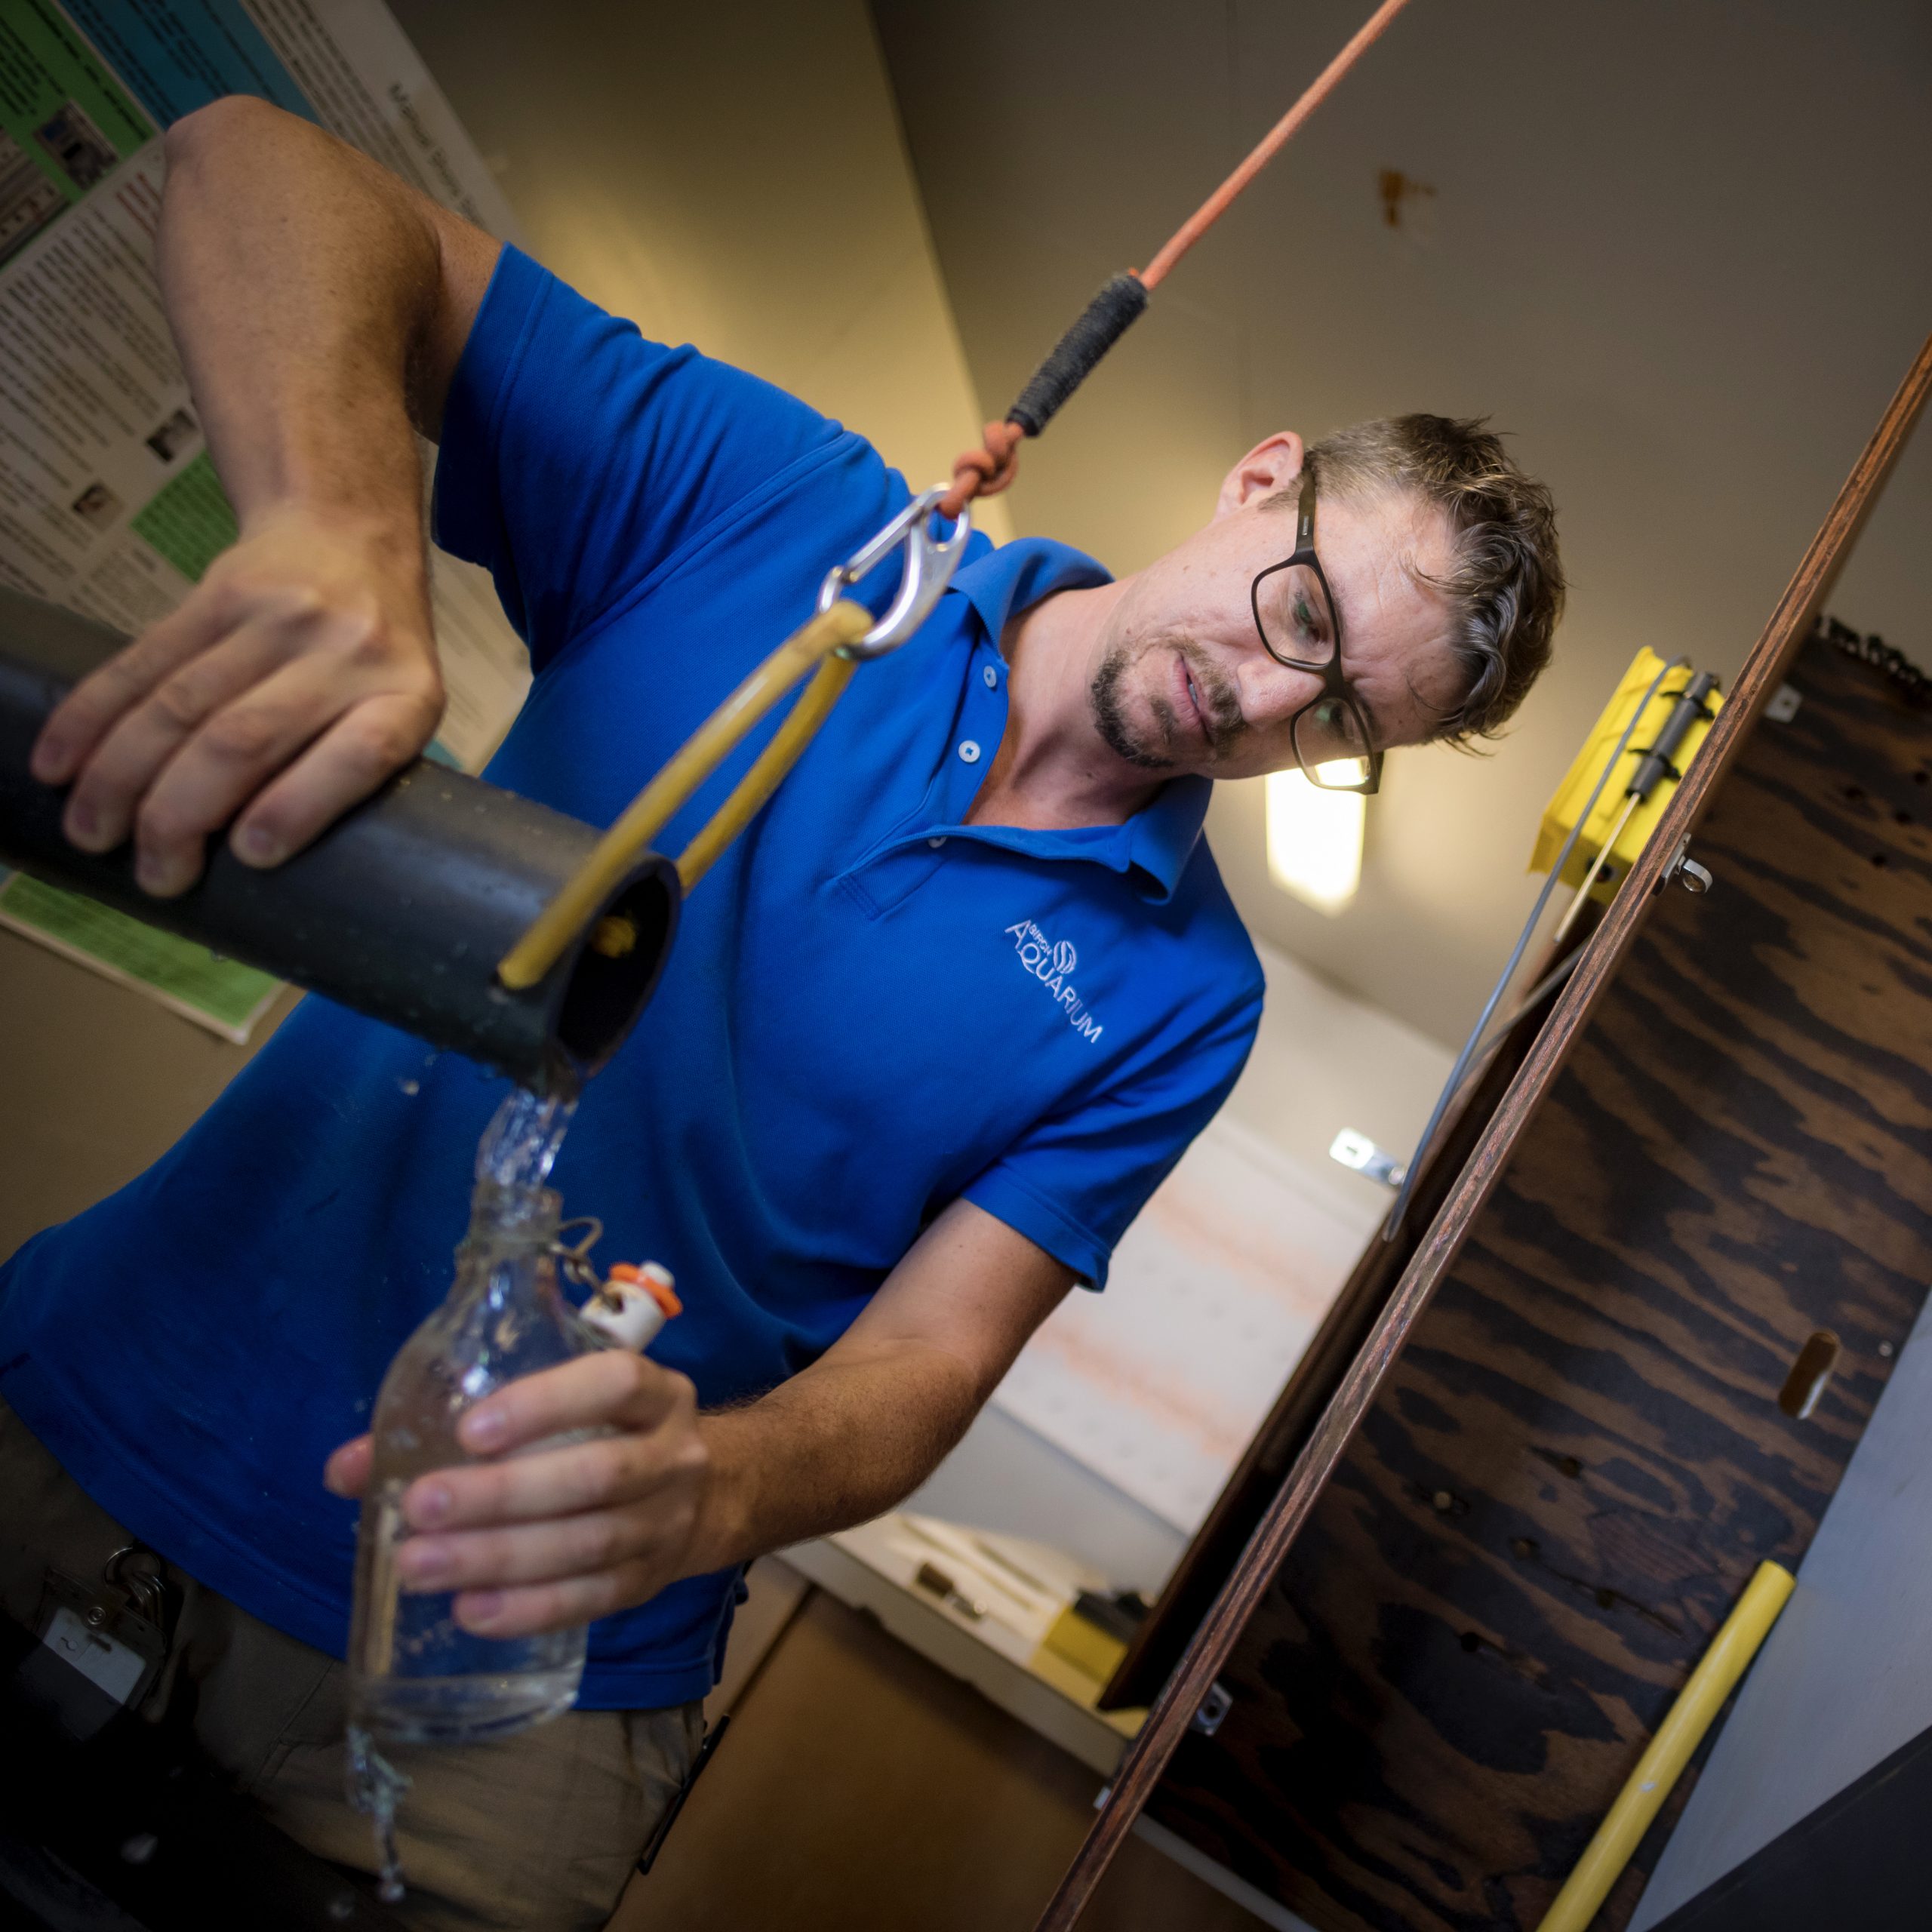
Aquarist from Birch Aquarium taking surface salinity sample at La Jolla, Scripps Pier station
Photo by Erik Jepsen
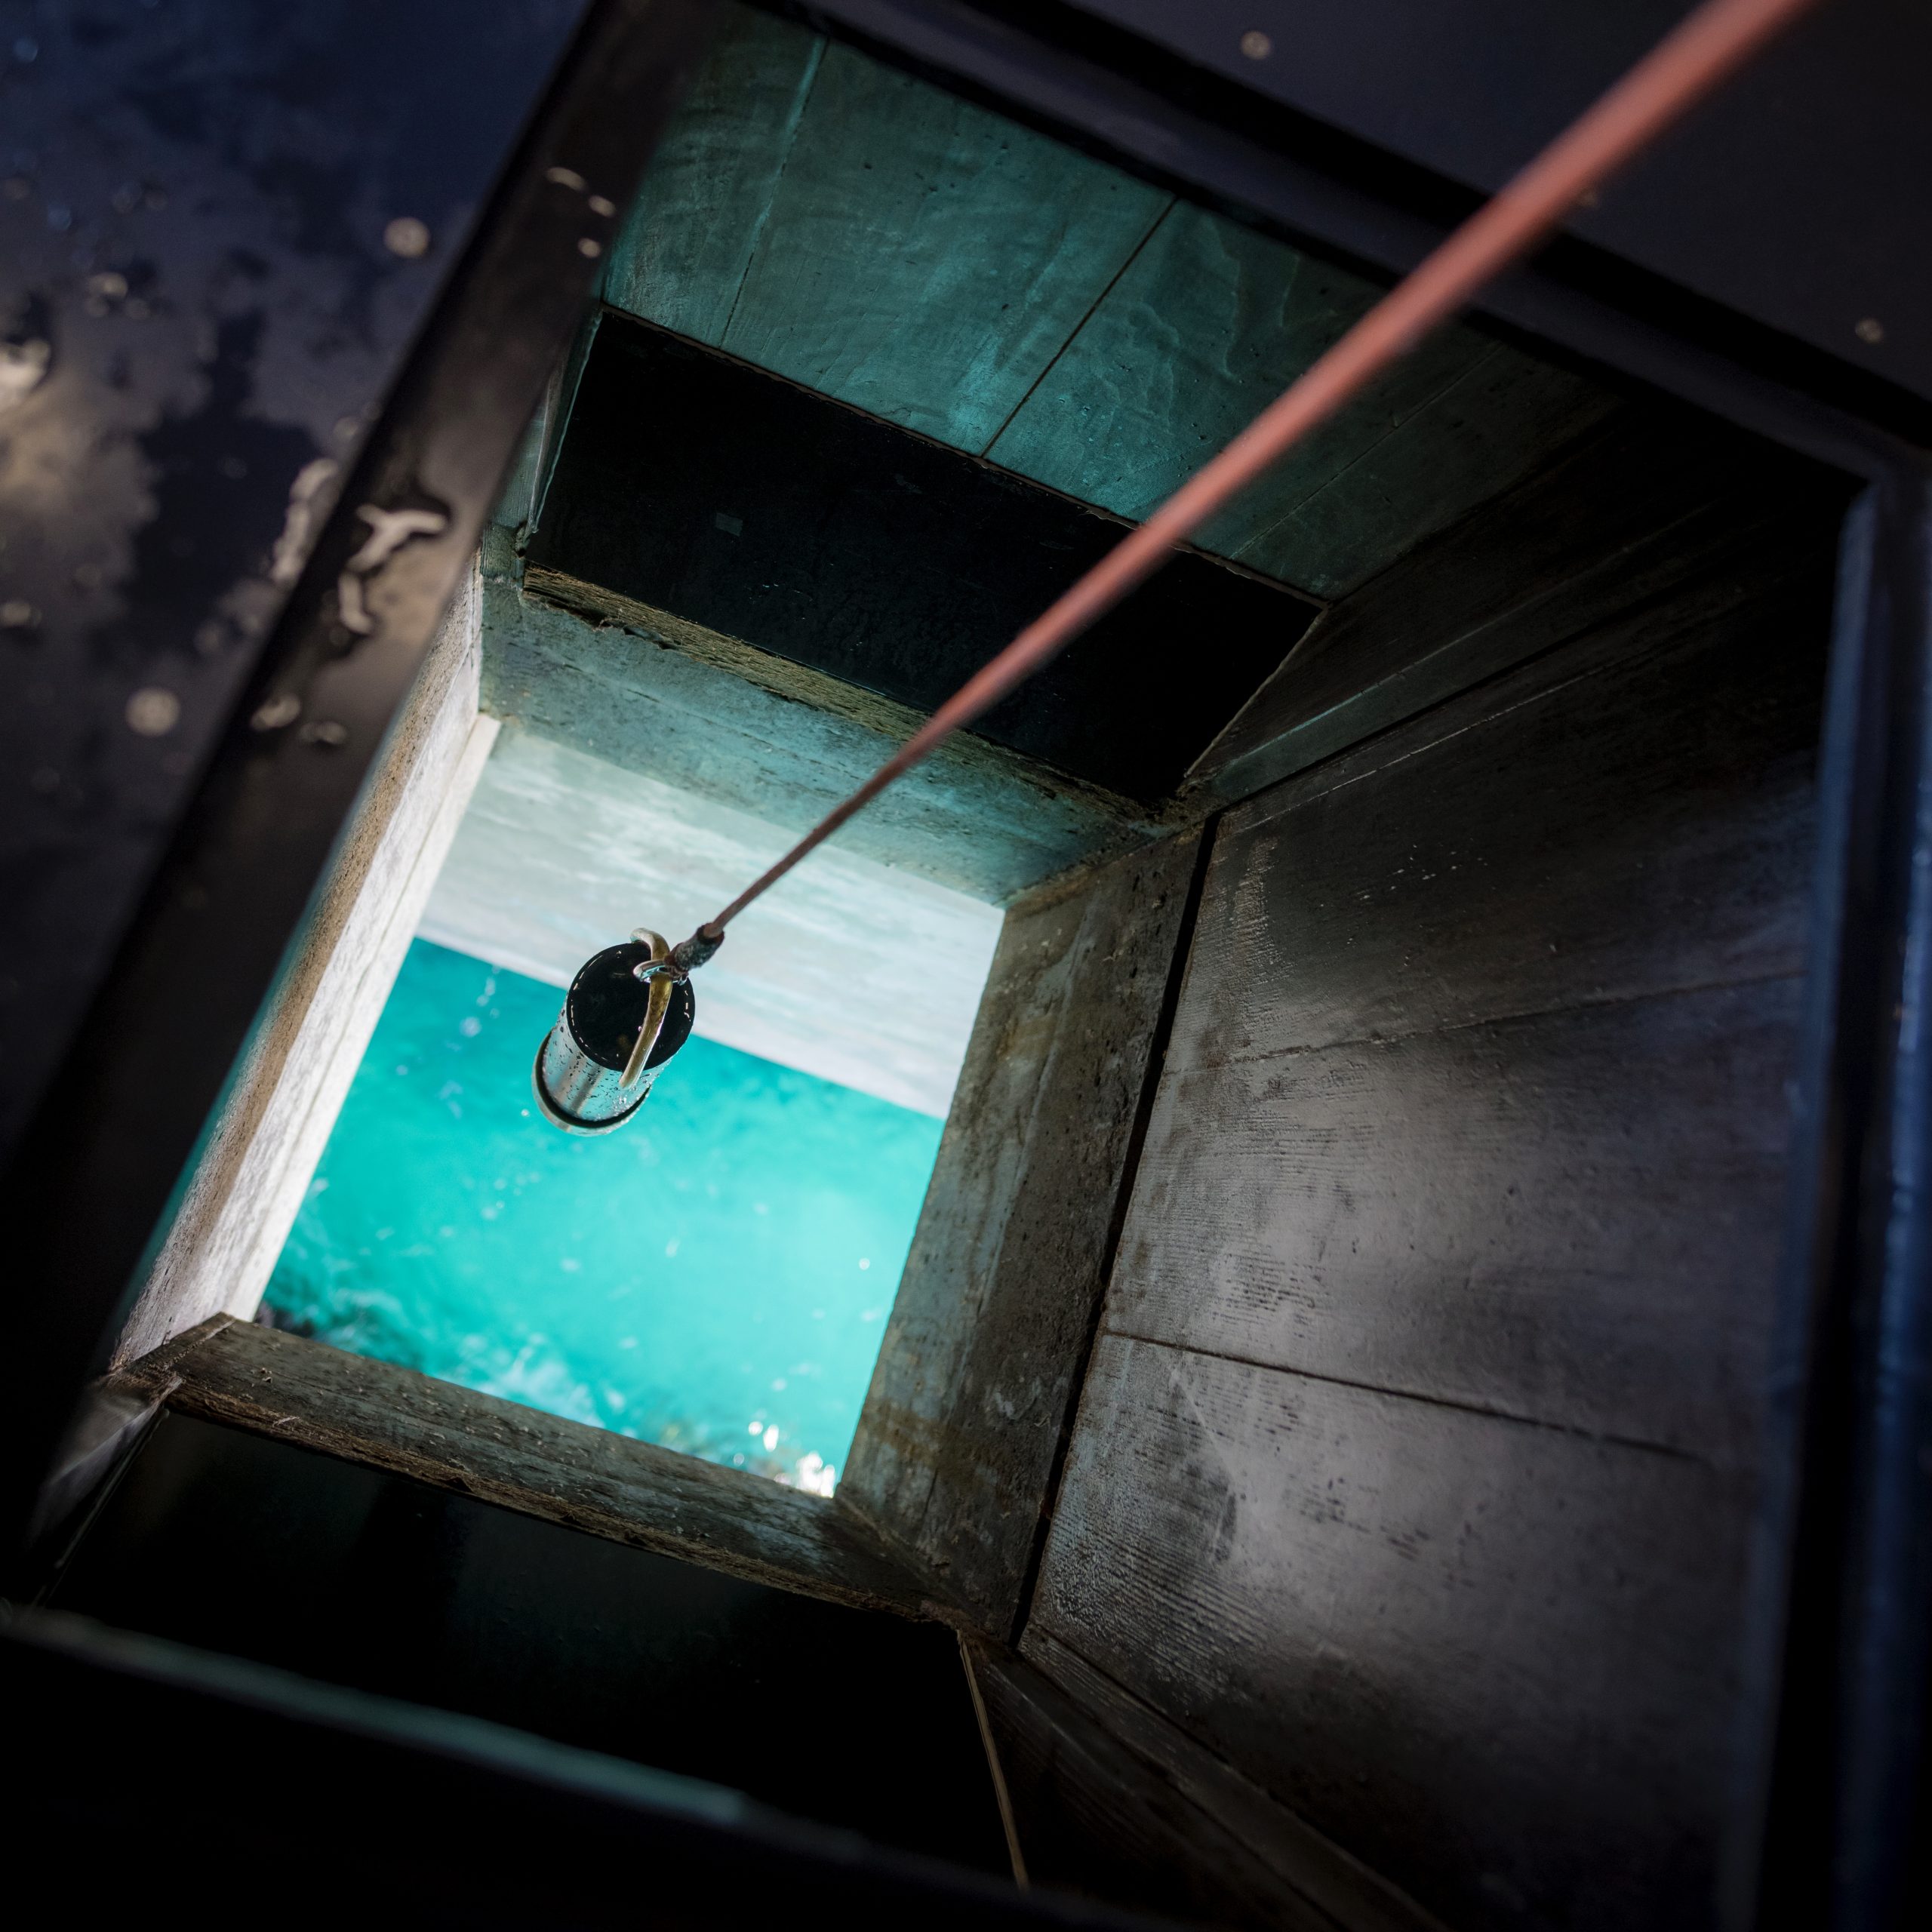
View down sampling well with surface sample bucket at La Jolla, Scripps Pier station
Photo by Erik Jepsen
Monthly Temperature Means from Shore Stations (2018-2022 vs Long-Term Average)
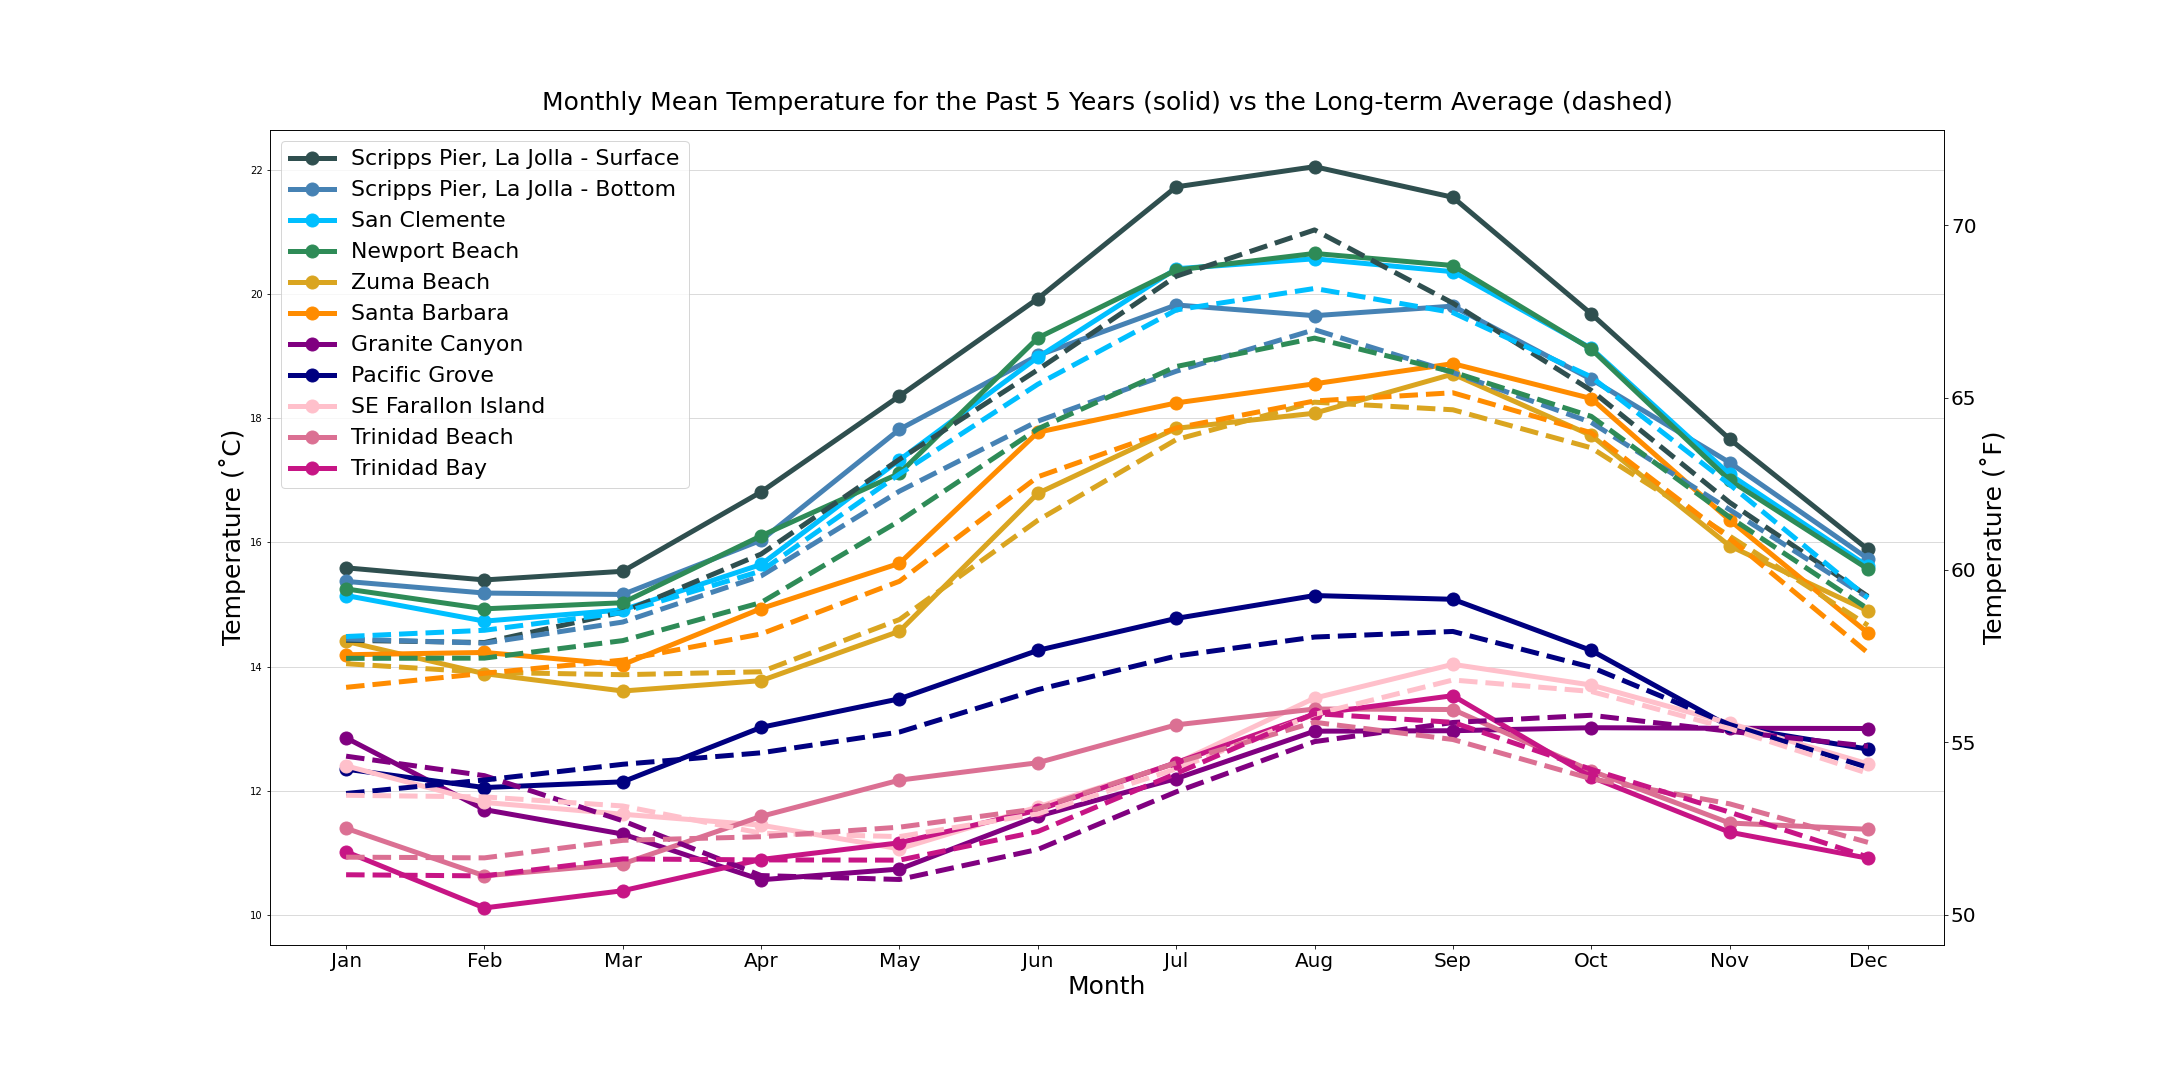
The figure above shows the monthly temperature means calculated from the past 5 years (2018-2022) at all stations, shown in the solid lines, where each station is a unique color (see legend for details). This plot also shows the long-term average from every station, beginning from whatever time the station started collecting data (for details, see section above titled "General Information"). The long term averages are shown as dashed lines, where color is coordinated for each station.
Monthly Salinity Means from Shore Stations (2018-2022 vs Long-Term Average)
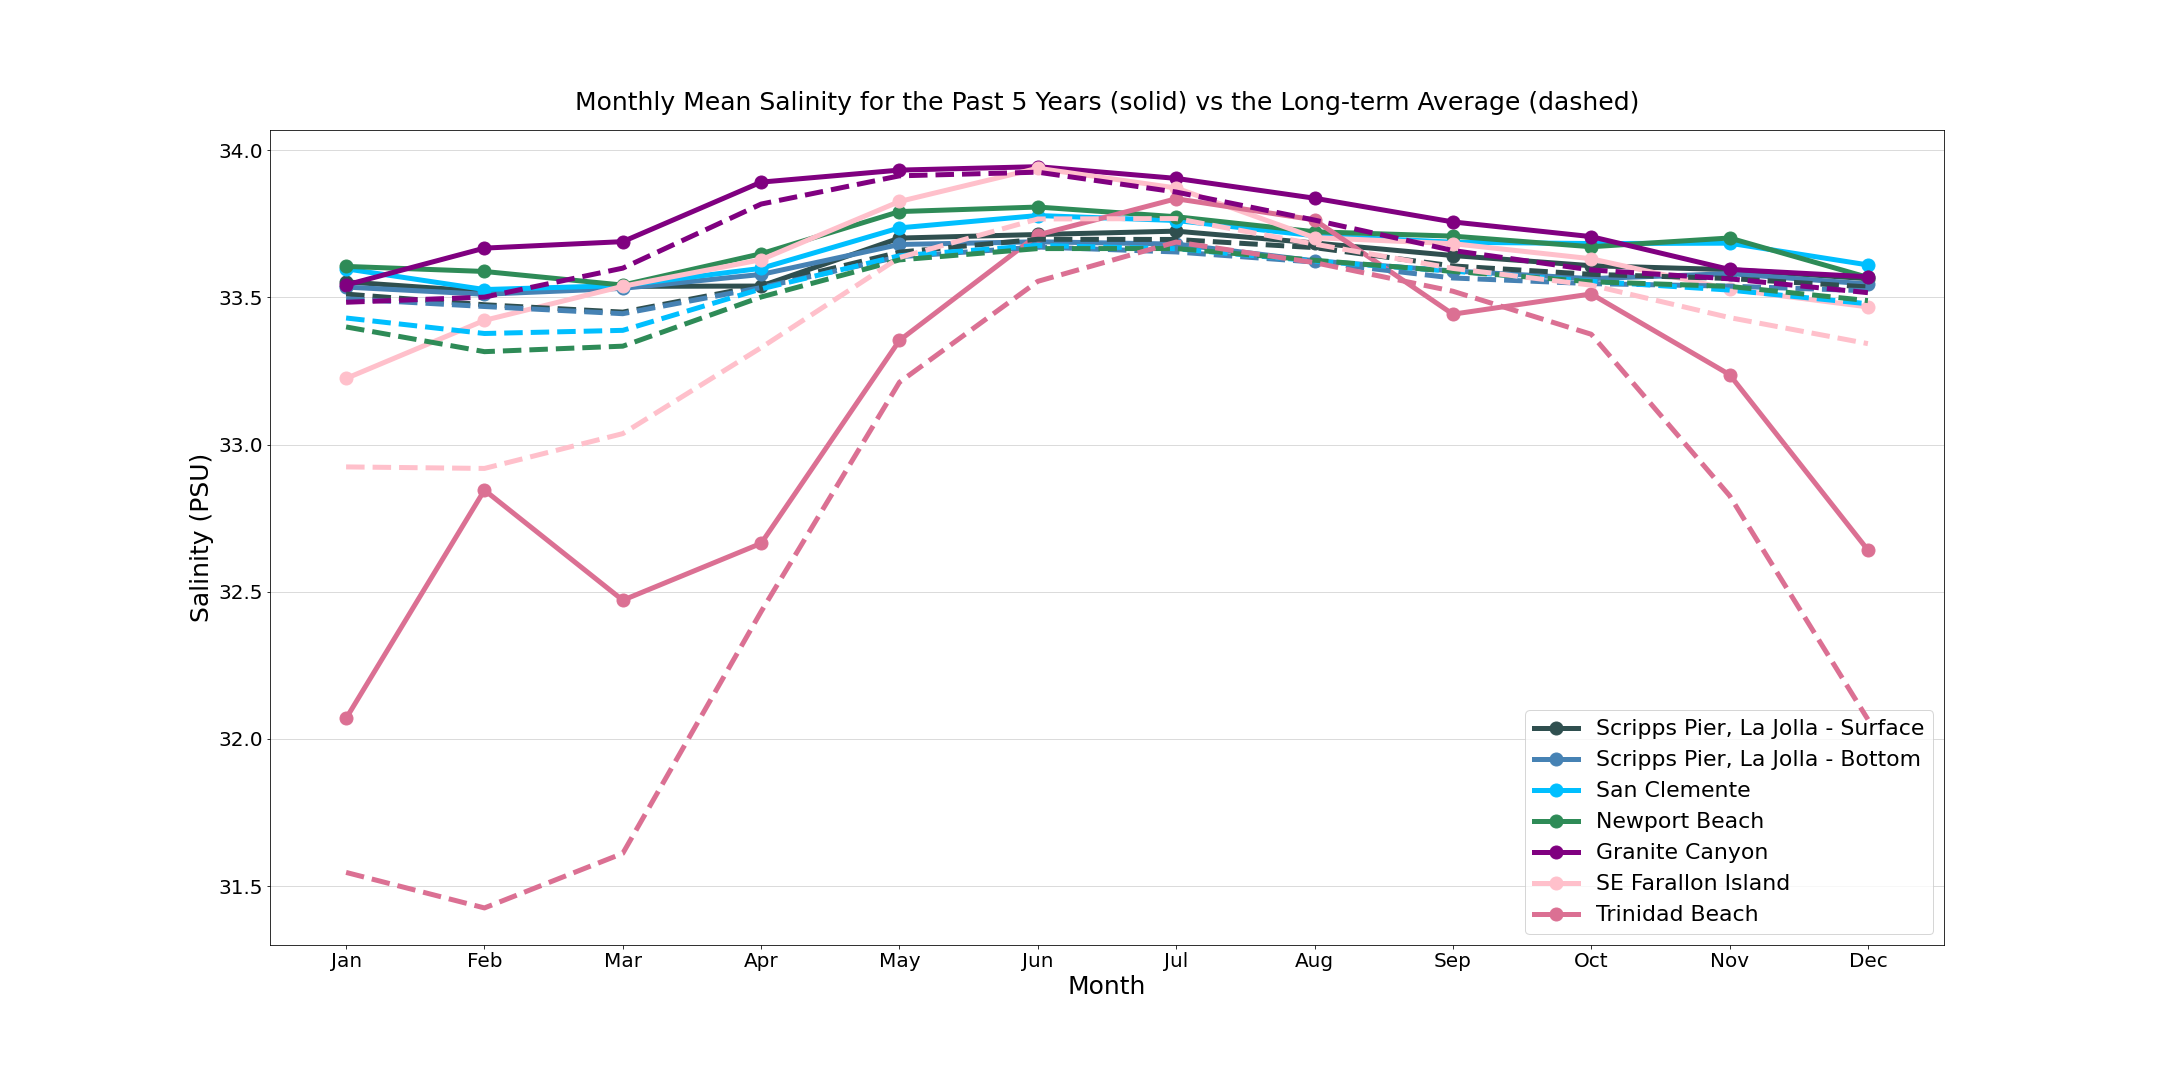
The figure above shows the monthly salinity means calculated from the past 5 years (2018-2022) at the 6 stations that measure salinity, shown in the solid lines, where each station is a unique color (see legend for details). This plot also shows the long-term average from each station, beginning from whatever time the station started collecting data (for details, see section above titled "General Information"). The long term averages are shown as dashed lines, where color is coordinated for each station.
This research is funded by California Department of Parks and Recreation, Natural Resources Division, Award# C1670003. Data values are processed and published on the website by program staff at UCSD/Scripps Institution of Oceanography as they become available from each site. Program data are archived on a quarterly basis in the UCSD Library’s Digital Collections. https://doi.org/10.6075/J0S75GHD