En
EnActionable Insights & Information
Grow your market share, reduce costs in your supply chain, generate business intelligence, and save valuable time. Whatever your goals, our web-based platform is designed to provide solutions.
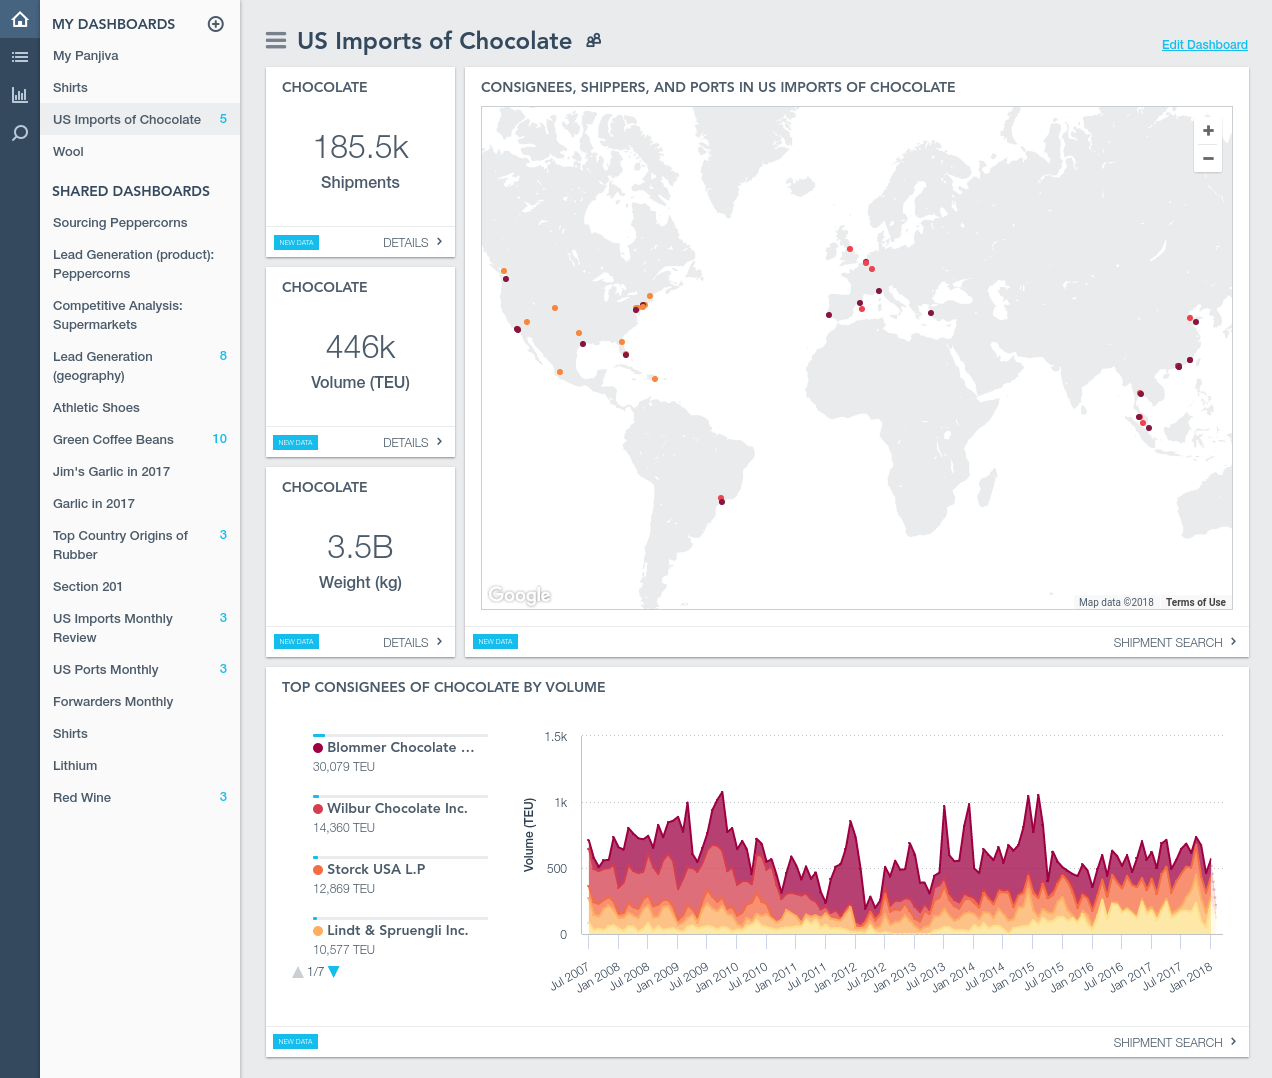
Personalized Dashboards
With Panjiva Dashboards, automatic updates put the latest insights at your fingertips.
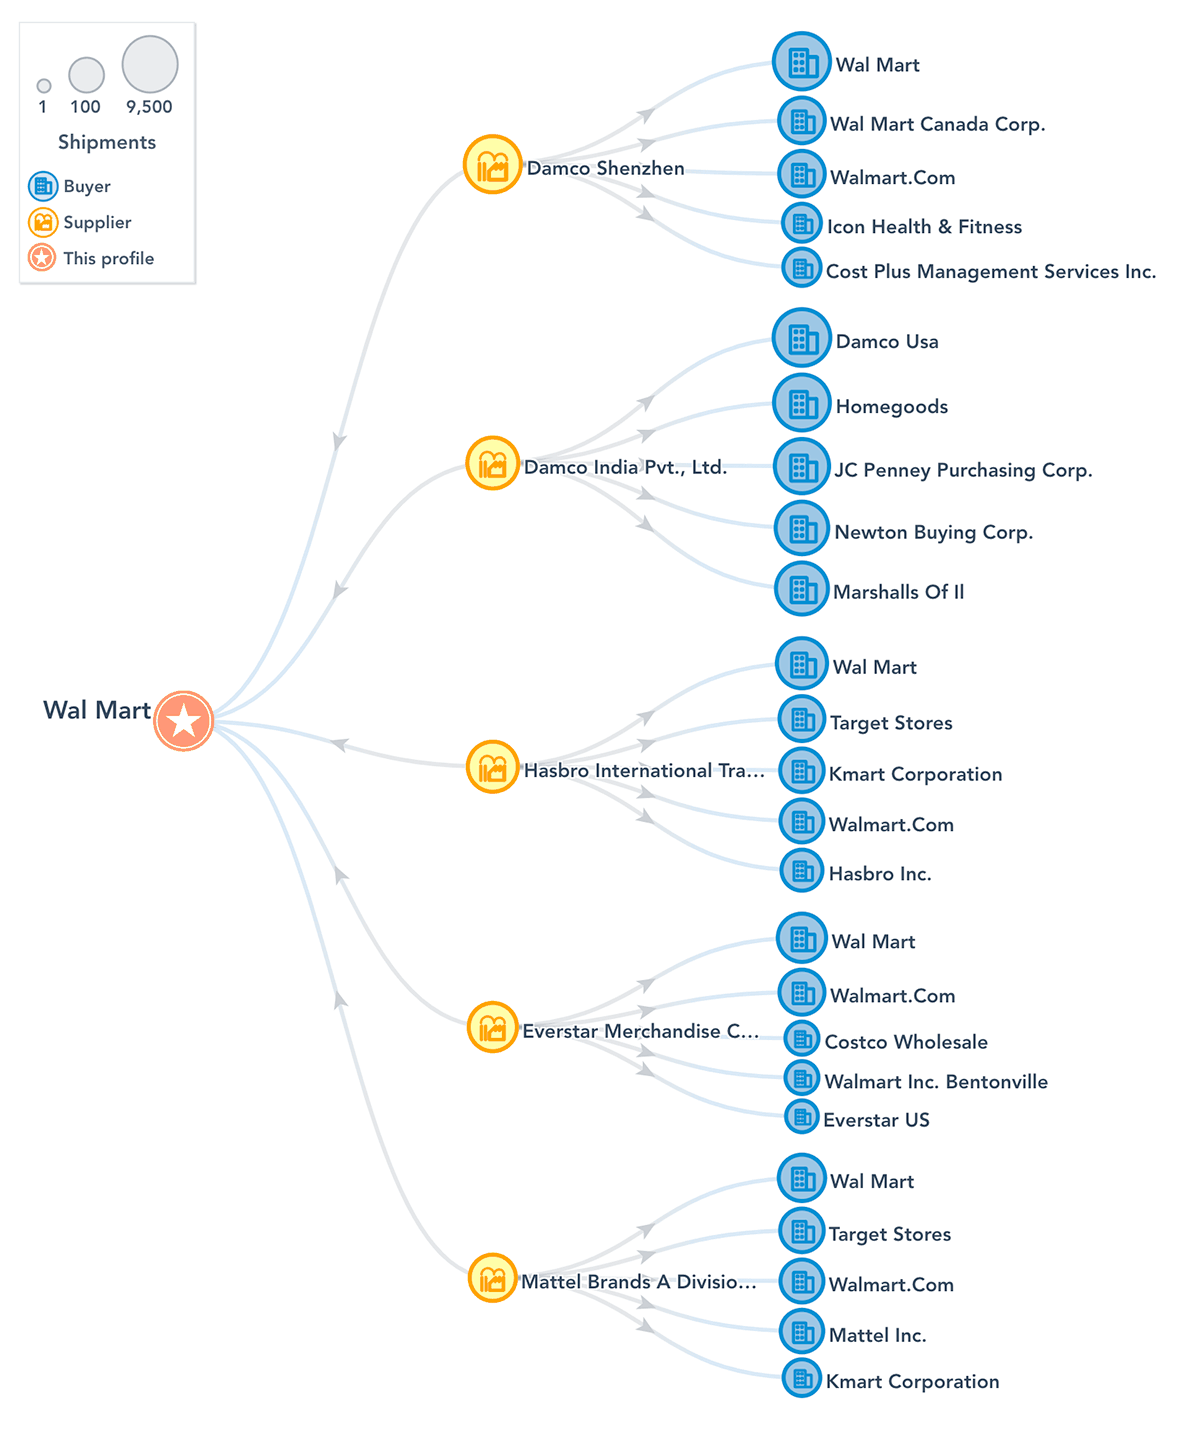
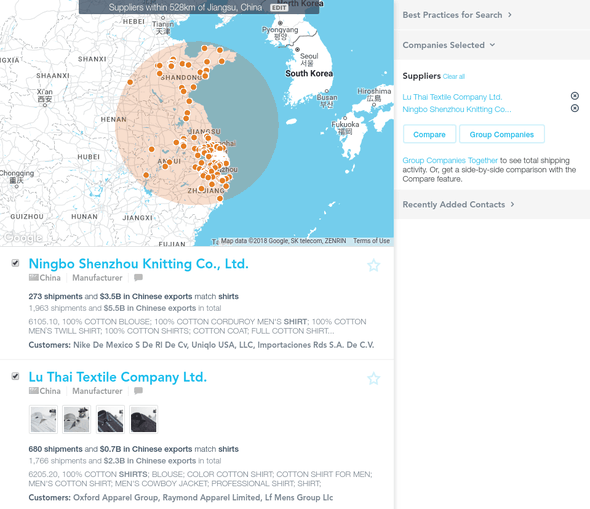
Analyze Trade Relationships
Investigate your customers’ and competitors’ trading partners.
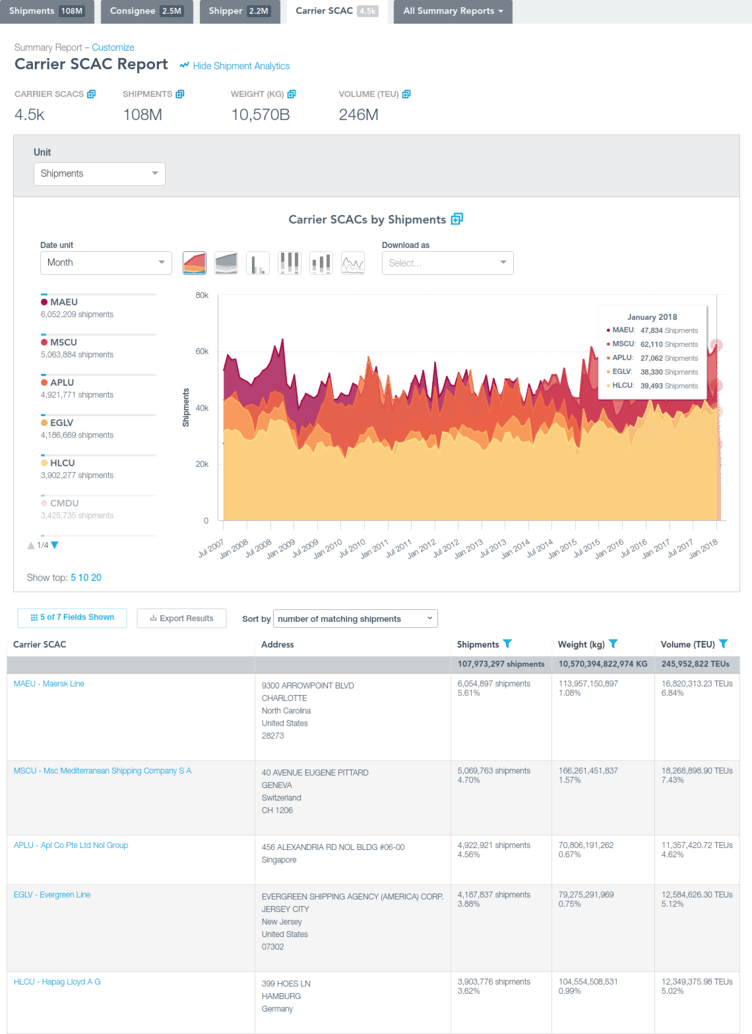
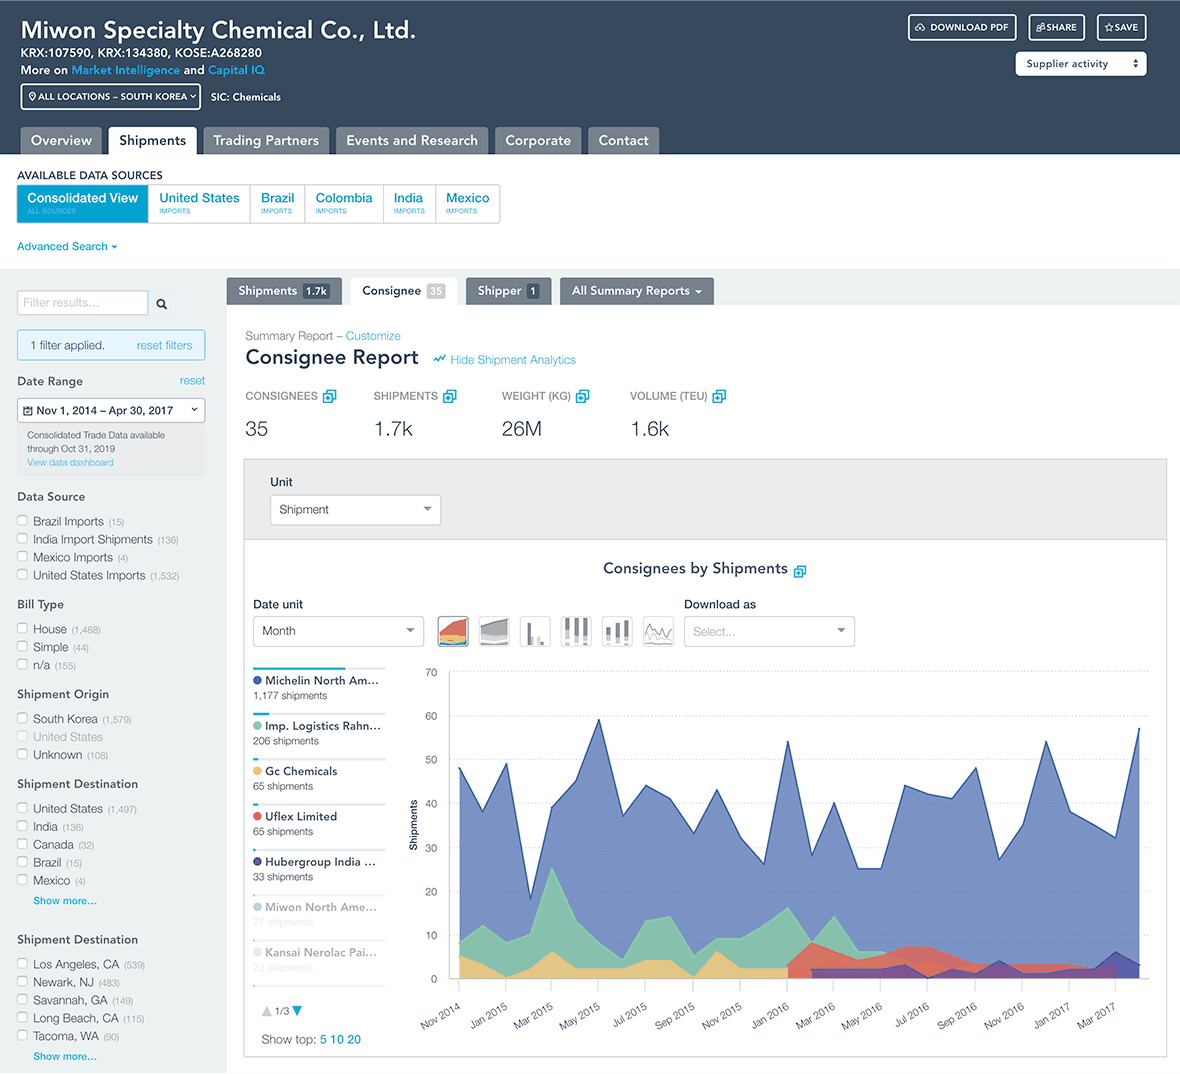
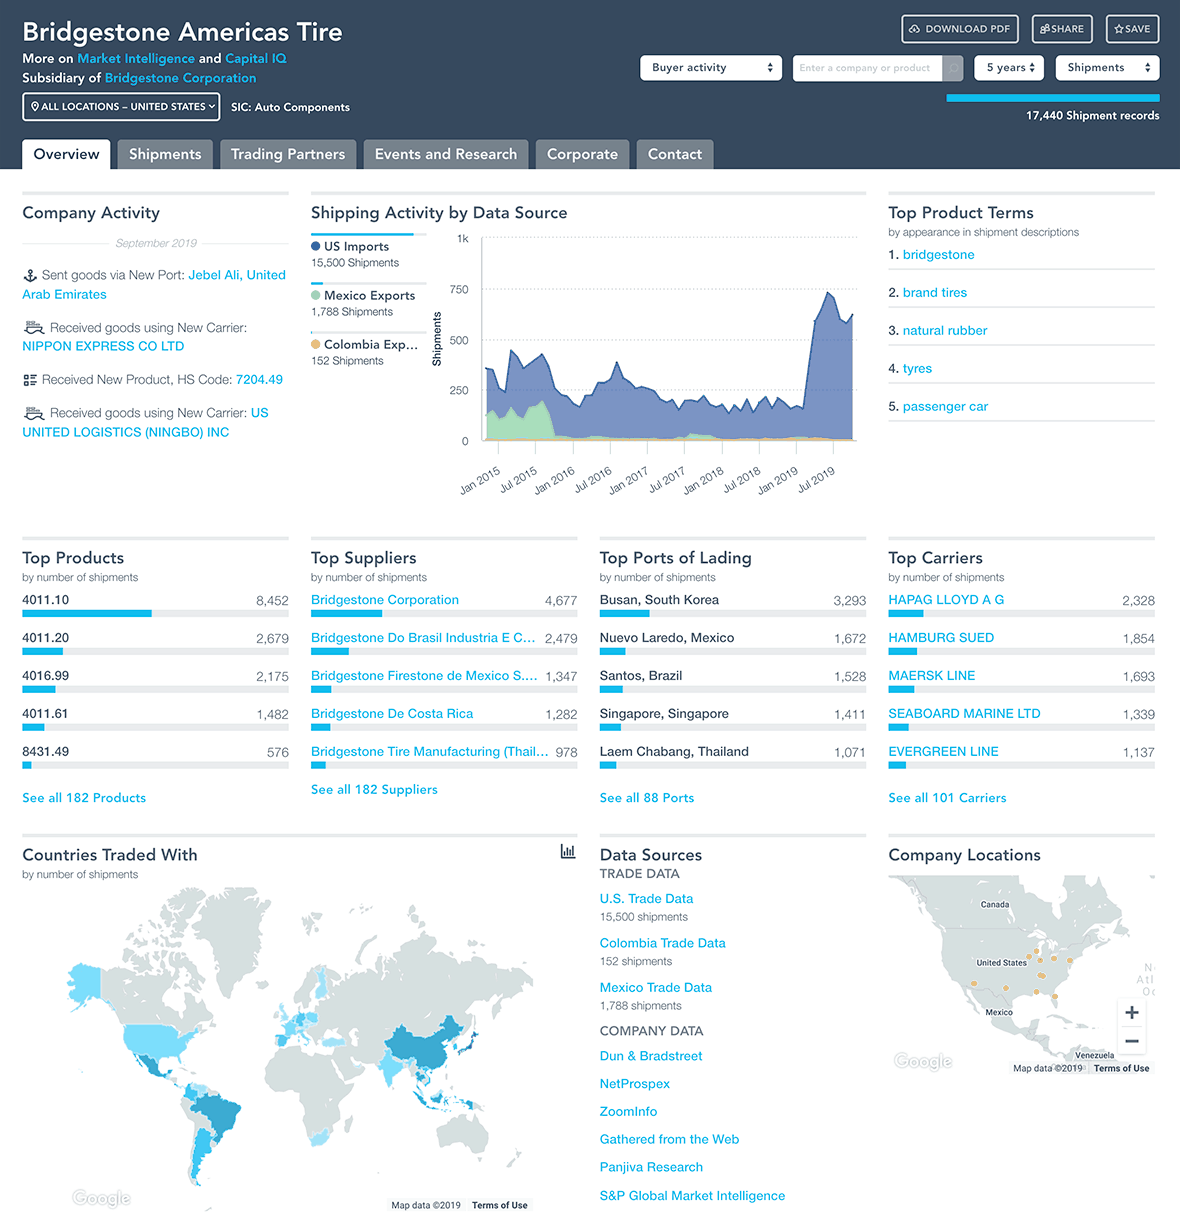
Determine Market Share
Understand your market share by carrier, port, country, or method of shipping.
Review Latest Trends
Use our analytics tool to discover trends in trade by product and company.
Mitigate Business Risks
Proactively investigate your prospective or existing business relationships.
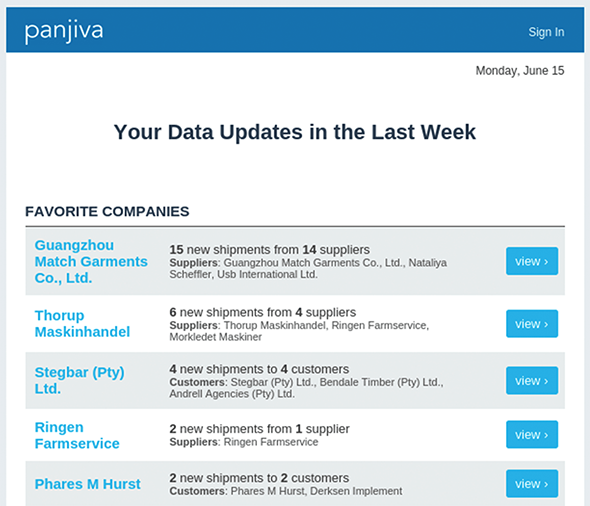
Stay Informed
Get email notifications when new shipments arrive/depart or when new businesses emerge.
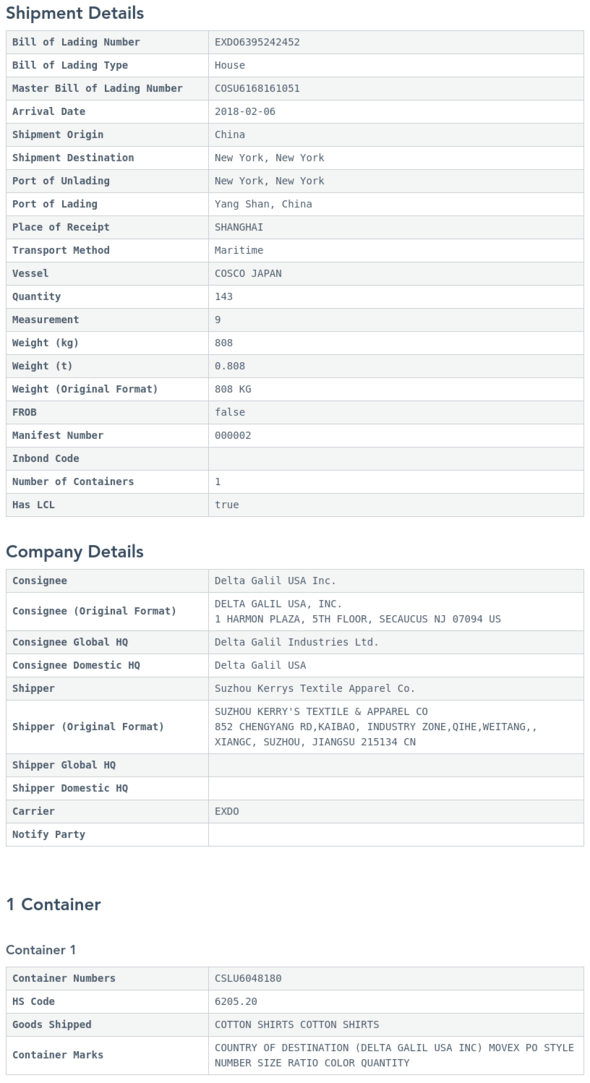
Examine Raw Data
Access and examine Bill of Lading records (a.k.a. ship manifests).