Climate Matters•July 24, 2019
Summer Heat Means Stagnant Air
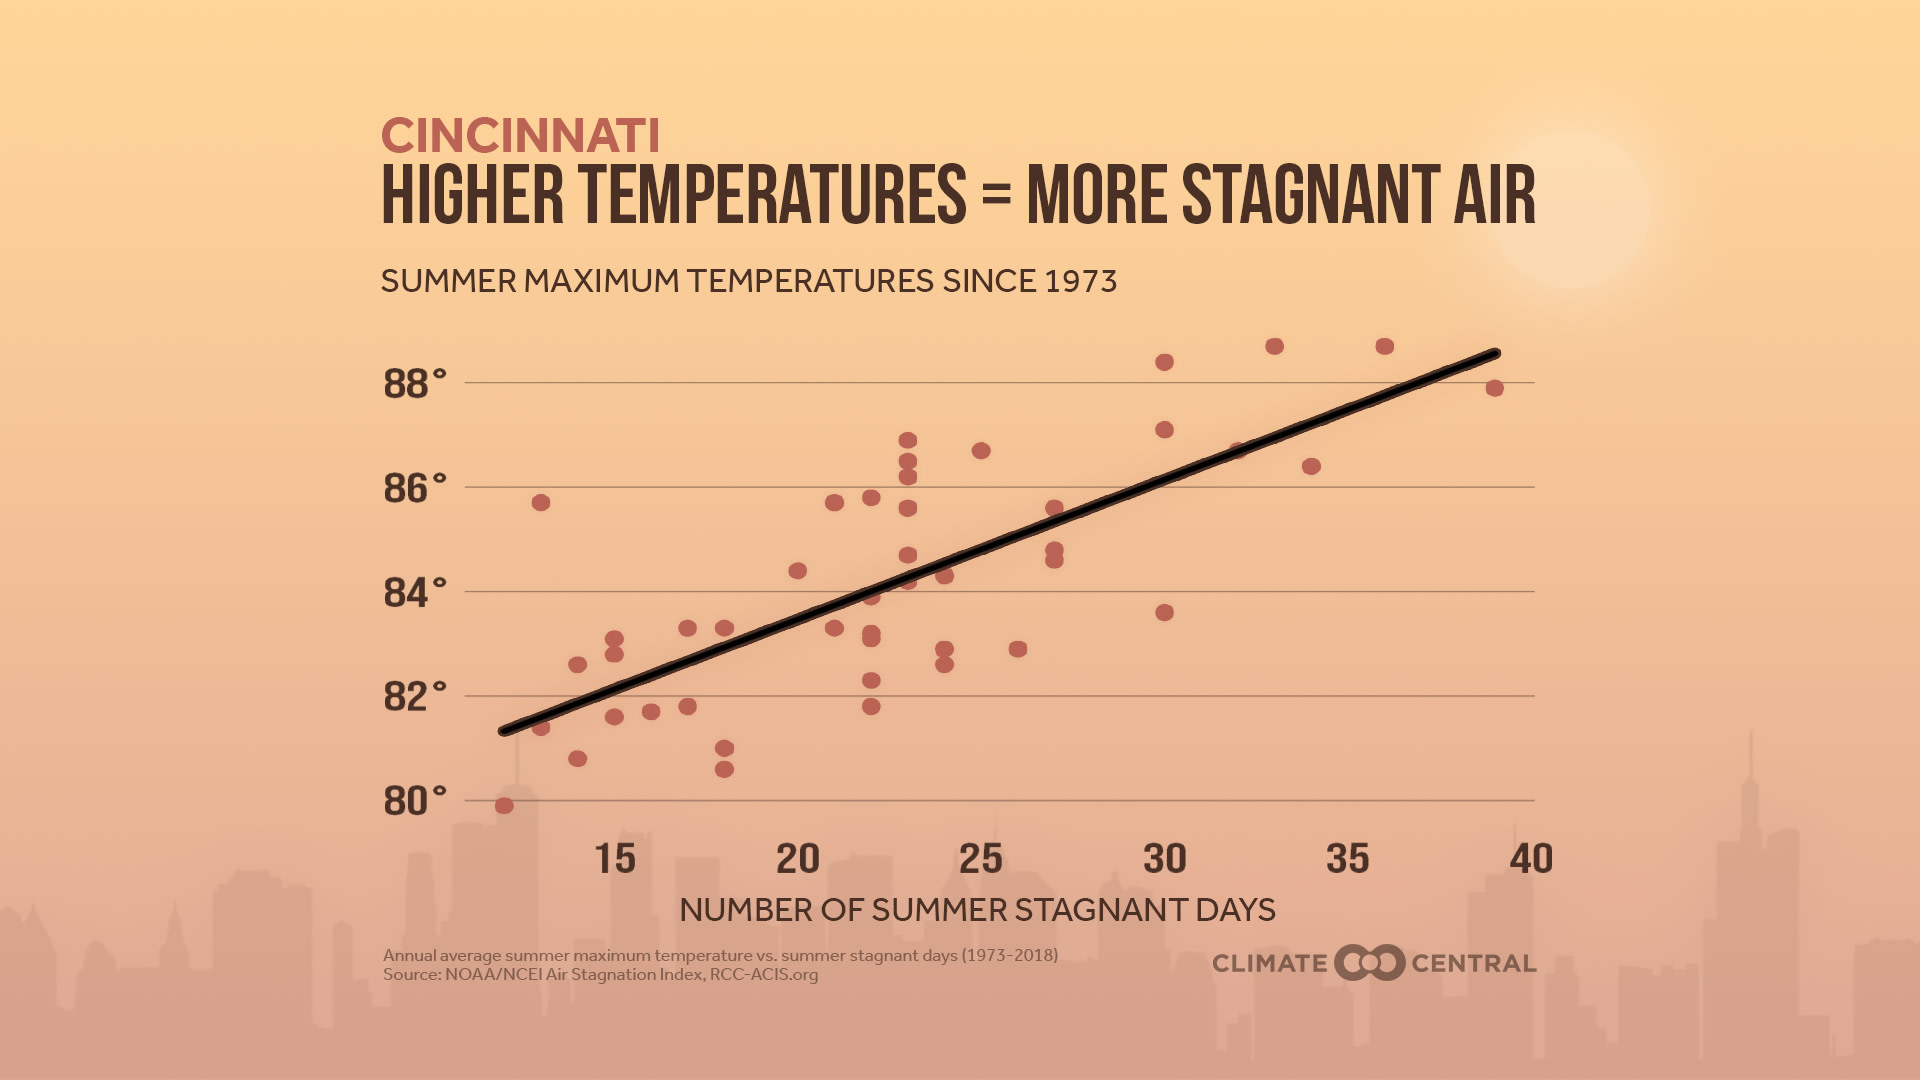
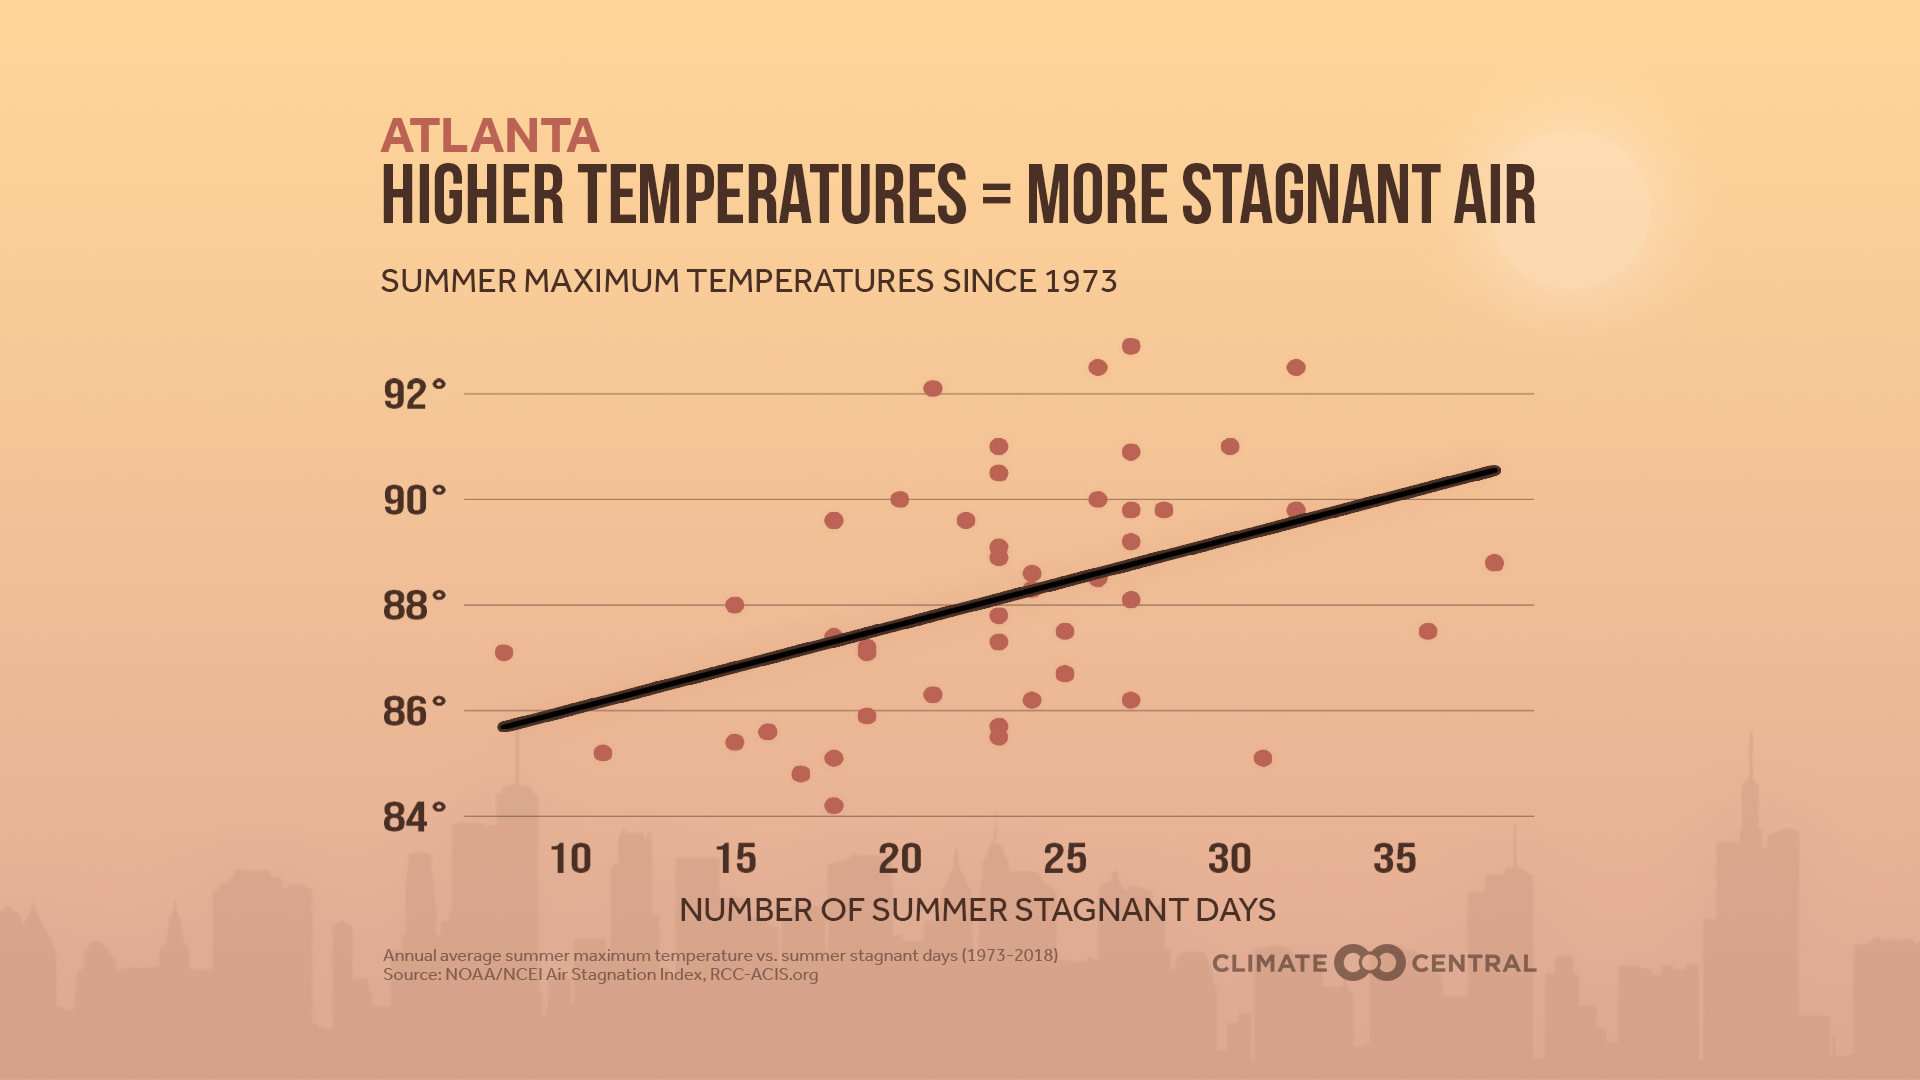
With summer heat sticking around longer, temperature isn’t the only thing to worry about. Persistently hot weather patterns can also trap air pollutants in the lower atmosphere, in a phenomenon known as stagnation. These nearly stationary domes of hot air may hold particulates and ground-level ozone, causing health problems from respiratory distress to eye irritation. The next two weeks focus on air quality, starting with the concept of stagnation.
Heat and stagnation are closely linked. Climate Central analyzed this link using the NOAA/NCEI Air Stagnation Index—which incorporates upper atmospheric winds, surface winds, and precipitation to calculate the daily level of stagnation—and summer high temperatures. Since 1973, 98% of the cities analyzed show a positive correlation between summer high temperatures and the number of summer stagnant days. Only five cities along the California coast lack this correlation; their local heat comes from downsloping, offshore winds such as the Santa Ana winds, which mix up the air and limit stagnation. However, that doesn’t preclude those cities from having more stagnant days or unhealthy air.
Stagnation is also becoming more common in most of the country. Since NOAA’s Index began in 1973, the number of annual stagnant days has increased in 83% of the contiguous U.S. cities analyzed. McAllen, Texas tops the list with 36 more days per year on average, followed by Los Angeles and San Francisco (where stagnation is less correlated with the heat). The largest increases have come along the Gulf and Pacific coasts as well as the East, while most of the decreases have occurred in the Mountain West.
The rise of summer temperatures will likely come together with more stagnation days—worsening health issues from the air pollutants that are trapped. Though air quality has significantly improved since the Clean Air Act of 1970, some major cities have shown a recent uptick in the number of unhealthy days for particulates and ground-level ozone. As the climate warms, stagnant days are projected to increase further, with up to 40 more days per year by late-century. But if we all cut our climate-warming emissions, we can help protect the air we breathe.

METHODOLOGY: Climate Central analyzed gridded stagnation data from the NOAA/NCEI Air Stagnation Index, calculating annual trends since the dataset began in 1973. Correlation plots were created using annual average summer (June, July, and August) maximum temperature data obtained from the Applied Climate Information System and summer stagnation data from NOAA/NCEI.
Climate Central’s local analyses typically include 244 stations, including 5 stations in Alaska, Hawaii, and Puerto Rico. However, stagnation data were only available for the 239 stations in the contiguous U.S.