Climate Matters•August 5, 2020
Hiking Hazards: Ticks and Poison Ivy
KEY CONCEPTS
While scientists are confident that being outside reduces the risk of transmitting coronavirus, there are still some threats to be aware of when in the great outdoors. Among them are ticks and poison ivy ー and both may be getting worse due to climate change.
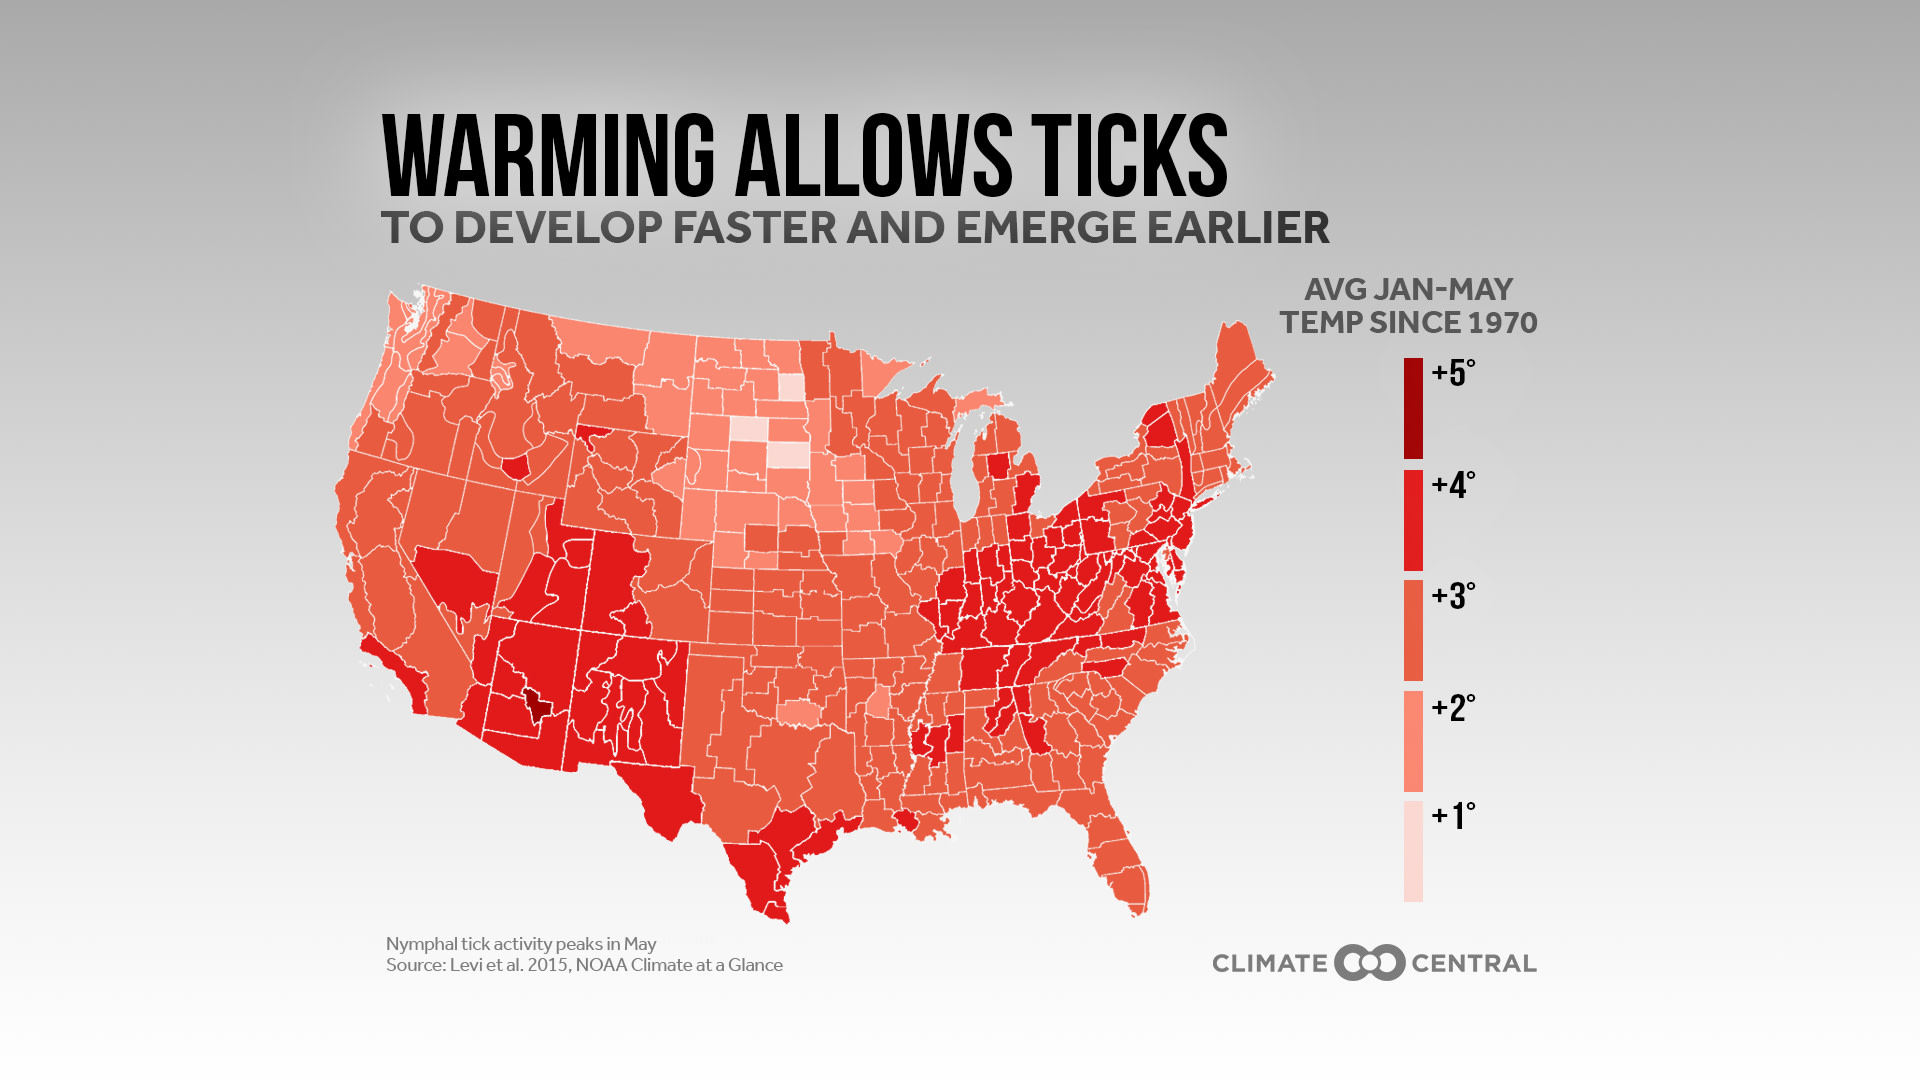
Rising temperatures are associated with faster tick development and population growth, allowing ticks to become active earlier in the year and spread to areas that were once too cold.
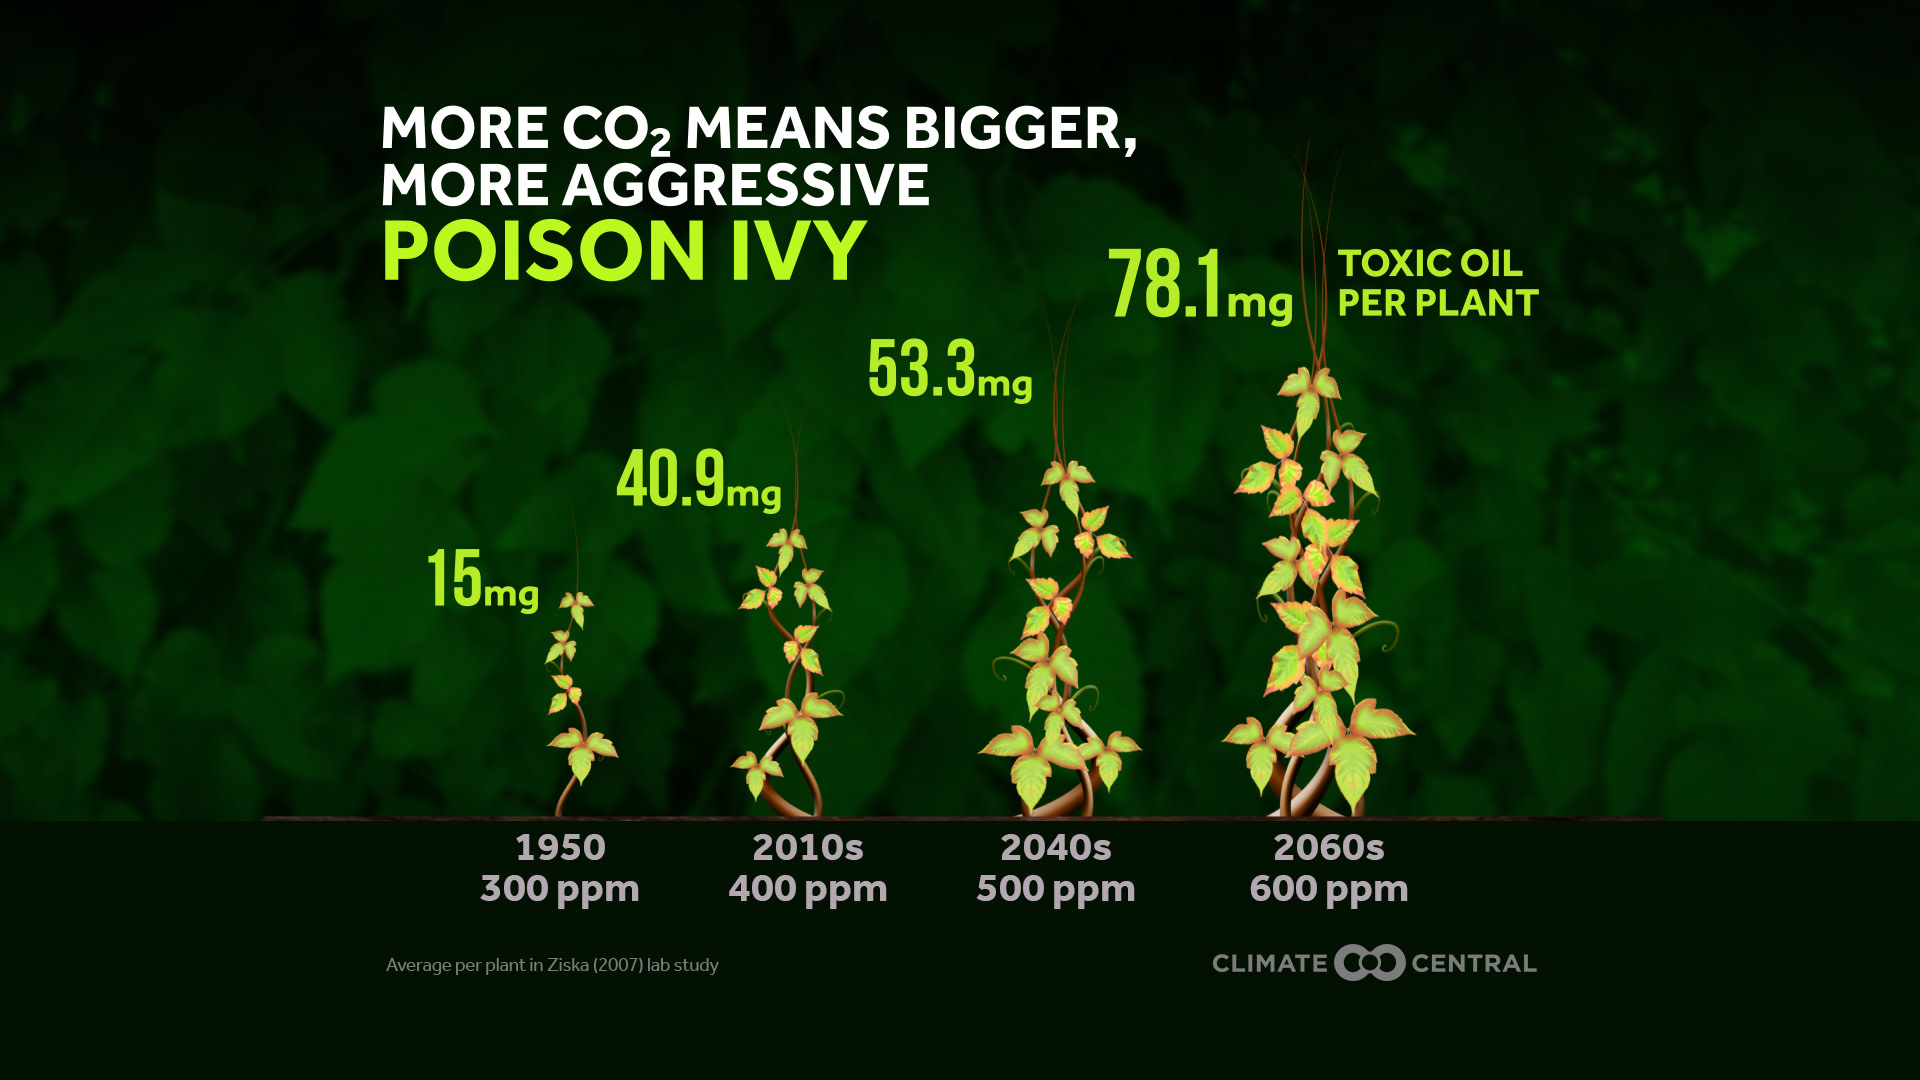
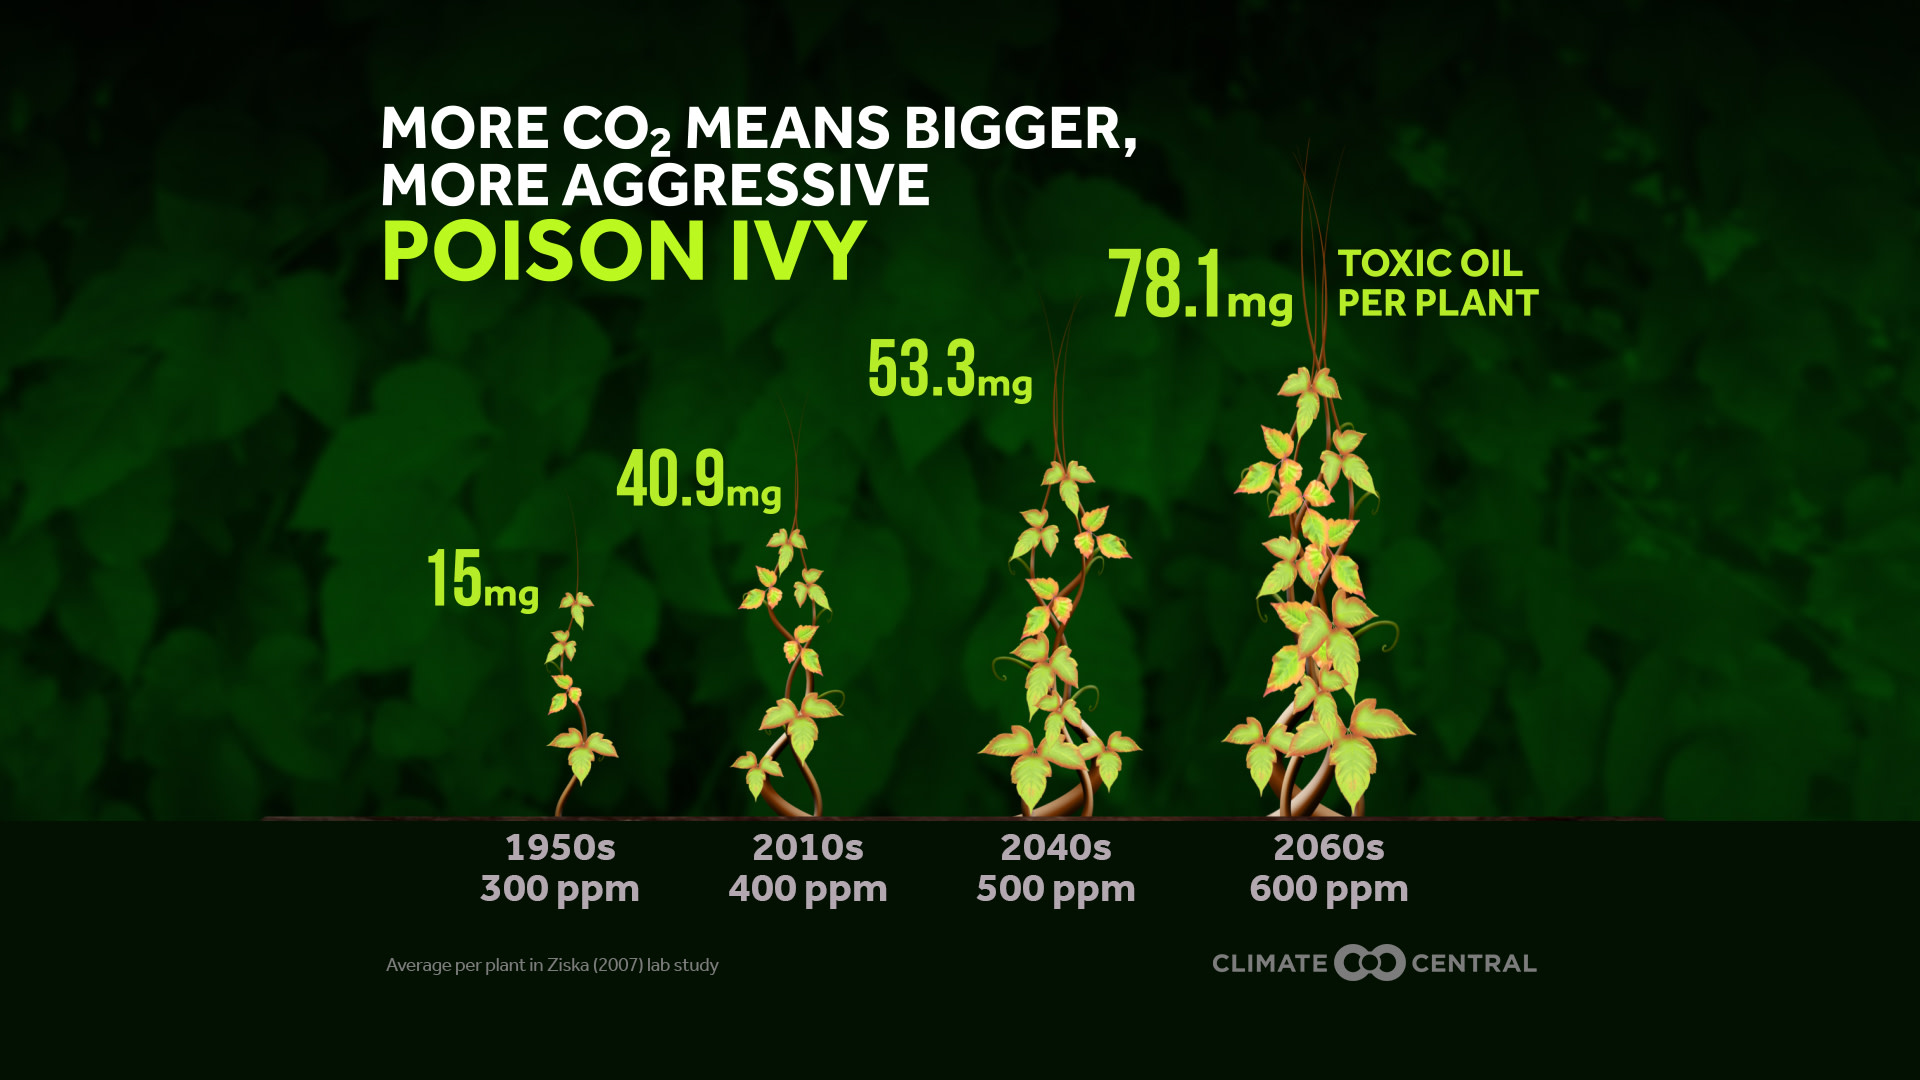
Another component of climate change, elevated levels of CO2, have been shown to stimulate the growth of larger, more toxic poison ivy plants. In order to maintain healthy ecosystems and healthy societies, we must work towards stabilizing our climate by lowering emissions.
COVID-19 cabin fever has led many Americans to venture outside moreーhitting the trails, playing at the park or enjoying the backyard. While scientists are confident that being outside reduces the risk of transmitting coronavirus, there are still some threats to be aware of when in the great outdoors. Among them are ticks and poison ivyーand both may be getting worse due to climate change.
TICKS
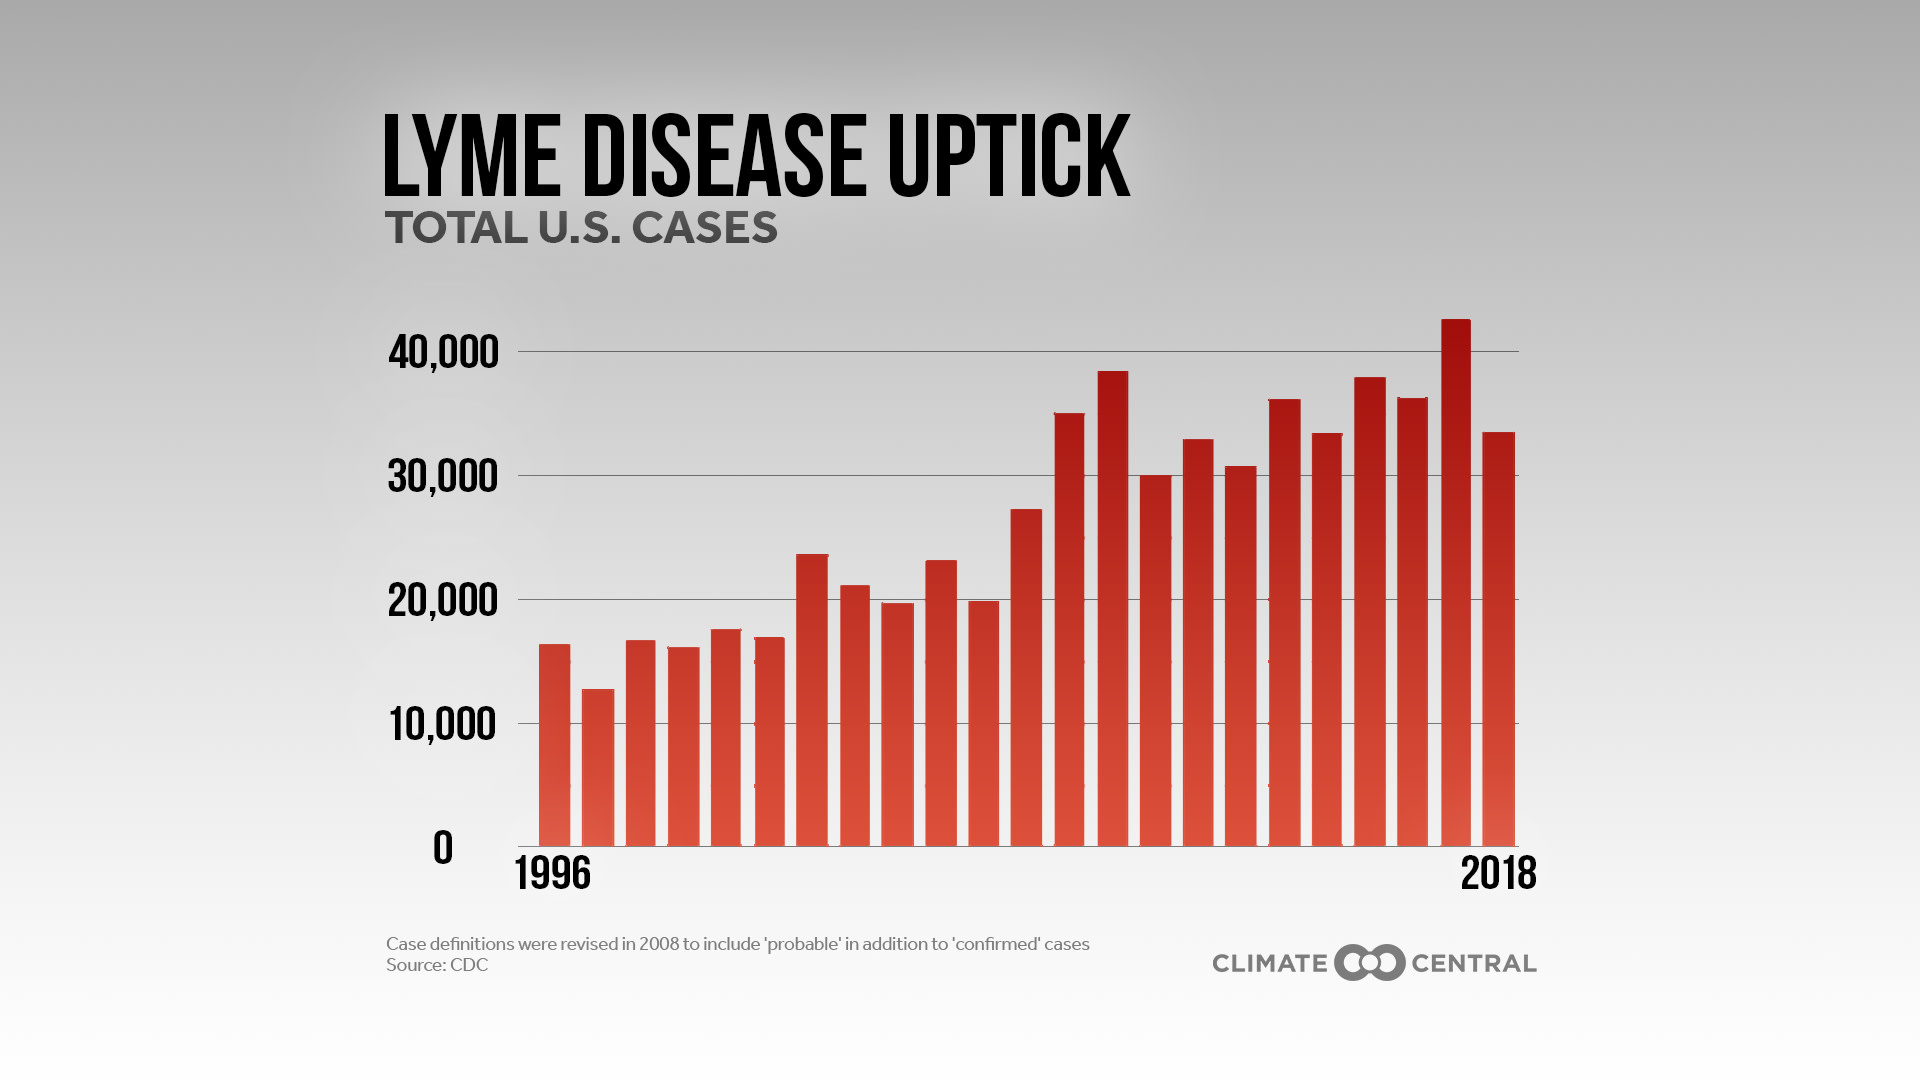
Lyme disease, an illness whose incidence has doubled over the past two decades to 30,000 cases per year, is primarily transmitted by the blacklegged tick (also known as the deer tick). This sharp uptick is attributed to a number of factors, and one of them is our warming climate. In fact, the increasing incidence of Lyme disease is regarded by the EPA as an indicator of climate change. From ticks emerging earlier in the year to multiplying faster, warming temperatures can cause changes in tick behavior that affect our risk of catching Lyme disease.
A long-term study of the blacklegged tick in New York found that rising temperatures between January and May were associated with a peak in activity that was almost three weeks earlier for juvenile ticks (the ones most likely to transmit Lyme disease). As temperatures warm, ticks are able to develop faster and emerge earlier. This doesn’t necessarily mean that ticks will stick around longer, but faster development could increase the odds of them surviving to adulthood.
Increased survival, according to another study, could allow ticks to multiply more quickly as well as spread to new areas that were once too cold.
POISON IVY
While you’re dodging ticks on your next venture outdoors, don’t forget about poison ivy! Higher levels of carbon dioxide in the atmosphere stimulate larger, more noxious growth of poison ivy (and potentially also its West Coast cousin, poison oak).
CO2 levels have risen rapidly in recent decades, which has already brought about a significant change in poison ivy plants. From around 1950 (300 ppm) to today (400 ppm), the increase in CO2 was associated with a leaf surface area more than doubling. The levels of toxic oil, known as urushiol, increased even more dramatically 一 by 173% in the same period.
While many species struggle to adapt, some (often troublesome ones like pests and weeds) find a way to thrive and overall biodiversity suffers. In order to maintain healthy ecosystems and healthy societies, we must work towards slowing change and stabilizing our climate by lowering greenhouse gas emissions.
REMEMBERING TEN YEARS OF CLIMATE MATTERS AT WLTX
Our inaugural Climate Matters meteorologist, Jim Gandy, reflects on the past decade informing audiences about climate change at WLTX in South Carolina.
POTENTIAL LOCAL STORY ANGLES
Is Lyme disease getting worse in your area?
If you’re in the Northeast or Great Lakes regions, chances are the incidence of Lyme disease has been increasing in your area. You can find state and county-level historical data on reported cases. You may not have Lyme disease in your area, but you can find out if other disease-carrying ticks have been reported in your area here. There is also a CDC press kit for Lyme and other tick-borne diseases.
Are there poisonous plants in your area?
‘Leaves of three, leave them be!’ The CDC provides much more extensive guidance about the geographic distribution of poisonous plants in the U.S., as well as tips for identifying them.
How is our changing climate affecting public health and ecosystems?
The EPA regards Lyme disease as an indicator of climate change. Check out other indicators that might be relevant to your area. Consider contacting your regional EPA office for more local information.
EXPERTS TO INTERVIEW
LOCAL EXPERTS
The Council of State and Territorial Epidemiologists (CSTE) offers many points of contact, including epidemiologists at the state, city, and tribal levels. The National Association of County Health Officials (NACCHO) has contact information for associations in all 50 states. The CDC mentions several other groups, including the Association of State and Territorial Health Officials.
The SciLine service, 500 Women Scientists, or the press offices of local universities may be able to recommend local scientists with expertise on outdoor hazards in your area. The American Association of State Climatologists is a professional scientific organization composed of all 50 state climatologists.
NATIONAL EXPERTS
Dr Richard S. Ostfeld
Distinguished Senior Scientist, Cary Institute of Ecosystem Studies
Research interests: ecology of infectious disease, tick-borne diseases, effects of climate change and biodiversity change on infectious disease
ostfeldr@caryinstitute.org
Jacqueline Mohan
Associate professor, Odum School of Ecology, University of Georgia
Research interests: role of global change on plants, soil biogeochemistry, soil microbes, insect herbivores and, in particular, terrestrial ecosystems.
jmohan@uga.edu
METHODOLOGY
Data for reported cases of Lyme disease were downloaded from the Center for Disease Control (CDC) website (limitations of these surveillance data are described here). Climate division map represents the change in average temperature since 1970 using data from NOAA/NCEI Climate at a Glance. Projected leaf area and urushiol levels of poison ivy are based on the findings of Ziska et al. (2007).