

Abstract
The changing thermal state of permafrost is an important indicator of climate change in northern high latitude ecosystems. The seasonally thawed soil active layer thickness (ALT) overlying permafrost may be deepening as a consequence of enhanced polar warming and widespread permafrost thaw in northern permafrost regions (NPRs). The associated increase in ALT may have cascading effects on ecological and hydrological processes that impact climate feedback. However, past NPR studies have only provided a limited understanding of the spatially continuous patterns and trends of ALT due to a lack of long-term high spatial resolution ALT data across the NPR. Using a suite of observational biophysical variables and machine learning (ML) techniques trained with available in situ ALT network measurements (n = 2966 site-years), we produced annual estimates of ALT at 1 km resolution over the NPR from 2003 to 2020. Our ML-derived ALT dataset showed high accuracy (R2 = 0.97) and low bias when compared with in situ ALT observations. We found the ALT distribution to be most strongly affected by local soil properties, followed by topographic elevation and land surface temperatures. Pair-wise site-level evaluation between our data-driven ALT with Circumpolar Active Layer Monitoring data indicated that about 80% of sites had a deepening ALT trend from 2003 to 2020. Based on our long-term gridded ALT data, about 65% of the NPR showed a deepening ALT trend, while the entire NPR showed a mean deepening trend of 0.11 ± 0.35 cm yr−1 [25%–75% quantile: (−0.035, 0.204) cm yr−1]. The estimated ALT trends were also sensitive to fire disturbance. Our new gridded ALT product provides an observationally constrained, updated understanding of the progression of thawing and the thermal state of permafrost in the NPR, as well as the underlying environmental drivers of these trends.
Export citation and abstract BibTeX RIS

Original content from this work may be used under the terms of the Creative Commons Attribution 4.0 license. Any further distribution of this work must maintain attribution to the author(s) and the title of the work, journal citation and DOI.
1. Introduction
Permafrost, defined as ground that remains at or below 0 °C for at least two consecutive years, covers around 16 × 106 km2 (∼12%) of Earth's land area and is primarily distributed in high latitude and altitude regions of the Northern Hemisphere (Zhang et al 2000, Obu 2021). The active layer is the near-surface layer of soil or rock that thaws and freezes seasonally on top of permafrost. The active layer affects the amount of water and heat exchange between the land surface and atmosphere, and the ecosystem that can be supported, and is therefore a key component of the cryosphere (Heijmans et al 2022). As the climate warms, thawing permafrost will increase the active layer thickness (ALT), potentially mobilizing and releasing vast amounts of soil organic carbon (SOC) sequestered over millennia in permafrost soils. The enhanced decomposition and atmospheric release of SOC in the form of carbon dioxide (CO2), methane (CH4), and other radiatively active greenhouse gases could drive a positive feedback between permafrost thaw and climate warming (Schuur et al 2015, 2022, Miner et al 2022). Concurrently, increases in ALT allow for increased rooting depth of vegetation that may lead to changes in the distribution and productivity of vegetation at high latitudes and altitudes (Song et al 2018, Berner et al 2020). Therefore, improved understanding of the spatial pattern and rates of active layer deepening, and the environmental factors influencing ALT heterogeneity, is needed to better understand the nature of permafrost-climate feedbacks affecting the rate of global warming (McGuire et al 2018), and the consequences for northern ecosystems and communities.
Regional assessments based on sparse inventory and monitoring networks indicate that the ALT varies greatly across northern permafrost regions (NPRs), ranging from about 30 cm in Arctic and subarctic regions to over 10 m in mountainous permafrost regions at mid-latitudes, and that this pattern is broadly consistent with surface air temperature and permafrost gradients (Luo et al 2016). Based on in situ active layer monitoring networks, gridded ALT maps have been produced using various up-scaling techniques (Ran et al 2022) and modeling (Obu et al 2019). While these gridded ALT maps have greater congruence in densely monitored regions, such as Alaska and northwest Canada, there are large uncertainties in more sparsely monitored regions, such as Siberia and high-elevation regions like Mongolia and the Tibetan Plateau. In addition, most current hemispheric ALT maps are produced either based on coarse climate indicators (i.e. thaw index), or modeling; thus, there is a need to better understand finer-scale variation of ALT using observationally constrained approaches in the NPR.
While there is considerable ALT variability, the nature of the ALT spatial distribution and underlying environmental drivers are uncertain due to the vast size and complexity of NPR landscapes, and relative paucity of regional monitoring sites. ALT temporal trends are even more difficult to observe because permafrost change is a subsurface phenomenon that is difficult to detect with remote-sensing techniques. However, current monitoring networks have allowed some regional and local-scale evaluations of ALT trends in North America (Smith et al 2005, Nyland et al 2021), Siberia (Romanovsky et al 2007), Europe and Scandinavia (Harris et al 2003, 2009, Isaksen et al 2007), and the Tibetan Plateau (Wu and Zhang 2008). Long-term monitoring data from these limited studies indicates a predominantly deepening ALT trend in the Arctic since the 1990s, but with marked spatial variability (Smith et al 2022). The greatest increases have been recorded in the Russian European north and western Siberia with an average increase of 1.9 cm yr−1 between 1999 and 2019 (Romanovsky et al 2019). In the Alaskan interior, the rate of ALT increase is more than 0.83 cm yr−1 from 1996 to 2019 (Romanovsky et al 2019). However, in the Alaskan North Slope and Mackenzie Valley, the trends have been more inconsistent, with ALT decreasing after a 1998 peak, and then transitioning to a slight increase since the mid-2000s (Smith et al 2022). In northern Sweden, Norway, central Svalbard, and northeast Greenland, ALT has generally increased since the 1990s at an average rate similar to the Russian Arctic, but with considerable inter-annual variation (Zhao et al 2020) and some Swedish sites have reported permafrost loss (Åkerman and Johansson 2008). Pronounced increases in ALT have also been observed in the European Alps since the 1990s, with present-day rates of ALT increase typically greater than the global average. On the Tibetan Plateau, ALT has tended to increase at a much higher rate (∼1.95 cm yr−1) than high latitude permafrost regions since 1980 (Zhao et al 2020).
Recent development of upscaled long-term gridded ALT data have also allowed for the assessment of ALT trends encompassing the entire NPR. However, these studies have often employed a relatively simple thawing index-based Stefan model or edaphic factor (E factor) method based on very coarse climate (∼0.5°) and land cover data. For example, Peng et al (2018) showed that mean ALT increased significantly by 0.057 ± 0.004 cm yr−1 during 1850–2005. Li et al (2022b) used the Kudryavtsev method and integrated various forcing data (such as temperature, snow, vegetation and soil data) to simulate changes in ALT in the NPR and found ALT increased at a linear rate of 0.86 cm yr−1 from 1969 to 2018, with the highest thickening rate in Alaska and the Mongolian Plateau (∼2.4 cm yr−1) and the lowest thickening rate in Greenland (∼0.3 cm yr−1). Li et al (2022a) reported an overall significant linear increase in ALT of 0.65 cm yr−1, with approximately 71% of the NPR showing an increase from 2000 to 2018. These studies provide useful understanding of broad regional patterns and climate impacts on ALT trends, but are generally too coarse to resolve finer landscape heterogeneity, where local terrain, soil, and vegetation features may have a larger influence on permafrost stability.
Although many studies have investigated the spatial and temporal pattern of ALT over the NPR, some inherent uncertainties exist. First, the current ALT monitoring network is spatially and temporally biased, making it hard to detect and compare long-term trends among different regions. Second, permafrost is a subsurface phenomenon and most available remote-sensing techniques are not directly sensitive to ALT and permafrost thermal states, especially at moderate to high spatial resolutions. Current assessments of regional ALT patterns generally use a thermal index based on air temperature derived indices (e.g. thawing index) at coarse resolution (∼0.5°), and thus cannot reveal the local to landscape level patterns that are more relevant to ecological and hydrological processes. Therefore, there is a need to develop higher resolution, observationally constrained ALT datasets spanning the entire NPR to better understand ALT heterogeneity in relation to climate, land cover, and other environmental factors. The objectives of this study are to: (1) develop a consistent ALT data record encompassing the entire NPR and able to resolve landscape (1 km) level heterogeneity in active layer trends, and (2) apply these data to clarify ALT trends, driving factors and associated uncertainties over the recent satellite era (2003–2020). The ALT record is derived using a data-driven machine-learning (ML) framework informed by an extensive collection of ALT measurements and ALT-related observational indicators derived from the recent satellite record.
2. Materials and methods
2.1. Overall study design
We utilized random forests (RFs) to generate a 1 km gridded annual ALT dataset from 2003 to 2020 in the NPR based on the relationship between available ALT site measurements (2966 site-years) and other supporting environmental and climate data in the NPR. We aggregated in-situ ALT measurements from four sources and used Google Earth Engine to compile satellite observations of annual gridded predictors, including vegetation, temperature, soil, and topography at 1 km resolution (Gorelick et al 2017). We created an RF training dataset by matching ALT and associated predictor variables both spatially and temporally, and selecting the top ten performing RF models. An annual ALT map for the NPR was generated using the ensemble mean of ALT from the ten best RF predictions. To understand the uncertainties from spatial sampling of ALT and RF parameter selections, we conducted an extensive uncertainty analysis. Finally, the spatial and temporal patterns, and uncertainties, of ALT from 2003 to 2020 were analyzed. We also evaluated whether the estimated ALT pattern was sensitive to fire history, which was not directly incorporated in the RF modeling, but can have an important influence on permafrost stability (Michaelides et al 2019, Li et al 2021).
2.2. In-situ ALT measurement data
We collected in-situ ALT measurement data from four different sources between 2003 and 2020, totaling 2966 site-years, including the Circumpolar Active Layer Monitoring Network (CALM, 2409 site-years; (Brown et al 2000, Nelson et al 2021), NASA Arctic Boreal Vulnerability Experiment (ABoVE) Soil Moisture and Active Layer Thickness (SMALT) data (257 site-years; (Clayton et al 2021), Arctic-boreal CO2 flux (ABCflux) Database (142 site-years; (Virkkala et al 2022), and additional ALT measurements from the Tibetan Plateau (158 site-years; figure 1) (Zhao et al 2021, Wu et al 2022).
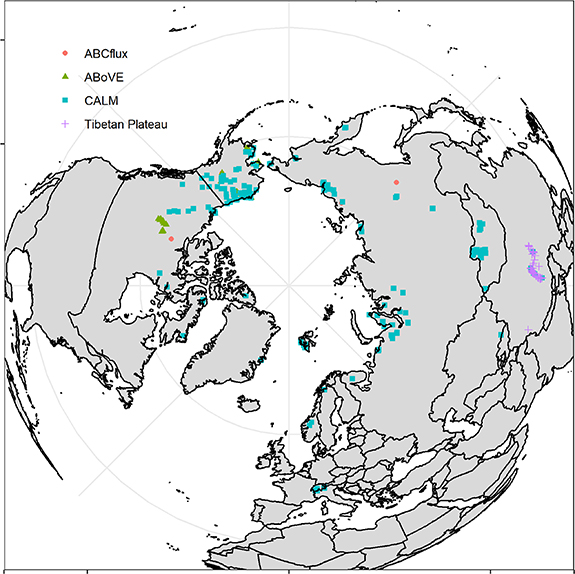
Figure 1. The spatial distribution of in-situ ALT measurements sites, with different data sources distinguished by different symbols and colors (n = 2966 site-years).
Download figure:
Standard image High-resolution imageThe CALM network is an international initiative that collects long-term, standardized ALT and permafrost-related variables at 265 sites since the 1990s. The CALM data are widely used to study and monitor regional ALT trends and are considered a valuable resource in the field of permafrost research. Details about the site characteristics, ALT measurement methods (primarily mechanical probing and some frost tubes), data processing, and standardization can be found at www2.gwu.edu and in (Brown et al 2000, Shiklomanov et al 2008), among others. The ABoVE SMALT dataset provides in-situ measurements of ALT, soil moisture (SM), and dielectric properties from boreal and tundra research sites in Alaska and the Northwest Territories in Canada. The data were collected between 2008 and 2020 and consist of 206 000 observations of ALT obtained through mechanical probing (6%) or ground penetrating radar (94%). The ALT observations were taken during the end of the thaw season in August and September and were first averaged among multiple observations per site and then among sites located within 1 km of each other. The ABCflux dataset contains a standardized monthly collection of terrestrial carbon fluxes and associated site variables for 244 sites in Arctic and boreal regions from 1989 to 2020. The data include soil properties such as soil temperature and ALT, as well as vegetation and disturbance type and micrometeorological conditions. We selected the sites and years with ALT collected near the end of the thaw season (e.g. August and September) for analysis. To supplement in-situ ALT measurements over the Tibetan Plateau, additional data were extracted from a series of published papers (Zhao et al 2021, Wu et al 2022). These data include long-term meteorological, ground temperature, SM, and soil temperature data, and have been quality-controlled from an integrated, distributed, and multiscale observation network in permafrost regions of the Tibetan Plateau.
All the compiled in-situ ALT measurements underwent screening and quality control to help ensure accuracy. Specifically, for each site, the ALT distribution was visually checked, and extreme values were excluded if they were greater than 2 standard deviations (sd) from their long-term mean. The final ALT dataset has a mean value of 122 cm and a median value of 66 cm. Only data within the 1% to 99% quantile range (27–660 cm) were retained for analysis. These data were used for RF training of the NPR-domain ALT model that was used for generating the 1 km gridded ALT annual data record from 2003 to 2020 (figure 1). Sites with at least 10 years of continuous measurement (n = 57) were used for site-level trend comparison. The in-situ ALT measurements were spatially and temporally matched with gridded environmental predictors (table 1) to create the training dataset for RF modeling (described in section 2.4.1 RF models).
Table 1. Predictor variables used for RF ALT modeling.
| Variables | Descriptions | Data source and native resolution |
|---|---|---|
| Annual thaw index (ATI) |
 Daily LSTavg is the average of daily gap-filled 1 km MODIS LSTday and LSTnight Daily LSTavg is the average of daily gap-filled 1 km MODIS LSTday and LSTnight
| MODIS land surface temperature (LST) (MYD11A1.006, 1 km), updated annual from 2003 to 2020 |
| Mean daily temperature (MDT) | Daily LSTavg is the average of daily gap-filled 1 km MODIS LSTday and LSTnight | MODIS land surface temperature, (MYD11A1.006, 1 km), updated annual from 2003 to 2020 |
| Percent tree cover | Percent of tree cover for each 1 km grid | MODIS vegetation continuous fields (MOD44B.006, 250 m), updated annual from 2003 to 2020 |
| Summer maximum NDVI | Max NDVI for June, July, and August for each 1 km grid | MODIS Vegetation indices (MOD13A2.006), updated annual from 2003 to 2020 |
| Percent surface water | Percent of surface water for each 1 km grid | Global surface water data (30 m), updated annual from 2003 to 2020 |
| Freeze/thaw timing | Day of year for spring thaw and fall freeze | AMSR daily freeze/thaw record (6 km polar-grid), updated annual from 2003 to 2020 |
| Snow phenology | Last day of spring snow off and first day of fall snow | IMS daily snow cover (4 km), updated annual from 2003 to 2020 |
| Soil organic content (SOC) | Averaged 0–3 m SOC for each 1 km grid | SoilGrids (v2.0, 250 m), time invariant |
| Soil bulk density | Averaged 0–3 soil bulk density for each 1 km grid | |
| Soil texture | Percent of sand, clay, and silt content | |
| Land cover | Primarily based on MODIS IGBP land cover, and tundra classes were added | MODIS land cover (MCD12Q1.006, 1 km) and terrestrial ecoregion map, time invariant |
| Elevation | Elevation (m) representing altitudinal gradient in climate and active layer conditions | DEM (1 km), time invariant |
| Aspect | Southness (−1, 1), higher value receives more potential solar radiation | DEM (1 km), time invariant |
| Slope | Slope (degrees) | DEM (1 km), time invariant |
| Soil moisture | Summer (JJA) soil moisture (m3 m−3) | ESA Climate Change Initiative(CCI) daily surface soil moisture (0–5 cm depth, 25 km), updated annual from 2003 to 2020 |
| Latitude | Latitude (degrees) representing the poleward gradient in permafrost distribution | Time invariant |
2.3. Satellite and other gridded environmental predictors
We compiled a suite of satellite observations of annual gridded predictors, including vegetation, temperature, soil, and topography data, to estimate annual ALT from 2003 to 2020 over a 1 km NPR grid. All data sets were resampled to a consistent 1 km (0.0083°) resolution modeling grid (continuous rasters interpolated using bilinear interpolation and discontinuous rasters using nearest neighbor methods), projected to the World Geodetic System (WGS) 1984 projection and masked by permafrost extent (table 1). Data extraction and predictions were made over the 1 km2 resolution model grid. All model predictors and subsequent ALT mapping and analysis were confined to a regional domain defined from an ancillary permafrost map from the International Permafrost Association (Brown et al 1997) and further refined by the European Space Agency's permafrost extent map (Obu et al 2019). Detailed description about the data source and processing step can be found in the supplementary text.
2.4. Geospatial modeling of annual ALT
2.4.1. RF models
To train NPR-domain models of ALT, we utilized the R package h2o (LeDell and Poirier 2020) to run a series of RF ML models. We employed a grid-search approach to explore the results of multiple RF models, trained on in-situ ALT measurements using relevant geospatial data (table 1) as model predictors. The grid-search procedure involved selecting a list of hyperparameters, which varied in terms of the number of RF trees (nt, 50, 100, or 150), the number of variables sampled at each split (nv, 2–10), and the minimum observations per leaf (no_leaf, 2–5). In total, 108 models were generated for NPR ALT predictions. We evaluated the performance of each model using random tenfold cross-validation. We used coefficient-of-determination values (R2) to compute mean and sd for each cross-validated model. We selected the ten best models for ALT based on the highest mean R2 values.
To create the final annual ALT maps at 1 km resolution, we used an ensemble approach, whereby for each year of record, we averaged the global predictions from the best ten RF models. By taking the average prediction across multiple models, ensemble methods minimize the influence of any single prediction, thereby stabilizing variation and minimizing bias that can otherwise arise from extrapolation or overfitting when using a single ML model (Sagi and Rokach 2018).
2.4.2. Uncertainty analysis
We conducted a series of uncertainty analyses to understand the effects of spatial bias in sampling and model structure (i.e. variation in nt, nv, and no_leaf), among other factors, potentially influencing the RF estimated ALT spatial pattern and trend.
To evaluate the effects of spatial bias in sampling on the ALT mean and trend, we performed a stratified bootstrapping procedure. We set the number of bootstrap iterations to 100, that is, repeating the RF models (see section 2.4.1) 100 times and randomly selecting 75% of in-situ ALT measurements with replacement for each iteration. Each of the 100 bootstrap samples were used to produce annually resolved ALT maps from 2003 to 2020 using the method described above (section 2.4.1). The RF procedure resulted in a stack of ALT mean (n = 100) and trend (n = 100) map predictions from 2003 to 2020. Finally, these 100 images of mean and trend ALT maps were used to calculate per-pixel coefficient-of-variation values (sd divided by the mean predicted value) as a measure of spatial sampling uncertainty (figures S1 and S2).
To evaluate the effects of model structural uncertainty on the mean and trends in ALT, we first randomly selected one prediction out of the ten best performing RF models for each year (n = 10) from 2003 to 2020 (n = 18 years), which resulted in a total of 1800 total possible combinations of time-series gridded ALT maps. Then, we randomly selected 100 combinations, and calculated a stack of predicted ALT mean (n = 100) and trend (n = 100) layers from 2003 to 2020. Similarly, these 100 images of mean and trend ALT were used to calculate per-pixel coefficient-of-variation values (sd divided by the mean predicted value) as a measure of model structure uncertainty (figures S1 and S2).
Finally, we combined the mean ALT layers from above (n = 200, 100 from the spatial sampling and 100 from the model structure) and calculated the spatial patterns of mean, sd, coefficient of variation, and latitudinal summary of mean ALT from 2003 to 2020 (figure 4). We combined the resulting ALT trend layers and calculated the spatial patterns of the ensemble mean, lower prediction (ensemble of 2.5% quantile), (c) higher prediction (ensemble of 97.5% quantile), sd, and latitudinal summary of the ALT trend from 2003 to 2020 (figure 5).
2.4.3. Environmental drivers of ALT mean and trend
We utilized the RF models to determine the relative importance of each predictor variable in estimating the mean and trend of ALT (Breiman 2001). Additionally, we used partial dependence plots based on RF to visualize the relationship between predictor variables and the mean and trend of ALT, while holding other predictor variables constant. This allows us to observe the marginal effect of individual predictor variables on the mean and trend of ALT, rather than the absolute value of changes. Predictor variables that have a flat response function, indicating no change in the mean and trend of ALT for a given predictor variable, are typically considered less important.
2.5. Evaluations of fire effects on ALT
Wildfire can have a significant impact on ALT in permafrost regions (Holloway et al 2020). Wildfires can increase the surface temperature and reduce insulating vegetation and soil organic layers, leading to thawing of permafrost and an increase in ALT. The increased thawing from fire can cause ground subsidence, particularly in ice rich permafrost, which can alter the hydrology and thermal balance, further affecting ALT. To assess whether our ALT predictions are sensitive to fire effects, we selected 50 000 burned pixels at 1 km spatial resolution between 2005 and 2015 using the MODIS burned area product (MCD64A1 v6, figure 2) and calculated the pre- and post-fire ALT change for different land cover types from the ALT annual time series.

Figure 2. Spatial distribution and years of burned boreal and tundra pixels that were used to evaluate estimated ALT sensitivity to fire effects.
Download figure:
Standard image High-resolution image3. Results and discussion
3.1. Spatial and temporal patterns of ALT
The cross-validation analysis indicated that the ensemble means of the ten best RF models achieved high accuracy for the ALT prediction (RMSE = 21.60 cm, bias = 4.02 cm, R2 = 0.97, figure 3(a)). Site-level paired comparisons indicated that the RF-derived ALT captured the predominant deepening trends of ALT represented from CALM site measurements (>80%, figure 3(d)). However, the RF-derived ALT data estimated a slower temporal trend of ALT deepening compared to the in-situ measurements at the higher range of observed ALT trends (e.g. trend >1 cm yr−1, figure 3(e)). Generally, the RF-derived ALT data produced higher accuracy for mean ALT than for ALT trends, suggesting the ML approach is more capable of producing central tendency than temporal trend magnitude (see section 2.4.2).
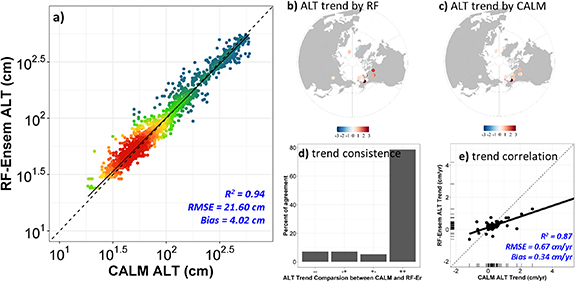
Figure 3. Point-wise site-level comparison between RF model predictions and in-situ CALM site measurements of mean ALT (cm) over the NPR domain and 2003–2020 record. The comparison was done by extracting pixel-level RF-derived ALT matching CALM site locations for each year of record. Plot (a) shows relative agreement in mean ALT (in log10 scale) between the RF ALT (RF-Ensem) and ALT measurements at the CALM site locations, where colors denote the density of site values ranging from low (blue) to high (red) and solid and dashed lines denote linear best-fit and 1:1 relationships; maps (b) and (c) show estimated ALT trends (cm yr−1, 2003–2020) at the CALM site locations derived from respective RF predictions and site measurements; bar chart (d) shows the trend consistency between RF predictions and CALM site measurements. The ++ (–) sign indicates both CALM measurements and RF predictions with positive (negative) ALT trends. The + − (− +) sign indicates CALM measurements with positive (negative) ALT trends, but RF predictions with opposing trends. Plot (e) shows correlation between trends from RF predictions and CALM site measurements.
Download figure:
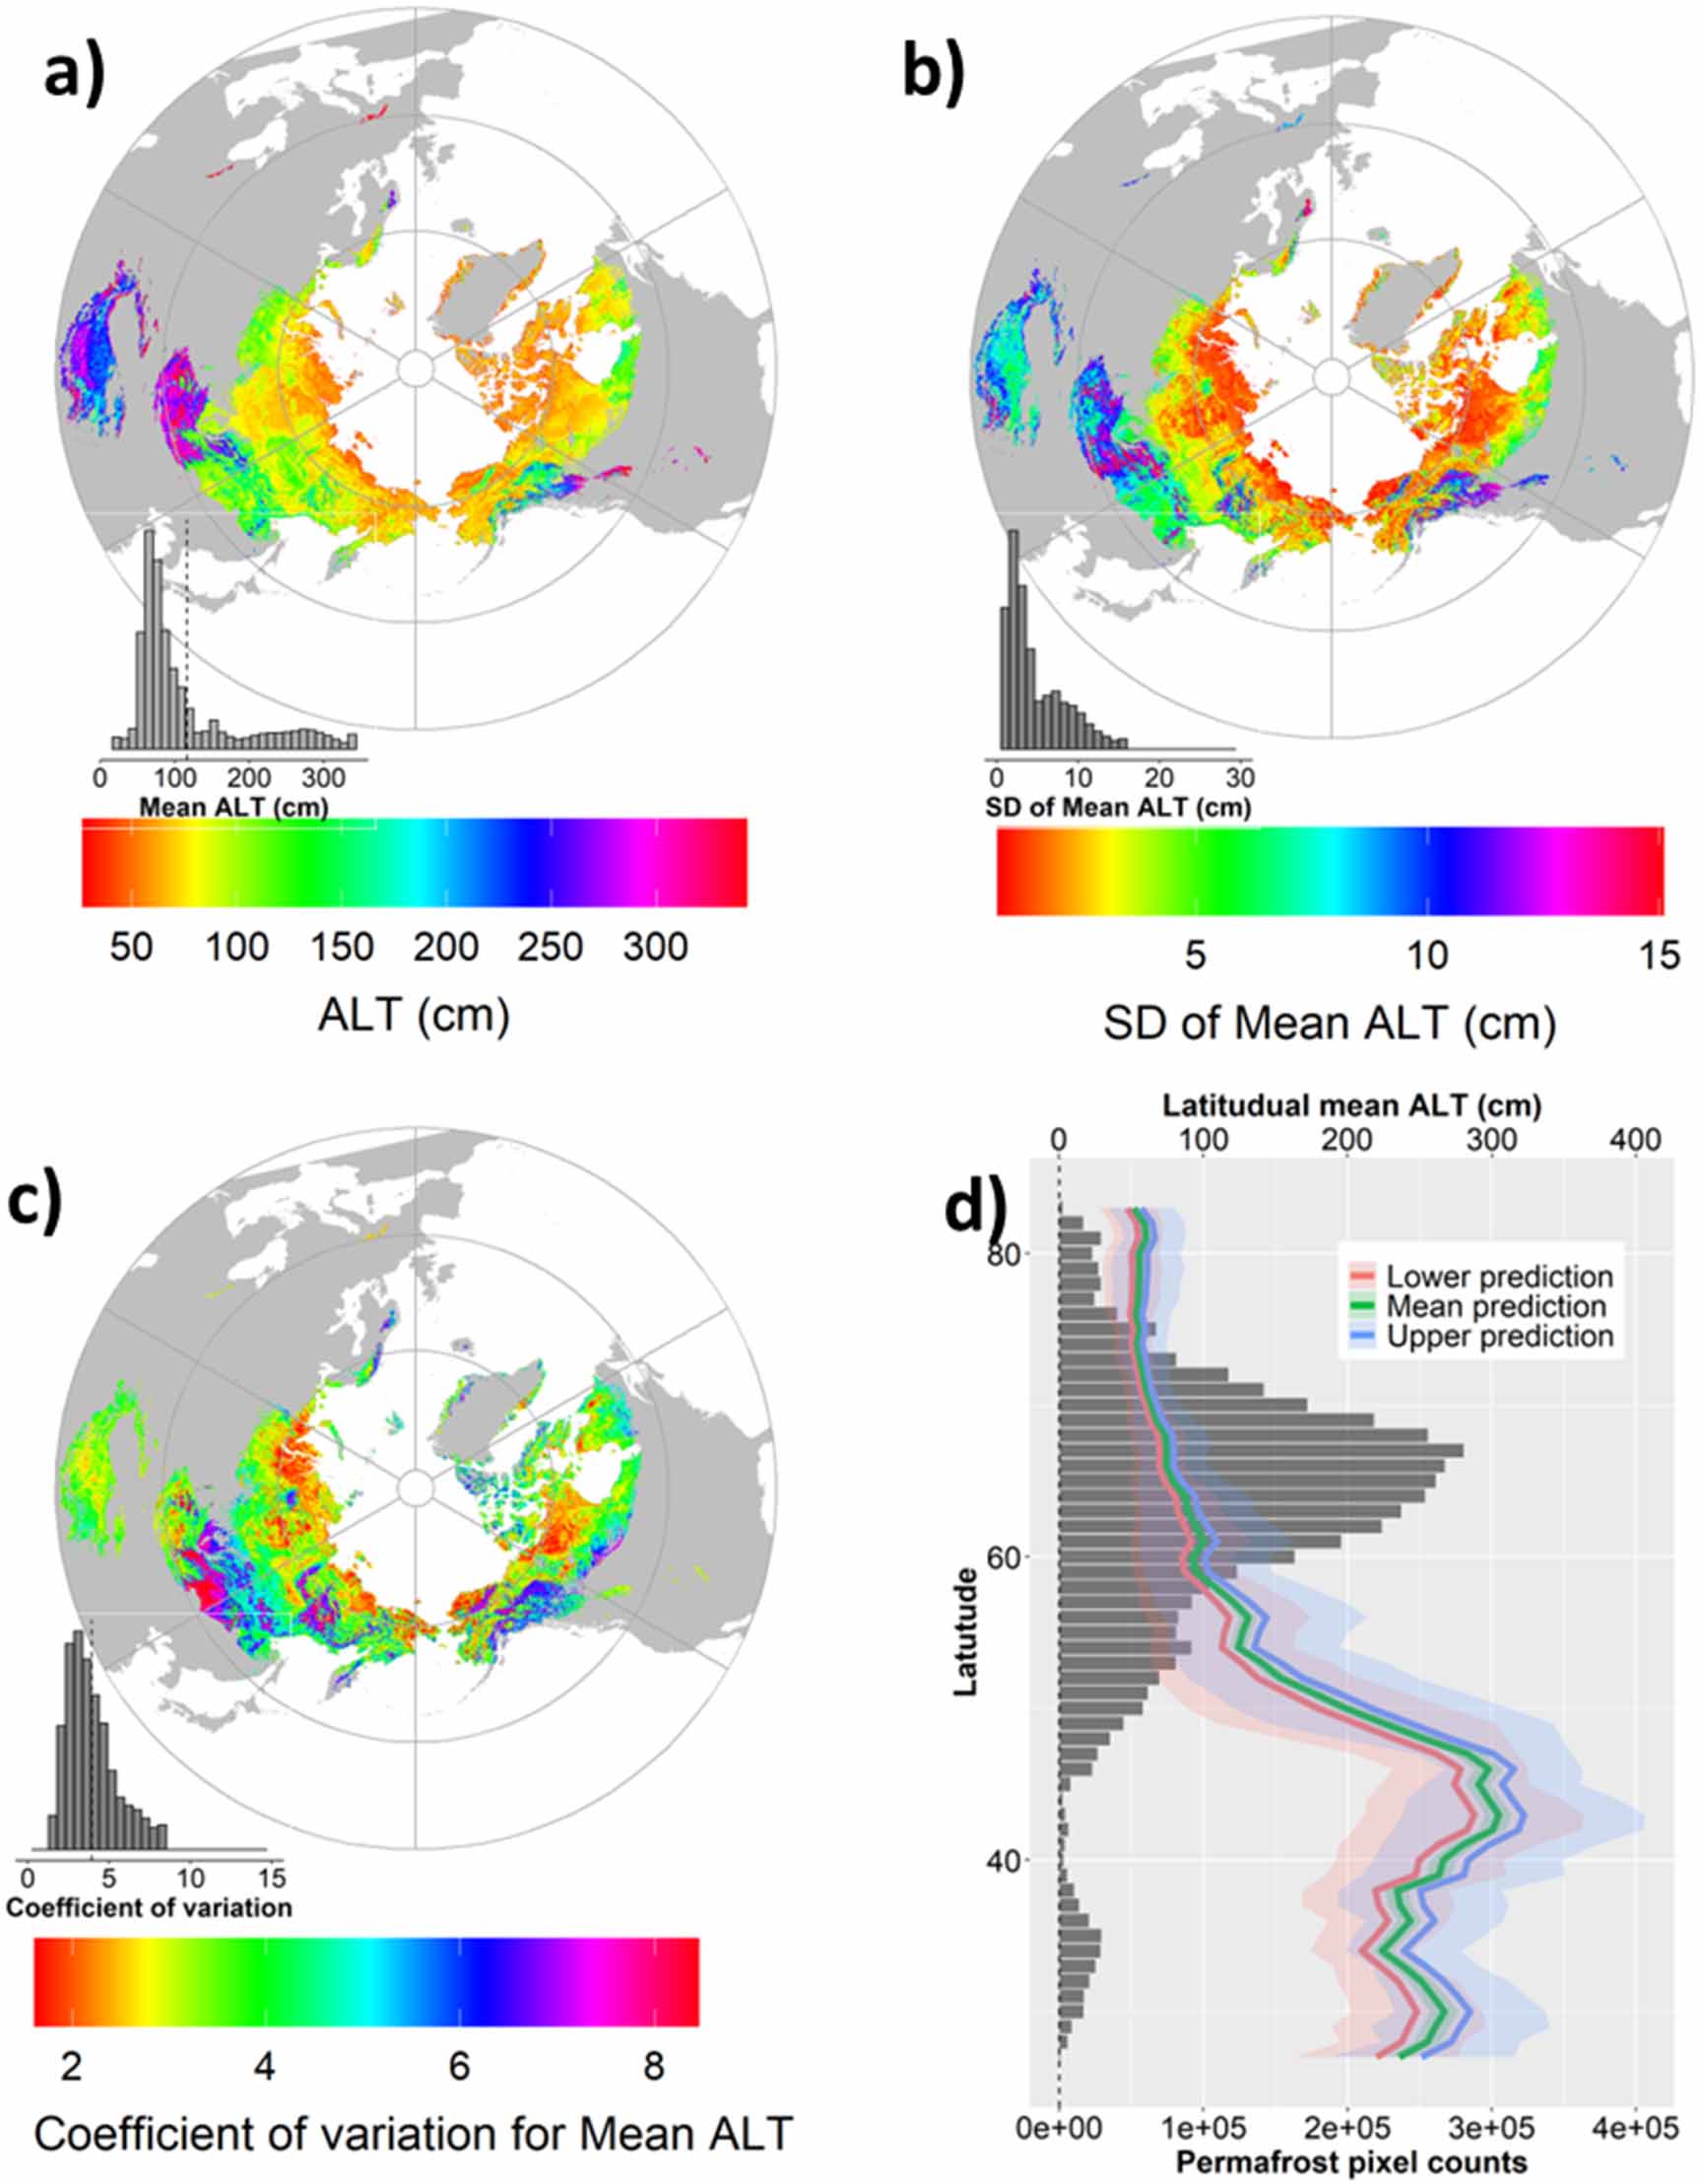
Standard image High-resolution imageBased on the ensemble RF-derived ALT data from 2003 to 2020, we analyzed the distribution characteristics of the mean and trends of ALT in the NPR. The spatial patterns of mean ALT from 2003 to 2020 revealed large landscape level variations, highlighting that coarse resolution climate-based ALT assessments do not capture the full extent of spatial variability in ALT (figure 4). The distribution of mean ALT showed a bimodal pattern reflecting distinct latitudinal and elevational gradients within the NPR. Specifically, the mean ALT is 252.3 cm (25%–75% quantile: [219.2, 293.4]°cm) in the temperate zone (25–50°N), primarily in the Qinghai–Tibet and Mongolian plateaus. The ALT rapidly decreases to 87.8 cm (25%–75% quantile: [62.7, 94.7] cm) in the region poleward of 50°N latitude, corresponding to the main discontinuous to continuous permafrost regions in the NPR. The latitudinal patterns of mean ALT were similar among different percentages of permafrost extent and similar to a recent ML derived ALT map (Ran et al 2022) and the process-model based CCI ALT map (Obu et al 2021). However, there were some differences observed in the Qinghai–Tibet and Mongolian plateaus among the different datasets. Notably, the CCI ALT map underestimated ALT in temperate high-altitude regions, such as the Qinghai–Tibet and Mongolian plateaus, relative to this study and other sources (Ran et al 2022). The results of the uncertainty analyses showed that the RF-driven ALT maps have relatively small inter-model variations, with a mean sd of 4.1 cm (25%–75% quantile: [1.7, 5.2] cm), suggesting relative high accuracy in estimating mean ALT. Higher uncertainties are mainly located in high elevation regions, such as the Qinghai–Tibet and Mongolian plateaus. However, it should be noted that spatial sampling bias had a stronger influence on the mean ALT predictions than the RF model parameters (figure S1).
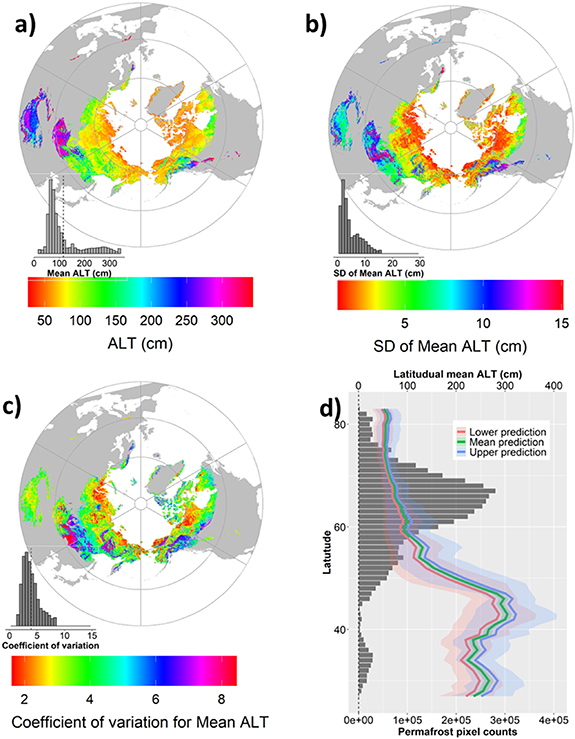
Figure 4. Spatial patterns of (a) mean, (b) standard deviation, (c) coefficient of variation, and (d) latitudinal gradient summary of mean ALT from 2003 to 2020 by RF methods (colored lines). Permafrost pixel counts within each NPR latitudinal bin denoted by gray bars in plot (d).
Download figure:
Standard image High-resolution imageSpatial patterns of the RF derived ALT trends exhibit significant variability (figure 5). Globally, about 65% of the NPR showed a deepening ALT trend, with an estimated average NPR-wide deepening trend of 0.11 cm yr−1 (25%–75% quantile: [−0.035, 0.204]°cm yr−1). The deepening trends are widespread in some regions such as the Eurasian continent, western Canada and Alaska, and the Qinghai–Tibet plateau. However, there are also areas, such as the Mongolian plateau and northeastern Canada, where a decreasing trend in ALT is observed (figure 5). The RF-derived ALT trend showed significant uncertainties, such that there is a non-significant deepening trend across all latitudes based on the ensemble mean of ALT trend maps. The uncertainties are generally smaller in the high latitude permafrost regions, and higher in the mid-latitude high elevation permafrost regions. Based on the ensemble of 97.5% of ALT trend predictions (high prediction), the ALT is deepening significantly across all latitudes, with a global mean ALT trend of 0.66 cm yr−1 (25%–75% quantile: [0.29, 0.81]°cm yr−1). However, based on the ensemble of 2.5% of ALT trend predictions (low predictions), only 12% of the NPR showed a deepening ALT trend, averaging −0.43 cm yr−1 (25%–75% quantile: [−0.63, −0.13]°cm yr−1). It should also be noted that the RF model parameters had a stronger influence on the ALT trend than the spatial sampling bias (figure S2).
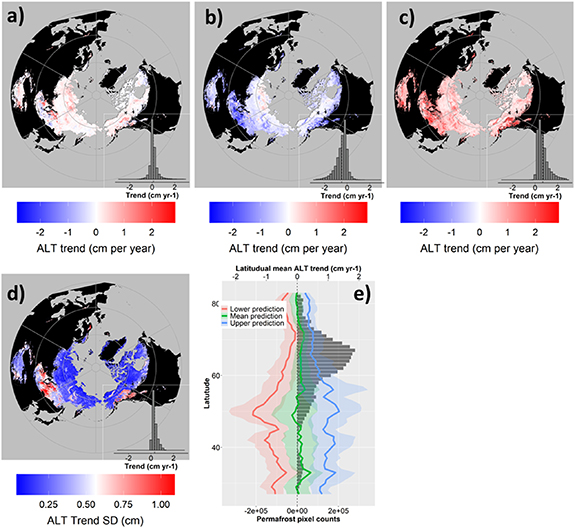
Figure 5. Spatial patterns of (a) mean, (b) lower prediction, (c) higher prediction, (d) standard deviation (SD), and (e) latitudinal summary of the ALT trend from 2003 to 2020 derived from the RF methods. Permafrost pixel counts used for latitude binning are denoted by gray bars, while the SD of trends for ensembles are represented by shaded colors in plot (e).
Download figure:
Standard image High-resolution image3.2. Environmental drivers of ALT mean and trend
Statistical output from the RF models indicated that mean ALT was collectively affected by air and soil temperature, vegetation characteristics, soil properties (such as texture and organic matter content, SM), snow and surface water cover, and topographic properties such as slope and elevation (figure 6). Over the whole NPR, the long-term mean ALT was mostly strongly affected by soil properties, followed by elevation and land-surface temperature. The strong influence of soil properties was consistent with a recent observation-based analysis (Clayton et al 2021). Specifically, mean ALT increased with the percent of silt in soil, elevation, SM, LST, SOC, and terrain slope. There was a sharp increase in mean ALT around 1500 m elevation, likely due to the strong influence from high altitude in situ measurements in the Qinghai–Tibet and Mongolian plateaus.
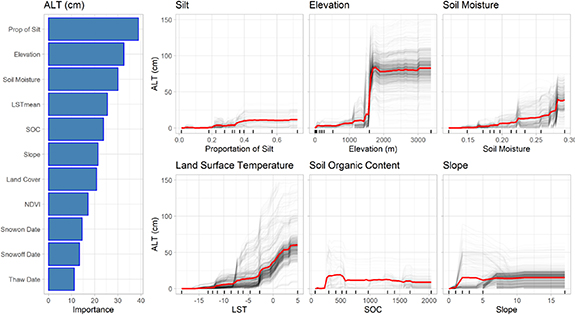
Figure 6. Factors influencing the RF-derived mean (2003–2020) ALT over the NPR. (a) The ranked importance of the top six RF predictor variables used to fit the mean ALT (at left) and their partial dependence plots. In the partial dependence plots, the red line is the partial dependence curve, showing the marginal effect of the selected predictor variable on the mean ALT prediction, averaged over all observed values of the other predictor variables. Black lines denote the individual conditional expectation curves, displaying the dependence of mean ALT on corresponding predictor variables for each pixel instance separately. Rugs on the x-axis show the deciles of the distribution of the predictors.
Download figure:
Standard image High-resolution imageOver the NPR, the temporal trend of estimated ALT (2003–2020) was strongly influenced by elevation and the rate of LST change (figure 7). The ALT trends initially decrease at higher elevations up to approximately 1500 m, but then increase at higher altitudes above this elevation threshold. Expectedly, the rate of ALT deepening was positively related to the rate of LST change, and with the timing of seasonal snow cover onset, suggestive of fall warming. Other factors had relatively minor influences on ALT trends.
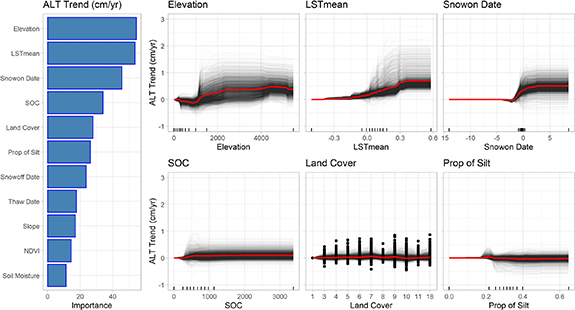
Figure 7. Same as previous figure 6, but for the ALT trend from 2003 to 2020.
Download figure:
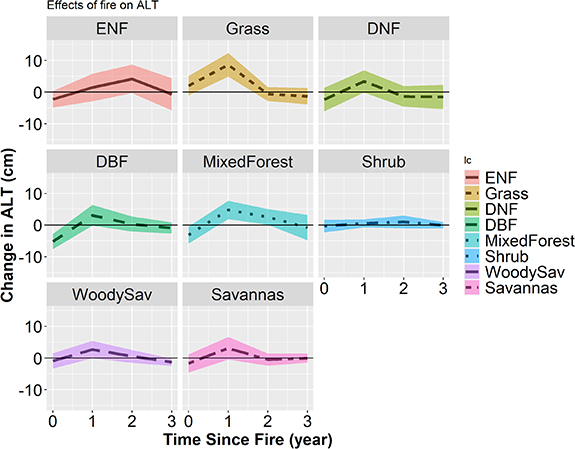
Standard image High-resolution imageWildfire can have a significant impact on ALT in permafrost regions due to its effects on surface temperature, vegetation cover and structure, and soil conditions. Generally, our RF predictions suggested a deepening of ALT one-year after fire, with the most pronounced deepening in grasslands (∼8 cm) and mixed forests (∼5 cm) in the first 1–2 year(s) following a burn event. However, the impact of fire on ALT quickly disappears after 1–2 years in our mapped product (figure 8). The rapid ALT recovery indicated from the RF predictions is similar to regional process model predictions of ALT recovery from wildfire (Zhang et al 2015) and consistent with satellite observations of land surface temperature change after fire (Liu et al 2019), but shorter than indicated from field-level measurements, partially due to highly dynamic change in soil and vegetation conditions (Michaelides et al 2019).
Figure 8. Effects of fire on pre- and post-fire ALT indicated from the RF-model predictions and the MODIS burned area record in the NPR.
Download figure:
Standard image High-resolution image
4. Discussion
4.1. Comparison with other datasets
Here we used an ML approach to produce 1°km gridded ALT layers from 2003 to 2020 based on in situ ALT network observations and a suite of observational biophysical variables. Compared to the in-situ measurements, our gridded ALT data has high accuracy for the mean ALT prediction (RMSE = 21.60 cm, bias = 4.02 cm, R2 = 0.97) and captures the predominant deepening trends (>80%) documented by CALM in recent decades across the NPR. The dataset therefore provides a comprehensive view of landscape level spatial and temporal patterns of ALT over the NPR that corresponds closely with in situ ground measurements of ALT represented from the sparse station network. Our results suggest that there are widespread deepening trends of ALT, similar to previous analyses (Park et al 2016, Peng et al 2018, Li et al 2022a, 2022b). Furthermore, the deepening ALT is broadly aligned with increases in permafrost temperature (Biskaborn et al 2019). However, there are significant variations in the rate and pattern of ALT deepening among different studies. Previous studies have suggested the ALT trend ranged from 0.057 ± 0.004 cm yr−1 (Peng et al 2018) to 0.65 cm yr−1 (Li et al 2022a) over the NPR. Based on the ensemble of RF-derived ALT predictions, our analysis suggested the ALT increased at a mean rate of 0.11 cm yr−1 over the NPR, which is within the range of reported values. The RF-derived ALT dataset showed about 65% of the NPR with a deepening ALT trend, slightly smaller than the value reported by Li et al (2022a) (71.17%). Despite uncertainties among studies, these results have unambiguously suggested widespread deepening trends of ALT and permafrost thawing due to climate warming.
At the hemispheric scale, the thermal state and regime of the active layer is primarily dependent on broad climate and permafrost patterns, so that the ALT distribution varies along latitude, altitude and regional permafrost gradients. Accordingly, the variations of ALT are most strongly correlated with near surface air and ground temperatures, especially in summer (Brown et al 2000, Luo et al 2014). In this sense, the ALT mapping based on thermal index using coarse resolution air temperature could capture the broad-scale variations of past and future change of ALT (Luo et al 2014, Park et al 2016, Peng et al 2018). However, there is a growing need to understand finer landscape-scale change in permafrost states, as this is the scale that is most relevant to ecosystem and hydrological conditions (Heijmans et al 2022, Miner et al 2022, Smith et al 2022). Therefore, our observationally constrained ALT record helps to fill a gap in understanding finer-scale ALT heterogeneity and control factors across the NPR.
4.2. Environmental controls on ALT
ALT is collectively affected by broad-scale temperature patterns as mediated by elevation and latitude, along with finer landscape level variations in vegetation, soil substrate, micro-relief, and especially SM (Smith et al 2022). Therefore, landscape spatial heterogeneity in these factors can either buffer or enhance the impact of top-down climate forcings on ALT trends. As expected, near surface air and ground temperatures have a strong influence on ALT trends, especially affected by the air temperature and its annual amplitude, and the duration of the thaw season (Brown et al 2000, Zhang et al 2005). Our study also suggested that annual mean land-surface temperature (i.e. LSTmean) and end of season temperature (i.e. snow on date) have strong influences on ALT trends. Elevation also has a strong influence, consistent with a previous analysis that found ALT in low- and mid-latitude permafrost areas of the Mongolian Plateau and Qinghai–Tibet Plateau having higher rates of ALT deepening (Li et al 2022b). Other factors, such as snow cover, vegetation, and soil conditions, also have a strong influence on ALT. For example, snow cover acts as an insulator, slowing down freeze-thaw cycles in the active layer (Romanovsky and Osterkamp 1997). Vegetation can affect ALT by altering the energy balance at the surface, modifying SM and temperature, and reducing the impact of frost heave (Chen et al 2019). Soil properties such as texture, organic matter content, and drainage can affect ALT by influencing the water and heat transfer in the soil. However, the effects of soil properties on ALT may be mediated by other influential factors. The presence of a high water table can cause the active layer to be deeper because of the heat released during the freezing of water. ALT may also be affected by terrain complexity through variations in solar loading and surface energy, and moisture; where steeper slopes tend to have deeper active layers due to increased drainage and reduced snow cover.
Wildfires are a natural disturbance in the NPR, especially in the boreal forest. However, due to a widespread trend toward warmer and drier conditions, larger and more severe fires have been observed, and fire activity is expected to increase further with continued warming (Descals et al 2022). These fires damage the protective surface organic layer (Kasischke and Johnstone 2005), which insulates the ground from warm summer air temperatures, decrease the amount of snow interception by trees, reduce the albedo at the ground surface, and lower cooling by evapotranspiration. As a result, ground temperatures and ALT increase following fires, with greater effects observed where burning is more severe and the reduction in the surface organic layer more pronounced. Our RF model captured the deepening ALT trend following fire, but the effects became nearly indistinguishable from undisturbed conditions approximately one or two years after the fire event (figure 8). The unrealistic rapid recovery estimated by the model could be because the RF models only indirectly consider the effects of fire on ALT through changes in vegetation greenness, which tends to have a more rapid post-fire recovery than vegetation structure (Jones et al 2013). Therefore, future studies should include other indicators related to changes in soil organic matter and vegetation biomass structure to better capture longer-term effects of fire on ALT (Holloway et al 2020).
4.3. Uncertainty and limitations
Although remote sensing techniques are useful in monitoring changes in land-surface indicators associated with permafrost thaw, direct in situ measurements of permafrost thermal state or ALT are still required, especially in undersampled regions with high uncertainty. Furthermore, the in situ ALT may be biased toward land cover with shallow active layers, because current methods (e.g. probe and ground penetrating radar) are harder to measure ALT with deep active layers. In this analysis, we carefully selected available remote-sensing indicators related to landscape change associated with permafrost thaw. However, to accurately monitor permafrost degradation, further development of applications that provide direct measurements of important permafrost characteristics are necessary. For instance, improved quantification of ground surface elevation and subsidence, in conjunction with thermal measurements at long-term field monitoring sites, would help establish the extent of permafrost degradation and reconcile measurements of subsidence with displacement measurements from satellite imagery analyses. New applications involving low frequency microwave (L-, P-band) remote sensing offer direct sensitivity to subsurface conditions, including ALT (Michaelides et al 2021). Lidar and interferometric synthetic aperture radar sensors can also detect surface deformation trends related to permafrost and active layer conditions (Douglas et al 2021, Xu et al 2021). These developments offer enhanced capabilities for local to landscape-level monitoring of ALT in the NPR from next generation satellites (Bartsch et al 2023) and with less dependence on sparse in situ measurement networks.
Another potential limitation in our study concerns the temporal matching of in situ data and gridded variables. Most of the in-situ data were collected at the end of the growing season when the active layer profile is more likely to be fully thawed. However, the predictors used in our models were summarized at annual or seasonal scales, which may cause a temporal mismatch between ALT and biophysical drivers. Additionally, the inherent limitation of RF modeling, like other statistical or ML approaches, may impact trend estimation. Given the wide range in the spatial distribution of mean annual ALT from centimeters to meters, and the inherent uncertainty of in situ ALT measurements used for model training, it is challenging to detect and predict trends in ALT that are often less than 1 cm or mm yr−1. Although RF is powerful in modeling complex variable interactions, it tends to capture the central tendency more than anomalous variations often associated with extreme climate events, leading to an underestimation of spatial and temporal variability, including long-term trends. This may explain why our RF-derived ALT map underestimated the trend compared to CALM measurements. Thus, our newly derived estimates provide a high spatial resolution of mean ALT, but probably provide a conservative estimate of ALT trends.
Our study provides an enhanced landscape (1°km) delineation of ALT trends over the NPR. However, significant ALT heterogeneity occurs at even finer scales on the order of meters (Streletskiy et al 2012), and below the effective grain of our model. A possible way to address this issue is to densify the in-situ measurements and conduct RF modeling at higher resolution. To demonstrate this, we ran the RF training and analysis using the regionally dense subset of ALT ground observations (∼2000 site-years) located within the NASA ABoVE extended domain (Kasischke et al 2010), along with the same set of model inputs. This ABoVE sub-region reanalysis reveals a higher spatial heterogeneity in both the mean and trend of ALT (figure S3). Furthermore, this more regional focused analysis also reveals more subtle controls on the mean and trend of ALT (figures S4 and S5).
5. Conclusion
In this study, we used an ML approach to create 1°km gridded ALT layers from 2003 to 2020 by combining extensive in situ ALT observations (n = 2966 site-years) with a suite of observational biophysical variables. Our ML-derived ALT record showed high accuracy (R2 = 0.97) and low bias when compared to ALT measurements from sparse NPR monitoring sites. RF analysis revealed that the predicted ALT was primarily influenced by soil properties, followed by elevation and land-surface temperature, which is consistent with previous research (Atchley et al 2016). We found a widespread ALT deepening trend over about 65% of the NPR. The ALT has thickened at a mean rate of 0.11 cm yr−1 over the NPR in the last two decades. The estimated ALT trends were sensitive to initial fire disturbance impacts represented from satellite derived burned area records even though fire was not directly represented as a model predictor. Our results, together with others, highlight the vulnerability of permafrost to climate warming and other environmental drivers, as well as the widespread deepening in ALT. Our high-resolution ALT data, constrained by observations, provide an updated understanding of the progression of thawing and the thermal state of permafrost in the NPR, and the environmental drivers of these trends. Our open-source dataset provides a high-resolution temporally resolved baseline diagnostic for rapid environmental change that will facilitate other studies and ultimately help advance our understanding of rapid change occurring across the high Arctic.
Acknowledgments
Portions of this work were conducted at the University of Montana with funding provided from NASA (80NSSC19M0114, 80NSSC22K1238). J D W, S N, B R acknowledge funding from the Gordan and Betty Moore Foundation (Award 8414).
Data availability statement
All data analyzed in this study are publicly available. MODIS data can be found at LP DAAC (https://lpdaac.usgs.gov/). The ESA soil moisture and permafrost extent data can be found at the ESA Climate Change Initiative website (https://climate.esa.int/en/). Soil data can be found at the soil grid website (https://soilgrids.org/). The dataset can be viewed at https://liuzh833.users.earthengine.app/view/altv1 and downloaded from Zenodo (10.5281/zenodo.10070610).
Conflict of interest
The authors declare to no conflict of interest.
Supplementary data (1.7 MB DOCX)