


By Rick Schuman, VP, Public Sector Americas (rick@inrix.com)
This is the fourth edition of a weekly review of changes in road traffic demand in the United States from the COVID-19 virus spread and our collective response.[1] We will endeavor to publish this Synopsis every Monday for the foreseeable future, providing results through Friday of the previous week. For those interested in detailed information with daily updates, we have introduced the INRIX Traffic Volume Trends Dashboard.
Key Findings
- Travel declined for the 4th consecutive week, but passenger travel showed signs of stabilizing
- Nationally, when compared to typical travel,[2] Week 4 (Saturday, April 4 – Friday, April 10) saw:
- Personal travel down 48% vs. 47% in Week 3, with work week totals nearly identical
- Long haul truck travel down 9.6% vs. 6.4% in Week 3
- Local area commercial travel down 16% vs. 11% in Week 2[3]
- Travel decline leaders in Week 4:
-
- Statewide Personal Travel: Hawaii down 61% vs. 62% last week (slightly more than New Jersey)
- Statewide Long Haul Truck Travel: Michigan down 33% vs. 31% last week
- Metro Area Personal Travel: New York City down 63% vs. 66% last week
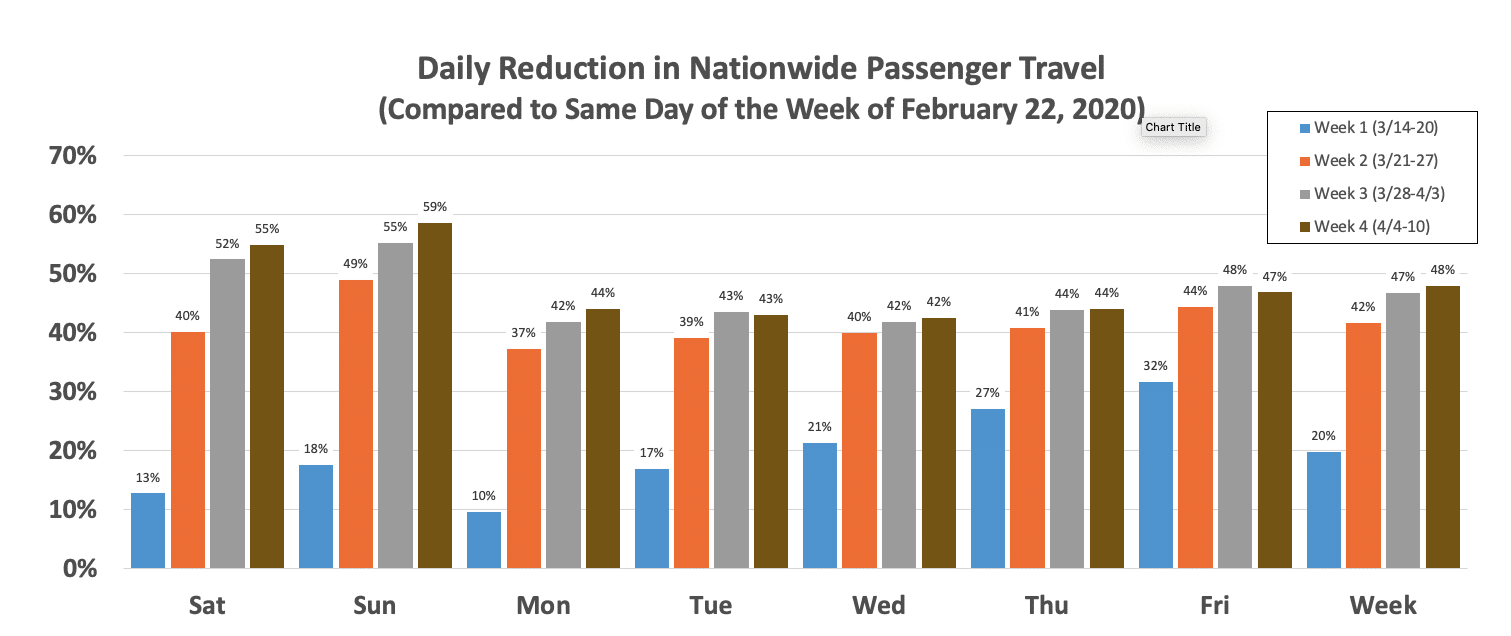
Figure 1
Background
Our incoming data sources (The ‘INRIX Fleet’) provides anonymous speed/location reporting to us in real-time and generates over 100 million trips, traveling over 1 billion total miles per day across the US. The INRIX Fleet provides information about all roads in the national network, not just major roads and spans the full range of vehicle types: consumer vehicles, local fleets, long haul trucks.
We have re-purposed our INRIX Trips metadata – with only a 48-hour lag – to generate relevant summary level information about traffic demand.[4] In this extraordinary time, we hope that this information will be useful to policy makers and the public. We look forward to the week, hopefully soon, when we can report on congestion and volume growth – as this will be a sure sign of recovery.
Synopsis
It has been four full weeks since travel began its noticeable decline nationwide. Figure 1 details the daily change in passenger vehicle travel since Saturday, March 14, showing the reduction in travel as compared to the control week of February 22, 2020. Figure 1 also includes the overall weekly comparison. Passenger travel has continued to drop overall, down 48% in Week 4, but only 1% lower than Week 3. This may mean that the travel decline at the national level may be bottoming out.
State Level Passenger Travel changes were mixed. 28 states increased travel in Week 4 compared to Week 3, with nine states increasing travel 3% or more. Most of these states are in the upper Midwest or mountain west. Eight states also decreased travel 3% or more compared to Week 3, most in the southeast or far west. Table 1 lists the states with 3% or greater change from last week.
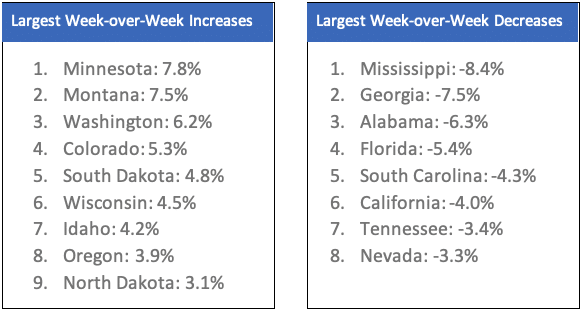
Table 1 – States with 3% or More Change in Passenger Travel in Week 4 as Compared to Week 3
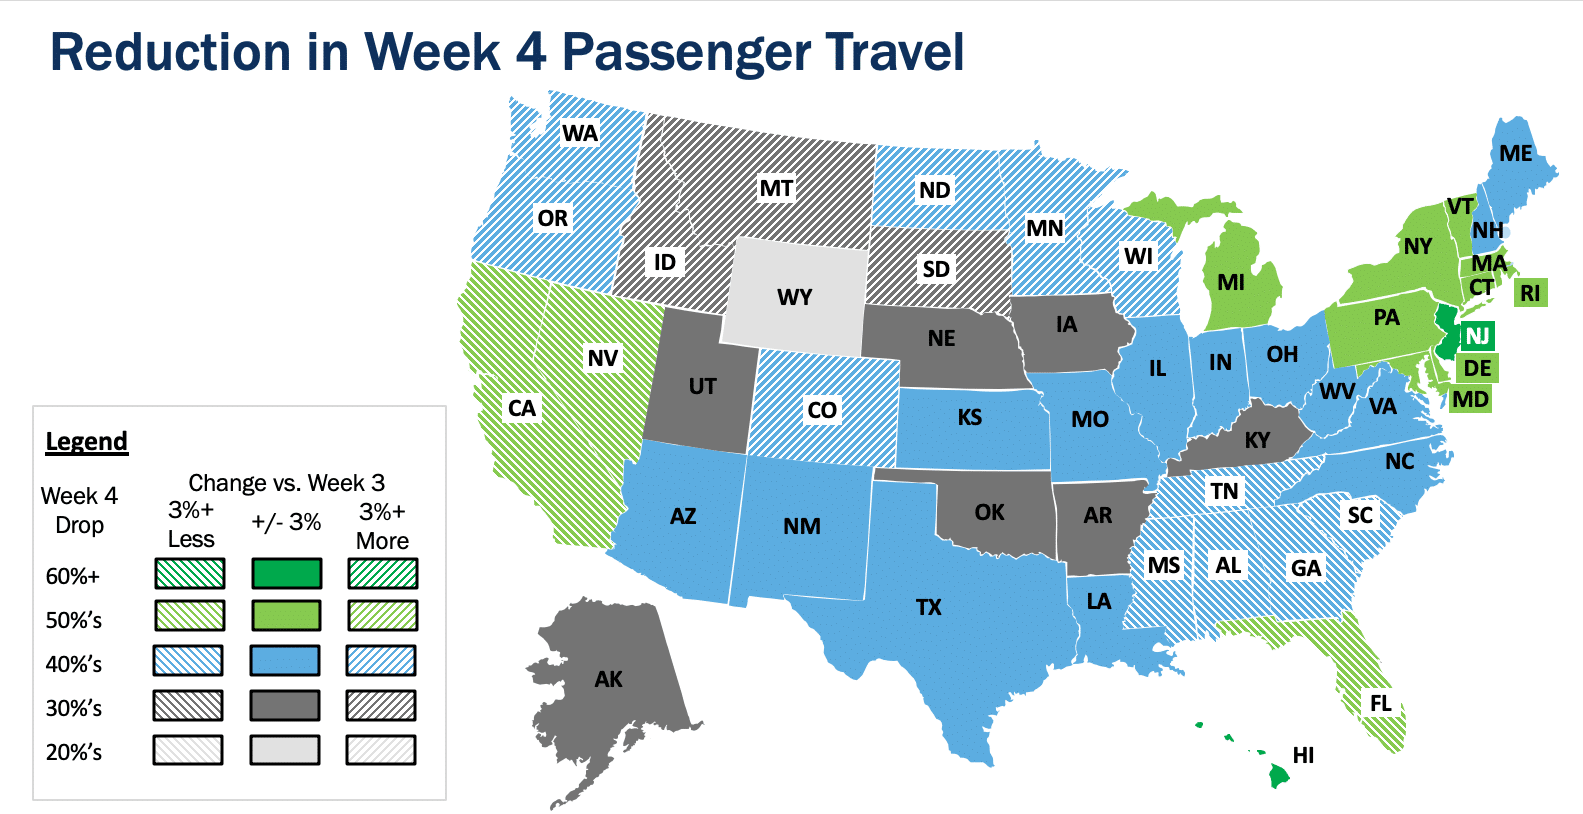
Overall, all states but one, Wyoming (24%), had declines over 30% from the control week. Two states had over 60% declines – New Jersey (61%) and Hawaii (60.9%) – 12 other states had over 50% declines, 25 more states had more than 40% declines, and the remaining ten states had over 30% declines. Figure 2 shows each states decline from the control week (color) and if there has been a week-over-week change up or down of 3% or more (shading).
Figure 2 – State Changes in Passenger Travel; Color shows decline from Control Week, Shading shows change from Week 3
Nationwide Long Haul Truck travel continues to decline in Week 4, down 9.6%, compared to 6.4% last week. Fifteen spread across the country had greater than 10% reductions from the Control Week, an increase from five states last week. Michigan continued with the largest drop, now 37%, still more than double Kentucky’s 18% drop, which is the second most nationally.
Metropolitan Area[5] travel stabilized this week. Across the 98 metropolitan areas we are tracking in this Synopsis, total travel declined 51% in Week 4 as compared to the control week, versus 50% in Week 3. Table 2 lists the ten areas with the most and the least travel declines from the control week.
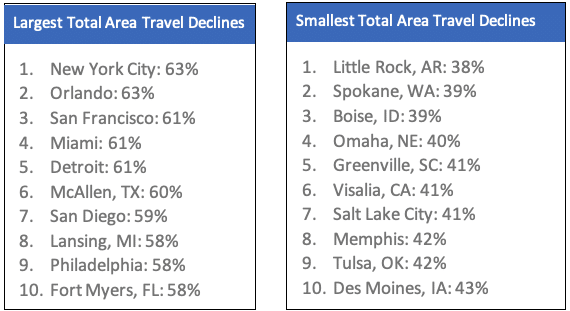
Table 2 – Metropolitan Areas with the Most and Least Passenger Travel Declines from the Control Week
When comparing week on week, the 24 areas with the largest decline from Week 3 were all in the southeast or California. Nine of the areas are in Florida (including the largest drop of nearly 10% in Daytona Beach), five are in California, three in South Carolina, two each in Georgia, Tennessee and Alabama, and one in Mississippi.
[1] Previous Issues can be found on the INRIX Blog site
[2] Given the day of week pattern of travel demand, we compare a given day and area to the same day/area in a previous week, and we are using the week commencing Saturday, February 22, 2020 as our ‘control week’
[3] Week 3 Local Fleet data had some anomalies, so comparing to Week 2 in this case
[4] Metadata used is total trip distance of all INRIX Trips originating in the country/state/region each day
[5] INRIX has established 98 metropolitan area geographies for internal purposes; these are the areas used in this analysis