Article

Biomat Resilience to Desiccation and Flooding Within a Shallow, Unit Process Open Water Engineered Wetland

1
Department of Civil and Environmental Engineering, Colorado School of Mines, Golden, CO 80401, USA
2
Re-Inventing the Nation’s Urban Water Infrastructure (ReNUWIt) NSF Engineering Research Center, Stanford, CA 94305, USA
3
Department of Geography and Environmental Engineering, United States Military Academy, West Point, NY 10997, USA
4
Hydrologic Science and Engineering Program, Colorado School of Mines, Golden, CO 80401, USA
*
Author to whom correspondence should be addressed.
Water 2021, 13(6), 815; https://doi.org/10.3390/w13060815
Submission received: 24 February 2021 / Revised: 12 March 2021 / Accepted: 12 March 2021 / Published: 16 March 2021

Abstract

:
Projections of increased hydrological extremes due to climate change heighten the need to understand and improve the resilience of our water infrastructure. While constructed natural treatment analogs, such as raingardens, wetlands, and aquifer recharge, hold intuitive promise for variable flows, the impacts of disruption on water treatment processes and outcomes are not well understood and limit widespread adoption. To this end, we studied the impact of desiccation and flooding extremes on demonstration-scale shallow, unit process open water (UPOW) wetlands designed for water treatment. System resilience was evaluated as a function of physical characteristics, nitrate removal, photosynthetic activity, and microbial ecology. Rehydrated biomat that had been naturally desiccated re-established nitrate removal consistent with undisrupted biomat in less than a week; however, a pulse of organic carbon and nitrogen accompanied the initial rehydration phase. Conversely, sediment intrusion due to flooding had a negative impact on the biomat’s photosynthetic activity and decreased nitrate attenuation rates by nearly 50%. Based upon past mechanistic inferences, attenuation potential for trace organics is anticipated to follow similar trends as nitrate removal. While the microbial community was significantly altered in both extremes, our results collectively suggest that UPOW wetlands have potential for seasonal or intermittent use due to their promise of rapid re-establishment after rehydration. Flooding extremes and associated sediment intrusion provide a greater barrier to system resilience indicating a need for proactive designs to prevent this outcome; however, residual treatment potential after disruption could provide operators with time to triage and manage the system should a flood occur again.

Graphical Abstract

1. Introduction

Existing water and wastewater infrastructure in the United States and beyond is collectively nearing the end of its projected lifespan and was not designed to address uncertainties and stressors associated with the impacts of climate change. Of particular concern is the magnitude and frequency of hydrologic extremes. For example, flows estimated for 200-year floods are expected to increase while the timing between such events should decrease [1,2]. Increases in runoff associated with melting snowpack may further intensify the potential for flooding and shift timing from historic norms [3]. Similarly, climate change is expected to impact the regional frequency and severity of droughts [4]. The changes in flow, timing, and intervals from the historic norms will require increased technological flexibility within our water infrastructure.
System resilience, or the capability to “return to some form of normal condition after a period of stress” [5], can be challenged by these and other natural and anthropogenic disruptions [6]. Analogously, the capability of a microbial community to respond to a disturbance has been described as “community stability,” which is further delineated as “resilience” and “resistance” with resilience defined as the rate at which a microbial community returns to its previous condition, while resistance describes the community’s ability to avoid change as a result of the disturbance [7,8]. The terms occur on differing time horizons with resilience being evaluated over a longer term than resistance. In the broadest sense, a disruption can be defined as a causal event that impacts the operating conditions within a technology or, if the technology is reliant on microbes, the environment in which a microbial community functions [7]. Whether these disruptions are due to altered historic flow patterns from a change in climate patterns, increasing demand due to population growth, aging infrastructure, or a specific element of the design, they collectively add new and unforeseen demands on municipalities and service providers while highlighting the need for assessing and developing robust technologies that can improve the resilience of our water infrastructure [9].
Reliability and resilience of engineered systems such as those employed in water treatment are ensured through proactive design coupled to active monitoring and management [10]. Common principles include physical and functional redundancy, the capability to absorb a specified magnitude of disruption, and repairability when performance is altered [11]. Concerns about the capability of innovative, naturally inspired, passive water treatment systems to provide the same levels of protection may provide a barrier to their adoption [12]. However, the concept of resilience can be seen throughout the natural landscape. Natural wetlands have been described as a sort of “sponge” that tempers water uptake and release while supporting ecosystem services that include wildlife and plant habitat, water purification, storage, groundwater recharge, and flood mitigation [13]. Alteration of watershed permeability through the destruction of natural wetlands has magnified the damage caused by flooding in urban areas such as Houston, Texas [14]. Analogous impacts in the U.S. can be seen in areas such as San Antonio, Texas and Dubuque, Iowa where the decrease in permeable surfaces due to urbanization has resulted in increased stormwater flows and associated damages and costs [15].
The design and construction of naturally-inspired systems such as engineered wetlands, aquifer recharge, and biofiltration hold promise in this domain with further potential for synergistic water treatment [16,17,18,19]. Engineered wetlands have become increasingly prevalent in recent decades for water and wastewater treatment and storage with three primary design types: free water surface (FWS), horizontal subsurface flow, and vertical flow wetlands [20]. A variation on these more traditional constructs, the shallow, unit process open water (UPOW) wetlands was initially designed as a novel, macrophyte free variation of an FWS wetland to be used within a modular system to complement more conventional engineered wetlands by attenuating trace organic contaminants through photolysis [21,22]. This is achieved through design parameters that include a shallow, clear water column of approximately 20 to 30 cm, comparatively modest retention times (e.g., <2 days) with limited turbulence, and a liner or barrier that prevents rooting plants [17]. Importantly, the absence of emergent plants such as bullrush and cattails enhances light intensity in the water column with implications for enhanced photolysis of trace organics. The design also addresses the challenge of preferential flow paths associated with plant growth that can shorten bulk hydraulic residence and by extension, limit treatment efficiency in vegetated systems [17,23]. Natural colonization of a photosynthetic benthic biological mat further degrades trace organic compounds as well as attenuates nitrate at rates that compare favorably to other wetland designs [22,24,25].
In building upon past work that has demonstrated the treatment promise of this engineered wetland construct, the objective of our present study was to assess the resilience of the UPOW wetland photosynthetic biomat to precipitation extremes of desiccation and flooding. A series of adjacent demonstration-scale outdoor systems at the Orange County Water District’s (OCWD) Prado Wetlands near Corona, California provided a unique and relevant venue for the work. Experimental variables capitalized on a synergy of intentionally manipulated and unplanned disruptive climatic events within this Mediterranean climate. For the former, the flow to a set of operational field cells was ceased prior to planned maintenance and the biomat dried by natural evaporative processes. For the latter, winter rainy season precipitation extremes resulted in high flows within the Santa Ana River that in turn breached a levee that normally regulated flows into the engineered wetland system; this resulted in inorganic sediment intrusion and widespread destructive flooding throughout the engineered wetland. After the flood, the flow from the river was cut off to enable system maintenance and recovery during which time the cells were naturally air dried and sediments harvested from the system for experimentation.
We hypothesized that the resident photosynthetic biomat would exhibit both operational resilience and ecological resistance in response to these disruption extremes. To assess this outcome, biomat-associated material was harvested after each form of disruption. The materials were then studied using batch and flow-through experiments in the laboratory. The physicochemical attributes of the sediments were contrasted across the impacted and undisrupted systems. Operational resilience, or the capability of this treatment system to rebound from these perturbations [5,6], was assessed as a function of nitrate attenuation rates and benchmarked by diel pH and dissolved oxygen (DO) cycling associated with photosynthesis. Ecological resistance was evaluated as the ability of the microbial assemblage to maintain its original composition after being disturbed. In doing so, we evaluated impacts on the microbial system in particular, and the output of the engineered system as a whole, to better assess the potential limitation of resilience in engineered wetland adoption as a more prevalent component of our nation’s water infrastructure.

2. Materials and Methods
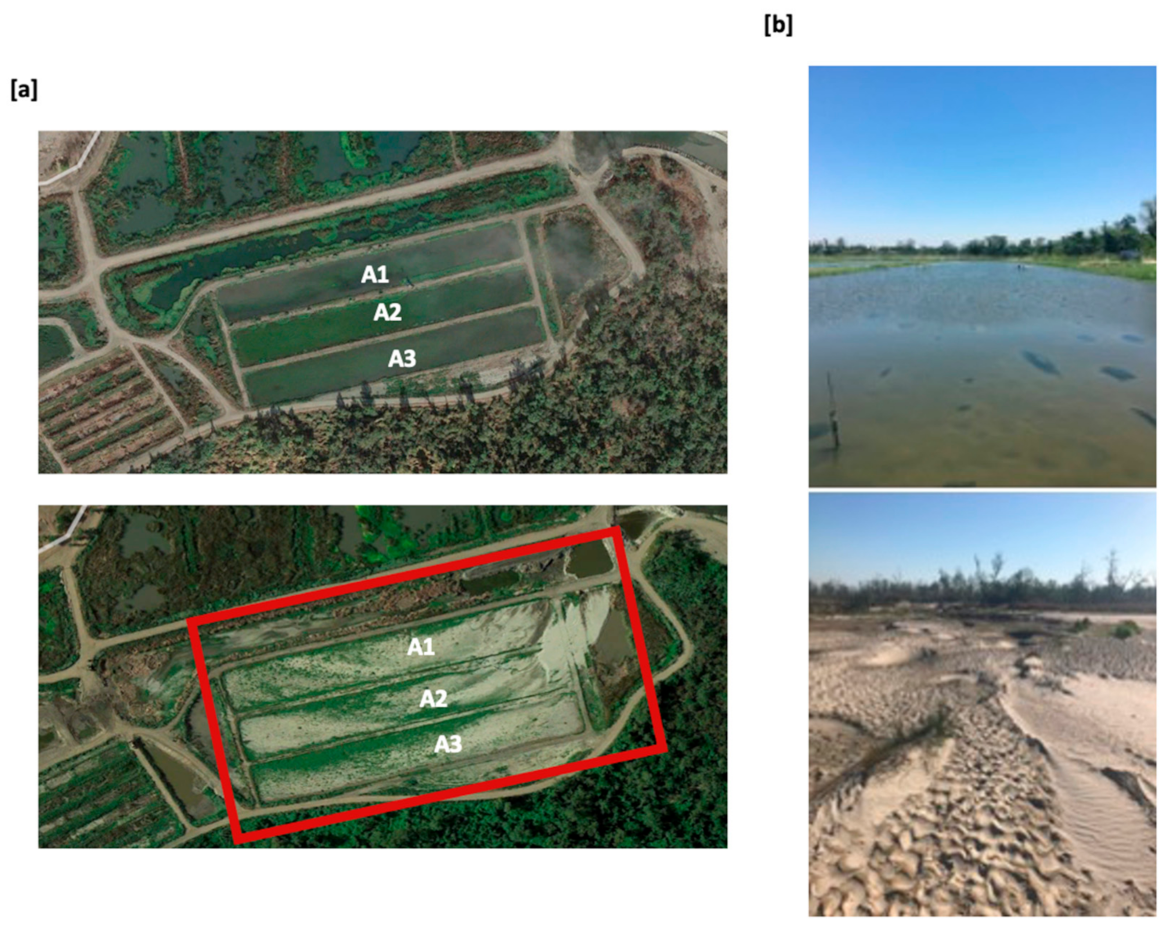
2.1. Field Systems

Multiple demonstration scale UPOW cells have been established within the larger OCWD Prado Wetland footprint located in Corona, California. The wetlands (~180 ha total) are fed by waters diverted from the Santa Ana River, which is dominated by treated wastewater effluent during base flow (24). Three large demonstration scale UPOW cells (30 m × 300 m × 0.3 m, ~0.9 ha each, hereafter referred to as “Big Bubbs”) were in operation for nearly 5 years (December 2013–February 2019) and located within the larger wetland’s footprint. Past studies in these cells chronicled establishment, maturity, and functionality of the microbial community as well as system performance, maintenance needs, and the effects of season and hydraulic residence time on nutrient and trace organic compound attenuation [22,25,26]. Biomat harvested from the Big Bubbs underwent study in association with a catastrophic flooding event in early 2019 as described later.
Based on the success of these larger demonstration scale systems, a smaller field system was constructed in 2017 using the same source water (Santa Ana River) to evaluate other variables such as mixing on UPOW wetland performance. This system of eight wetland cells, each measuring 3 m × 30 m × 0.3 m (hereafter referred to as “Little Bubbs”), was in operation for approximately 15 months (June 2017–September 2018) across two summer growing seasons. In September 2018, the cells were isolated from flow and dried through a combination of draining and evaporation. The cells then underwent planned maintenance and were brought back online in the fall; however, in February 2019 the Little Bubbs were destroyed by the flood event. They were then re-established in the summer of 2019 as fresh/nascent cells. Dried biomat was harvested in October 2018 from two parallel Little Bubbs cells for the desiccation experiment described later.
Within these studies, biomat was temporally characterized as nascent (early colonization), mature (fully colonized), and flood-impacted. Based upon past ecological analyses [25], we operationally defined nascent biomat as that which had grown in a freshly established cell for less than 6 months. Mature biomat was defined as biomat that had undergone a complete growing season. Mature biomat was collected from before (January 2019, Big Bubbs) and after (July 2020, Little Bubbs) the flooding event.

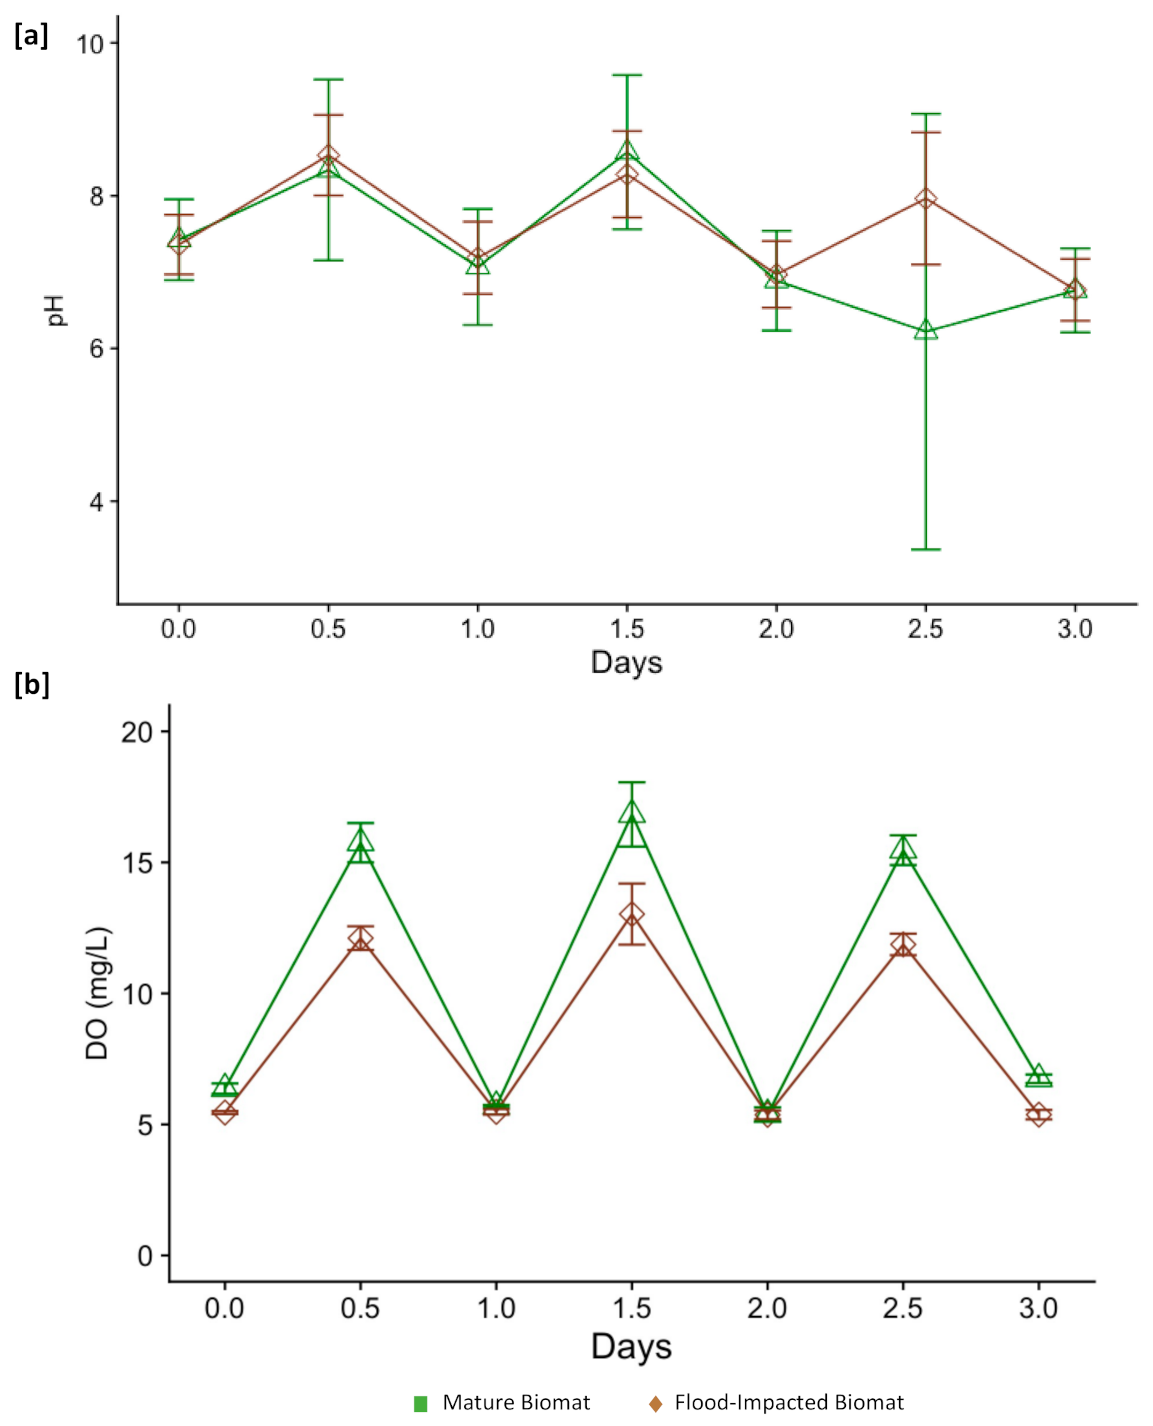
2.2. Flood-Impacted Batch Microcosms

Batch microcosms were created using biomat collected from the Big Bubbs in January 2019 (mature; harvested shortly before flooding) and March 2019 (flood-impacted). Samples were stored in the dark at 4 °C for approximately 5 months prior to beginning the experiment. Due to the unexpected flooding impacts on the Prado Wetlands, these older archived biomat samples were used, although this storage time could have impacted the performance of the mature biomat. While this storage window has implications for the performance and ecology of these laboratory microcosms, it provided an appropriate control to query disruption. Flood-impacted samples encompassing the entire stratification of the biomat and introduced sediments were collected from areas still saturated with water approximately four weeks after the flood event. At this point the water column was mostly absent though depressions maintained modest quantities of standing water. Triplicate microcosms for each condition consisted of ~115 g (flood-impacted) or ~94 g (mature) of sieved (6-mesh) harvested biomat/sediments combined with 150 mL of filter sterilized (0.2 µm) analogue water based on Prado Wetlands influent (Table S2) [27], and were constructed in 250 mL borosilicate beakers. Following a five-day acclimation period in which microcosms received 15 mg/L-N as NO3 and evaporative losses were compensated with supplemental MilliQ water, each microcosm was spiked to an initial concentration of 30 mg/L-N as NO3. The microcosms were partially submerged in a water bath acting as a heat sink with an average microcosm temperature of 21 ± 0.8 °C, placed under a grow lamp system using 6400 K fluorescent bulbs (~120 µmol/m2·s) and subjected to 12 h of light and 12 h of darkness. Masses of microcosms were recorded at the start of the experiment and measured following post-darkness sampling to track evaporative and sampling losses. Initial biomat samples for both this and flow through experiments (below) were analyzed gravimetrically using standard methods [28].

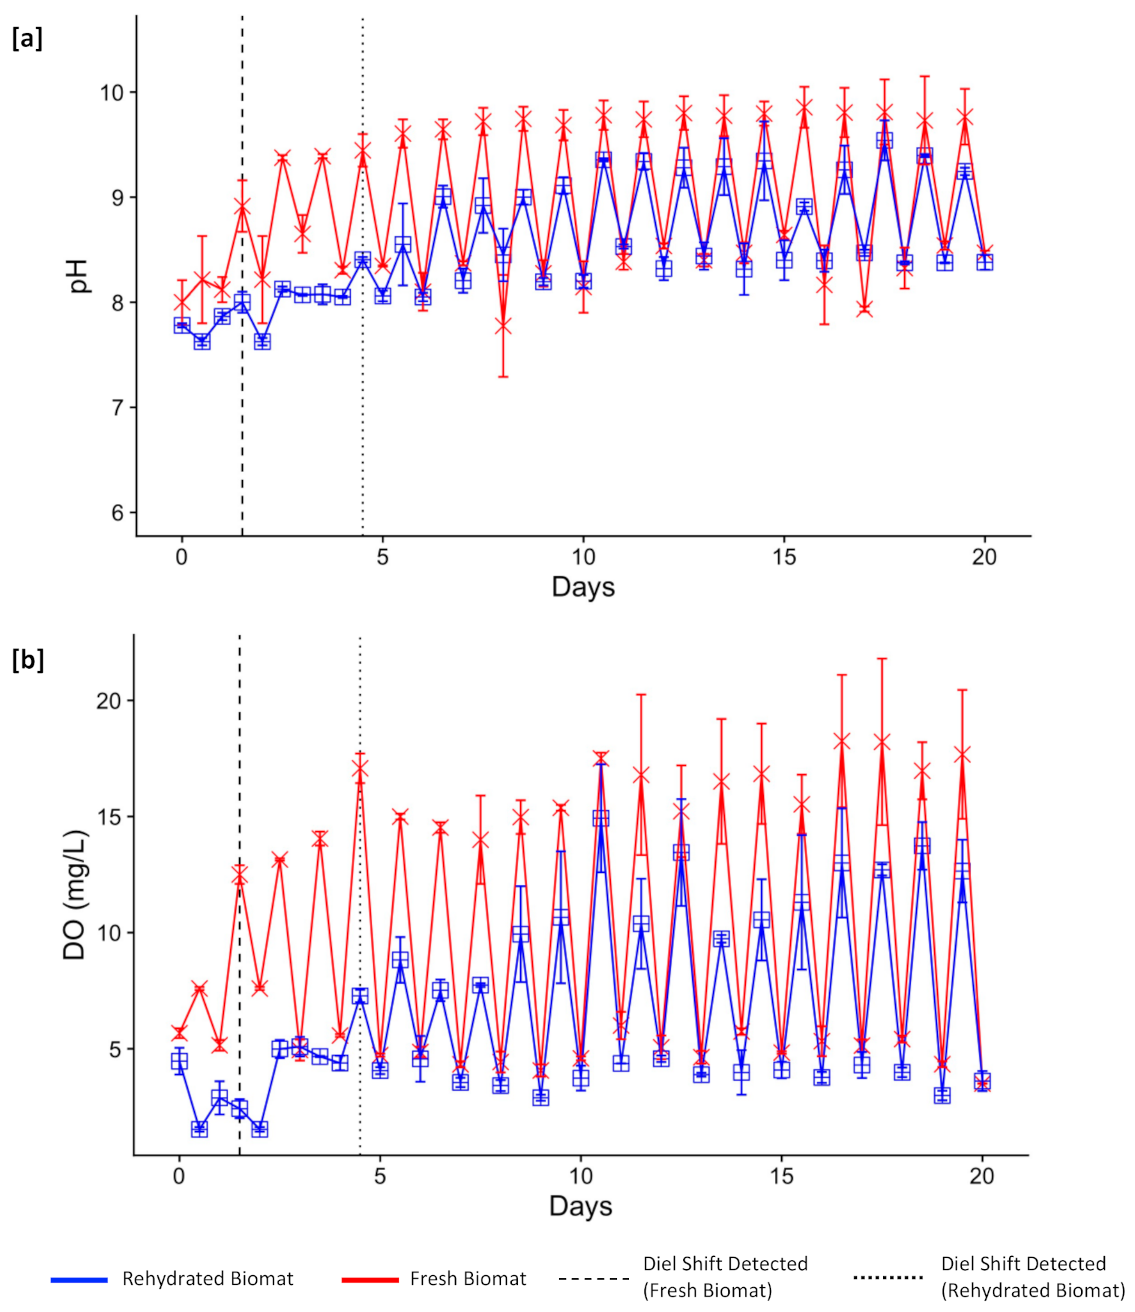
2.3. Rehydration Flow-Through Microcosms

The impact of desiccation was evaluated using flow-through cells in the laboratory to more accurately mimic field rehydration conditions and capture soluble carbon and nitrogen fluxes associated with re-establishment. The desiccated biomat was harvested from the Little Bubbs cells approximately 8 weeks after flow ceased (November 2018) and archived at 20 °C in dry plastic bags for subsequent experimentation. 16S rRNA gene analysis of the rehydrated biomat did not indicate significant shifts in functionally relevant clades due to storage when compared with freshly harvested biomat (data not shown). Duplicate flow-through microcosms were comprised of desiccated/rehydrated versus freshly harvested mature biomat (summer 2020) from the Little Bubbs cells that had been re-established the previous year. This mature biomat was sieved through a 10-mesh screen in order to remove large, foreign debris and then homogenized. Fresh biomat microcosms contained ~375 g of biomat (equating to ~95 g dry weight and ~280 mL of pore water) and 1000 mL of synthetic wetland water in each replicate. Rehydrated biomat flow-through microcosms contained an equivalent dry weight of desiccated biomat (~95 g), 280 mL of biomat supernatant from fresh biomat samples to provide essential trace minerals/nutrients/carbon to rehydrated biomat, and 1000 mL of synthetic water. Flow-through microcosms maintained a residence time of approximately 2.5 days utilizing a filter-sterilized (0.2 µm) wetland analogue influent amended with 15 mg/L-N as NO3 as described earlier, and were constructed in rectangular Pyrex trays (~20 × 15 × 5 cm). As with the batch system, flow-through microcosms were partially submerged in a water bath acting as a heat sink with an average microcosm temperature of 22 ± 1.6 °C, placed under a grow lamp system using 6400 K fluorescent bulbs (~120 µmol/m2·s) and subjected to 12 h of light and 12 h of darkness. The depth of the microcosms was visually marked at the start of the experiment and evaporative losses were compensated with supplemental MilliQ water.

2.4. Aqueous Phase Sampling and Analysis

Nitrogen species samples (NO3, NO2, NH4+) were filtered through 0.45 µm nylon filters and analyzed immediately or frozen at –20° C within 6 h. Frozen samples were analyzed within one week of collection. Two colorimetric assays were used to quantify NO2 and NH4+ [29,30]. In the flood experiment, NO3 was quantified colorimetrically via the salicylic acid method [31]. In the desiccation experiment, NO3 was quantified by ion chromatography (ThermoFisher Scientific, Dionex 2100 with gradient pump, Dionex IonPac AS11 column). Samples for dissolved organic carbon (DOC) and total dissolved nitrogen (TDN) were collected and filtered through a 0.45 µm nylon filter while total organic carbon (TOC) and total nitrogen (TN) were not filtered. Organic carbon samples were then acidified with hydrochloric acid (~1% vol/vol), diluted with MilliQ when appropriate for detection thresholds, and analyzed using a Shimadzu TOC-L CSH at the Colorado School of Mines. Diel chemical changes (pH and DO) to the water column associated with photosynthetic activity were used as a proxy to demonstrate the photosynthetic capability (i.e., biomat activity) in functional UPOW wetlands [23,27,32,33], as well as in analogous systems [34,35,36]. To this end, DO and pH were measured every 12 h with a Hach HQ40d (Hach, Loveland, CO, USA) with a LDO 101 probe or PHC 101 probe, respectively.
Aqueous sampling timelines were adjusted based on experimental conditions and length. The experimental portion of the batch microcosms lasted for 3 days and they were sampled for TOC, TN and nitrogen species every 12 h while DOC and TDN were conducted in 24-h increments. Flow-through microcosms lasted for 21 days. They were sampled for TOC, TN and nitrogen species every 12 h for the first 48 h and every third light period and subsequent dark period.

2.5. DNA Extraction and Sequence Analysis

Microbial DNA for flood-impacted, rehydrated, and fresh samples was extracted using the ZymoBIOMICS DNA Miniprep Extraction Kit (Zymo Inc., Irvine, CA, USA). The extraction method for nascent and mature samples was discussed previously [25]. Mature, flood-impacted, and fresh samples were collected in the field while rehydrated samples were collected post-experimentation. For 16S rRNA gene sequencing, extracted DNA was amplified using primers spanning the V4 and V5 regions of the 16S rRNA gene between positions 515 and 926 according to the protocol outlined in Kraus et al. (2018) [37,38]. Amplicons were purified, barcoded as per Stamps et al. (2016) [39], and again purified prior to pooling as per Honeyman et al. (2018) [40]. Barcoded and purified amplicons were quantified using a Qubit 2.0 Fluorimeter, pooled, and submitted for next generation sequencing on an Illumina MiSeq platform using a v2 paired-end 2 × 250 bp reagent kit. Mature and flood-impacted samples were sequenced at the Duke Center for Genomic and Computational Biology (https://genome.duke.edu) while samples for the rehydration experiment were sequenced at the Genomics and Microarray Core, University of Colorado Anschutz Medical School (https://medschool.cuanschutz.edu/colorado-cancer-center/research/shared-resources/genomics). See SI for additional information on extraction and sequence preparation methods. Demultiplexed sequences are available in the National Center for Biotechnology Information Short Read Archive under project number PRJNA703636.

2.6. Bioinformatic and Statistical Analysis

High throughput sequencing was processed using AdapterRemoval [41] and the DADA2 [42] pipeline followed by statistical analysis using R. Taxonomy was assigned in DADA2 utilizing the SILVA v132 database [43]. Due to sediment intrusion impacting extraction yields on some flood-impacted samples, samples with >500 reads were chosen for further analysis. A final Amplicon Sequence Variants (ASV) table contained 523,128 paired-end sequences across 24 samples ranging in depth from 668 to 48,864 sequences. A phylogenetic tree was constructed and rooted from the DADA2 ASV’s taxonomic information using FastTree [44] and APE [45]. This tree was utilized in subsequent bioinformatics analysis. All phylogenetic analyses were performed without rarefaction. The sequencing data that resulted was analyzed within the R environment utilizing the following packages: phyloseq [46], Ampvis2 [47], vegan [48], and DESeq2 [49].
Phylogenetic distances, plotted using a weighted UniFrac principal coordinates analysis (PCoA), were used to assess similarities across sample populations. Alpha diversity was utilized to quantify the number of species (i.e., richness) while relative abundance was used to evaluate the evenness of species distribution within and between each community. Phyloseq was used to visualize alpha diversity, conduct principal coordinate analyses, and create PCoAs of sample data. A weighted UniFrac PCoA was utilized to visualize the comparison between mature and flood-impacted field samples and to compare samples from the rehydrated flow-through microcosms [50]. All adonis and beta dispersion calculations were conducted using vegan. DESeq2 was used to determine Log2FoldChange between samples in order to discern the most pronounced taxonomic shifts associated with disruption.

3. Results

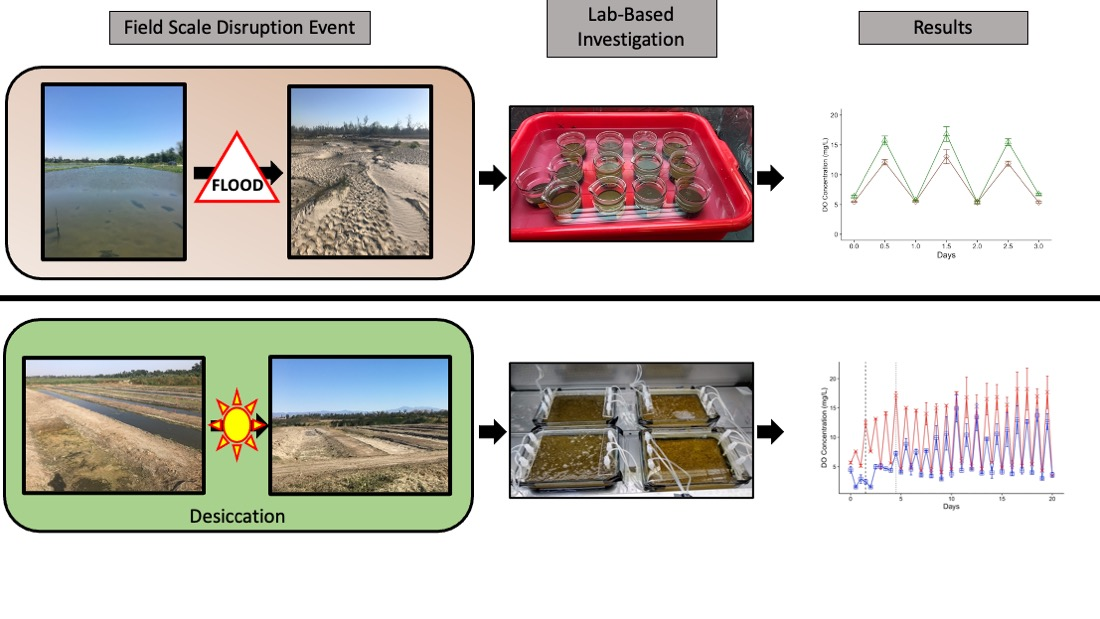
3.1. Environmental Disruption Extremes

Two extremes of field-scale disruption events within the UPOW wetland cells at Prado formed the foundation of this study. In September 2018, after ~15 months of growth, the Little Bubbs were isolated from the flow and dried in an autumnal Mediterranean climate. Materials harvested from this system served as the source for desiccated biomat experiments designed to assess the capability of these systems to go through oscillating dry/dormant and wet-weather treatment conditions. In February 2019, the Santa Ana River received approximately 99 × 106 m3 of storm flow that, when combined with the Prado Dam having an increased storage pool, resulted in a breached levee (earthen berm) in the feeder channel to the Prado Wetlands (Figure S1) [51]. The entire engineered wetland footprint, including both conventional vegetated and UPOW cells, were in turn inundated with storm surge associated river-type flows rather than the traditional controlled flows that otherwise supplied water to the wetland. This energy and turbulence resulted in the introduction of a large quantity of suspended lithogenous sediments (Figure 1). After the levee was re-established the following month, flow ceased and the UPOW cells were dried to enable maintenance and study. Flood-impacted biomat refers to samples collected from this system following the flood and after drying in the field.

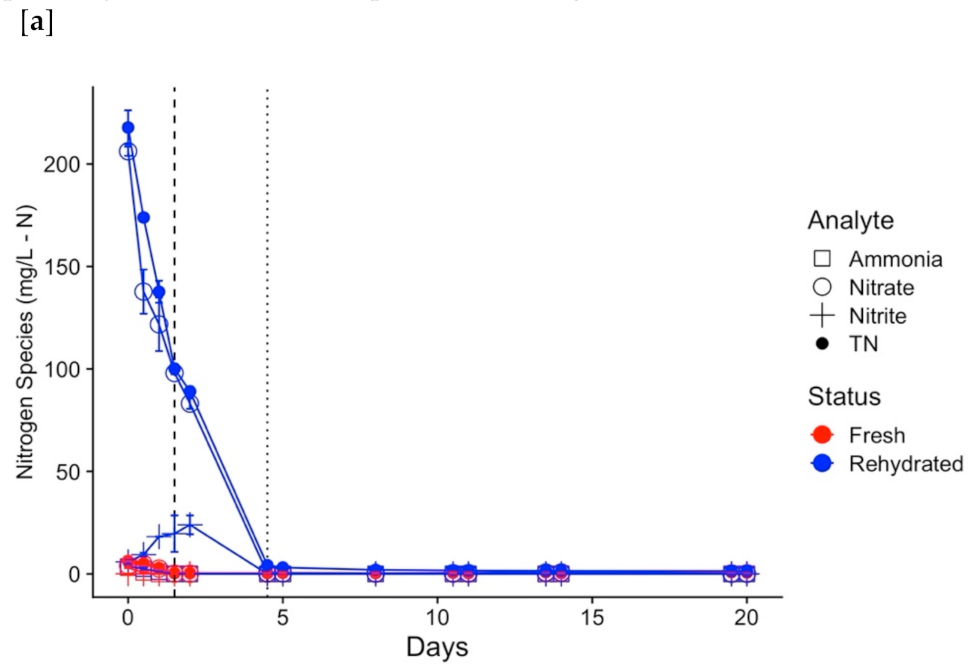
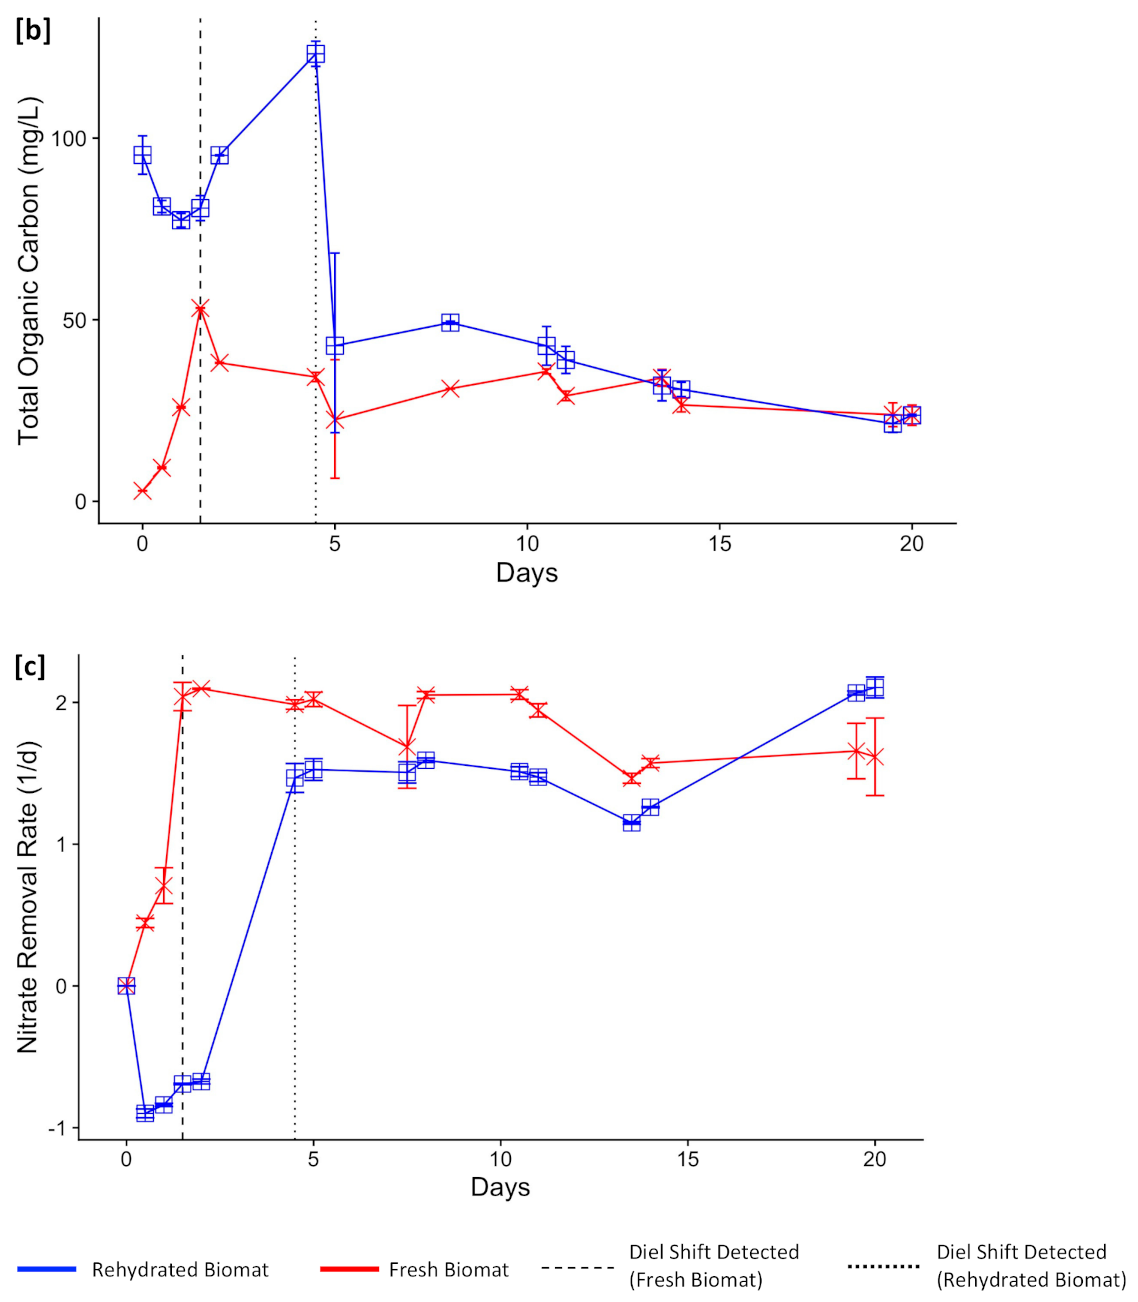
3.2. Physicochemical Changes Associated with Disruption Extremes

Desiccation resulted in little change to the relative proportion of volatile solids within the biomat. In contrast, destructive flooding resulted in a decrease in the relative proportion of volatile solids within the biomat. This was presumably due to turbulent mixing with imported inorganic sediments by breached river waters. The intrusion of flood-borne sediment into the wetland altered the physical composition of the biomat with an over three times decrease in the proportion of volatile solids after the disruptive flooding event (13.2 ± 6.8% vs. 3.6 ± 2.9 %, normalized to dry weight, respectively), and a corresponding increase in proportion of inorganic solids (88.1 ± 6.6% vs. 96.4 ± 2.9%). Conversely, desiccated and mature biomat demonstrated similar proportions of volatile solids (16.2 ± 0.2% vs. 13.2 ± 6.8%) and inorganic solids (83.8 ± 0.2% vs. 88.1 ± 6.6%).
The microbial community of a sediment has been shown to be impacted by physical changes to the sediment such as fluctuations in soil texture or nutrient content [52,53]. The shift in the environmental conditions resulting from the increased sediment and decreased volatile solids, along with cessation of flow to the wetland cells, are potential drivers for shifts in microbial community and operational performance.

3.3. Functional Resilience

Photosynthetic activity was measured at decreased levels in both rehydrated and flood-impacted biomats though the extent of the decrease varied based on the type of disruption. Flow-through microcosms containing rehydrated biomat exhibited diel oscillations in pH and DO that were initially subdued when contrasted with fresh biomat. Results indicated a system establishment time of approximately five days prior to discernable photosynthetic influences on DO and pH in the rehydrated system before diel oscillations mimicked those of fresh biomat (Figure 2). While we cannot rule out the impact of storage on function, the results proved analogous to a proof of concept experiment run previously (data not shown). This suggests that initial biomat activity within the rehydrated biomat might be lower than that of the fresh biomat, though longer term differences may also be attributed to resource limitation or some other factor within our experimental flow-through cells.
Batch microcosms containing biomat harvested from mature and flood-impacted biomat also exhibited differences (Figure 3). Importantly, photosynthetic activity was present following the acclimation period in batch microcosms containing both materials. Mature biomat exhibited higher peak DO concentrations and pronounced diel swings when contrasted with biomat harvested after the flood. As above, we cannot rule out the impact storage on function, though these results proved analogous to a previous experiment run after a shorter storage period (data not shown). Despite these differences in DO, peak and diel pH fluctuations were similar when contrasting flood-impacted and mature biomat.
These changes in biomat activity demonstrate that while disruption events impact the photosynthetic performance of an UPOW wetland system, the biomat does demonstrate a level of functional resilience with respect to biomat photosynthetic activity. These experiments were conducted in comparatively short-term laboratory studies using field derived materials, suggesting that photosynthetic activity remains after these extreme disruptions. Longer-term study of rebound in the field, which could address resource limitation issues, is merited to better understand the rate of establishment and degree of activity. Historical comparison of these types of measurements could enable operators to evaluate system performance following a disruption.

3.4. Operational Resilience

UPOW wetlands have demonstrated the ability to remove nitrate from source water [22] and this capability would likely be a primary operational benefit for their widespread implementation. Within the UPOW system, denitrification is a dominant removal pathway for nitrate with smaller contributions from anammox and dissimilatory denitrification to ammonia [24,26]. In order to increase their adoption as a passive treatment system, UPOW wetlands were evaluated for the impact on nitrate removal performance in response to flooding and desiccation.
In this investigation, rehydrated biomat released nitrogen and organic carbon for approximately five days immediately following rehydration with TN peaking at 218 ± 8.3 mg/L—N immediately whereas TOC peaked at 123.2 ± 3.5 mg/L—C on day 5 (Figure 4). This pulse was no longer detected following the establishment of consistent biomat activity at nearly five days of operation. Potentially due to cell death and ammonification derived nitrogen being subject to long term aerobic desiccation, this plume may represent an issue that must be planned for and mitigated if utilizing these wetlands seasonally (Figure 4). The fresh biomat followed a similar pattern with TOC peaking at 53.2 ± 0.1 mg/L—C when biomat activity was first measurable, highlighting a possible artifact in laboratory establishment and experimentation. This pulse and the following effluent concentrations were not consistent with field measurements (data not shown). Effluent TOC for rehydrated biomat was at even higher levels following measurable biomat activity, further suggesting elevated effluent TOC levels are an experimental artifact. Further research into the potential for a TOC plume in a larger scale system is necessary to understand this finding.
Following the establishment of biomat activity, first order nitrate removal rates for fresh and rehydrated biomats were 1.8 ± 0.4 day−1 and 1.6 ± 0.3 day−1, respectively. As demonstrated by a Mann–Whitney U Test (p = 0.055), rehydrated biomat removed nitrate at a rate comparable to fresh biomat, once the diel shifts in biomat activity, and therefore photosynthetic activity, were detectable (Figure 5). Prior to this inflection point, the nitrate concentration was in excess of the influent, and future research into the nitrate removal pathways is needed to interpret this finding.
Consistent with other findings, flooding also exerted an adverse impact on nitrate attenuation rates. Batch microcosms demonstrated a decrease in bulk first order nitrate removal rates between mature and flood-impacted samples (0.50 ± 0.08 day−1 vs. 0.24 ± 0.01 day−1), though the flood-impacted biomat removal rates were much closer to mature biomat when normalized to relative volatile solids content prior to the start of the experiment (4.04 ± 0.2 day−1 g VSS−1 vs. 4.4 ± 0.7 day−1 g VSS−1, respectively). Increased removal rates for flood-impacted biomat when normalized to relative volatile solids suggests similar overall capability from biomass despite lower rates as a function of the introduction of inorganic sediments.
A return to reduced turbidity within the water column after flooding is anticipated to facilitate the attenuation of photolabile trace organic compounds such as propranolol and sulfamethoxazole at like documented rates [17,21]. Given that biotransformation is the primary removal mechanism for other trace organics such as atenolol, metoprolol, and trimethoprim in an UPOW system [23], results suggest that rates here could diverge as a result of physicochemical, microbiological, and functional shifts associated with flooding. Though further research is needed to confirm the processes, these same indicators suggest promise for the rehydrated biomat, where much as for nitrate, trace organic photolysis and biodegradation rates may converge.
Operational performance of an UPOW wetland was impacted by both types of disruption events. The desiccated biomat demonstrated similar nitrate removal performance once biomat activity was re-established, though it released soluble pulses of nitrogen and carbon immediately upon rehydration. Conversely, the flood-impacted biomat never reached nitrate removal rates similar to the mature system. While the rates were similar when normalized to volatile solids, the operational performance of an UPOW wetland following the flood and resulting sediment intrusion was diminished.

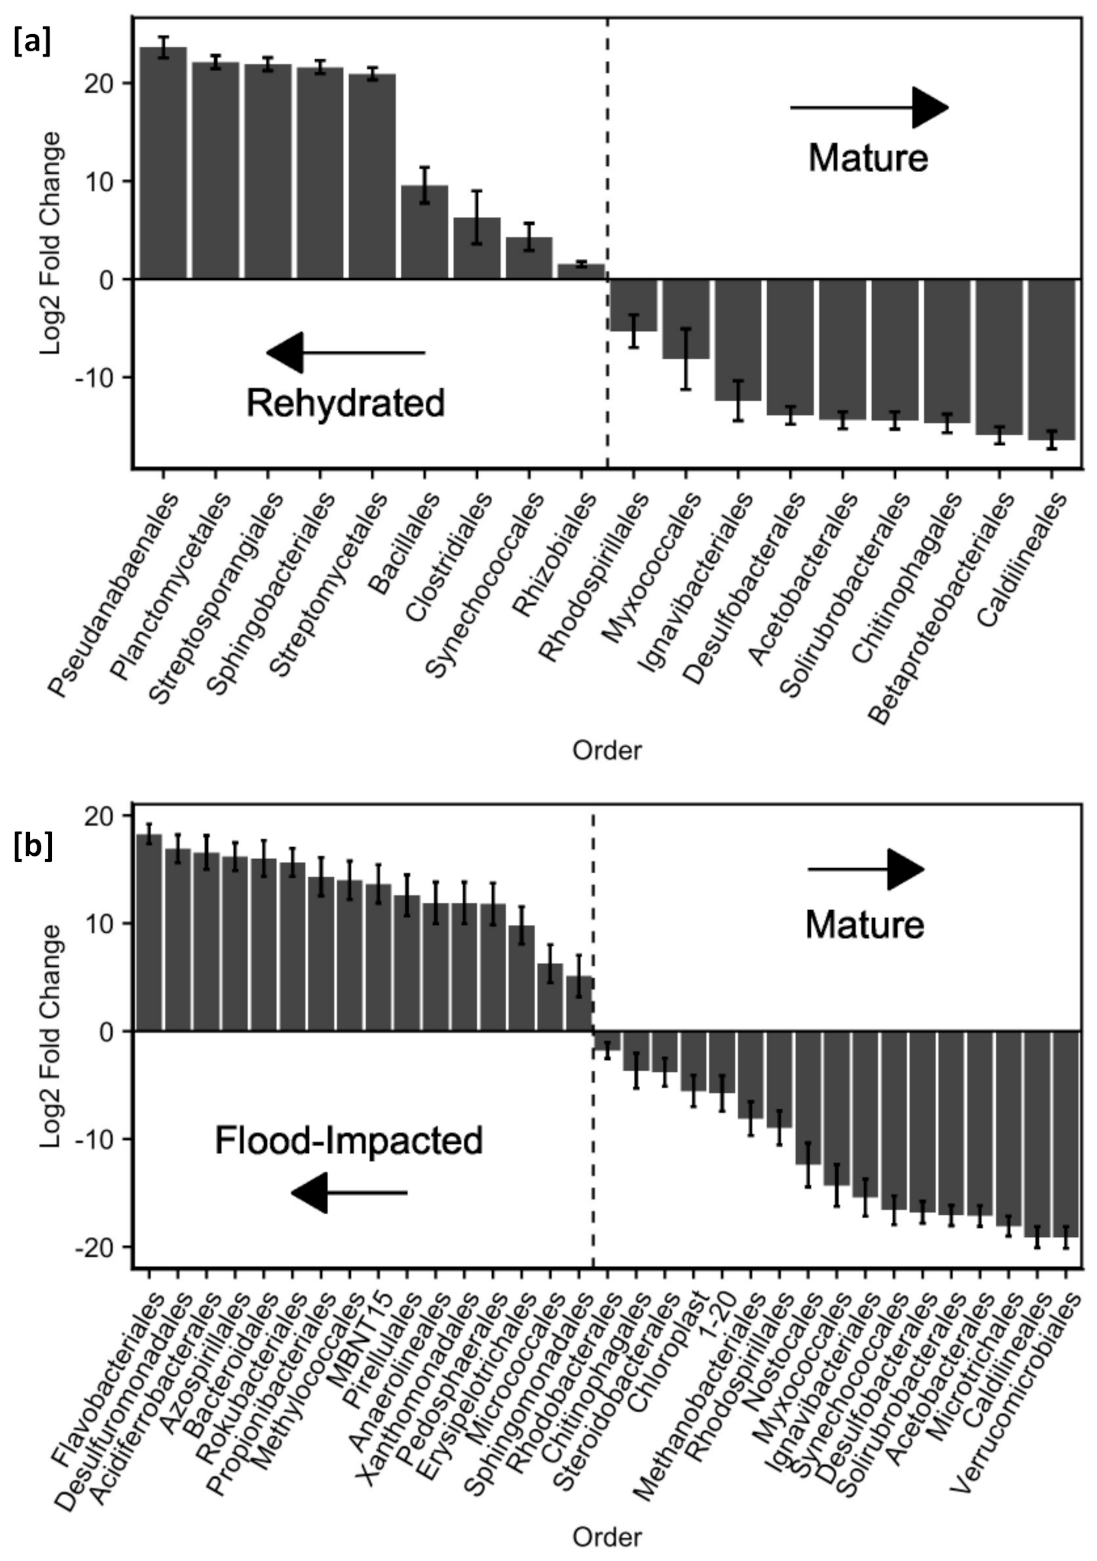
3.5. Ecological Resistance of Microbial Assemblage

The microbial community within multiple UPOW wetlands has been shown to naturally colonize with a microbial assemblage that maintains a high degree of similarity between and within systems after an initial evolution of the community in the early months of operation [25]. Given this, the baseline community presented by Jones et al. 2018 was utilized to contrast ecological shifts as a function of studied disruption events.
Biomat samples rehydrated in the laboratory harbored significant differences (adonis, p = 0.002, R2 = 0.50) from mature biomat (Figure 5) (see Table S2 for all comparison results). Similarly, the extreme flooding event resulted in a pronounced shift from the mature ecological profile (adonis, p = 0.001, R2 = 0.50). However, when integrated with our results above, this lack of microbial resistance had a more pronounced impact on the operational resilience of flood-impacted biomat. Conversely, rehydrated biomat demonstrated a similar nitrate removal performance as that of fresh biomat following an establishment period.
Following rehydration, the alpha diversity of the desiccated biomat, as evidenced by the observed ASVs., was significantly different from the mature biomat (Mann–Whitney U test, p < 0.05) (Figure 5). Though not specifically captured in this experiment, this increased diversity may be due to capturing inactive taxa. This result could be queried in longer term experimentation. While the flood-impacted and mature biomat had a similar median of observed ASVs. (Mann–Whitney U test, p > 0.05), the increased range of observed ASVs. in the flood-impacted samples suggests this community underwent random selection following the flood and subsequent shutting off of inflow to the wetlands. Similar to phylogenetic distances, alpha diversity differences between the two types of disruption support the conclusion that both disruptions had an impact on biomat microbial ecology.
The rehydration of desiccated biomat resulted in shifts in the relative abundance of specific microbes within the biomat. The process of drying and follow-on rehydration resulted in a positive change to microbes such as Streptosporangiales and nitrogen fixing organisms (e.g., Rhizobiales [54]), while showing a decrease in putative denitrifying clades (e.g., Betaproteobacteriales [55]) and potential sulfate-reducing clades (e.g., Desulfobacterales [56]) (Figure 6). Though the nitrate reduction capability of the rehydrated biomat was like that of fresh biomat after a short start-up period, the shifts in the microbial community and resulting assemblage suggest the UPOW biomat is not ecologically resistant to desiccation.
Similar to evaluating the impacts of desiccation, shifts in relative abundance were further used to evaluate the changes to the microbial community associated with flooding (Figure 6). The stochastic selection illustrated previously was also indicated in the relative abundance findings; clades belonging to the Desulfuromonadales and Flavobacteriales orders have undergone a large positive change following the flood whereas clades such as Desulfobacterales and Acetobacterales have been negatively impacted. In flood-impacted biomat there was an increase in relative abundance of enteric guilds (e.g., Erysipelotrichales [57]), wastewater associated guilds (e.g., Pirellulales [58]), and soil associated taxa (e.g., Micrococalles [59]). These could have been imported with flood waters or selected for by the shift in physicochemical conditions after sediment inundation. The relative decrease in Methanobacterales, a clade containing methanogens [60], and Nostocales, an order containing cyanobacteria [61], suggests a potential degradation of geochemical and redox stratification imparted by the high energy flooding event that caused washout of the previous microbial community [24].
Though not fully explored within the timeframe of our experimental design, the potential for the biomat to exhibit resilience by returning to the pre-disruption community assemblage will be driven by the environmental conditions found when the system is returned to operation. If the environmental conditions return to those previously found, the microbial ecology may converge with the community seen in mature biomat, as would be expected for rehydrated biomat [25]. However, physicochemical changes such as inorganic sediment import from a flood event suggest a profound change that will not only disrupt biomat composition but will enable rooting, emergent plants to grow, which would likely further alter biomat processes and composition.

4. Conclusions

In order for water and wastewater infrastructure to serve its societal purposes of ensuring clean water, sanitation, and future use, reliability and resilience are required. Prior to this investigation, the resilience of UPOW wetlands had not been studied. By using materials from field-scale systems impacted by real-world disruption events, this investigation helped to predict what might happen when a system is returned to operation following these two disruption extremes through evaluating the functional resilience, operational resilience, and ecological resistance of biomat impacted by these disruptions.
Our results suggest the system is not ecologically resistant to this type of flooding event and, more importantly, sediment introduction associated with this disruption. However, it does have the capability to provide flexibility for operators to triage damage and prioritize repairs by maintaining capabilities for nitrate attenuation after disruption. The proactive use of robust and redundant systems for flow control could better mitigate the potential for system failure and the likely resulting shift to a vegetated system.
The results of the desiccation experiment demonstrate the potential for the system to be used intermittently for surge flows and stormwater after ensuring sediment carried by those flows are removed prior to entering the wetland. Though the biomat was not ecologically resistant to desiccation and rehydration, the operational performance of the wetland was impacted for a short period before rebounding to a performance similar to that of fresh biomat. Despite not being evaluated in this investigation, it is believed that trace organic removal by photolysis would likely rebound in a similar fashion with decreasing turbidity and increasing sunlight penetration of the water column. This short startup time (<1 week) suggests the system can be placed in a dormant state until needed as long as the initial nitrogen and potential carbon pulse is accounted for and potentially mitigated downstream. This highlights the potential for the technology to be used as a unit process within a larger treatment system or train, as well as its promise for integration into seasonal treatment as might be found in intercept channels during agricultural irrigation.
The results of these investigations suggest UPOW wetlands can rebound from both flooding and desiccation; however, design efforts should focus on minimizing the potential introduction of inorganic sediment and on proactively preparing for extreme precipitation events as well as compounding anthropogenic pressures, such as flow withholding in downstream dams.

Supplementary Materials

The following are available at https://www.mdpi.com/2073-4441/13/6/815/s1, Figure S1: USGS Hydrographs from selected Santa Ana River locations during flood event; DNA Extraction, Sequencing, and Analysis; Table S1: Analog Wetland Water Influent; Table S2: ADONIS and Beta Dispersion Results for Microbial Ecology Comparison; Figure S2: Microbial Community UniFrac and DCA PCoAs; Figure S3: Rank Abundance of Biomat Types.

Author Contributions

Conceptualization, A.R.B., M.A.V., E.J.L., J.G.S., J.O.S.; methodology, A.R.B., M.A.V., J.O.S.; formal analysis, A.R.B., M.A.V.; investigation, A.R.B., M.A.V., K.N.R., H.F.P.; writing—original draft preparation, A.R.B.; writing—review and editing, M.A.V., J.O.S. All authors have read and agreed to the published version of the manuscript.

Funding

This research was funded by the National Science Foundation Engineering Research Center for Reinventing the Nation’s Urban Water Infrastructure (ReNUWIt) (NSF EEC-1028968), the Colorado Higher Education Competitive Research Authority (CHECERA), and by collaborative funding from the National Institutes for Water Resources and U.S. Geological Survey (NIWR-USGS) subaward G-62991-01.

Institutional Review Board Statement

Not applicable.

Informed Consent Statement

Not applicable.

Data Availability Statement

Raw sequences are available from NCBI (https://www.ncbi.nlm.nih.gov/bioproject/) under accession number PRJNA703636.

Acknowledgments

The authors thank the Orange County Water District and employees Mark Petty, Chris Wilson, Bill Bradford, Christine Pham, Bonnie Johnson, Megan Plumlee, Jason Dadakis, and John Bonsangue for their time, efforts, and support of these systems and associated research at the Prado Engineered Wetlands; Dana Sanelli and Carly Oliver for their involvement in proof-of-concept laboratory experimentation with the desiccated biomat; and Zack Jones for his temporal sampling of Big Bubbs at Prado Wetlands for nascent and mature biomat.

Conflicts of Interest

The authors declare no conflict of interest. The funders had no role in the design of the study; in the collection, analyses, or interpretation of data; in the writing of the manuscript, or in the decision to publish the results.

References

  1. Seneviratne, S.; Nicholls, N.; Easterling, D.; Goodess, C.; Kanae, S.; Kossin, J.; Luo, Y.; Marengo, J.; McInnes, K.; Rahimi, M.; et al. Changes in climate extremes and their impacts on the natural physical environment. In Managing the Risks of Extreme Events and Disasters to Advance Climate Change Adaptation (SREX); Field, C.B., Barros, V., Stocker, T.F., Qin, D., Dokken, D.J., Ebi, K.L., Mastrandrea, M.D., Mach, K.J., Plattner, G.-K., Allen, S.K., Eds.; Cambridge University Press: Cambridge, UK; New York, NY, USA, 2012; pp. 109–230. Available online: https://www.cambridgorg/core/books/managing-the-risks-of-extreme-events-and-disasters-to-advance-climate-change-adaptation/changes-in-climate-extremes-and-their-impacts-on-the-natural-physical-environment/A4B05D458547ACA9017591A37860DDD3 (accessed on 22 February 2021).
  2. Milly, P.C.D.D.; Wetherald, R.T.; Dunne, K.A.; Delworth, T.L. Increasing risk of great floods in a changing climat. Nature 2002, 415, 514–517. [Google Scholar] [CrossRef]
  3. U.S. Bureau of Reclamatio Climate Change Analysis for the Santa Ana River Watershed—Santa Ana Watershed Basin Study 2013. Available online: https://www.usbgov/lc/socal/basinstudies/OWOWReferences/FinalReport/TM1ClimateChangpdf (accessed on 7 November 2019).
  4. Cook, B.; Mankin, J.S.; Anchukaitis, K.J. Climate Change and Drought: From Past to Futur. Curr. Clim. Chang. Rep. 2018, 4, 164–179. [Google Scholar] [CrossRef]
  5. Olsson, L.; Jerneck, A.; Thoren, H.; Persson, J.; O’Byrne, D. Why resilience is unappealing to social science: Theoretical and empirical investigations of the scientific use of resilienc. Sci. Adv. 2015, 1, e1400217. [Google Scholar] [CrossRef] [PubMed] [Green Version]
  6. Juan-Garcia, P.; Butler, D.; Comas, J.; Darch, G.; Sweetapple, C.; Thornton, A.; Corominas, L. Resilience theory incorporated into urban wastewater systems managemen State of the air. Water Res. 2017, 115, 149–161. [Google Scholar] [CrossRef] [PubMed] [Green Version]
  7. Shade, A.; Peter, H.; Allison, S.D.; Baho, D.L.; Berga, M.; Buergmann, H.; Huber, D.H.; Langenheder, S.; Lennon, J.T.; Martiny, J.B.H.; et al. Fundamentals of microbial community resistance and resilienc. Front. Microbiol. 2012, 3, 417. [Google Scholar] [CrossRef] [PubMed] [Green Version]
  8. Allison, S.D.; Martiny, J.B.H. Resistance, resilience, and redundancy in microbial communities. Proc. Natl. Acad. Sci. USA 2009, 105, 149–166. [Google Scholar] [CrossRef] [PubMed] [Green Version]
  9. Gersonius, B.; Ashley, R.; Pathirana, A.; Zevenbergen, C. Climate change uncertainty: Building flexibility into water and flood risk infrastructure. Clim. Chang. 2013, 116, 411–423. [Google Scholar] [CrossRef]
  10. Youn, B.D.; Hu, C.; Wang, P. Resilience-driven system design of complex engineered systems. J. Mech. Des. 2011, 133, 101011-1–101011–5. [Google Scholar] [CrossRef]
  11. Jackson, S.; Ferris, T. Resilience Principles for Engineered Systems. Syst. Eng. 2013, 16, 152–164. [Google Scholar] [CrossRef]
  12. Kiparsky, M.; Thompson, B.H.; Binz, C.; Sedlak, D.L.; Tummers, L.; Truffer, B. Barriers to Innovation in Urban Wastewater Utilities: Attitudes of Managers in California. Environ. Manag. 2016, 57, 1204–1216. [Google Scholar] [CrossRef]
  13. Acreman, M.; Holden, J. How wetlands affect floods. Wetlands 2013, 33, 773–786. [Google Scholar] [CrossRef] [Green Version]
  14. Brody, S.D.; Sebastian, A.; Blessing, R.; Bedient, P.B. Case study results from southeast Houston, Texas: Identifying the impacts of residential location on flood risk and loss. J. Flood Risk Manag. 2018, 11, S110–S120. [Google Scholar] [CrossRef]
  15. Shimabuku, M.; Diringer, S.; Cooley, H. Stormwater Capture in California: Innovative Policies and Funding Opportunities; Pacific Institute: Oakland, CA, USA, 2018; 33p, Available online: http://pacinsorg/wp-content/uploads/2018/06/Pacific-Institute-Stormwater-Capture-in-California.pdf (accessed on 4 February 2021).
  16. Regnery, J.; Lee, J.; Kitanidis, P.; Illangasekare, T.; Sharp, J.O.; Drewes, J.E. Integration of artificial recharge and recovery systems for impaired water sources in urban settings: Overcoming current limitations and engineering challenges. Environ. Eng. Sci. 2013, 30, 409–420. [Google Scholar] [CrossRef]
  17. Jasper, J.T.; Nguyen, M.T.; Jones, Z.L.; Ismail, N.S.; Sedlak, D.L.; Sharp, J.O.; Luthy, R.G.; Horne, A.J.; Nelson, K.L. Unit Process Wetlands for Removal of Trace Organic Contaminants and Pathogens from Municipal Wastewater Effluents. Environ. Eng. Sci. 2013, 30, 421–436. [Google Scholar] [CrossRef]
  18. Grebel, J.E.; Mohanty, S.K.; Torkelson, A.A.; Boehm, A.B.; Higgins, C.P.; Maxwell, R.M.; Nelson, K.L.; Sedlak, D.L. Engineered Infiltration Systems for Urban Stormwater Reclamatio. Environ. Eng. Sci. 2013, 30, 437–454. [Google Scholar] [CrossRef]
  19. Ashoori, N.; Teixido, M.; Spahr, S.; LeFevre, G.H.; Sedlak, D.L.; Luthy, R.G. Evaluation of pilot-scale biochar-amended woodchip bioreactors to remove nitrate, metals, and trace organic contaminants from urban stormwater runoff. Water Res. 2019, 154, 1–11. [Google Scholar] [CrossRef]
  20. Kadlec, R.H.; Wallace, S.D. Treatment Wetlands, 2nd ed.; CRC Press: Boca Raton, FL, USA, 2009. [Google Scholar]
  21. Jasper, J.T.; Sedlak, D.L. Phototransformation of Wastewater-Derived Trace Organic Contaminants in Open-Water Unit Process Treatment Wetlands. Environ. Sci. Technol. 2013, 47, 10781–10790. [Google Scholar] [CrossRef]
  22. Bear, S.E.; Nguyen, M.T.; Jasper, J.T.; Nygren, S.; Nelson, K.L.; Sedlak, D.L. Removal of nutrients, trace organic contaminants, and bacterial indicator organisms in a demonstration-scale unit process open-water treatment wetland. Ecol. Eng. 2017, 109, 76–83. [Google Scholar] [CrossRef]
  23. Jasper, J.T.; Jones, Z.L.; Sharp, J.O.; Sedlak, D.L. Biotransformation of trace organic contaminants in open-water unit process treatment wetlands. Environ. Sci. Technol. 2014, 48, 5136–5144. [Google Scholar] [CrossRef] [PubMed]
  24. Jasper, J.T.; Jones, Z.L.; Sharp, J.O.; Sedlak, D.L. Nitrate removal in shallow, Open-water treatment wetlands. Environ. Sci. Technol. 2014, 48, 11512–11520. [Google Scholar] [CrossRef] [PubMed]
  25. Jones, Z.L.; Mikkelson, K.M.; Nygren, S.; Sedlak, D.L.; Sharp, J.O. Establishment and convergence of photosynthetic microbial biomats in shallow unit process open-water wetlands. Water Res. 2018, 133, 132–141. [Google Scholar] [CrossRef] [PubMed]
  26. Jones, Z.L.; Jasper, J.T.; Sedlak, D.L.; Sharp, J.O. Sulfide-Induced Dissimilatory Nitrate Reduction to Ammonium Supports Anaerobic Ammonium Oxidation (Anammox) in an Open-Water Unit Process Wetland. Appl. Environ. Microbiol. 2017, 83, e00782-17. [Google Scholar] [CrossRef] [PubMed] [Green Version]
  27. Reed, A.P. Diel Redox Cycling and Its Impact on Inorganic Nitrogen in An Engineered Wetland Designed for Water Treatment. Master’s Thesis, Colorado School of Mines, Golden, Colorado, 2019. Available online: https://mountainscholaorg/handle/11124/173018 (accessed on 10 June 2019).
  28. Topp, G.C.; Parkin, G.W.; Ferre, T.P.A. Chapter 70: Soil Water Conten Second. In Soil Sampling and Methods of Analysis, 2nd ed.; Carter, M.R., Gregorich, E.G., Eds.; Taylor and Francis Group, LLC: Boca Raton, FL, USA, 2008; pp. 939–962. [Google Scholar]
  29. APHA. 4500-NO2 B. Colorimetric Method. In Standard Methods for the Examination of Water and Wastewate, 18th ed.; Greenberg, A., Clesceri, L., Eaton, A., Franson, M.A., Eds.; APHA, AWWA, WPFC: Washington, DC, USA, 1992; pp. 4–86. [Google Scholar]
  30. APHA. 4500-NH3 F. Phenate Method. In Standard Methods for the Examination of Water and Wastewate, 21st ed.; APHA, AWWA, WPFC: Washington, DC, USA, 1997; pp. 4108–4117. [Google Scholar]
  31. Cataldo, D.A.; Maroon, M.; Schrader, L.E.; Youngs, V.L. Rapid colorimetric determination of nitrate in plant tissue by nitration of salicylic acid. Commun. Soil Sci. Plant Anal. 1975, 6, 71–80. [Google Scholar] [CrossRef]
  32. DeBusk, T.A.; Grace, K.A.; Dierberg, F.E.; Jackson, S.D.; Chimney, M.J.; Gu, B. An investigation of the limits of phosphorus removal in wetlands: A mesocosm study of a shallow periphyton-dominated treatment system. Ecol. Eng. 2004, 23, 1–14. [Google Scholar] [CrossRef]
  33. Reed, A.P.; Sharp, J.O.; Tobias, C.R.; Repert, D.A.; Smith, R.L. Surface Water and Porewater Chemistry of Cell 3A; Prado Wetlands: Riverside, CA, USA, 2020; Available online: https://www.sciencebasgov/catalog/item/5cdaf823e4b0ab16db3a82f9 (accessed on 10 January 2021).
  34. El Haïkali, B.; Bensoussan, N.; Romano, J.C.; Bousquet, V. Estimation of photosynthesis and calcification rates of Corallina elongata Ellis and Solander, 1786, by measurements of dissolved oxygen, pH and total alkalinity. Sci. Mar. 2004, 68, 45–56. [Google Scholar] [CrossRef] [Green Version]
  35. Revs Bech, N.P.; Ward, D.M. Microelectrode Studies of Interstitial Water Chemistry and Photosynthetic Activity in a Hot Spring Microbial Mat. Appl. Environ. Microbiol. 1984, 48, 270–275. [Google Scholar] [CrossRef] [Green Version]
  36. Neal, C.; Harrow, M.; Williams, R.J. Dissolved carbon dioxide and oxygen in the River Thames: Spring-summer 1997. Sci. Total Environ. 1998, 210/211, 205–217. [Google Scholar] [CrossRef]
  37. Kraus, E.A.; Beeler, S.R.; Mors, R.A.; Floyd, J.G.; Stamps, B.W.; Nunn, H.S.; Stevenson, B.S.; Johnson, H.A.; Shapiro, R.S.; Loyd, S.J.; et al. Microscale biosignatures and abiotic mineral authigenesis in Little Hot Creek, California. Front. Microbiol. 2018, 9, 1–13. [Google Scholar] [CrossRef]
  38. Parada, A.E.; Needham, D.M.; Fuhrman, J.A. Every base matters: Assessing small subunit rRNA primers for marine microbiomes with mock communities, time series and global field samples. Environ. Microbiol. 2016, 18, 1403–1414. [Google Scholar] [CrossRef] [PubMed]
  39. Stamps, B.W.; Lyles, C.N.; Suflita, J.M.; Masoner, J.R.; Cozzarelli, M.; Kolpin, D.W.; Stevenson, B.S. Municipal solid waste landfills harbor distinct microbiomes. Front. Microbiol. 2016, 7, 534. [Google Scholar] [CrossRef] [Green Version]
  40. Honeyman, A.S.; Day, M.L.; Spear, J.R. Regional fresh snowfall microbiology and chemistry are driven by geography in storm-tracked events, Colorado, USA. PeerJ 2018, 6, e5961. [Google Scholar] [CrossRef] [Green Version]
  41. Schubert, S.; Lindgreen, S.; Orlando, L. AdapterRemoval v2: Rapid adapter trimming, identification, and read merging. BMC Res. Notes 2016, 9, 88. [Google Scholar] [CrossRef] [Green Version]
  42. Callahan, B.J.; McMurdie, P.J.; Rosen, M.J.; Han, A.W.; Johnson, A.J.A.; Holmes, S.P. DADA2: High-resolution sample inference from Illumina amplicon data. Nat. Methods 2016, 13, 581–583. [Google Scholar] [CrossRef] [PubMed] [Green Version]
  43. Quast, C.; Pruesse, E.; Yilmaz, P.; Gerken, J.; Schweer, T.; Yarza, P.; Peplies, J.; Glöckner, F.O. The SILVA ribosomal RNA gene database project: Improved data processing and web-based tools. Nucleic Acids Res. 2013, 41, D590–D596. [Google Scholar] [CrossRef] [PubMed]
  44. Price, M.N.; Dehal, P.S.; Arkin, A.P. FastTree 2—Approximately maximum-likelihood trees for large alignments. PLoS ONE 2010, 5, e9490. [Google Scholar] [CrossRef] [PubMed]
  45. Paradis, E.; Claude, J.; Strimmer, K. APE: Analyses of phylogenetics and evolution in R language. Bioinformatics 2004, 20, 289–290. [Google Scholar] [CrossRef] [PubMed] [Green Version]
  46. McMurdie, P.J.; Holmes, S. Phyloseq: An R Package for Reproducible Interactive Analysis and Graphics of Microbiome Census Data. PLoS ONE 2013, 8, e62217. [Google Scholar] [CrossRef] [PubMed] [Green Version]
  47. Andersen, K.S.; Kirkegaard, R.H.; Karst, S.M.; Albertsen, M. ampvis2: An R package to analyse and visualise 16S rRNA amplicon data. bioRxiv 2018, 299537. [Google Scholar]
  48. Oksanen, J.; Blanchet, F.G.; Friendly, M.; Kindt, R.; Legendre, P.; McGlinn, D.; Wagner, H. vegan: Community Ecology Package 2019. Available online: https://crar-projecorg/package=vega (accessed on 24 May 2020).
  49. Love, M.; Huber, W.; Anders, S. Moderated estimation of fold change and dispersion for RNA-seq data with DESeq2. Genome Biol. 2014, 15, 550. [Google Scholar] [CrossRef] [PubMed] [Green Version]
  50. Lozupone, C.; Knight, R. UniFrac: A new phylogenetic method for comparing microbial communities. Appl. Environ. Microbiol. 2005, 71, 8228–8235. [Google Scholar] [CrossRef] [Green Version]
  51. Deshmukh, S.; Herndon, R.L.; Huang, W.B.; Markus, M.R.; Miller, C.D. Santa Ana River Watermaster Report for Water Year 1 October 2018–30 September 2019 San Bernandino, CA. 2020. Available online: https://www.ocwd.com/media/8837/2018-19-watermaster-reporpdf (accessed on 9 December 2020).
  52. McKinley, V.L.; Peacock, A.D.; White, D.C. Microbial community PLFA and PHB responses to ecosystem restoration in tallgrass prairie soils. Soil Biol. Biochem. 2005, 37, 1946–1958. [Google Scholar] [CrossRef]
  53. Inglett, K.S.; Inglett, P.W.; Reddy, K.R. Soil Microbial Community Composition in a Restored Calcareous Subtropical Wetland. Soil Sci. Soc. Am. J. 2011, 75, 1731–1740. [Google Scholar] [CrossRef]
  54. Garrido-Oter, R.; Nakano, R.T.; Dombrowski, N.; Ma, K.W.; McHardy, A.C.; Schulze-Lefert, P. Modular Traits of the Rhizobiales Root Microbiota and Their Evolutionary Relationship with Symbiotic Rhizobia. Cell Host Microbe 2018, 24, 155–167.e5. [Google Scholar] [CrossRef] [PubMed] [Green Version]
  55. Zumft, W.G. Cell biology and molecular basis of denitrification. Microbiol. Mol. Biol. Rev. 1997, 61, 533–616. [Google Scholar] [CrossRef]
  56. Dhillon, A.; Teske, A.; Dillon, J.; Stahl, D.A.; Sogin, M.L. Molecular characterization of sulfate-reducing bacteria in the Guaymas basi. Appl. Environ. Microbiol. 2003, 69, 2765–2772. [Google Scholar] [CrossRef] [Green Version]
  57. Han Congeevaram, S.; Ki, D.W.; Oh, B.T.; Park, J. Bacterial community analysis of swine manure treated with autothermal thermophilic aerobic digestion. Appl. Microbiol. Biotechnol. 2011, 89, 835–842. [Google Scholar]
  58. Dedysh, S.N.; Kulichevskaya, S.; Beletsky, A.V.; Ivanova, A.A.; Rijpstra, W.C.; Damsté, J.S.S.; Mardanov, A.V.; Ravin, N.V. Lacipirellula parvula ge nov., sp. nov., representing a lineage of planctomycetes widespread in low-oxygen habitats, description of the family Lacipirellulaceae fam. nov. and proposal of the orders Pirellulales ord. nov., Gemmatales ord. nov. and Isosph. Syst. Appl. Microbiol. 2020, 43, 126050. [Google Scholar] [CrossRef]
  59. Hazarika, S.N.; Thakur, D. Actinobacteria. In Beneficial Microbes in Agro-Ecology; Amaresan, N., Senthil Kumar, M., Annapurna Krishna Kumar, K., Sankaranarayanan, A., Eds.; Academic Press: Cambridge, MA, USA, 2020; pp. 443–476. Available online: http://dx.doi.org/10.1016/B978-0-12-823414-3.00021-6 (accessed on 25 January 2021).
  60. Bonin, A.S.; Boone, D.R. The Order Methanobacteriales. In Martin Dworkin (Editor-in-Chief), Stanley Falkow, Eugene Rosenberg, Karl-Heinz; Schleifer, E.S., Ed.; The Prokaryotes Third; Springer: Singapore, 2006; pp. 231–243. Available online: http://www.springerlink.com/index/10.1007/0-387-30743-5 (accessed on 16 December 2020).
  61. Komárek, J.; Kaštovs.ký, J.; Mareš, J.; Johansen, J.R. Taxonomic classification of cyanoprokaryotes (cyanobacterial genera) 2014, using a polyphasic approach. Preslia 2014, 86, 295–335. [Google Scholar]
Figure 1. (a) Prado Wetlands demonstration scale unit process open water (UPOW) wetland (Big Bubbs) before (top, Google Earth, taken 12 December 2017) and (bottom) after the 19 February 2019 flooding event (imagery from Google Earth, taken 2 May 2019). This image depicts the introduction of sands and other inorganic sediments and the flowpath of the flooding event. (b) (top) A fully functional demonstration scale UPOW wetland (Cell A3) at Prado Wetlands during normal operating conditions (taken summer 2018) and (bottom) following flow shut-off after the flood event and the resulting sediment intrusion (taken March 2019).
Water 13 00815 g001
Figure 2. Comparison of diel indicators of photosynthesis, pH (a), and dissolved oxygen (DO) (b) between rehydrated and fresh biomat. The biomat activity in the rehydrated cells takes approximately 10 days to reach similar levels as the fresh cells. Biomat activity is first measurable at 1.5 days for the fresh cells (dashed line) and 5 days for the rehydrated cells (dotted line), demonstrating a start-up period for rehydrated biomat compared to fresh biomat. Points represent the average of biological duplicates with error bars denoting maximum and minimum values.
Water 13 00815 g002
Figure 3. Comparison of diel indicators of photosynthesis, pH (a), and DO (b), between flood-impacted and mature biomat microcosms. Though the pH values in mature and flood-impacted biomat are similar, the DO levels in flood-impacted biomat are consistently lower, demonstrating a decreased level of biomat activity following a flooding event. Points represent the average of biological duplicates with error bars denoting maximum and minimum values.
Water 13 00815 g003
Figure 4. Comparison of rehydrated to fresh biomat for (a) nitrogen species, (b) total organic carbon, and (c) first order removal rate of nitrate at each sampling point. During the startup phase of rehydration, an initial pulse of nitrogen (a) made up mostly by nitrate was seen within the rehydrated biomat microcosms. The total organic carbon (TOC) pulse did not peak until biomat activity was measurable in either biomat types (b), demonstrating a need for additional research to determine the scale of an organic carbon plume that may be released upon rehydration. First order nitrate removal rates (c) did not stabilize in either biomat type until measurable biomat activity occurred (~1.5 days in fresh and 4.5 days in rehydrated). At that point, the removal rates of both types of biomat were not significantly different. Points represent the average of biological duplicates with error bars denoting maximum and minimum values. TN = total nitrogen
Water 13 00815 g004aWater 13 00815 g004b
Figure 5. Comparison of microbial ecological signatures between nascent, mature, rehydrated, and flood-impacted samples demonstrates a significant change within the microbial community as a result of each disruption. A biomat is considered nascent prior to completing one full growing season and mature after that. As can be seen from the Weighted UniFrac PCoA (a), the flood-impacted biomat and rehydrated biomat communities were significantly different from both mature and nascent biomats (SI Table S2). (b) The range of observed amplicon sequence variants (ASVs.) in the flood-impacted samples demonstrates the microbial community likely underwent random selection due to the samples being taken after the inflow to the wetlands was shut off. Coupled with the significant shift between rehydrated and mature biomats (Mann–Whitney U test, p < 0.05), this suggests both disruptions had an impact on the microbial assemblage of the biomat.
Water 13 00815 g005
Figure 6. The Log2FoldChange illustrates the orders that have undergone the largest change during desiccation/rehydrated (a) and flooding (b). Both figures illustrate the impact of each disruption, suggesting a degradation of geochemical and redox stratification due to either desiccation and/or the energy of the flooding.
Water 13 00815 g006
Publisher’s Note: MDPI stays neutral with regard to jurisdictional claims in published maps and institutional affiliations.

