Machine Learning and Data Analytic Techniques in Digital Water Metering: A Review
by
 , , and
Md Shamsur Rahim
1,* ,
,
Khoi Anh Nguyen
2,
Rodney Anthony Stewart
2 ,
,
Damien Giurco
3 and
Michael Blumenstein
1 1
Centre for Artificial Intelligence, School of Computer Science, University of Technology Sydney, Sydney 2007, NSW, Australia
2
School of Engineering and Built Environment, Griffith University, Gold Coast 4222, QLD, Australia
3
Institute for Sustainable Futures, University of Technology Sydney, Sydney 2007, NSW, Australia
*
Author to whom correspondence should be addressed.
Water 2020, 12(1), 294; https://doi.org/10.3390/w12010294
Submission received: 3 December 2019
/
Revised: 5 January 2020
/
Accepted: 14 January 2020
/
Published: 19 January 2020
(This article belongs to the Special Issue Role of Intelligent Sensor Networks and Big Data Informatics for Enhanced Management of Urban Water and Energy Resources)
Abstract
:Digital or intelligent water meters are being rolled out globally as a crucial component in improving urban water management. This is because of their ability to frequently send water consumption information electronically and later utilise the information to generate insights or provide feedback to consumers. Recent advances in machine learning (ML) and data analytic (DA) technologies have provided the opportunity to more effectively utilise the vast amount of data generated by these meters. Several studies have been conducted to promote water conservation by analysing the data generated by digital meters and providing feedback to consumers and water utilities. The purpose of this review was to inform scholars and practitioners about the contributions and limitations of ML and DA techniques by critically analysing the relevant literature. We categorised studies into five main themes: (1) water demand forecasting; (2) socioeconomic analysis; (3) behaviour analysis; (4) water event categorisation; and (5) water-use feedback. The review identified significant research gaps in terms of the adoption of advanced ML and DA techniques, which could potentially lead to water savings and more efficient demand management. We concluded that further investigations are required into highly personalised feedback systems, such as recommender systems, to promote water-conscious behaviour. In addition, advanced data management solutions, effective user profiles, and the clustering of consumers based on their profiles require more attention to promote water-conscious behaviours.
1. Introduction
In a recent report published by the World Economic Forum, water scarcity was identified as one of the largest global risks because only 0.014% of all water is fresh and easily accessible [1]. Four factors can be contribute to water scarcity: (1) uneven geographic distribution of water sources; (2) urbanization with rapid growth in population and economy; (3) poor water resource management; and (4) prolonged drought [2,3]. For these reasons, many metropolitan water utilities are facing challenges, such as ensuring water supply during water shortages caused by prolonged drought and avoiding low water pressure during the hours of peak demand [4]. These challenges have paved the way for a smart technology-based, updated water distribution infrastructure that supports safe, reliable, and sustainable water supply to consumers [5], including by supporting water demand management (WDM). WDM aims to ensure a more efficient water supply and promote water conservation measures. WDM has five categories: (1) engineering (i.e., upgrading to more water-efficient appliances); (2) economic (e.g., imposing block water tariffs); (3) enforcement (i.e., imposing water restrictions); (4) encouragement (i.e., rewards or rebate schemes for water conservation); and (5) education (i.e., encouraging water conservation in consumers, such as taking shorter showers) [6]. However, reliable and preferably real-time information is required for identifying and implementing effective WDM strategies [7]. Digital water meters (DWMs), accompanied by machine learning (ML) and data analytic (DA) techniques, can play significant roles by providing reliable and real-time information for identifying and implementing successful WDM strategies [8,9,10,11,12]. This is why the importance of DWMs has continued to escalate in Australia as well as other countries over the past few years [13]. A healthy number of investigations have been undertaken to generate useful insights through applying ML and DA techniques to data collected from DWMs. However, further investigations are required to develop new ML and DA techniques to improve the outcomes from current conservation and demand management programs.
To identify novel methods of applying ML and DA techniques, it is important to first identify what has been done thus far, what could have been done, and what the limitations of previous studies are. To achieve these goals, we performed a systematic literature review in the field. Despite previous review studies having been conducted in this field [14,15,16,17,18,19,20,21,22,23], none—to the best of our knowledge—have been conducted from the perspective of ML and DA techniques. We believe that by providing a focused investigation of the literature, this review will benefit ML and DA practitioners as well as researchers in the water industry who are working on digital water metering and closely related fields. Furthermore, we discuss the potential solutions and research directions that can be used as a baseline for future research.
After critically and carefully analysing the literature, we identified several noteworthy findings.
- First, the literature indicates that a positive relationship exists between the level of personalisation and effects on water conservation. That is, if a water conservation program is more personalised, then it contributes more to conservation. For instance, water end-use feedback programs result in more water conservation than does demand forecasting because the former is more personalised. Thus, the absence in this field of highly personalised systems such as recommender systems is notable. Recommender systems (RSs) are defined as intelligent systems that combine software tools and technologies to recommend a list of items that are most likely of interest to the user [24,25,26]. Generally, the goal of an RS is to assist individuals who lack the experience or competence to select a potential item from an overwhelming number of alternatives offered by a service provider [25]. Such RSs in the water sector may help consumers to choose and perform appropriate actions for promoting water-conscious behaviours. From a business-intelligence perspective, the existing studies mostly fall under descriptive or predictive analytics. Therefore, a research gap exists in terms of contributions to the highest level of analytics—prescriptive analytics.
- Second, in cases of water end-use feedback, online/web-based programs perform better than paper-based or visual display-based feedback systems. Therefore, future research related to water end-use feedback should be undertaken that considers online/web-based programs.
- Third, effective factors and measures that will be useful to direct future research (e.g., online feedback, communication strategies, water consumption data, and social comparison) have been identified in terms of promoting water conservation through water end-use feedback.
- Fourth, the literature shows that during the last 10 years, short-term residential water demand forecasting has attracted more attention than medium-term demand forecasting. This is because of the availability of high-frequency data generated by DWMs. However, further studies are required to improve the overall accuracy of predictions by reducing errors.
- Fifth, the absence of a data management solution such as a data warehouse (DW) was noted; in many studies, water consumption data were stored in a plain text file, which is unsuitable for performing analytics with a large amount of data in a real-world scenario.
- Lastly, we observed that behaviour analysis studies are mostly based on total water consumption data. Thus, further research on behaviour analysis using disaggregated water consumption data to extract novel and useful knowledge is essential for promoting effective water conservation.
2. Scope and Method
The purpose of this literature review was to identify research gaps in relation to the application of DA techniques to the DWM data of residential consumers, as well as the importance of highly personalised water consumption feedback. To accomplish this task, we followed the systematic quantitative literature review method proposed by Pickering and Byrne [27]. This method has 15 steps that allow researchers to produce a structured quantitative summary of the field by systematically analysing relevant literature [27]; Figure 1 depicts these 15 stages. We present a summary of the process as follows.
When examining the literature, it soon became clear that research on digital water metering analytics can be divided into two broad categories: nonresidential and residential. Nonresidential studies include those on commercial buildings (i.e., small to large businesses, educational institutions, and hospitals) and residential studies include those on domestic households [28]. However, this study only focused on the residential sector because it consumes the highest percentage of water in an urban environment at 65–80% [28,29]. Therefore, the literature related to nonresidential water metering was outside this study’s scope. After defining the topic as digital water metering data analytics, we formulated the research question in step two, which was as follows:
- How are machine learning and data analytic techniques applied to residential digital water metering data to promote water conservation among residential consumers and manage water demand in an urban environment?
Based on this research question, we identified keywords using concept mapping to search databases. This literature review employed three research databases, namely Scopus, IEEE Xplorer, and ProQuest Science & Technology. The keywords used to search these three databases included but were not limited to:
- “digital water meter” and data, residential
- “smart water meter” and data, residential
- “intelligent water meter” and data, residential
- “water meter” and feedback and “water conservation”
- “water meter” and machine learning
- “water meter” and artificial intelligence
- “water meter” and data analysis or analytics
The identified keywords were used to generate queries, which were used to search in the databases. Furthermore, because of rapid progress in artificial intelligence and ML and DA techniques in recent years, studies published before 2010 were excluded from this review. For each query, each of the databases returned several documents that included journal articles, conference papers, books, book chapters, reviews, and reports depending on the database. (Table 1) represents a sample of query executions in the Scopus database along with the number of returned documents.
Based on titles and abstracts, we downloaded 223 relevant papers identified from the search results. To manage the articles and references, we used the EndNote reference management software package (Clarivate Analytics, Philadelphia, PA, USA). After going through the articles in smaller batches, it soon became clear that the existing literature could be categorised into five main themes. Therefore, this review focused on the five main themes that appear frequently in the literature: (1) water-use feedback; (2) water event categorisation; (3) water demand forecasting; (4) behaviour analysis; and (5) socioeconomic analysis. Water-use feedback provided to consumers compares their water consumption with that of others and provides general tips on water saving that are not highly personalised. Water event categorisation provides consumers with a better understanding of their consumption, as well as a leak-detection facility. Depending on the forecast horizon, forecasting models can be classified into three classes. Long-term forecasting (e.g., the next 20 years) is beneficial for infrastructure and capital planning, whereas medium-term forecasting (e.g., years or months) helps to decide water rates. Conversely, very short-term forecasting (e.g., hourly intervals) is crucial for water utilities to plan how to manage demand in advance. Studies under the behaviour analysis theme have mainly aimed to understand the behaviours—as well as the dynamics—of consumers based on water consumption data. Lastly, socioeconomic studies attempt to determine social, economic, and demographic effects on water conservation. Figure 2 illustrates the comprehensive themes from the literature on the digital water metering analytics of residential households.
After further macro-level reading (i.e., paragraphs, overall structure/arguments, and illustrations), 118 articles were removed because of a lack of relevance or doubts about quality/authenticity. To ensure quality in this study, most articles published in conference proceedings were ignored; only a small number were selected based on having a high citation rate or particular relevance. Furthermore, some articles were selected using the ‘snowballing’ technique [30]; thus, the total number of articles expanded to 105. After this step, we produced and reviewed summary tables, drafted methods, and evaluated key results and conclusions. Figure 3 presents the number of papers from each theme for the years 2010 to 2019. From this figure, it is clear that water demand forecasting has received more attention from the research community compared with other categories. The following section presents the findings from our critical evaluation of the studies from these five categories.
3. ML and DA Techniques in Digital Water Metering
Depending of their nature, different studies have adopted different approaches where ML or DA techniques may not be the primary focus. For this reason, many of these studies have not employed any ML or DA techniques at all. However, these studies are highly relevant because their findings are crucial to understanding the usage of DWM data for promoting water conservation and identifying the room of improvement and challenges in applying ML and DA techniques to improve the situation. Thus, in this section, we present a critical analysis of the studies that involve any relevant analysis or apply ML or DA techniques to the digital water metering data of residential consumers.
3.1. Water-Use Feedback
Digital water metering provides the opportunity to provide customised and detailed water-use feedback to consumers, which can promote water conservation. Since the deployment of digital meters, researchers have investigated the influence of several feedback techniques regarding water-use. Therefore, the studies under this theme can be divided into three main categories: visual display-based feedback, paper-based feedback, and online feedback. We present a critical analysis of articles in these categories in the following subsections.
3.1.1. Visual Display-Based Feedback
The studies under this category mainly use a visual display to provide feedback to consumers about their water consumption. In 2010, the effects of alarming visual display monitors on shower water and energy conservation were investigated by Willis et al. [31], revealing a positive effect. In 2013, another study investigated the short- and long-term effects of providing a visual display monitor feedback with an alarm feature on conserving shower water [32]. In that study, the authors used a visual display monitor that triggered an alarm if consumers used more water than the value established by the researchers. The findings showed that the integration of alarming visual display monitors reduced water consumption in the form of shower water volume by 27% in the short term. However, after four months, water consumption reverted back to pre-retrofit levels. The authors employed descriptive statistics and surveys to generate their results, and finally concluded that informing consumers of their resource consumption via technological devices might not be effective unless changes occurred in their habits or attitudes. Although we agree with the authors’ conclusion, we argue that the inclusion of personalised engagement with consumers and feedback on other water end-use events might have improved the outcomes of their study. Furthermore, these studies did not consider other consumption events except showers.
3.1.2. Paper-Based Feedback
Many studies seeking to unlock the full potential of detailed paper-based water end-use feedback leveraged from digital water data have been undertaken [6,15,33,34,35,36]. Although the ultimate goals of these studies are similar in nature, they fall into different categories based on their unique approach.
To understand the effect of paper-based reports on water conservation, Liu et al. conducted several studies [6,15,34]. Their outcomes revealed that during winter, paper-based reports were associated with 7.6% more water savings than for the control group [6]. The reports included water consumption by category, a consumption comparison with similar households, custom insights, and water saving tips. However, during summer, the consumption level of the intervention group was higher than that of the control group. Because the baseline data were only recorded for a few days, this may have influenced the summer result. Furthermore, we argue that these studies may have been improved if more personalised information had been provided along with more frequent consumption feedback.
Depending on the communication strategy, the effectiveness of water conservation programs may vary. Therefore, based on this hypothesis, a study was conducted to identity the effectiveness of four communication strategies adopted from the psychological literature [35]. These strategies were social norms, social identity, personal identity, and the knowledge deficient approach. The analysis demonstrated that social norms, social identity, and personal identity methods provided superior prospects for water saving. Here, social norms were represented through a comparison of water consumption with the users’ immediate neighbour, coupled with social approval (i.e., a sad face or happy face if consumption was above or below the mean). Social identity consisted of a short communication regarding water conservation behaviour in the local city area using highly inclusive language. Finally, personal identity communication was similar to social identity, except it used personal identity language. The study also reported an interesting finding regarding the ineffectiveness of the knowledge deficient approach (i.e., water saving tips) among high water consumers [35]. Although the study did not employ a personalised feedback system, its findings indicated the possibility of future research adopting clustering techniques to perform comparisons of water consumption with immediate neighbours.
In addition, research was undertaken to identify the effectiveness of two water conservation programs, namely the data logger and water-wise house call (WWHC) programs in California’s Sacramento County in the United States (US) [36]. The data logger program provided a detailed report of water consumption for each fixture (e.g., shower, irrigation, dishwasher, and clothes washer) and the WWHC provided findings and recommendations to participants via a 1-h call from a trained water-efficiency professional. The findings suggested that both programs were effective, but the data logger was more effective (in 84% of households) than the WWHC program (62% of households). Although we acknowledge the findings from this study, we argue that the incorporation of near real-time feedback along with personalised recommendations would have improved the effectiveness of the programs.
The effectiveness of water conservation programs may differ depending on water stress levels. The literature has mainly focused on areas where water resources are under stress. However, one study was undertaken by Otaki et al. [33] to identify the most effective type of feedback in promoting water conservation in Tokyo, Japan, where water shortages are not yet a concern. After employing three types of feedback information—actual and mean consumption, water consumption rankings, and emoticons—with three groups of households, the study revealed that the effectiveness of feedback information varies for high and low water consumers. Emoticons played a significant role in reducing the water consumption of high consumers, and water consumption rankings further reduced the water consumption of low consumers. However, we suggest that the exclusion of the summer season from this study may have affected the outcomes. Moreover, reports were sent to consumers with no highly personalised feedback every two weeks, which meant that the study missed the opportunities to inform consumers about their consumption in real time and to enable them to take corrective measures, such as stopping a leak.
The evidence suggests that paper-based reports have a positive effect on water conservation. However, we argue that relevant studies have some common limitations. First, paper-based reports cannot be delivered in real/near real time, which results in poor communication about abnormal consumption. Second, ML techniques are absent in feedback generation because they are limited to water consumption feedback and comparisons. The inclusion of highly personalised recommendations on how to conserve water could promote water conservation more effectively. Lastly, we conclude that because of their delivery frequency, paper-based reports cannot contribute to managing peak hour water demands, which is a great challenge for water utilities.
3.1.3. Online Feedback
Because of the rapid progress in information technology, several studies have examined the promotion of water conservation through online portals. The literature on this topic can be broadly classified into two categories: experimental studies and conceptual studies.
Among the experimental studies, Liu et al. [37] performed an investigation to understand the long- and short-term effects of an online portal on water conservation. The authors claimed that online feedback had a greater and long-term effect as it reduced the water consumption (by 4.2%) among an intervention group compared with a control group. They also left open the question of how to motivate and increase the interest and engagement of consumers with such systems, as user engagement was low. We acknowledge this problem but consider that integrating advanced ML techniques to incorporate highly personalised feedback and an effective incentive/rebate scheme may have improved the situation. In a similar study, Erickson et al. [38] showed that the inclusion of near real-time water consumption data, along with a social comparison, weekly games, and news and chat delivered via a web portal led to a 6.6% reduction in water consumption. They also mentioned that hourly consumption data (88%) were the most accessed feature, followed by comparisons with neighbours (66%) and game results (48%). This finding indicates that the inclusion of gamification was not particularly appealing to consumers. Gamification can be defined as the “use of video game elements in non-gaming context to improve user experience and user engagement” [39]. However, we noted some limitations in their study. First, the participants were volunteers; the results might differ in the real world because of the level of interest among participants. Second, the study did not provide any detailed water consumption feedback. We consider that the inclusion of such feedback would promote enhanced water conservation. Lastly, highly personalised recommendations for water conservation were lacking.
Although conceptual studies do not measure the effectiveness of the proposed web portals, because of their contribution in generating novel ideas, they were included in this review. Kossieris et al. [40] proposed a web platform to monitor and control water and energy consumption by providing valuable information and feedback in real time. Their study presented the novel idea of collecting several critical pieces of information through a web portal, such as the characteristics of a household, instruments, and geospatial data. Furthermore, it proposed integrating an eLearning module into the web portal, which could reduce the cost of traditional educational programs. Lanzarone et al. [41] presented the concept of another interactive web portal that used hourly consumption data to perform comparisons, as well as a multiple-choice questionnaire, to generate a customer profile based on consumption data, consumer behaviour, and building characteristics. This idea would be an effective replacement for a traditional survey as a method for obtaining demographic data.
It is clear that the effectiveness of online feedback systems suffers from a lack of user engagement. Other than that, they can play a crucial role in delivering and collecting information that would benefit both consumers and water suppliers.
Studies related to water-use feedback systems have shown that online feedback is the most effective and potentially useful medium of the three water-use feedback types for promoting water conservation. We concluded that a visual display-based feedback system is not effective in the long run and the cost of implementation might be a problem for a wide rollout. Two studies were performed to identify the most effective of the remaining two types: paper-based and online feedback. In the first study [42], the authors analysed the effect of these two feedback types in 68 and 120 households, respectively. They concluded that an online portal had a greater influence than paper-based reports (50% and 30%, respectively) in terms of behaviour change and water-using infrastructure (30% and 10%, respectively). However, because of the lack of user engagement with the online portal, the overall water saving metric was lower for online feedback (4.2%) than for paper-based reports (8.0%). The second study reported the same phenomenon [43]: only 18% of participants accessed the website from the 141 households chosen to receive web-based materials. These studies suggest that users with higher engagement in online portals are able to save more water than receivers of paper-based feedback. Thus, after careful analysis of the literature, we concluded that online feedback has greater potential for water conservation compared with paper-based feedback, which is supported by the findings from this study [16]. Along with these studies, the necessity for further investigation has been discussed to identify the most effective type of feedback in terms of information content, granularity, and frequency of delivery [44]. (Table 2) summarises the key characteristics of the literature on water-use feedback.
3.2. Water Demand Forecasting
Water demand prediction or forecasting is a challenging yet highly desirable task for water utilities in metropolitan areas for avoiding water shortages or low water pressure during peak water usage periods [4]. Many approaches have been proposed for forecasting water demand using the data collected from DWMs. The literature covers a wide range of approaches for predicting water demand from short (hourly, daily, weekly, and monthly) to long (10–15 years) term. Based on the nature of these methods, studies can be placed into four categories: neural network (NN)-based methods, regression tree-based methods, stochastic-based methods, and hybrid methods.
3.2.1. Neural Network-Based Methods
The dominance of NN-based methods is notable in water demand prediction because of the large volume of smart metering data. Authors have employed a range of artificial NNs (ANNs) in their proposed methods [46,47,48,49,50].
Several water end-use demand forecasting models were developed using feed-forward back propagation networks and radial basis function networks by Bennett, Stewart, and Beal [50]. Using household demographic, socioeconomic, and water appliance stock efficiency data, this study can provide short-term water demand forecasting and identify the key determinants. To determine the most suitable machine learning method for water demand forecasting, Mouatadid and Adamowski conducted a study [48]. They deployed NN, support vector regression (SVR), extreme learning machine (ELM), and multiple linear regression (MLR) models to forecast water demand with 1–3 days lead time. The study found that ELM models outperformed other methods in terms of accuracy. In another study, a three-layer feedforward NN was proposed with three neurons in each layer [46]. Eight predictors were used to predict the water demand 6 h ahead. The study demonstrated that the NN outperformed the regression tree in terms of training errors. However, the proposed approach suffered from high standard deviation errors, making it unfit for further adoption. A hybrid particle swarm optimisation–ANN (PSO-ANN) was deployed in one study to predict water demand [47]. This study introduced a climatic factor-based approach where maximum temperature, rainfall, and solar radiation were identified as robust predictors. In evaluating the performance of the proposed method, the authors showed that the PSO-ANN produced a lower RMSE score than a hybrid backtracking search algorithm ANN (BSA-ANN) in terms of a fitness function. Furthermore, the study presented the correlation coefficient values for stochastic and seasonal data at the validation stage, where R = 0.972 and 0.982, respectively. However, the study was based on historical monthly water consumption data from 2006 to 2015 collected by Yarra Valley Water and consisted of water consumption in mega litres (1 mega litre = 1 million litres). Thus, the effectiveness of the proposed approach is yet to be tested for predicting water demand over shorter periods (i.e., hours, days, and weeks) using high-resolution metering data. In another study, an NN was deployed with summary statistics by Walker et al. [49]. Although the method could predict the general trend, it encountered difficulties in forecasting peak demands.
Although the application of NNs has improved results significantly, we observed the absence of advanced NNs, such as deep learning (DL) NNs. DL models [51] have several training layers that can outperform previous base results [52]. To improve forecasting accuracy, future studies can be conducted that focus on DL.
3.2.2. Regression-Based Methods
After NN-based methods, regression-based methods are the next most common type of method in the literature for predicting water demand [46,48,53,54,55,56,57,58].
To forecast hourly water demand, a support vector regression (SVR) based model was identified as the best performing model from different machine learning methods by Herrera et al. [59]. Besides SVR, the other machine learning methods were Artificial Neural Network (ANN), Random forest, Multivariate Adaptive Regression Splines (MARS) and Projection Pursuit Regression (PPR). Though SVR performed better compared to AAN, advanced neural networks such as Long Short Term Memory (LSTM) [60] may improve the outcome. Similarly, to characterise and forecast hourly water demand, a support vector machine (SVM)-based regression model was investigated by Candelieri [54,55]. However, the proposed approach performed better in forecasting at an aggregated level (urban water demand) compared with the individual level (single customer) because of the variability in behaviour at the individual customer level. Furthermore, the studies were based on data collected from 26 automatic meter readings (AMRs) over 3 months, which was another limitation. To identify the key determinants and forecast water demand for shower and indoor water consumption, Makki et al. [56,57] performed regression analysis. They identified the key factors behind residential water consumption, and their proposed models provided better accuracy in predicting short-term water demand based on those key factors. Polebitski and Palmer [58] developed a regression-based water forecasting model at a bimonthly time-step for individual multi-houses. They found that water demand was more elastic to price and income effects during summer months than in winter months for single-family homes. In [53], the authors fitted models based on ensembles of regression trees using the LSBoost algorithm to predict outdoor residential water consumption. Although the proposed approach had lower absolute error values, its predictability was limited to 1 h.
Regression-based approaches are effective at identifying key factors that drive water consumption and can predict the demand based on these factors. Still, many of the previous studies have only considered the water consumption data or combined consumption data with demographic data or climatic data. Thus, future studies should consider the consumption data along with climatic and sociodemographic data to enhance forecasting models. In addition, (Table 3) shows that most of the regression-based studies were on hourly or daily forecasting.
Therefore, the applicability of regression-based methods to predict monthly, quarterly, or yearly water demand can be investigated.
3.2.3. Stochastic-Based Methods
After regression and ANN-based techniques, the application of stochastic-based techniques is notable for forecasting water demand. In several studies [29,61,62,64,68], researchers have applied different stochastic approaches.
Abadi et al. [64] proposed a mixture of nonhomogeneous hidden Markov models (MixJNHMM) to cluster and forecast short-term water demand. The aim of this study was to cluster consumption behaviour series into several groups and forecast future behaviours for each group of consumers separately. The proposed method provided 80% accuracy for predicting water consumption behaviours.
To predict water demand at multi-spatial and temporal scales, Rathnayaka et al. applied a stochastic model [62]. It performed better at predicting mid-to-short-term water demand compared with their short-term demand forecasting model. Thus, short-term prediction models require further improvements. Blokker, Vreeburg, and Van Dijk [61] developed a stochastic end-use demand model based on the statistical information of users and end-uses. Although the developed model could forecast water demand at 1-s intervals with high accuracy at the simulation level, it lacked an application on real data.
In addition, an auto-regressive integrated moving average (ARIMA)-based approach was proposed by Yalçintaş et al. [29] for forecasting urban water supply and demand in the Istanbul Metropolitan Municipality, Istanbul, Turkey. Although the model could forecast both water supply and demand, the size of the dataset was too small compared with other studies, because the water demand data were annual and only for eight years. On the other hand, for forecasting quarterly water demand, Sebri investigated several methods such as seasonal auto-regressive integrated moving average (SARIMA) and ANN models [68]. The study finally concluded that the NN model outperformed all the competing models in terms of forecasting accuracy.
3.2.4. Hybrid-Based Methods
Hybrid-based methods in this study refer to approaches where more than one technique was employed for forecasting water demand. A healthy amount of research has been undertaken to forecast water demand with the help of hybrid-based methods. Moreover, various studies have applied different hybrid techniques.
In a hybrid approach, Autoflow© [4,69] combined different algorithms (i.e., dynamic harmonic regression, Kalman filter, and fixed interval smooth) to predict short-term water demand. The proposed model was verified for three datasets. In the results of 100 tests, the value of the coefficient of determinism, , was greater than 0.9, and the mean absolute percentage error (MAPE) was less than 5%. However, for further verification of the efficiency of the proposed model, it is essential to perform more testing using additional datasets. Furthermore, the proposed model was limited to forecasting only up to 24 h ahead. Therefore, its effectiveness for predicting water demand more than 24 h ahead must be investigated.
An ANN was combined with a time-series model to predict daily water demand by Al-Zahrani and Abo-Monasar [65]. They proposed combining the general regression NN (GRNN) model with a moving average method, and concluded that the hybrid method performed better than the time-series or ANN-based methods. Similarly, a fourier time series process over a SVR was proposed by Brentan et al. [63]. Seo, Kwon, and Choi proposed an ELM integrated with variational model decomposition (VMD) for forecasting short-term water demand [70]. Zubaidi et al. proposed using singular spectrum analysis (SSA) and a linear autoregressive model [71] for predicting water demand. Furthermore, Duerr et al. [66] evaluated the following spatiotemporal statistical models and ML algorithms to forecast monthly water demand: linear and linear mixed models with month effects, a multiple linear regression model, and time-series models (AR(1) and ARIMA, spatiotemporal Gaussian process models, generalized additive models GAM), random forests (RF), Bayesian additive regression trees (BART), and gradient boosting machines (GBM)). The study found that time-series models outperformed other models, indicating the temporal dynamics of water consumption.
After critically analysing the literature, it became clear that ANN- and time series-based methods have performed better than hybrid-based methods. Further studies can be performed to observe the results when advanced ANN-based methods are integrated with time-series approaches for forecasting water demand.
3.3. Water Event Categorisation
The aim of water event categorisation is to identify the events associated with consumption for more effective water management. Studies that have focused on this topic can be divided into two categories: leaks and water end-use classification. Detecting leaks and notifying consumers about them can prevent vast amounts of water being wasted and help to keep bills at normal levels.
3.3.1. Leaks
Detecting leaks in water distribution is a challenging yet crucial task. This is because in most cases, water lines are situated underground, and furthermore, spikes in water bills may come as a shock to consumers because dampness may not appear on the surface. Real-time leak detection and alerts can lead to prompt repairs of leaks, thereby saving a substantial amount of water. To accomplish this task, many approaches have been employed [72,73,74,75,76]. Among these approaches, clustering techniques is the most popular for leak detection, followed by the hybrid approach (Table 4).
However, further research can be done to identify very small leaks (i.e., slow dripping taps) that create flows of such a low flow rate (<3 L/h) that cannot be picked up by the meter (if the water meter does not record higher flow rates). Still, in the long run, leak detection techniques exhibit minimal effectiveness because they cannot promote water conservation once a leak is repaired.
3.3.2. Water End-Use Classification
In a 2010 study, categorising water end-use was identified as the most critical challenge and one that required urgent attention, because existing approaches to water end-use analysis required much time [64]. Since then, several approaches have been proposed [4,5,64,89] to classify water end-use. These can be placed into three broad categories: decision tree methods; data mining techniques applied to data collected from sensor devices integrated into water appliances; and hybrid approaches.
In previous studies [90,91], decision tree methods were mostly associated with the three physical attributes of an event—volume, duration, and flow rate—to classify water end-use. Pressure-based sensors were combined with water appliances to perform water end-use categorisation using data mining techniques [92,93]. However, both of these approaches lacked accuracy, and thus have not been deployed widely. Lastly, the hybrid category contains studies that combined multiple techniques to solve the problem of categorising water end-use. In this category, Autoflow© [4] was identified as making the most prominent contribution, and pattern recognition and data mining techniques were employed to perform the categorisation. For autonomous water end-use classification, the authors combined a hidden Markov model, dynamic time wrapping algorithm, and ANN with one hidden layer and 20 neurons to predict six categories. In most cases, the proposed approach achieved over 90% accuracy; however, for categorising bathtub and irrigation water end-use, the accuracy was 88.1% and 85.9%, respectively, which reduced the overall accuracy of the proposed approach. The relevant literature clearly indicates that categorising water end-use still requires substantial attention.
3.4. Socioeconomic Analysis
Several studies have been undertaken to understand the effect of socioeconomic and demographic factors in water consumption and conservation [19,32,94]. Although these studies have not promoted immediate water savings, they have helped to identify the social, economic, and demographic factors behind water consumption patterns, which may lead to effective water management policies such as targeted community awareness programs or education.
In addition, studies performed to identify the determinants of household water consumption are essential for understanding the factors behind increasing or decreasing water usage. According to Bich-Ngoc and Teller [19], the examined factors in the literature can be categorised into six groups: (a) economic; (b) sociodemographic; (c) physical characteristics; (d) technological; (e) climatic; and (f) special factors. Higher income, older tenants, presence of infants, double income family, larger house area, irrigation, holiday, number of generations, and renter-occupied household are some of the drivers behind increased water consumption. By contrast, lower-income, younger tenants, absence of infants, single income family, smaller house, lower educated residents and owner-occupied household are the factors for decreased water usage. Notably, a few factors contradict each other. For instance, in most of the studies, a higher family income led to greater water consumption. However, Beal et al. [94] found that higher family income may lead to lower water usage, which was later supported by the findings of Willis et al. [32]. Similarly, in the case of family size, Willis et al. [32] reported that a larger family size contributed to decreased water consumption. A few studies have discussed the possible effect of pricing on water conservation; for instance, most US cities have a lower price per unit for high consumption than for low consumption, which may lead to water shortages in the future [95]. In other investigations, increasing block tariffs along with real-time information seem to have been effective but this requires confirmation in further research [96,97].
3.5. Behaviour Analysis
Studies under the behaviour analysis theme have mainly aimed to understand the behaviours and dynamics of consumers based on water consumption data. Various techniques such as profiling, habit detection, and pattern recognition have been deployed to achieve this goal (Table 5).
Cases of habit detection and profiling [105,110] have followed a cluster-based approach. Cardell-Oliver [110] identified four types of pattern: continuous-flow days; exceptional peak-use days; programmed patterns with recurrent hours; and normal use patterns. However, Cominola et al. [105] identified three profiles based on the eigenbehaviours of hourly consumption. Cole and Stewart [88] provided a detailed breakdown of hourly use by volume for the peak hour, peak day, and peak month to make accurate estimations of outdoor and indoor components. Later, a habit detection algorithm was proposed by Cardell-Oliver [103], but it could not guarantee the detection of all habits in a time series because of heuristics.
Moreover, a few studies have applied clustering techniques to segment or cluster consumers based on their water consumption data. For instance, Leyli-Abadi et al. [98] proposed a MixJNHMM model to cluster consumption behaviour and forecast future behaviour. Ji et al. [107] clustered residents by family structure, job type, or lifestyle based on water consumption data using a fuzzy clustering algorithm. In their study, users were divided into five clusters; although the size of the dataset was relatively small, the proposed approach provided interesting insights into users’ lifestyles.
With regard to predicting water demand, many studies have been conducted to extract demand patterns. McKenna, Fusco, and Eck [89] proposed an approach for classifying demand patterns using Gaussian mixture models and K-means clustering. The authors averaged weekday demands over a full month to deal with noisy values, which was a superior approach to those used in other studies. Gurung et al. [106] developed a water demand profile for modelling water demand using diurnal patterns and clustering techniques; however, they only used 14 weeks of data, which was insufficient for understanding the effect of seasonality on water consumption. Later, Cheifetz et al. [101] identified eight relevant usage profiles from water consumption data using clustering and modelling techniques. However, scalability was a concern with the proposed approach.
A limited number of studies—albeit notable ones—have been conducted in the area of behaviour change. For example, Novak et al. [112] and Fraternali et al. [113] studied behaviour changes through gamified incentive models for simulating water savings, and found reduced consumption and positive user feedback. On the hand, Quesnel and Ajami [114] observed that changes in water consumption are linked to heavy news media coverage of water- and drought-related issues. Jorgensen et al. [115] tested explanations behind the lack of association between water conservation and intentions, and found that intentions, habit strength, and their interactions were not good predictors for future water conservation. Lastly, Fielding et al. [116] reported that intervention groups showed a reduced level of water consumption over a period of 12 months, and after that time, their water consumption returned to pre-intervention levels.
Behaviour analysis studies are important for understanding the behaviour dynamics of consumers. Such an understanding is useful for water utilities to derive innovative and effective water conservation programs. Studies to date have been based on total water consumption data. However, behaviour analysis based on disaggregated water consumption may reveal interesting and useful insights that may lead to more effective water conservation. Thus, we have identified a gap in the literature involving behaviour analysis based on disaggregated water events.
4. Findings and Discussion
The aim of this section is to highlight the findings that emerged from the critical analysis of the literature pertaining to the five themes identified for this study. Among several interesting findings, one of the most important is the relationship between personalisation of information and effectiveness of water conservation. We observed that more strongly personalised programs have more effect on water savings. That is, if a water conservation program provides more personalised feedback or information, then it contributes towards more water savings. Figure 4 summarises this finding based on the literature showing that water-use feedback programs have the highest levels of personalisation by providing customised water consumption summaries and statistics. Studies related to this theme reported from 4.2% to 27.0% water savings, which is the highest level among all themes.
Water event categorisation helps consumers to detect leaks and provides information on water consumption by category. This type of program may help consumers to save water by facilitating the detection of leaks and reduced consumption based on the categorised water consumption data. However, consumers may not be aware of the potential water saving opportunities provided by this information. In addition, such programs cannot provide highly personalised feedback to promote water conservation. Behaviour analysis and socioeconomic analysis studies have identified the factors driving water consumption. This knowledge may assist in the design of water conservation programs for large populations that involve a lower level of personalisation and have less influence on water savings in the short term. Lastly, water demand forecasting studies have predicted the future water demand for a specific area or municipality but with less personalisation. This type of prediction helps utilities with efficient demand management but has no effect on water conservation by consumers. This confirms that effects on water conservation are strongly related to personalisation. However, the scope remains to adopt highly personalised systems, such as recommender systems, to promote water-conscious behaviour through prescriptive analytics.
From a business-intelligence perspective, prescriptive analytic is the highest level of analytics; they identify and suggest a set of actions to achieve business goals based on descriptive and predictive analytics. Because previous studies mostly fall under descriptive and predictive analytics, the absence of prescriptive analytics for promoting water-conscious behaviour was noted in this study, as shown in Figure 5.
Table 2 condenses the findings from the literature on water-use feedback. Although it may seem that paper-based feedback performs better than visual display or online feedback systems, one study [42] revealed that online portals have a greater influence than do paper-based reports (50% and 30%, respectively) in terms of behaviour change and water-use infrastructure (30% and 10%, respectively). However, because of the lack of user engagement with the online portal, the overall water saving metric was lower for online feedback (4.2%) than for paper-based reports (8.0%). In addition, [43] reported the same phenomenon: only 18% of participants accessed the website from 141 households chosen to receive web-based materials. These studies suggest that users with higher engagement with online portals are able to save more water than those receiving paper-based feedback. Thus, after carefully analysing the literature, we concluded that online feedback has greater potential for water conservation than does paper-based feedback, as supported by the findings of [16]. These studies indicate the necessity for further investigation to identify the most effective type of feedback in terms of information content, granularity, and frequency of delivery [44].
In the case of water demand forecasting, the literature analysed in the present study shows that over the last decade, short-term water demand for households has received more attention than medium-term demand forecasting. Figure 6 shows that from 2010 to 2019, the cumulative number of studies on short-term demand forecasting reached 16, whereas for medium-term forecasting the number was only six. Clearly, the availability of higher-frequency water consumption data in recent years has resulted in more research on short-term water demand forecasting.
Table 3 summarises studies on water demand forecasting based on the forecast horizon, forecast frequency, and forecasting techniques. In the case of short-term forecast horizons, hourly and daily forecasting frequencies have dominated over shorter or longer frequencies. This is because these two forecast frequencies are essential for water utilities to ensure the supply of water according to forecasted demand. Another finding is that for short-term water demand forecasting, regression and hybrid techniques have been the most commonly applied. However, in recent years, the performance of ANN-based extreme learning machines indicates that further studies are required to improve the overall accuracy of prediction by reducing errors.
Table 4 summarises the techniques applied in the water end-use categorisation literature to detect leaks and disaggregate end-use events. In terms of leak detection, clustering techniques were the most popular, followed by minimum night flow techniques. To ensure greater effectiveness, future research should focus on proactive leak-detection techniques. Hybrid techniques are mostly used in disaggregated end-use event classification, yet the current state-of-the-art accuracy of only around 93% suggests that scope exists for further research on this topic.
Furthermore, a healthy number of studies have reported that socioeconomic factors largely influence water consumption. Although these variables do not promote water conservation directly, identifying these variables is crucial to understand the reason for increments or decrements in water consumption, as well as to determine effective water conservation program and policies. Figure 7 presents the socioeconomic variables that increase or decrease water consumption according to [32,94,117,118,119,120]. Higher family income and larger family size are the two determinants that may lead to either increases or decreases in water usage. Therefore, future studies should address this issue in greater detail.
The literature related to behaviour analysis plays a vital role in understanding consumer behaviour. This understanding is useful for water utilities to develop and deliver innovative and effective water conservation programs. The application of clustering techniques is notable for behavior analysis (Table 6).
However, we identified a gap in behaviour analysis research based on disaggregated water events: studies to date have been based on total water consumption data, but behaviour analysis based on disaggregated water consumption may reveal noteworthy and useful insights that may lead to more effective water conservation.
To understand the nature of the DWM data used in previous studies, we also collected various information such as sample size, data collection duration, and data frequency. Sample size mainly refers to the number of DWMs or households from which data were collected. Data collection duration represents the amount of time for which data were collected. We categorised data frequency into three categories: very short, short, and medium. The very short category includes the studies where the data frequency was 1 s, 5 s, 10 s, or 15 min. Hourly or daily data are considered short frequency data. Lastly, data collected at weekly, bimonthly, monthly, or yearly frequencies fall into the medium frequency category. (Table 7) presents a condensed summary of the studies based on sample size, data collection duration, and data frequency.
From the table, it is quite clear that in the case of very-short-frequency data, very rarely have studies been performed with more than 300 households/DWMs and data collection durations over six months. One of the reasons for this could be the trial rollout of DWMs. However, once DWMs are rolled out fully, this issue should be resolved.
Thus, we conclude that there is further scope to apply novel and advanced ML and DA techniques such as recommender systems to develop highly personalised feedback systems for promoting water-conscious behaviour. Further, to improve customer engagement with the system, integration of gamification may be helpful. To make recommender systems scalable, various clustering techniques need to be investigated. In addition, the introduction of data management solutions for the big data generated from DWMs would be an interesting development. Finally, user profiling or clustering based on disaggregated water consumption data may reveal knowledge that is essential, but remains unexplored.
5. Conclusions
Water scarcity and low pressure during peak usage times are the two key challenges facing water utilities in urban areas. Trial rollouts of DWMs in many countries have revealed the potential of DWMs in water conservation, as is evident in the literature. Among the many findings, the review of these studies led us to conclude that a direct relationship exists between the level of personalisation and water conservation. However, in this review, by critically analysing relevant studies, we identified research gaps and future opportunities regarding DWMs, to promote water conservation from ML and DA perspectives.
The identified research gaps or findings in this area are briefly discussed below:
- Absence of highly personalised feedback systems: As mentioned earlier, we observed a direct relationship between the level of personalisation and effects on water conservation. However, the absence in this field of highly personalised systems such as recommender systems [26] is notable. By generating a list of custom-tailored suggestions, such highly personalised system would promote water-conscious behaviour more effectively [122].
- Absence of advanced ML and DA techniques: A good number of ML and DA techniques have been applied to the data collected from DWMs. Many of these applied techniques were either basic or a mixture of several techniques. However, the application of advanced ML and DA techniques such as deep learning [51], deep reinforcement learning [123], anomaly detection [124], and recommender systems [26] in this field is rare. For instance, deep learning can be adopted to improve the accuracy of water demand forecasting, anomaly detection based techniques for abnormal water consumption (i.e., leak, theft) detection models, and deep reinforcement learning can be used to determine suitable actions for promoting water conservation. If applied properly, these advanced techniques may improve results.
- Limitations in customer profiling and clustering: Existing customer profiling and clustering studies have mostly been based on total consumption. For this reason, it is almost impossible to create customer profiles or perform clustering based on each water consumption event, such as shower, dishwashing, and gardening. Although disaggregated water consumption events are available, the gap in customer profiling and clustering is noticeable.
- Absence of data management solutions: Storing data in a plain text file is not suitable for performing analytics with a large amount of data in a real-world scenario. However, we observed that in many studies, DWM data are stored in such files. This indicates the absence of data management solutions for DWM data.
- Water demand forecasting and accuracy: In this study, we found that short-term water demand forecasting has gained more attention in recent years compared with medium- or long-term water demand forecasting. However, we noted that further research scope exists in this area to improve prediction accuracy.
- Effectiveness of the feedback-delivery medium: The success of a water conservation program largely depends on the medium of its feedback. Among the various media, we observed that an online or web portal-based medium is the most effective when users were active.
- Lack of user engagement with online portals: Although existing works show that online portals are the most effective medium for delivering feedback, the lack of user engagement is still a challenge.
- Limitations of clustering techniques: Among the many clustering techniques, we noticed that the application of k-means clustering was very common. However, the k-means clustering technique has some limitations, such as in determining the value of k, the impact of the initial centroid value on the final result, and sensitiveness to the size of the data [125]. Furthermore, computational cost and scalability are challenging issues for any clustering technique. Therefore, besides k-means, other clustering techniques for big data [126] such as CLARANS [127], BIRCH [128], and CURE [129] should be investigated.
- Factors affecting water consumption and conservation: We listed the socioeconomic factors appearing in the articles that affect water consumption and conservation. These factors are crucial to consider for future research in this area. However, we noted that two determinants (higher income and family size) can be responsible for both increments and reductions in water consumption.
- Limitation of DWM data: While reviewing the literature, it soon became clear that some limitations exist in high-frequency DWM data in terms of the number of participating households, duration of data collection, and frequency of DWM data. In case of high-frequency data (5 s, 10 s, and 1-min intervals), most of the studies collected data from fewer than 300 households and for less than 1 month in duration. However, high-frequency data can provide more insights compared with weekly, monthly, and yearly data.
Based on the findings and identified research gaps from the literature review, we provide the following recommendations for utilities and governments, as well as future research directions for the research community:
- Highly personalised feedback and recommender systems: Recommender systems can play a vital role in promoting water-conscious behaviours by providing highly personalised feedback [122]. Because this area is still unexplored, future research can be conducted on this topic.
- Deploy advanced ML and DA techniques: To improve accuracy in disaggregating water events, water demand forecasting, leak detection, customer profiling, and clustering, further research can be performed that deploys advanced ML and DA techniques such as deep learning, reinforcement learning, and anomaly detection.
- Customer profiling and clustering based on disaggregated data: Previous customer profiling and clustering studies have mostly been based on hourly total water consumption data. However, customer profiling and segmenting based on high-frequency disaggregated water consumption data may provide more insights. Therefore, future research should address these issues.
- Research on the data warehouse solution: Data warehouses are well-known for optimising analytics. However, no studies have been conducted on this topic, and thus further research can be conducted on developing data warehouse solutions. Such solutions would be beneficial for storing and analysing the vast amount of data generated by DWMs.
- Feedback-delivery medium for future research: Compared with other feedback-delivery media such as paper and visual displays, online or web portal systems perform better in terms of water conservation. Therefore, future research can be implemented using online or web portal-based feedback delivery.
- Increasing user engagement in online portals: Researchers have studied the impact of gamification and reward or rebate programs on user engagement. However, no comparative studies have been conducted to determine which is the most effective. Therefore, further investigation can be conducted to identify the most effective user engagement technique in online portals.
- Application of clustering techniques: Because many studies rely heavily on the k-means clustering technique, which has some limitations, further research can be conducted to identify alternative techniques that may improve the results of behaviour analysis, and water end-use categorisation.
- Dealing with limited DWM data: Collecting a large volume of DWM data is not an easy task because DWMs are still in the pilot stage, and furthermore, participation in such programs is mostly voluntary. To overcome this limitation, a synthetic data generation technique [130] was proposed, but further research can be conducted on this topic. Furthermore, investigations can be conducted to develop advanced ML techniques that work on a smaller dataset.
Author Contributions
Conceptualization, M.S.R., K.A.N., R.A.S., D.G., and M.B.; Methodology, M.S.R., K.A.N., R.A.S., D.G., and M.B.; Formal Analysis, M.S.R., K.A.N.; Data Curation, M.S.R., K.A.N.; Writing—Original Draft Preparation, M.S.R.; Writing—Review and Editing, M.S.R., K.A.N., R.A.S., D.G., and M.B.; funding acquisition, K.A.N., R.A.S., D.G., and M.B. All authors have read and agreed to the published version of the manuscript.
Funding
This research was funded by the Australian Research Council (ARC), grant number LP160100215, which also includes funding from the following industry partners: Yarra Valley Water, City West Water, Southeast Water, and Aquiba.
Conflicts of Interest
The funders had no role in the design of the study; in the collection, analyses, or interpretation of data; in the writing of the manuscript, or in the decision to publish the results.
References
- The Global Risks Report 2019; World Economic Forum: Geneva, Switzerland, 2019.
- Harou, J.J.; Medellín-Azuara, J.; Zhu, T.; Tanaka, S.K.; Lund, J.R.; Stine, S.; Olivares, M.A.; Jenkins, M.W. Economic consequences of optimized water management for a prolonged, severe drought in California. Water Resour. Res. 2010, 46. [Google Scholar] [CrossRef]
- Jiang, Y. China’s water scarcity. J. Environ. Manag. 2009, 90, 3185–3196. [Google Scholar] [CrossRef] [PubMed]
- Nguyen, K.A.; Sahin, O.; Stewart, R.A.; Zhang, H. Water demand forecasting with AUTOFLOW© using State-Space approach. In Proceedings of the 8th International Congress on Environmental Modelling and Software, Toulouse, France, 10–14 July 2016. [Google Scholar]
- Nguyen, K.A.; Stewart, R.A.; Zhang, H.; Sahin, O.; Siriwardene, N. Re-engineering traditional urban water management practices with smart metering and informatics. Environ. Model. Softw. 2018, 101, 256–267. [Google Scholar] [CrossRef] [Green Version]
- Liu, A.; Giurco, D.; Mukheibir, P. Urban water conservation through customised water and end-use information. J. Clean. Prod. 2016, 112, 3164–3175. [Google Scholar] [CrossRef]
- Sahin, O.; Stewart, R.A.; Porter, M.G. Water security through scarcity pricing and reverse osmosis: A system dynamics approach. J. Clean. Prod. 2015, 88, 160–171. [Google Scholar] [CrossRef] [Green Version]
- Stewart, R.A.; Nguyen, K.; Beal, C.; Zhang, H.; Sahin, O.; Bertone, E.; Vieira, A.S.; Castelletti, A.; Cominola, A.; Giuliani, M.; et al. Integrated intelligent water-energy metering systems and informatics: Visioning a digital multi-utility service provider. Environ. Model. Softw. 2018, 105, 94–117. [Google Scholar] [CrossRef]
- Tanverakul, S.A.; Lee, J. Impacts of metering on residential water use in California. Am. Water Work. Assoc. 2015, 107, E69–E75. [Google Scholar] [CrossRef] [Green Version]
- Reynaud, A.; Pons, M.; Pesado, C. Household water demand in Andorra: Impact of individual metering and seasonality. Water 2018, 10, 321. [Google Scholar] [CrossRef] [Green Version]
- Randall, T.; Koech, R. Smart water metering technology for water management in urban areas. Water E-J. 2019, 4. [Google Scholar] [CrossRef]
- Gurung, T.R.; Stewart, R.A.; Beal, C.D.; Sharma, A.K. Smart meter enabled informatics for economically efficient diversified water supply infrastructure planning. J. Clean. Prod. 2016, 135, 1023–1033. [Google Scholar] [CrossRef] [Green Version]
- Beal, C.D.; Flynn, J. Toward the digital water age: Survey and case studies of Australian water utility smart-metering programs. Util. Policy 2015, 32, 29–37. [Google Scholar] [CrossRef] [Green Version]
- Cominola, A.; Giuliani, M.; Piga, D.; Castelletti, A.; Rizzoli, A.E. Benefits and challenges of using smart meters for advancing residential water demand modeling and management: A review. Environ. Model. Softw. 2015, 72, 198–214. [Google Scholar] [CrossRef] [Green Version]
- Liu, A.; Giurco, D.; Mukheibir, P.; White, S. Detailed water-use feedback: A review and proposed framework for program implementation. Util. Policy 2016, 43, 140–150. [Google Scholar] [CrossRef] [Green Version]
- Liu, A.; Mukheibir, P. Digital metering feedback and changes in water consumption—A review. Resour. Conserv. Recycl. 2018, 134, 136–148. [Google Scholar] [CrossRef]
- Boyle, T.; Giurco, D.; Mukheibir, P.; Liu, A.; Moy, C.; White, S.; Stewart, R. Intelligent Metering for Urban Water: A Review. Water 2013, 5, 1052–1081. [Google Scholar] [CrossRef] [Green Version]
- Monks, I.; Stewart, R.A.; Sahin, O.; Keller, R. Revealing Unreported Benefits of Digital Water Metering: Literature Review and Expert Opinions. Water 2019, 11, 838. [Google Scholar] [CrossRef] [Green Version]
- Bich-Ngoc, N.; Teller, J. A review of residential water consumption determinants. In Lecture Notes in Computer Science (Including Subseries Lecture Notes in Artificial Intelligence and Lecture Notes in Bioinformatics); Springer: Cham, Switzerland, 2018; Volume 10964 LNCS, pp. 685–696. [Google Scholar]
- Miller, C.; Nagy, Z.; Schlueter, A. A review of unsupervised statistical learning and visual analytics techniques applied to performance analysis of non-residential buildings. Renew. Sustain. Energy Rev. 2018, 81, 1365–1377. [Google Scholar] [CrossRef]
- Donkor, E.A.; Mazzuchi, T.A.; Soyer, R.; Alan Roberson, J. Urban Water Demand Forecasting: Review of Methods and Models. J. Water Resour. Plan. Manag. 2014. [Google Scholar] [CrossRef]
- Makropoulos, C.; Savić, D. Urban Hydroinformatics: Past, Present and Future. Water 2019, 11, 1959. [Google Scholar] [CrossRef] [Green Version]
- Moglia, M.; Cook, S.; Tapsuwan, S. Promoting Water Conservation: Where to from here? Water 2018, 10, 1510. [Google Scholar] [CrossRef] [Green Version]
- Burke, R. Hybrid Web Recommender Systems. In The Adaptive Web; Springer: Berlin, Germany, 2007; pp. 377–408. [Google Scholar]
- Ricci, F.; Rokach, L.; Shapira, B. Recommender Systems: Introduction and Challenges. In Recommender Systems Handbook; Springer: Boston, MA, USA, 2015; pp. 1–34. [Google Scholar]
- Resnick, P.; Varian, H.R. Recommender systems. Commun. ACM 1997, 40, 56–58. [Google Scholar] [CrossRef]
- Pickering, C.; Byrne, J. The benefits of publishing systematic quantitative literature reviews for PhD candidates and other early-career researchers. High. Educ. Res. Dev. 2014, 33, 534–548. [Google Scholar] [CrossRef] [Green Version]
- Water Conservation Report; Sydney Water: Sydney, Australia, 2018.
- Yalçintaş, M.; Bulu, M.; Küçükvar, M.; Samadi, H. A framework for sustainable urban water management through demand and supply forecasting: The case of Istanbul. Sustainability 2015, 7, 11050–11067. [Google Scholar] [CrossRef] [Green Version]
- Wohlin, C. Guidelines for snowballing in systematic literature studies and a replication in software engineering. In Proceedings of the 18th International Conference on Evaluation and Assessment in Software Engineering, London, UK, 13–14 May 2014; pp. 1–10. [Google Scholar]
- Willis, R.M.; Stewarta, R.A.; Panuwatwanich, K.; Jones, S.; Kyriakides, A. Alarming visual display monitors affecting shower end use water and energy conservation in Australian residential households. Resour. Conserv. Recycl. 2010, 54, 1117–1127. [Google Scholar] [CrossRef] [Green Version]
- Willis, R.; Stewart, R.; Giurco, D.; Talebpour, M.; Mousavinejad, A. End use water consumption in households: Impact of socio-demographic factors and efficient devices. J. Clean. Prod. 2013, 60, 107–115. [Google Scholar] [CrossRef] [Green Version]
- Otaki, Y.; Ueda, K.; Sakura, O. Effects of feedback about community water consumption on residential water conservation. J. Clean. Prod. 2017, 143, 719–730. [Google Scholar] [CrossRef]
- Liu, A.; Giurco, D.; Mukheibir, P. Motivating metrics for household water-use feedback. Resour. Conserv. Recycl. 2015, 103, 29–46. [Google Scholar] [CrossRef]
- Seyranian, V.; Sinatra, G.M.; Polikoff, M.S. Comparing communication strategies for reducing residential water consumption. J. Environ. Psychol. 2015, 41, 81–90. [Google Scholar] [CrossRef]
- Tom, G.; Tauchus, G.; Williams, J.; Tong, S. The Role of Communicative Feedback in Successful Water Conservation Programs. Appl. Environ. Educ. Commun. 2011, 10, 80–90. [Google Scholar] [CrossRef]
- Liu, A.; Giurco, D.; Mukheibir, P.; Mohr, S.; Watkins, G.; White, S. Online water-use feedback: Household user interest, savings and implications. Urban Water J. 2017, 14, 900–907. [Google Scholar] [CrossRef]
- Erickson, T.; Podlaseck, M.; Sahu, S.; Dai, J.D.; Chao, T.; Naphade, M. The dubuque water portal: Evaluation of the uptake, use and impact of residential water consumption feedback. In Proceedings of the SIGCHI Conference on Human Factors in Computing Systems, Austin, TX, USA, 10–15 April 2010; pp. 675–684. [Google Scholar]
- Deterding, S.; Sicart, M.; Nacke, L.; O’Hara, K.; Dixon, D. Gamification. using game-design elements in non-gaming contexts. In Proceedings of the CHI’11 Extended Abstracts on Human Factors in Computing Systems, Vancouver, BC, Canada, 7–12 May 2011; pp. 2425–2428. [Google Scholar]
- Kossieris, P.; Kozanis, S.; Hashmi, A.; Katsiri, E.; Vamvakeridou-Lyroudia, L.S.; Farmani, R.; Makropoulos, C.; Savic, D. A web-based platform for water efficient households. Procedia Eng. 2014, 89, 1128–1135. [Google Scholar] [CrossRef] [Green Version]
- Lanzarone, G.A.; Zanzi, A. Monitoring gas and water consumption through icts for improved user awareness. Inf. Commun. Soc. 2010, 13, 121–135. [Google Scholar] [CrossRef]
- Liu, A.; Giurco, D.; Mukheibir, P. Advancing household water-use feedback to inform customer behaviour for sustainable urban water. Water Sci. Technol. Water Supply 2017, 17, 198–205. [Google Scholar] [CrossRef] [Green Version]
- Schultz, P.W.; Messina, A.; Tronu, G.; Limas, E.F.; Gupta, R.; Estrada, M. Personalized Normative Feedback and the Moderating Role of Personal Norms: A Field Experiment to Reduce Residential Water Consumption. Environ. Behav. 2014, 48, 686–710. [Google Scholar] [CrossRef] [Green Version]
- Sønderlund Anders, L.; Smith Joanne, R.; Hutton Christopher, J.; Kapelan, Z.; Savic, D. Effectiveness of Smart Meter-Based Consumption Feedback in Curbing Household Water Use: Knowns and Unknowns. J. Water Resour. Plan. Manag. 2016, 142, 04016060. [Google Scholar] [CrossRef] [Green Version]
- Stewart, R.A.; Willis, R.M.; Panuwatwanich, K.; Sahin, O. Showering behavioural response to alarming visual display monitors: Longitudinal mixed method study. Behav. Inf. Technol. 2013, 32, 695–711. [Google Scholar] [CrossRef] [Green Version]
- Pesantez, J.E.B.; Berglund, E.Z.; Kaza, N. Modeling and Forecasting Short-Term Water Demand Reported by Smart Meters. In Proceedings of the 1st International WDSA/CCWI 2018 Joint Conference, Kingston, ON, Canada, 23–25 July 2018. [Google Scholar]
- Zubaidi, S.L.; Dooley, J.; Alkhaddar, R.M.; Abdellatif, M.; Al-Bugharbee, H.; Ortega-Martorell, S. A Novel approach for predicting monthly water demand by combining singular spectrum analysis with neural networks. J. Hydrol. 2018, 561, 136–145. [Google Scholar] [CrossRef]
- Mouatadid, S.; Adamowski, J. Using extreme learning machines for short-term urban water demand forecasting. Urban Water J. 2016, 14, 630–638. [Google Scholar] [CrossRef]
- Walker, D.; Creaco, E.; Vamvakeridou-Lyroudia, L.; Farmani, R.; Kapelan, Z.; Savić, D. Forecasting Domestic Water Consumption from Smart Meter Readings Using Statistical Methods and Artificial Neural Networks. Procedia Eng. 2015, 119, 1419–1428. [Google Scholar] [CrossRef] [Green Version]
- Bennett, C.; Stewart, R.A.; Beal, C.D. ANN-based residential water end-use demand forecasting model. Expert Syst. Appl. 2013, 40, 1014–1023. [Google Scholar] [CrossRef] [Green Version]
- LeCun, Y.; Bengio, Y.; Hinton, G. Deep learning. Nature 2015, 521, 436–444. [Google Scholar] [CrossRef] [PubMed]
- Hinton, G.; Deng, L.; Yu, D.; Dahl, G.; Mohamed, A.-R.; Jaitly, N.; Senior, A.; Vanhoucke, V.; Nguyen, P.; Kingsbury, B. Deep neural networks for acoustic modeling in speech recognition. IEEE Signal Process. Mag. 2012, 29, 82–97. [Google Scholar] [CrossRef]
- Peter van Platsko, V.B. Identification, Prediction, and Explanation of Outdoor Residential Water Consumption Using Smart Meter Data2018. In Proceedings of the 1st International WDSA/CCWI 2018 Joint Conference, Kingston, ON, Canada, 23–25 July 2018. [Google Scholar]
- Candelieri, A. Clustering and Support Vector Regression for Water Demand Forecasting and Anomaly Detection. Water 2017, 9, 224. [Google Scholar] [CrossRef]
- Candelieri, A.; Soldi, D.; Archetti, F. Short-term forecasting of hourly water consumption by using automatic metering readers data. Procedia Eng. 2015, 119, 844–853. [Google Scholar] [CrossRef]
- Makki, A.A.; Stewart, R.A.; Beal, C.D.; Panuwatwanich, K. Novel bottom-up urban water demand forecasting model: Revealing the determinants, drivers and predictors of residential indoor end-use consumption. Resour. Conserv. Recycl. 2015, 95, 15–37. [Google Scholar] [CrossRef] [Green Version]
- Makki, A.A.; Stewart, R.A.; Panuwatwanich, K.; Beal, C. Revealing the determinants of shower water end use consumption: Enabling better targeted urban water conservation strategies. J. Clean. Prod. 2013, 60, 129–146. [Google Scholar] [CrossRef] [Green Version]
- Polebitski, A.S.; Palmer, R.N. Seasonal Residential Water Demand Forecasting for Census Tracts. J. Water Resour. Plan. Manag. 2010, 136, 27–36. [Google Scholar] [CrossRef]
- Herrera, M.; Torgo, L.; Izquierdo, J.; Pérez-García, R. Predictive models for forecasting hourly urban water demand. J. Hydrol. 2010, 387, 141–150. [Google Scholar] [CrossRef]
- Hochreiter, S.; Schmidhuber, J. Long short-term memory. Neural Comput. 1997, 9, 1735–1780. [Google Scholar] [CrossRef]
- Blokker, E.J.M.; Vreeburg, J.H.G.; van Dijk, J.C. Simulating residential water demand with a stochastic end-use model. J. Water Resour. Plan. Manag. 2010, 136, 19–26. [Google Scholar] [CrossRef]
- Rathnayaka, K.; Malano, H.; Arora, M.; George, B.; Maheepala, S.; Nawarathna, B. Prediction of urban residential end-use water demands by integrating known and unknown water demand drivers at multiple scales II: Model application and validation. Resour. Conserv. Recycl. 2017, 118, 1–12. [Google Scholar] [CrossRef]
- Brentan, B.M.; Luvizotto, E., Jr.; Herrera, M.; Izquierdo, J.; Pérez-García, R. Hybrid regression model for near real-time urban water demand forecasting. J. Comput. Appl. Math. 2017, 309, 532–541. [Google Scholar] [CrossRef]
- Abadi, M.L.; Same, A.; Oukhellou, L.; Cheifetz, N.; Mandel, P.; Feliers, C.; Chesneau, O. Predictive Classification of Water Consumption Time Series Using Non-homogeneous Markov Models. In Proceedings of the 2017 IEEE International Conference on Data Science and Advanced Analytics (DSAA), Tokyo, Japan, 19–21 October 2017; pp. 323–331. [Google Scholar]
- Al-Zahrani, M.A.; Abo-Monasar, A. Urban residential water demand prediction based on artificial neural networks and time series models. Water Resour. Manag. 2015, 29, 3651–3662. [Google Scholar] [CrossRef]
- Duerr, I.; Merrill, H.R.; Wang, C.; Bai, R.; Boyer, M.; Dukes, M.D.; Bliznyuk, N. Forecasting urban household water demand with statistical and machine learning methods using large space-time data: A Comparative study. Environ. Model. Softw. 2018, 102, 29–38. [Google Scholar] [CrossRef]
- Sharvelle, S.; Dozier, A.; Arabi, M.; Reichel, B. A geospatially-enabled web tool for urban water demand forecasting and assessment of alternative urban water management strategies. Environ. Model. Softw. 2017, 97, 213–228. [Google Scholar] [CrossRef]
- Sebri, M. ANN versus SARIMA models in forecasting residential water consumption in Tunisia. J. Water Sanit. Hyg. Dev. 2013, 3, 330–340. [Google Scholar] [CrossRef]
- Nguyen, K.A.; Stewart, R.; Zhang, H.; Jones, C.; Siriwardene, N.; Brown, A.; Radion, A.; Crook, J.; Stevens, M.; Smith, N.; et al. Developing a next generation machine learning system for enhanced urban water management: Autoflow. In Proceedings of the Ozwater19, Melbourne, Australia, 7–9 May 2019. [Google Scholar]
- Seo, Y.; Kwon, S.; Choi, Y. Short-term water demand forecasting model combining variational mode decomposition and extreme learning machine. Hydrology 2018, 5, 54. [Google Scholar] [CrossRef] [Green Version]
- Zubaidi, S.L.; Kot, P.; Alkhaddar, R.M.; Abdellatif, M.; Al-Bugharbee, H. Short-term water demand prediction in residential complexes: Case study in Columbia city, USA. In Proceedings of the International Conference on Developments in eSystems Engineering, DeSE, Cambridge, UK, 2–5 September 2018; pp. 31–35. [Google Scholar]
- Bragalli, C.; Neri, M.; Toth, E. Effectiveness of smart meter-based urban water loss assessment in a real network with synchronous and incomplete readings. Environ. Model. Softw. 2019, 128–142. [Google Scholar] [CrossRef]
- Farah, E.; Shahrour, I. Smart water for leakage detection: Feedback about the use of automated meter reading technology. In Proceedings of the 2017 Sensors Networks Smart and Emerging Technologies, SENSET, Beirut, Lebanon, 12–14 September 2017; pp. 1–4. [Google Scholar]
- Kermany, E.; Mazzawi, H.; Baras, D.; Naveh, Y.; Michaelis, H. Analysis of advanced meter infrastructure data of water consumption in apartment buildings. In Proceedings of the ACM SIGKDD International Conference on Knowledge Discovery and Data Mining, Chicago, IL, USA, 11–14 August 2013; pp. 1159–1167. [Google Scholar]
- Schultz, W.; Javey, S.; Sorokina, A. Smart Water Meters and Data Analytics Decrease Wasted Water Due to Leaks. J. Am. Water Work. Assoc. 2018, 110, E24–E30. [Google Scholar] [CrossRef]
- Candelieri, A.; Archetti, F.; Messina, E. Analytics for supporting urban water management. Environ. Eng. Manag. J. 2013, 12, 875–881. [Google Scholar] [CrossRef]
- Srinivasan, V.; Stankovic, J.; Whitehouse, K. WaterSense: Water flow disaggregation using motion sensors. In Proceedings of the BuildSys 2011 3rd ACM Workshop on Embedded Sensing Systems for Energy-Efficiency in Buildings, Held in Conjunction with ACM SenSys 2011, Seattle, WA, USA, 1 November 2011; pp. 19–24. [Google Scholar]
- Gao, Y.; Hou, D.; Banerjee, N.K.; Banerjee, S. Water fixture identification in smart housing: A domain knowledge based case study. In Proceedings of the 2016 15th IEEE International Conference on Machine Learning and Applications, Anaheim, CA, USA, 18–20 December 2016; pp. 904–909. [Google Scholar]
- Nguyen, K.A.; Stewart, R.A.; Zhang, H. An autonomous and intelligent expert system for residential water end-use classification. Expert Syst. Appl. 2014, 41, 342–356. [Google Scholar] [CrossRef] [Green Version]
- Pastor-Jabaloyes, L.; Arregui, F.; Cobacho, R. Water End Use Disaggregation Based on Soft Computing Techniques. Water 2018, 10, 46. [Google Scholar] [CrossRef] [Green Version]
- Nguyen, K.A.; Stewart, R.A.; Zhang, H.; Jones, C. Intelligent autonomous system for residential water end use classification: Autoflow. Appl. Soft Comput. 2015, 31, 118–131. [Google Scholar] [CrossRef] [Green Version]
- Fontdecaba, S.; Sánchez-Espigares, J.A.; Marco-Almagro, L.; Tort-Martorell, X.; Cabrespina, F.; Zubelzu, J. An Approach to Disaggregating Total Household Water Consumption into Major End-Uses. Water Resour. Manag. 2013, 27, 2155–2177. [Google Scholar] [CrossRef] [Green Version]
- Nguyen, K.A.; Stewart, R.A.; Zhang, H. An intelligent pattern recognition model to automate the categorisation of residential water end-use events. Environ. Model. Softw. 2013, 47, 108–127. [Google Scholar] [CrossRef] [Green Version]
- Soares, E.S.; Oliveira-Esquerre, K.P.; de Aguiar, A.M.; Botelho, G.L.P.; Kiperstok, A. Development of a model to identify combined use in residential water end use events. In Computer Aided Chemical Engineering; Elsevier: Amsterdam, The Netherlands, 2018; Volume 44, pp. 1951–1956. [Google Scholar]
- Pastor-Jabaloyes, L.; Arregui, F.J.; Cobacho, R. A filtering algorithm for high-resolution flow traces to improve water end-use analysis. Water Supply 2019, 19, 451–462. [Google Scholar] [CrossRef]
- Guragai, B.; Hashimoto, T.; Oguma, K.; Takizawa, S. Data logger-based measurement of household water consumption and micro-component analysis of an intermittent water supply system. J. Clean. Prod. 2018, 197, 1159–1168. [Google Scholar] [CrossRef]
- Beal, C.D.; Stewart, R.A. Identifying Residential Water End Uses Underpinning Peak Day and Peak Hour Demand. J. Water Resour. Plan. Manag. 2014, 140. [Google Scholar] [CrossRef] [Green Version]
- Cole, G.; Stewart, R.A. Smart meter enabled disaggregation of urban peak water demand: Precursor to effective urban water planning. Urban Water J. 2013, 10, 174–194. [Google Scholar] [CrossRef] [Green Version]
- McKenna, S.A.; Fusco, F.; Eck, B.J. Water Demand Pattern Classification from Smart Meter Data. Procedia Eng. 2014, 70, 1121–1130. [Google Scholar] [CrossRef] [Green Version]
- Wizard, T. Trace Wizard Water Use Analysis Tool; Users Manual; Aquacaft. Inc.: Boulder, CO, USA, 2003. [Google Scholar]
- Kowalski, M.; Marshallsay, D. A system for improved assessment of domestic water use components. In Proceedings of the II International Conference Efficient Use and Management of Urban Water Supply, Tenerife, Spain, 2–4 April 2003. [Google Scholar]
- Froehlich, J.E.; Larson, E.; Campbell, T.; Haggerty, C.; Fogarty, J.; Patel, S.N. HydroSense: Infrastructure-mediated single-point sensing of whole-home water activity. In Proceedings of the 11th International Conference on Ubiquitous Computing, Orlando, FL, USA, 30 September–3 October 2009; pp. 235–244. [Google Scholar]
- Froehlich, J.; Larson, E.; Saba, E.; Campbell, T.; Atlas, L.; Fogarty, J.; Patel, S. A longitudinal study of pressure sensing to infer real-world water usage events in the home. In Proceedings of the International Conference on Pervasive Computing, San Francisco, CA, USA, 12–15 June 2011; pp. 50–69. [Google Scholar]
- Beal, C.; Stewart, R.A.; Spinks, A.; Fielding, K. Using smart meters to identify social and technological impacts on residential water consumption. Water Sci. Technol. Water Supply 2011, 11, 527–533. [Google Scholar] [CrossRef] [Green Version]
- Luby, I.H.; Polasky, S.; Swackhamer, D.L. U.S. Urban Water Prices: Cheaper When Drier. Water Resour. Res. 2018, 54, 6126–6132. [Google Scholar] [CrossRef]
- Sahin, O.; Bertone, E.; Beal, C.D. A systems approach for assessing water conservation potential through demand-based water tariffs. J. Clean. Prod. 2017, 148, 773–784. [Google Scholar] [CrossRef] [Green Version]
- Strong, A.; Goemans, C. The impact of real-time quantity information on residential water demand. Water Resour. Econ. 2015, 10, 1–13. [Google Scholar] [CrossRef]
- Leyli-Abadi, M.; Same, A.; Oukhellou, L.; Cheifetz, N.; Mandel, P.; Feliers, C.; Chesneau, O. Mixture of Non-homogeneous Hidden Markov Models for Clustering and Prediction of Water Consumption Time Series. In Proceedings of the International Joint Conference on Neural Networks, Rio de Janeiro, Brazil, 8–13 July 2018. [Google Scholar]
- Padulano, R.; Del Giudice, G. A Mixed Strategy Based on Self-Organizing Map for Water Demand Pattern Profiling of Large-Size Smart Water Grid Data. Water Resour. Manag. 2018, 32, 3671–3685. [Google Scholar] [CrossRef]
- Vieira, P.; Jorge, C.; Covas, D. Efficiency assessment of household water use. Urban Water J. 2018, 15, 407–417. [Google Scholar] [CrossRef]
- Cheifetz, N.; Noumir, Z.; Samé, A.; Sandraz, A.-C.; Féliers, C.; Heim, V. Modeling and clustering water demand patterns from real-world smart meter data. Drink. Water Eng. Sci. 2017, 10, 75–82. [Google Scholar] [CrossRef] [Green Version]
- Garcia, D.; Puig, V.; Quevedo, J.; Cugueró, M.A. Big Data Analytics and Knowledge Discovery Applied to Automatic Meter Readers. In Real-time Monitoring and Operational Control of Drinking-Water Systems; Springer International Publishing: Cham, Switzerland, 2017; pp. 401–423. [Google Scholar]
- Cardell-Oliver, R. A habit detection algorithm (Hda) for discovering recurrent patterns in smart meter time series. In Lecture Notes in Computer Science (Including Subseries Lecture Notes in Artificial Intelligence and Lecture Notes in Bioinformatics); Springer International Publishing: Cham, Switzerland, 2016; Volume 9546, pp. 109–127. [Google Scholar]
- Cardell-Oliver, R.; Wang, J.; Gigney, H. Smart Meter Analytics to Pinpoint Opportunities for Reducing Household Water Use. J. Water Resour. Plan. Manag. 2016, 142. [Google Scholar] [CrossRef]
- Cominola, A.; Moro, A.; Riva, L.; Giuliani, M.; Castelleti, A. Profiling residential water users’ routines by eigenbehavior modelling. In Proceedings of the 8th International Congress on Environmental Modelling and Software (iEMSs 2016), Toulouse, France, 10–14 July 2016. [Google Scholar]
- Gurung, T.R.; Stewart, R.A.; Beal, C.D.; Sharma, A.K. Smart meter enabled water end-use demand data: Platform for the enhanced infrastructure planning of contemporary urban water supply networks. J. Clean. Prod. 2015, 87, 642–654. [Google Scholar] [CrossRef] [Green Version]
- Ji, Y.; Yong, L.; Jingfeng, Y.; Ke, K.; Yuehua, H.; Wenguang, Q. Analysis of urban residential water consumption based on smart meters and fuzzy clustering. In Proceedings of the 2015 IEEE International Conference on Computer and Information Technology, Ubiquitous Computing and Communications; Dependable, Autonomic and Secure Computing; Pervasive Intelligence and Computing, Liverpool, UK, 26–28 October 2015; pp. 1295–1301. [Google Scholar]
- Laspidou, C.; Papageorgiou, E.; Kokkinos, K.; Sahu, S.; Gupta, A.; Tassiulas, L. Exploring patterns in water consumption by clustering. Procedia Eng. 2015, 119, 1439–1446. [Google Scholar] [CrossRef] [Green Version]
- Gurung, T.R.; Stewart, R.A.; Sharma, A.K.; Beal, C.D. Smart meters for enhanced water supply network modelling and infrastructure planning. Resour. Conserv. Recycl. 2014, 90, 34–50. [Google Scholar] [CrossRef] [Green Version]
- Cardell-Oliver, R. Water use signature patterns for analyzing household consumption using medium resolution meter data. Water Resour. Res. 2013, 49, 8589–8599. [Google Scholar] [CrossRef]
- Solanas, J.L.; Cussó, M.R. Multivariate consumption profiling (MCP) for intelligent meter systems: A methodology to define categories and levels. Water Sci. Technol. Water Supply 2010, 10, 710–720. [Google Scholar] [CrossRef]
- Novak, J.; Melenhorst, M.; Micheel, I.; Pasini, C.; Fraternali, P.; Rizzoli, A.E. Integrating behavioural change and gamified incentive modelling for stimulating water saving. Environ. Model. Softw. 2018, 102, 120–137. [Google Scholar] [CrossRef]
- Fraternali, P.; Baroffio, G.; Pasini, C.; Galli, L.; Micheel, I.; Novak, J.; Rizzoli, A. Integrating Real and Digital Games with Data Analytics for Water Consumption Behavioral Change: A Demo. In Proceedings of the 2015 IEEE/ACM 8th International Conference on Utility and Cloud Computing, Limassol, Cyprus, 7–10 December 2015; pp. 408–409. [Google Scholar]
- Quesnel, K.J.; Ajami, N.K. Changes in water consumption linked to heavy news media coverage of extreme climatic events. Sci. Adv. 2017, 3. [Google Scholar] [CrossRef] [PubMed] [Green Version]
- Jorgensen, B.S.; Martin, J.F.; Pearce, M.W.; Willis, E.M. Aligning theory and measurement in behavioral models of water conservation. Water Policy 2015, 17, 762–776. [Google Scholar] [CrossRef]
- Fielding, K.S.; Spinks, A.; Russell, S.; McCrea, R.; Stewart, R.; Gardner, J. An experimental test of voluntary strategies to promote urban water demand management. J Environ. Manag. 2013, 114, 343–351. [Google Scholar] [CrossRef]
- Kenney, D.S.; Goemans, C.; Klein, R.; Lowrey, J.; Reidy, K. Residential water demand management: Lessons from Aurora, Colorado 1. Jawra J. Am. Water Resour. Assoc. 2008, 44, 192–207. [Google Scholar] [CrossRef]
- Kim, S.; Choi, S.; Koo, J.; Choi, S.; Hyun, I. Trend analysis of domestic water consumption depending upon social, cultural, economic parameters. Water Sci. Technol. Water Supply 2007, 7, 61–68. [Google Scholar] [CrossRef]
- Rozos, E.; Butler, D.; Makropoulos, C. An integrated system dynamics–cellular automata model for distributed water-infrastructure planning. Water Sci. Technol. Water Supply 2016, 16, 1519–1527. [Google Scholar] [CrossRef] [Green Version]
- Baki, S.; Rozos, E.; Makropoulos, C. Designing water demand management schemes using a socio-technical modelling approach. Sci. Total Environ. 2018, 622, 1590–1602. [Google Scholar] [CrossRef] [PubMed]
- Hou, B.; Yang, R.; Zhan, X.; Tian, W.; Li, B.; Xiao, W.; Wang, J.; Zhou, Y.; Zhao, Y. Conceptual framework and computational research of hierarchical residential household water demand. Water 2018, 10, 696. [Google Scholar] [CrossRef] [Green Version]
- Rahim, M.S.; Nguyen, K.A.; Stewart, R.A.; Giurco, D.; Blumenstein, M. Predicting Household Water Consumption Events: Towards a Personalised Recommender System to Encourage Water-conscious Behaviour. In Proceedings of the 2019 International Joint Conference on Neural Networks (IJCNN), Budapest, Hungary, 14–19 July 2019; pp. 1–8. [Google Scholar]
- Mnih, V.; Kavukcuoglu, K.; Silver, D.; Rusu, A.A.; Veness, J.; Bellemare, M.G.; Graves, A.; Riedmiller, M.; Fidjeland, A.K.; Ostrovski, G. Human-level control through deep reinforcement learning. Nature 2015, 518, 529. [Google Scholar] [CrossRef]
- Chandola, V.; Banerjee, A.; Kumar, V. Anomaly detection: A survey. ACM Comput. Surv. (Csur) 2009, 41, 15. [Google Scholar] [CrossRef]
- Rahim, M.S.; Ahmed, T. An initial centroid selection method based on radial and angular coordinates for K-means algorithm. In Proceedings of the 2017 20th International Conference of Computer and Information Technology (ICCIT), Dhaka, Bangladesh, 22–24 December 2017; pp. 1–6. [Google Scholar]
- Shirkhorshidi, A.S.; Aghabozorgi, S.; Wah, T.Y.; Herawan, T. Big data clustering: A review. In Proceedings of the International Conference on Computational Science and Its Applications, Guimarães, Portugal, 30 June–3 July 2014; pp. 707–720. [Google Scholar]
- Ng, R.T.; Han, J. CLARANS: A method for clustering objects for spatial data mining. IEEE Trans. Knowl. Data Eng. 2002, 1003–1016. [Google Scholar] [CrossRef] [Green Version]
- Zhang, T.; Ramakrishnan, R.; Livny, M. BIRCH: An efficient data clustering method for very large databases. In Proceedings of the ACM Sigmod Record, Montreal, QC, Canada, 4–6 June 1996; pp. 103–114. [Google Scholar]
- Guha, S.; Rastogi, R.; Shim, K. Cure: An efficient clustering algorithm for large databases. Inf. Syst. 2001, 26, 35–58. [Google Scholar] [CrossRef]
- Kofinas, D.T.; Spyropoulou, A.; Laspidou, C.S. A methodology for synthetic household water consumption data generation. Environ. Model. Softw. 2018, 100, 48–66. [Google Scholar] [CrossRef]
Figure 1.
Steps followed to undertake a systematic quantitative literature review, as proposed by Pickering and Byrne [27].
Figure 1.
Steps followed to undertake a systematic quantitative literature review, as proposed by Pickering and Byrne [27].

Figure 2.
Comprehensive themes of literature on residential digital water metering.

Figure 3.
Year-wise distribution of articles for the types of literature.

Figure 4.
Relationship between personalisation and water conservation.

Figure 5.
Grouping existing works from a business intelligence perspective.

Figure 6.
Number of studies and their cumulative sum over the years for short- and medium-term water demand forecasting.
Figure 6.
Number of studies and their cumulative sum over the years for short- and medium-term water demand forecasting.

Figure 7.
Socioeconomic factors that determine water consumption from mains water.


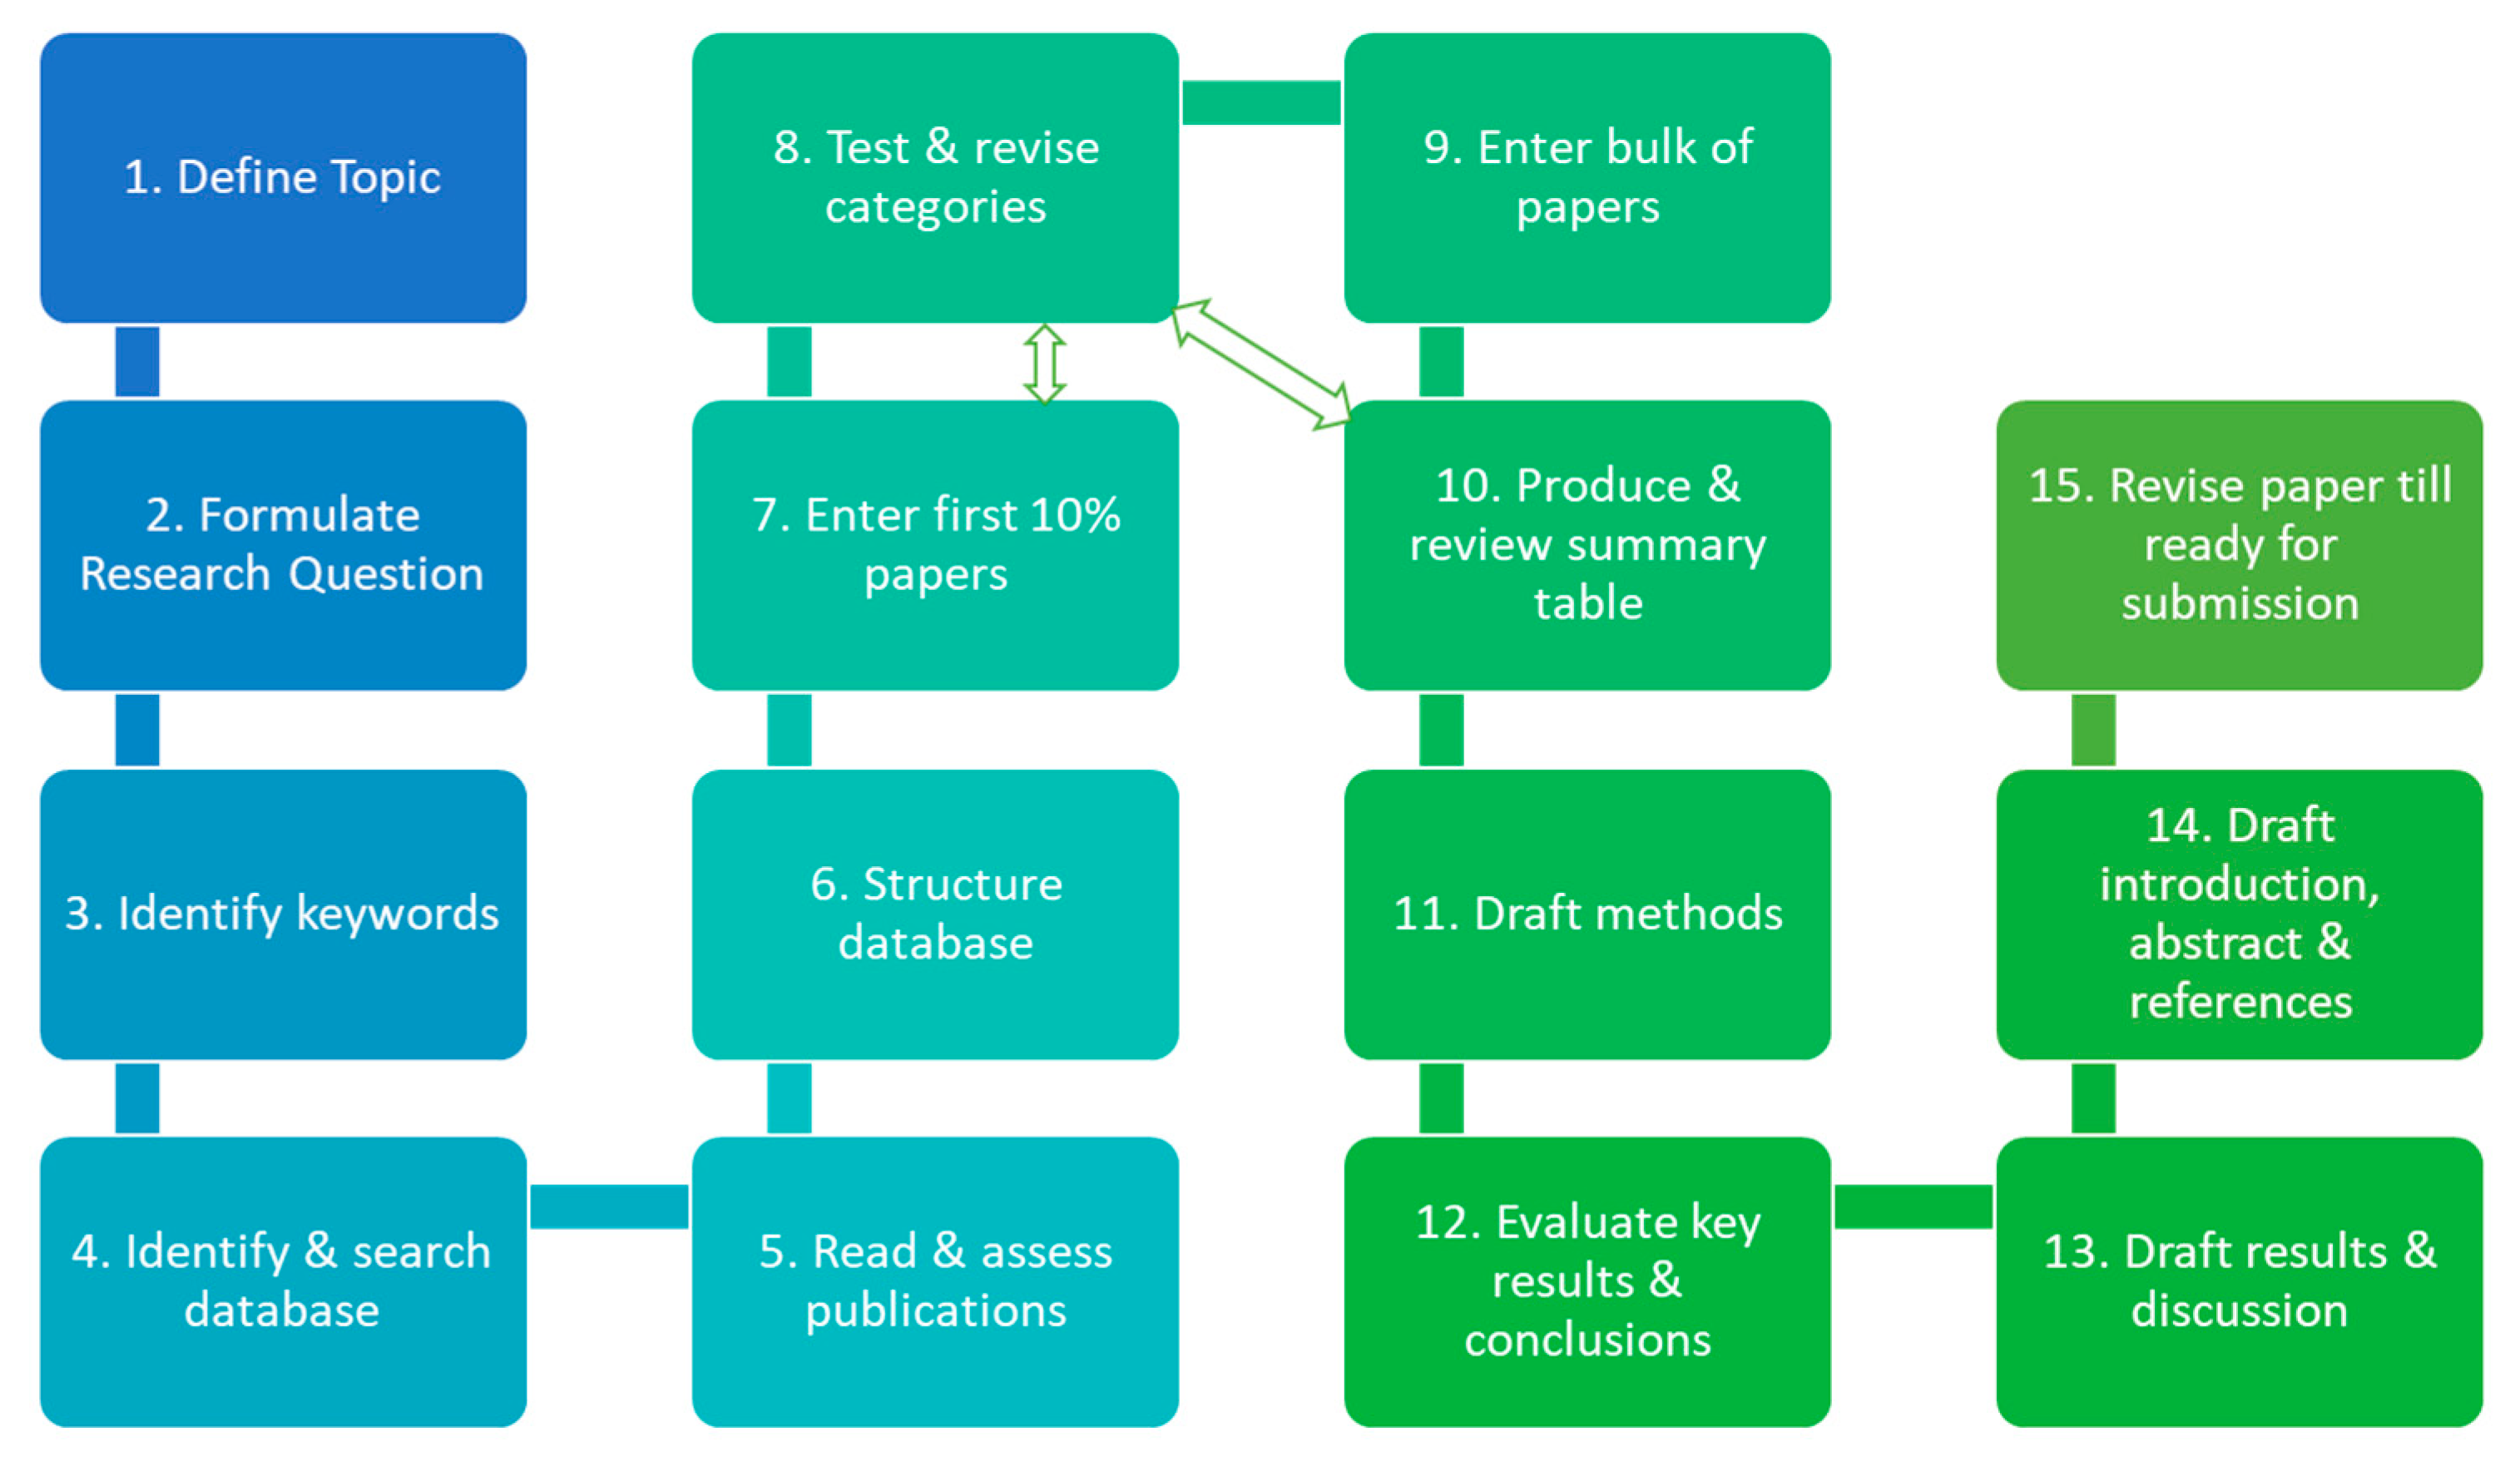
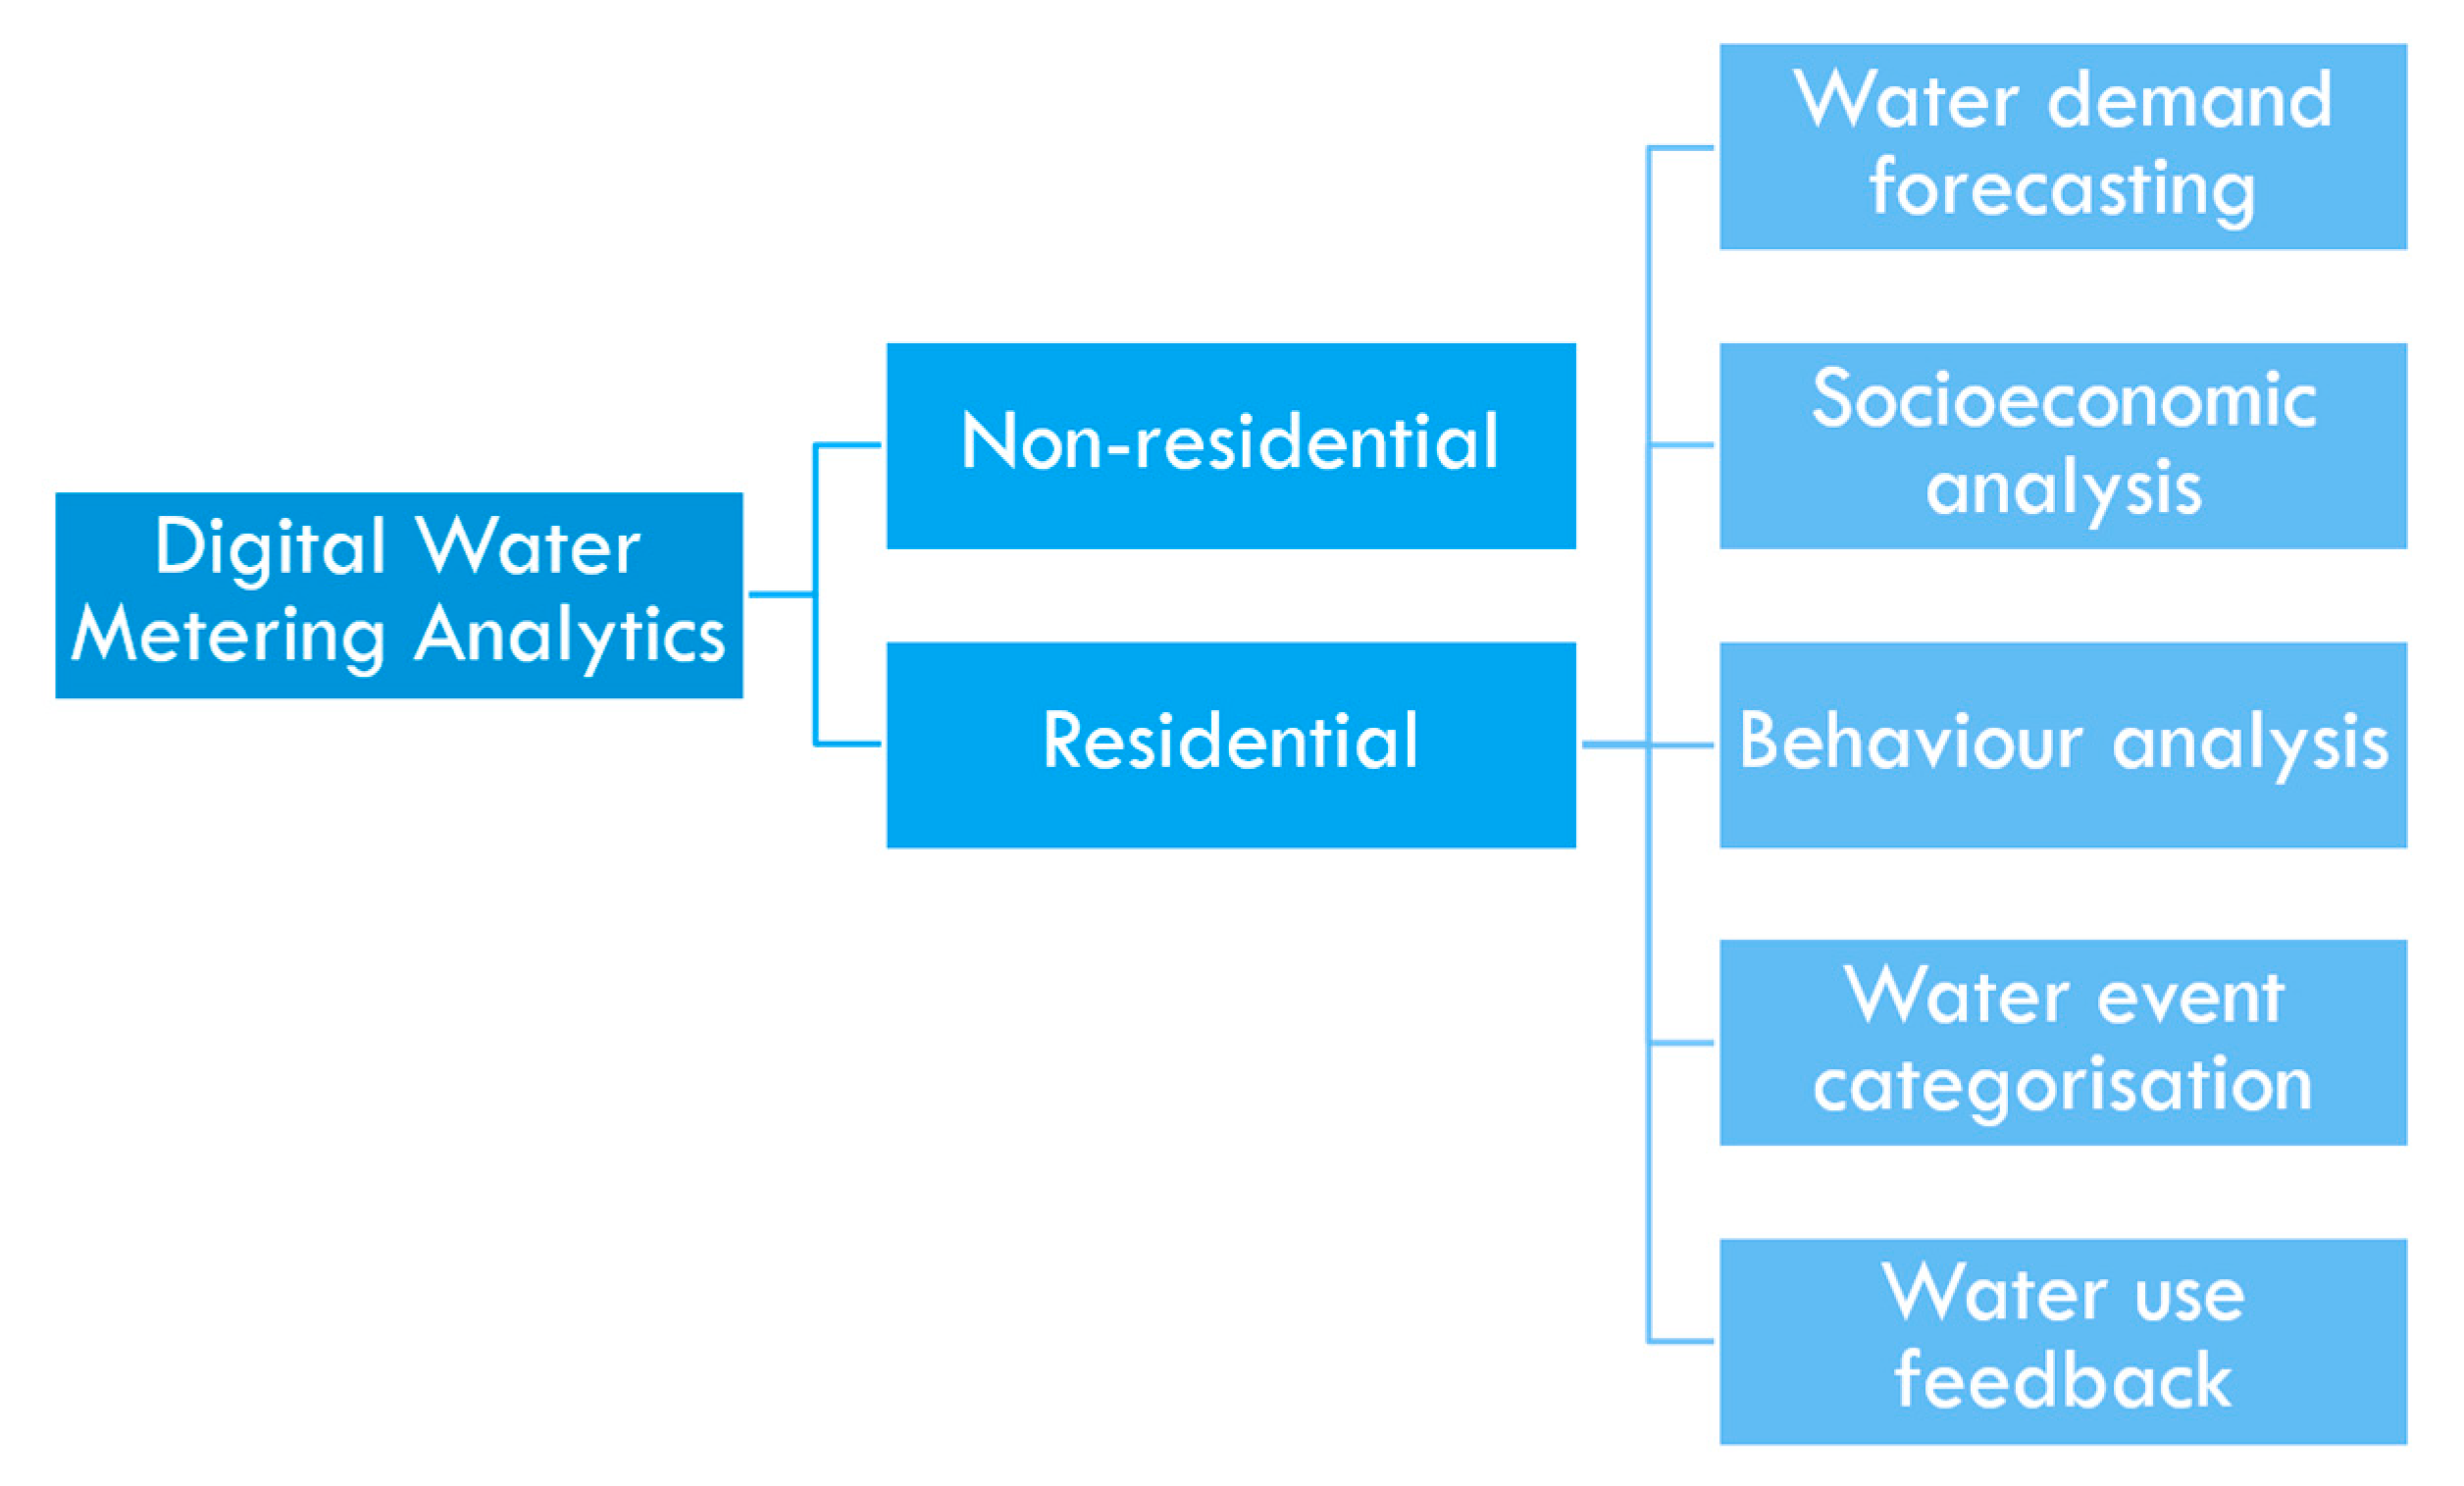
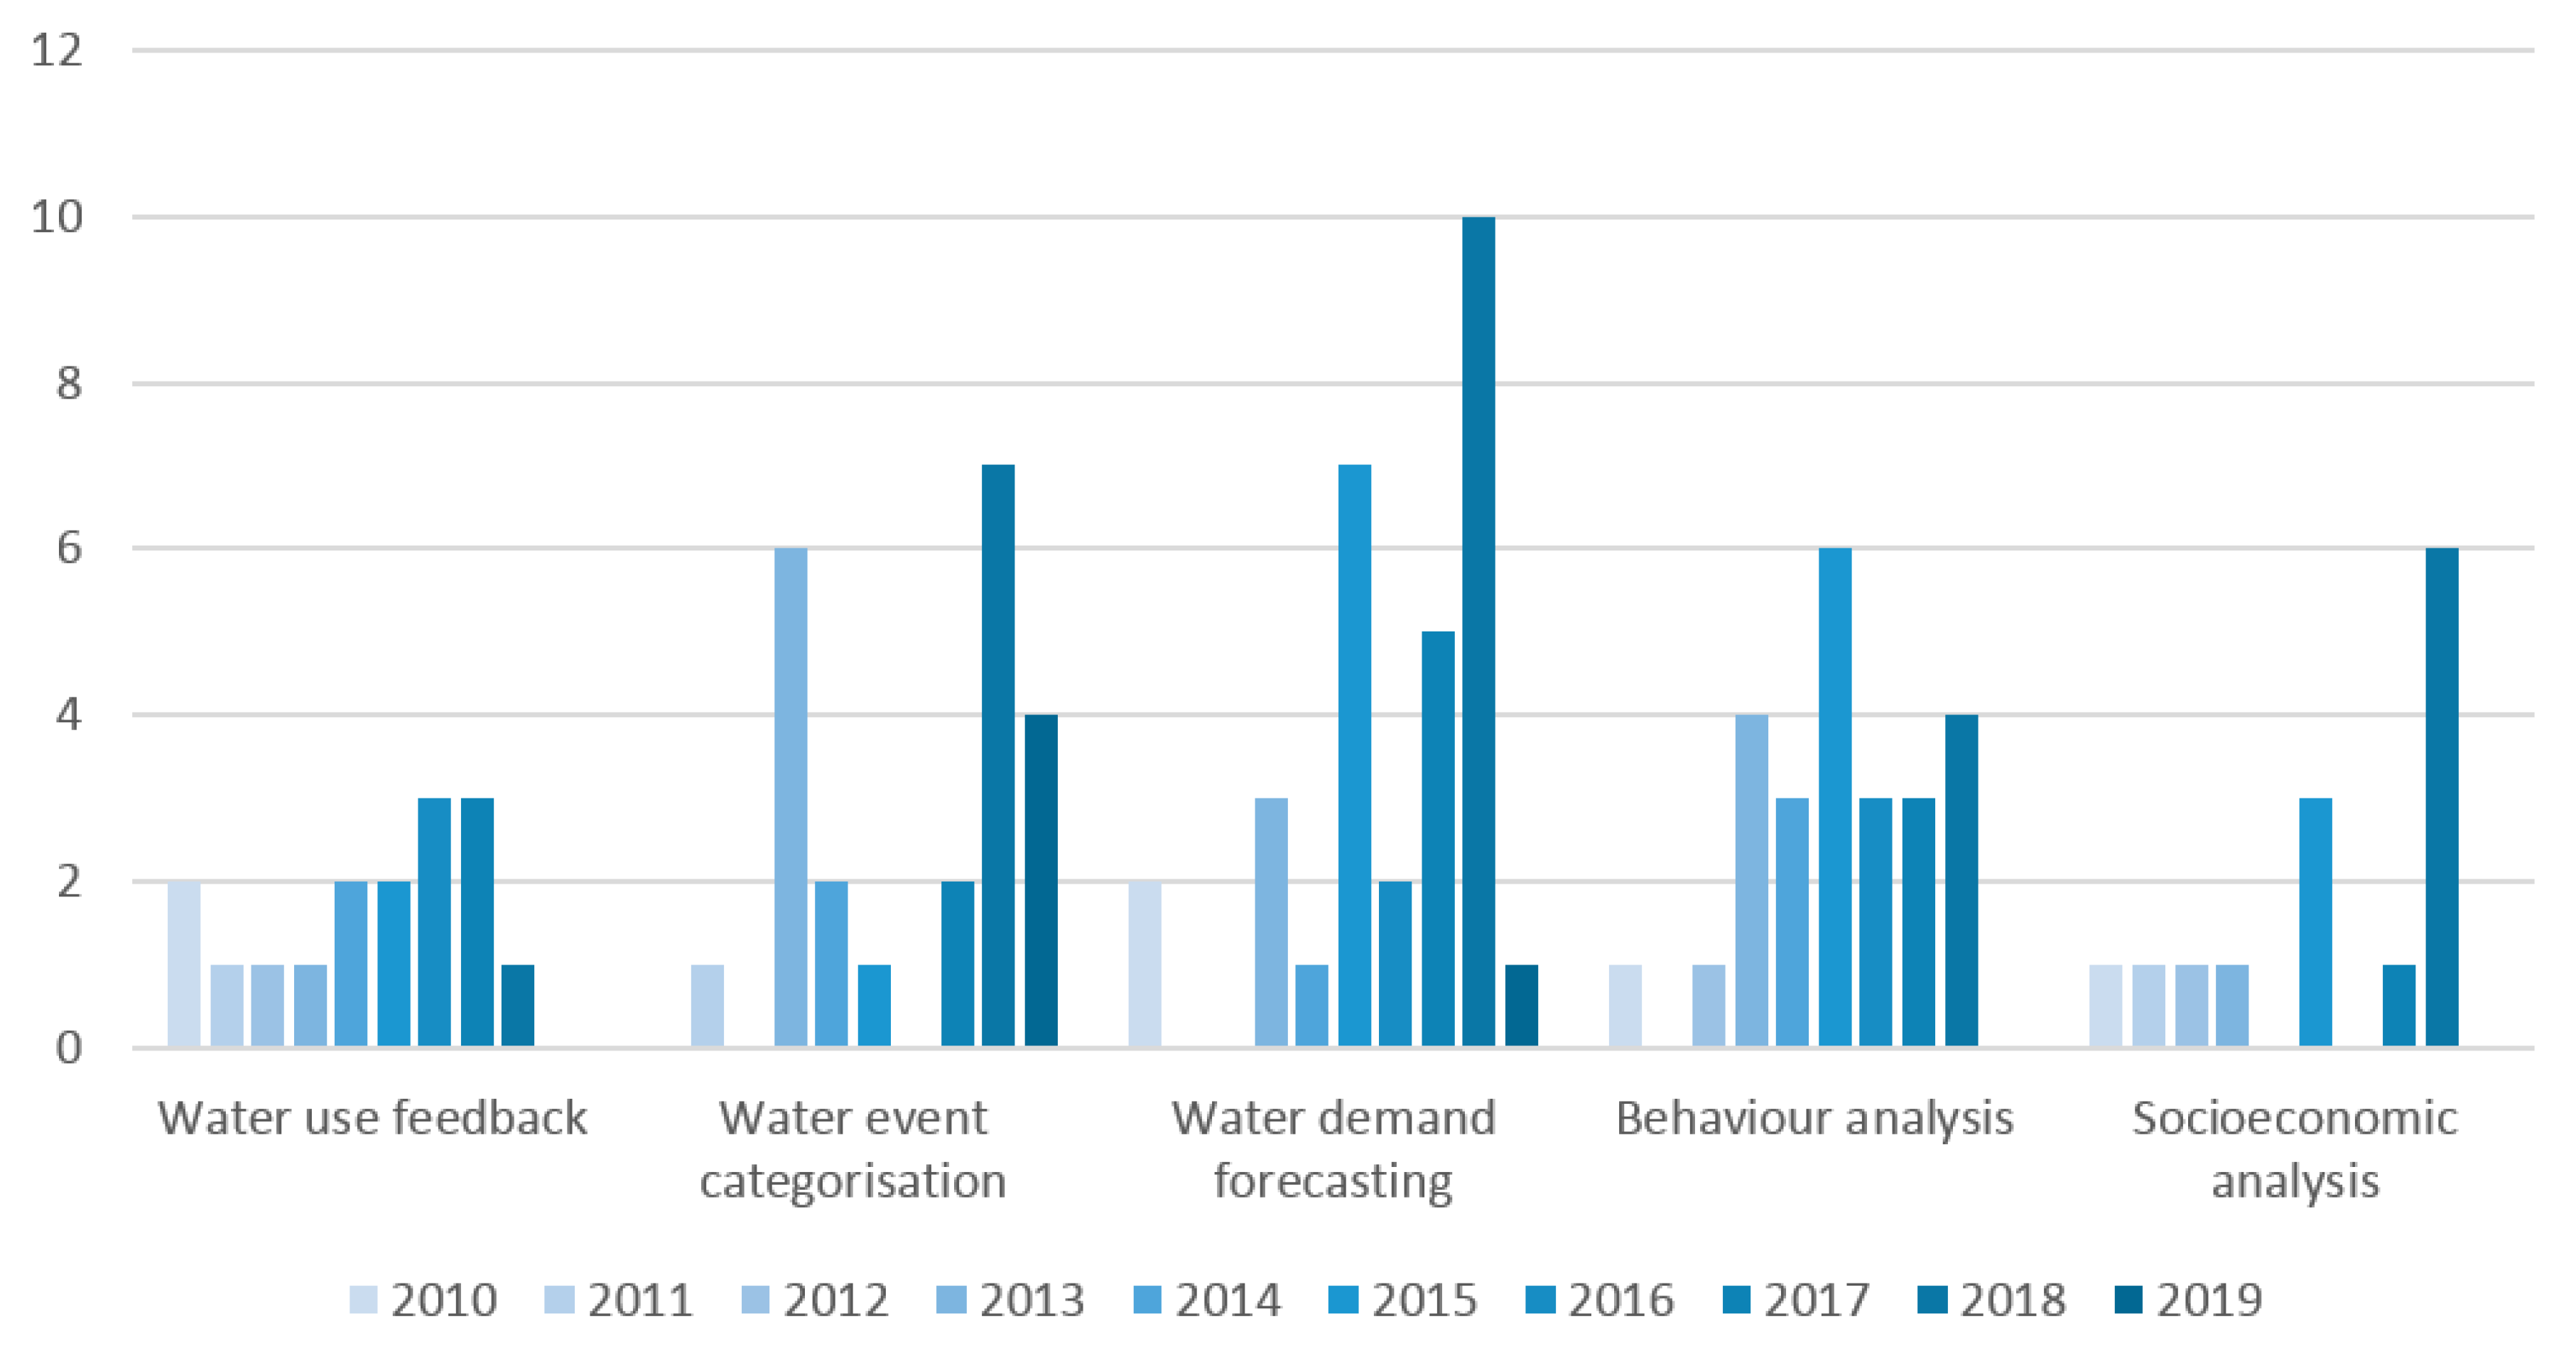
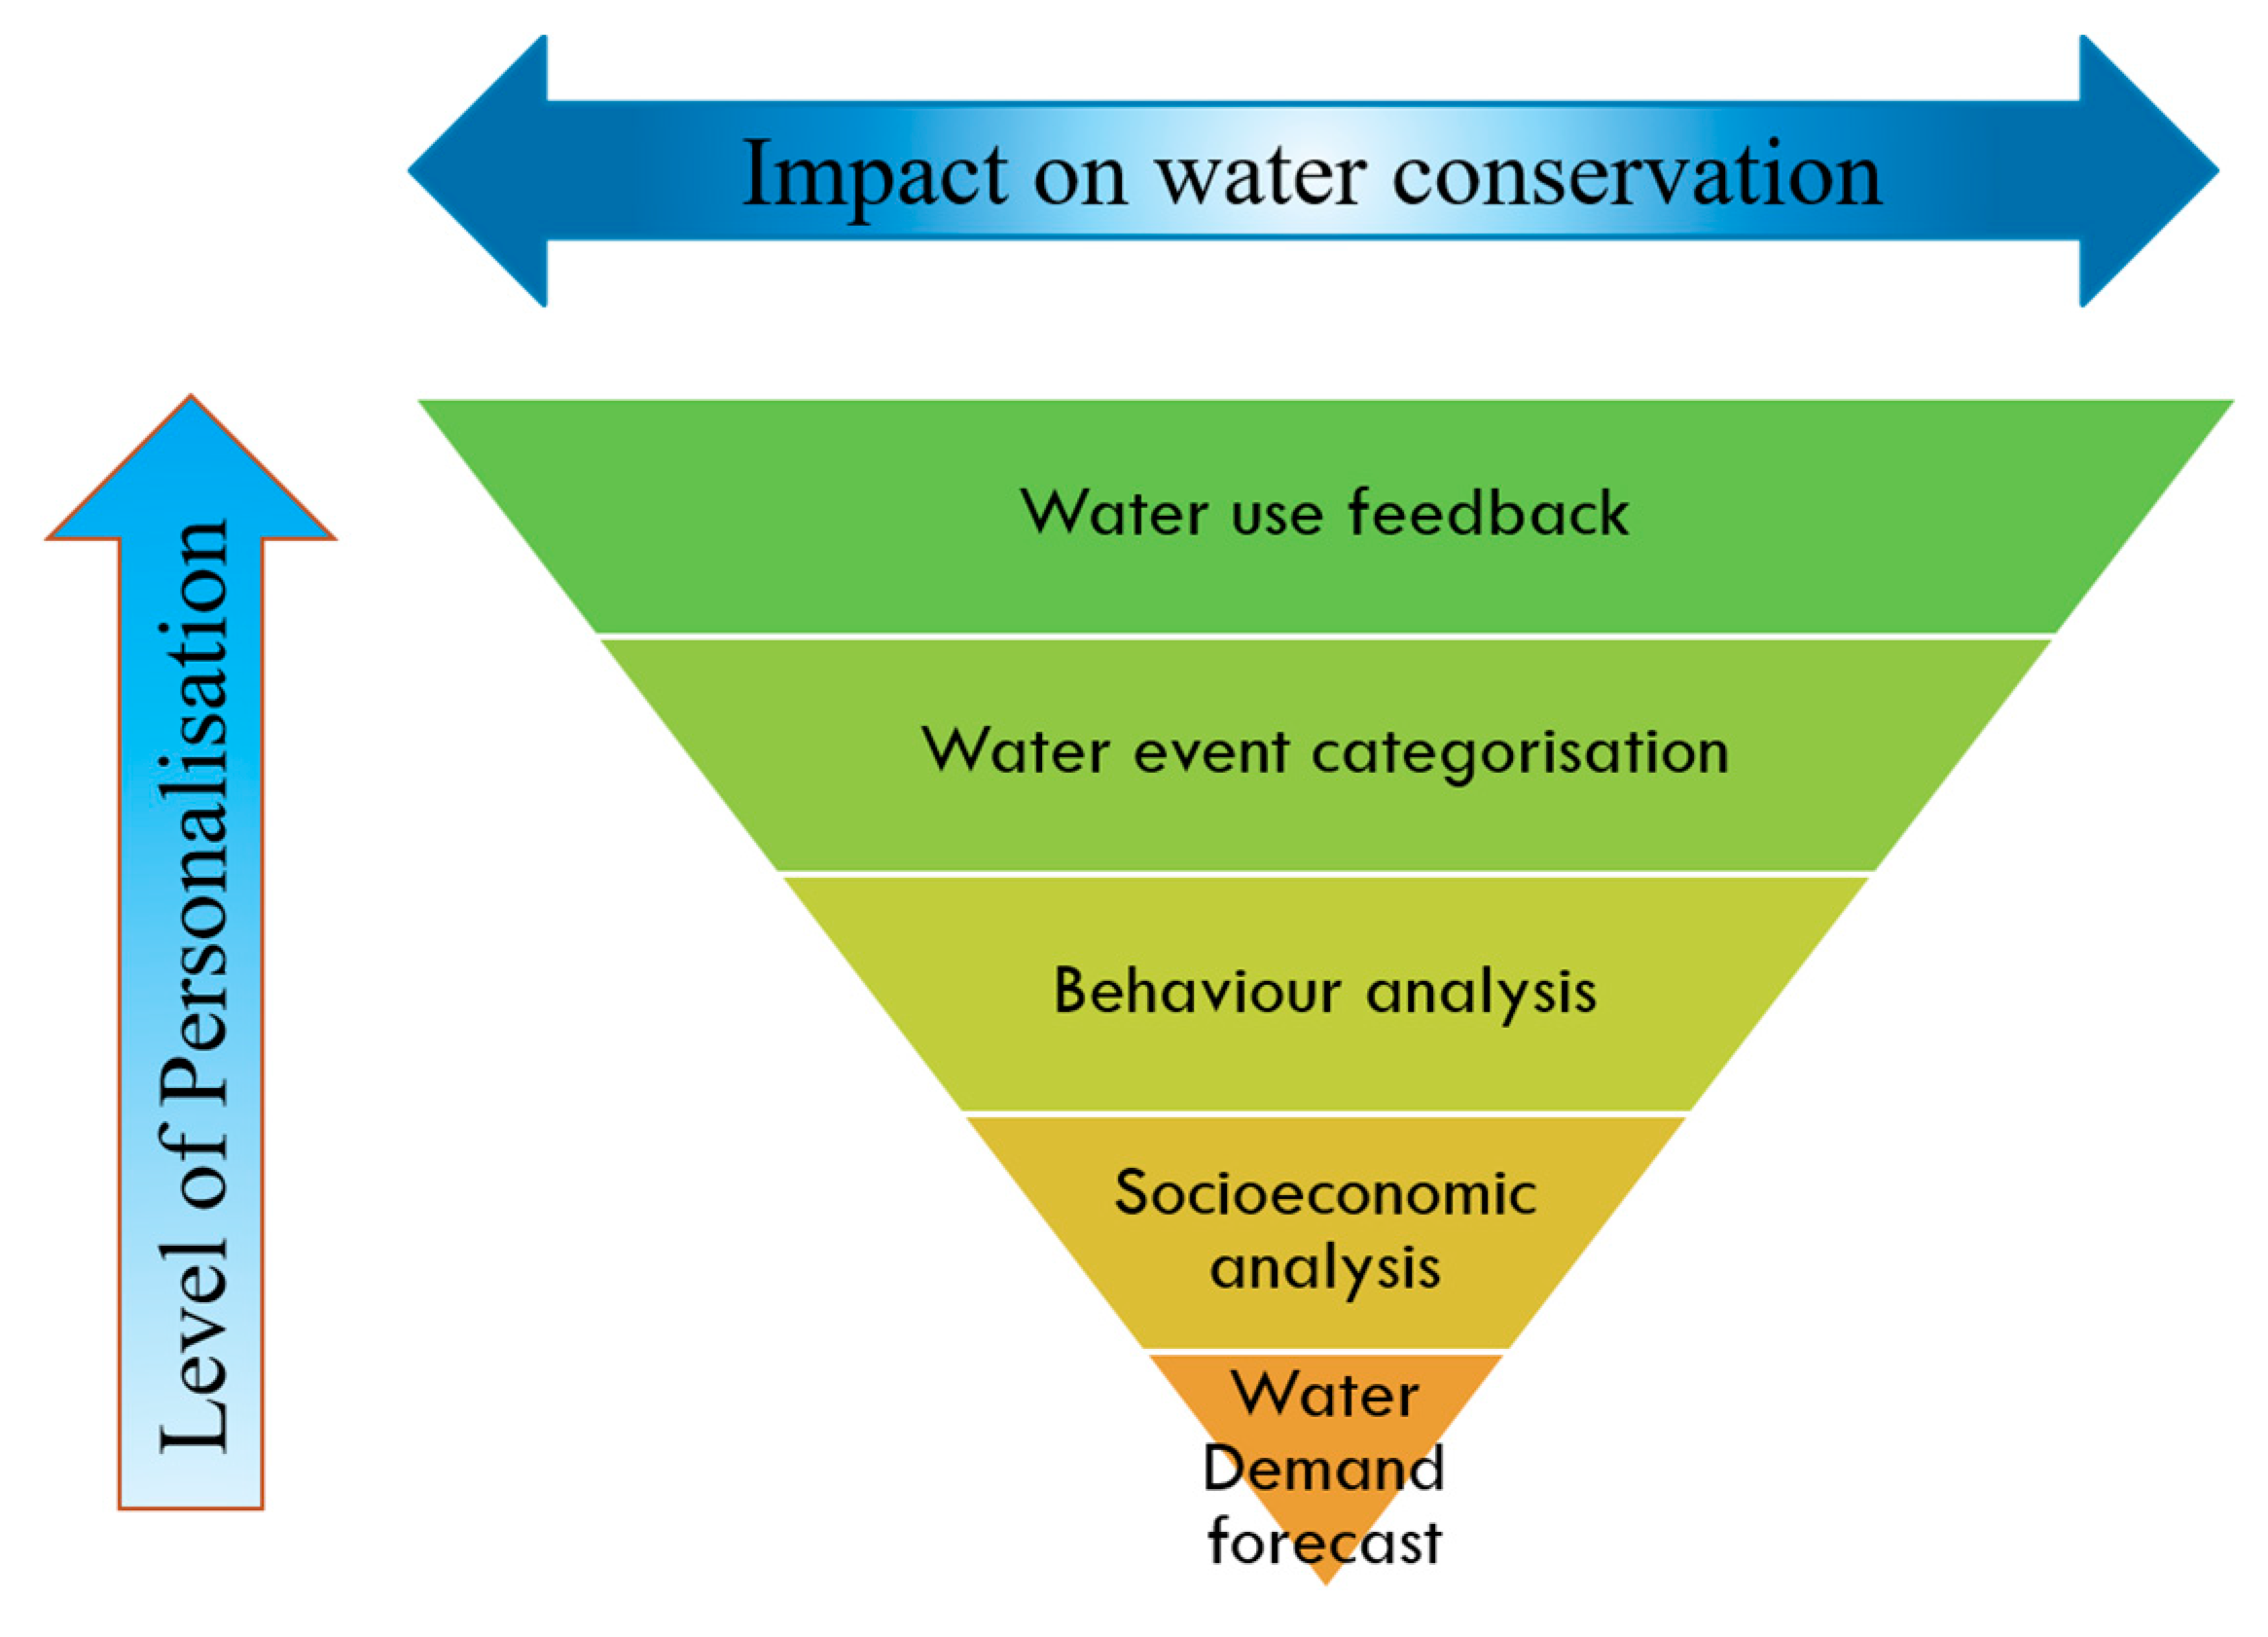
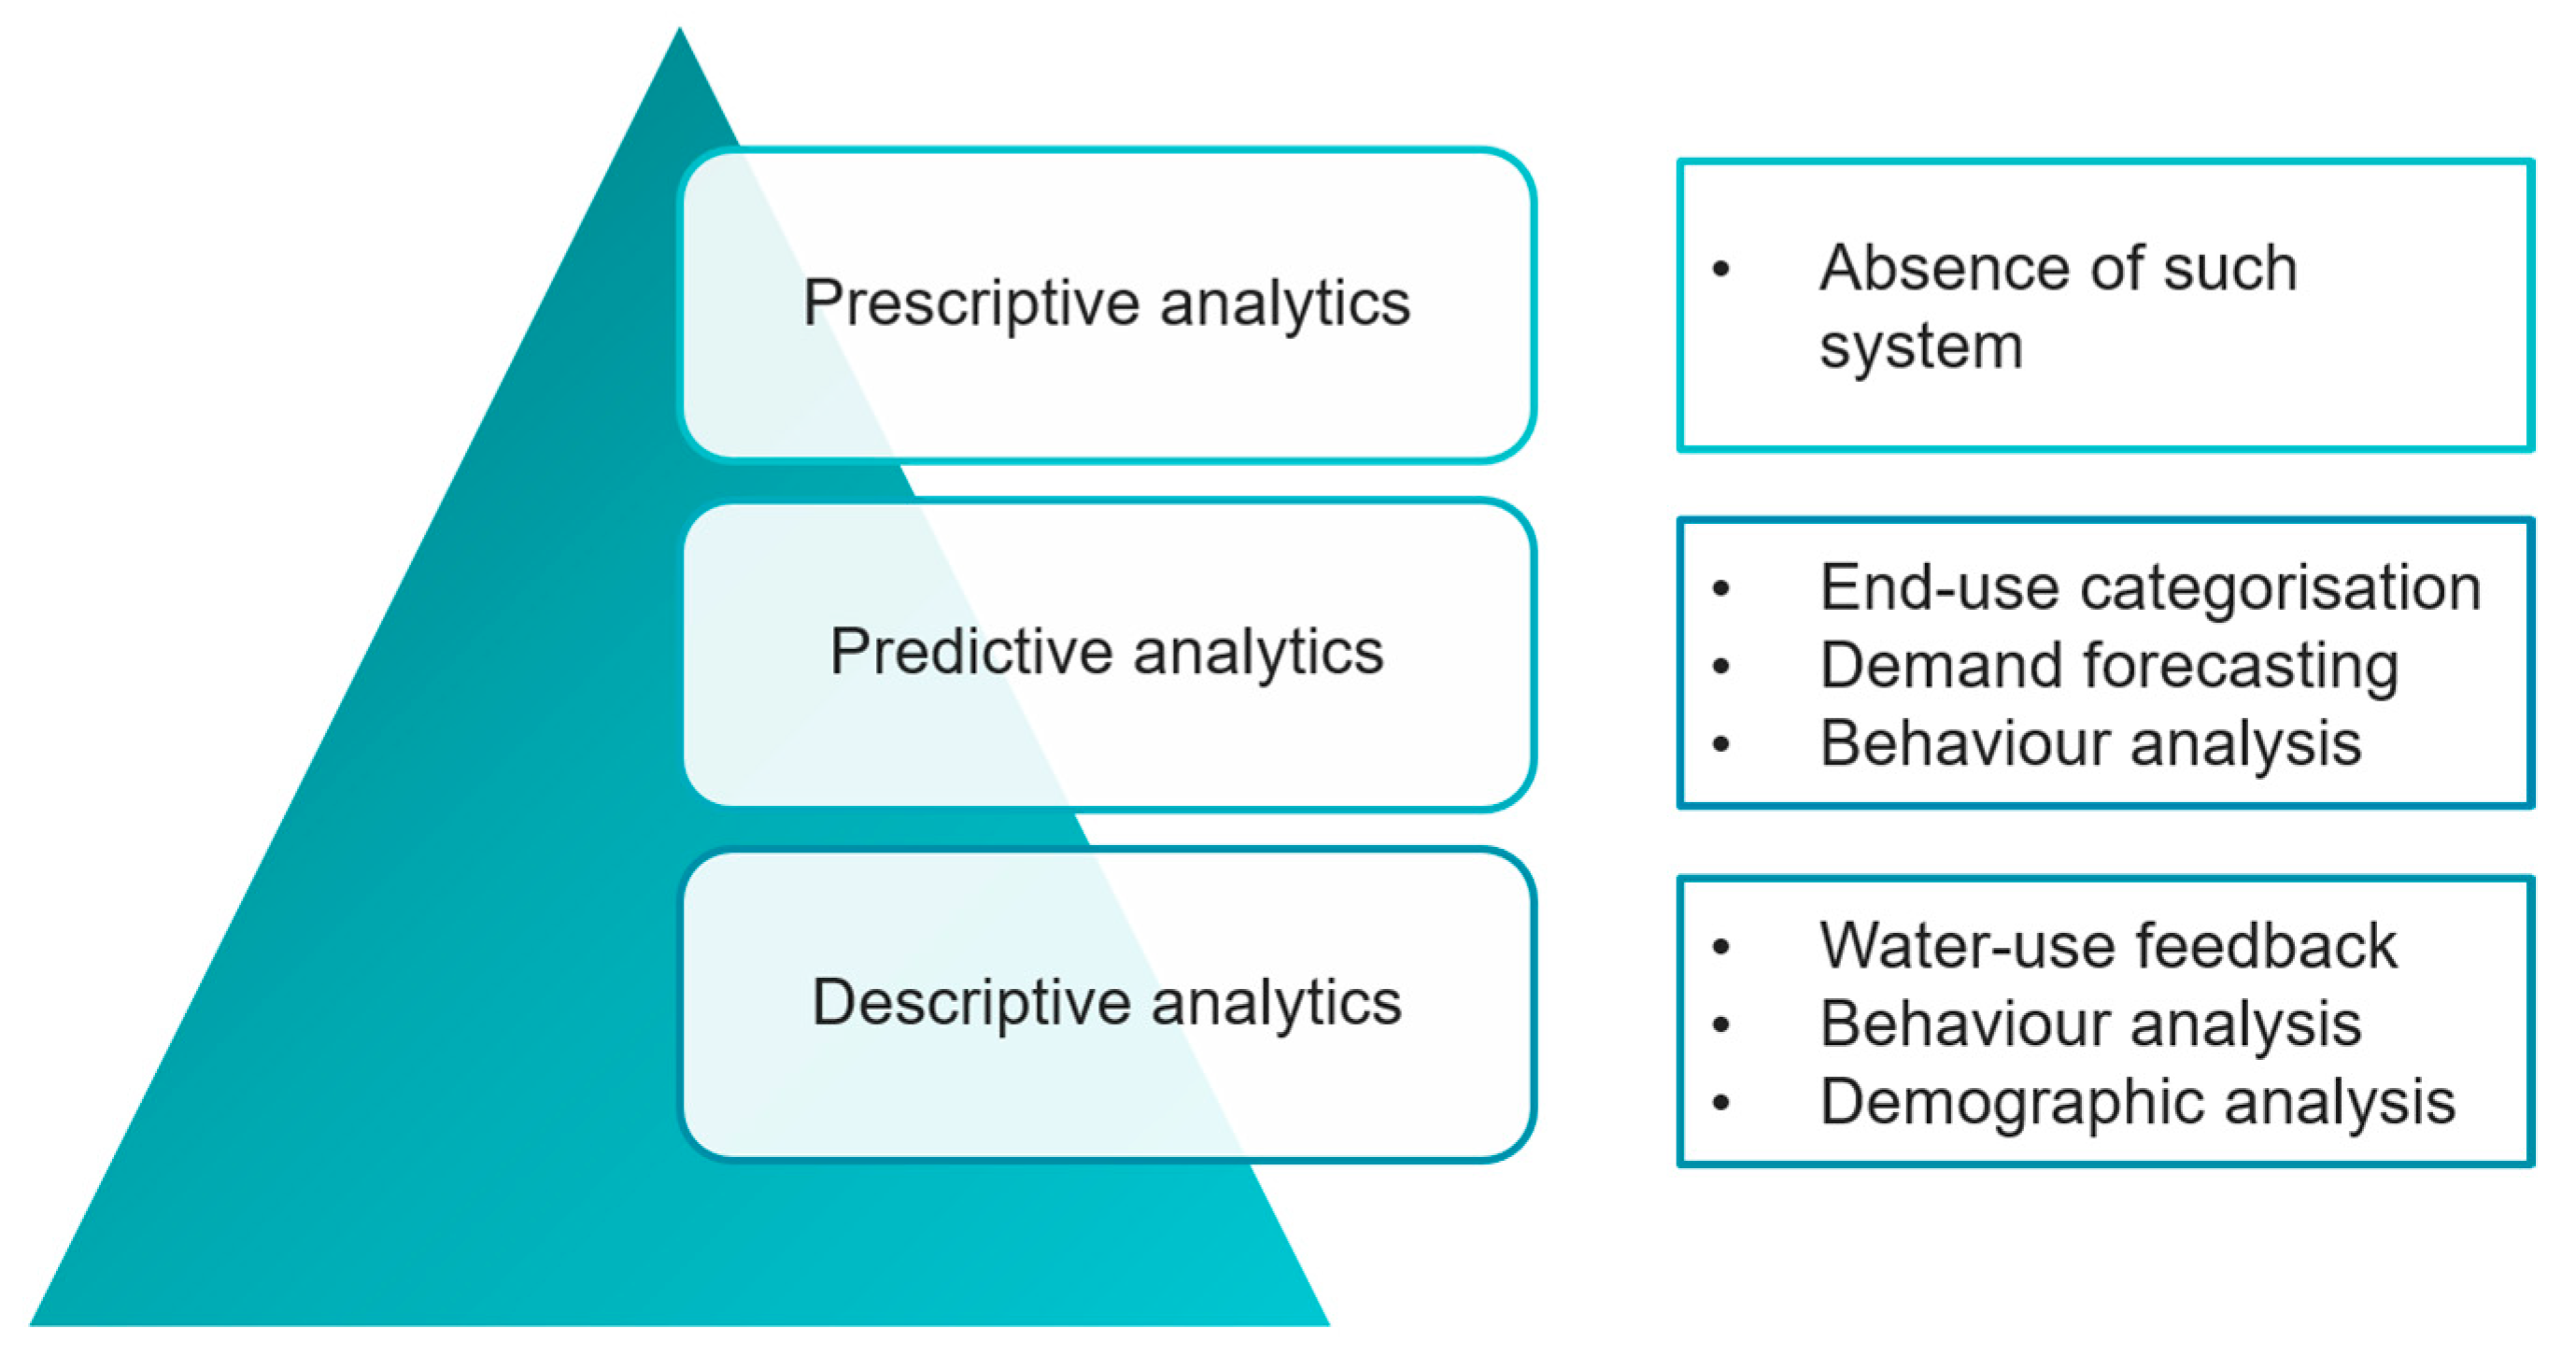
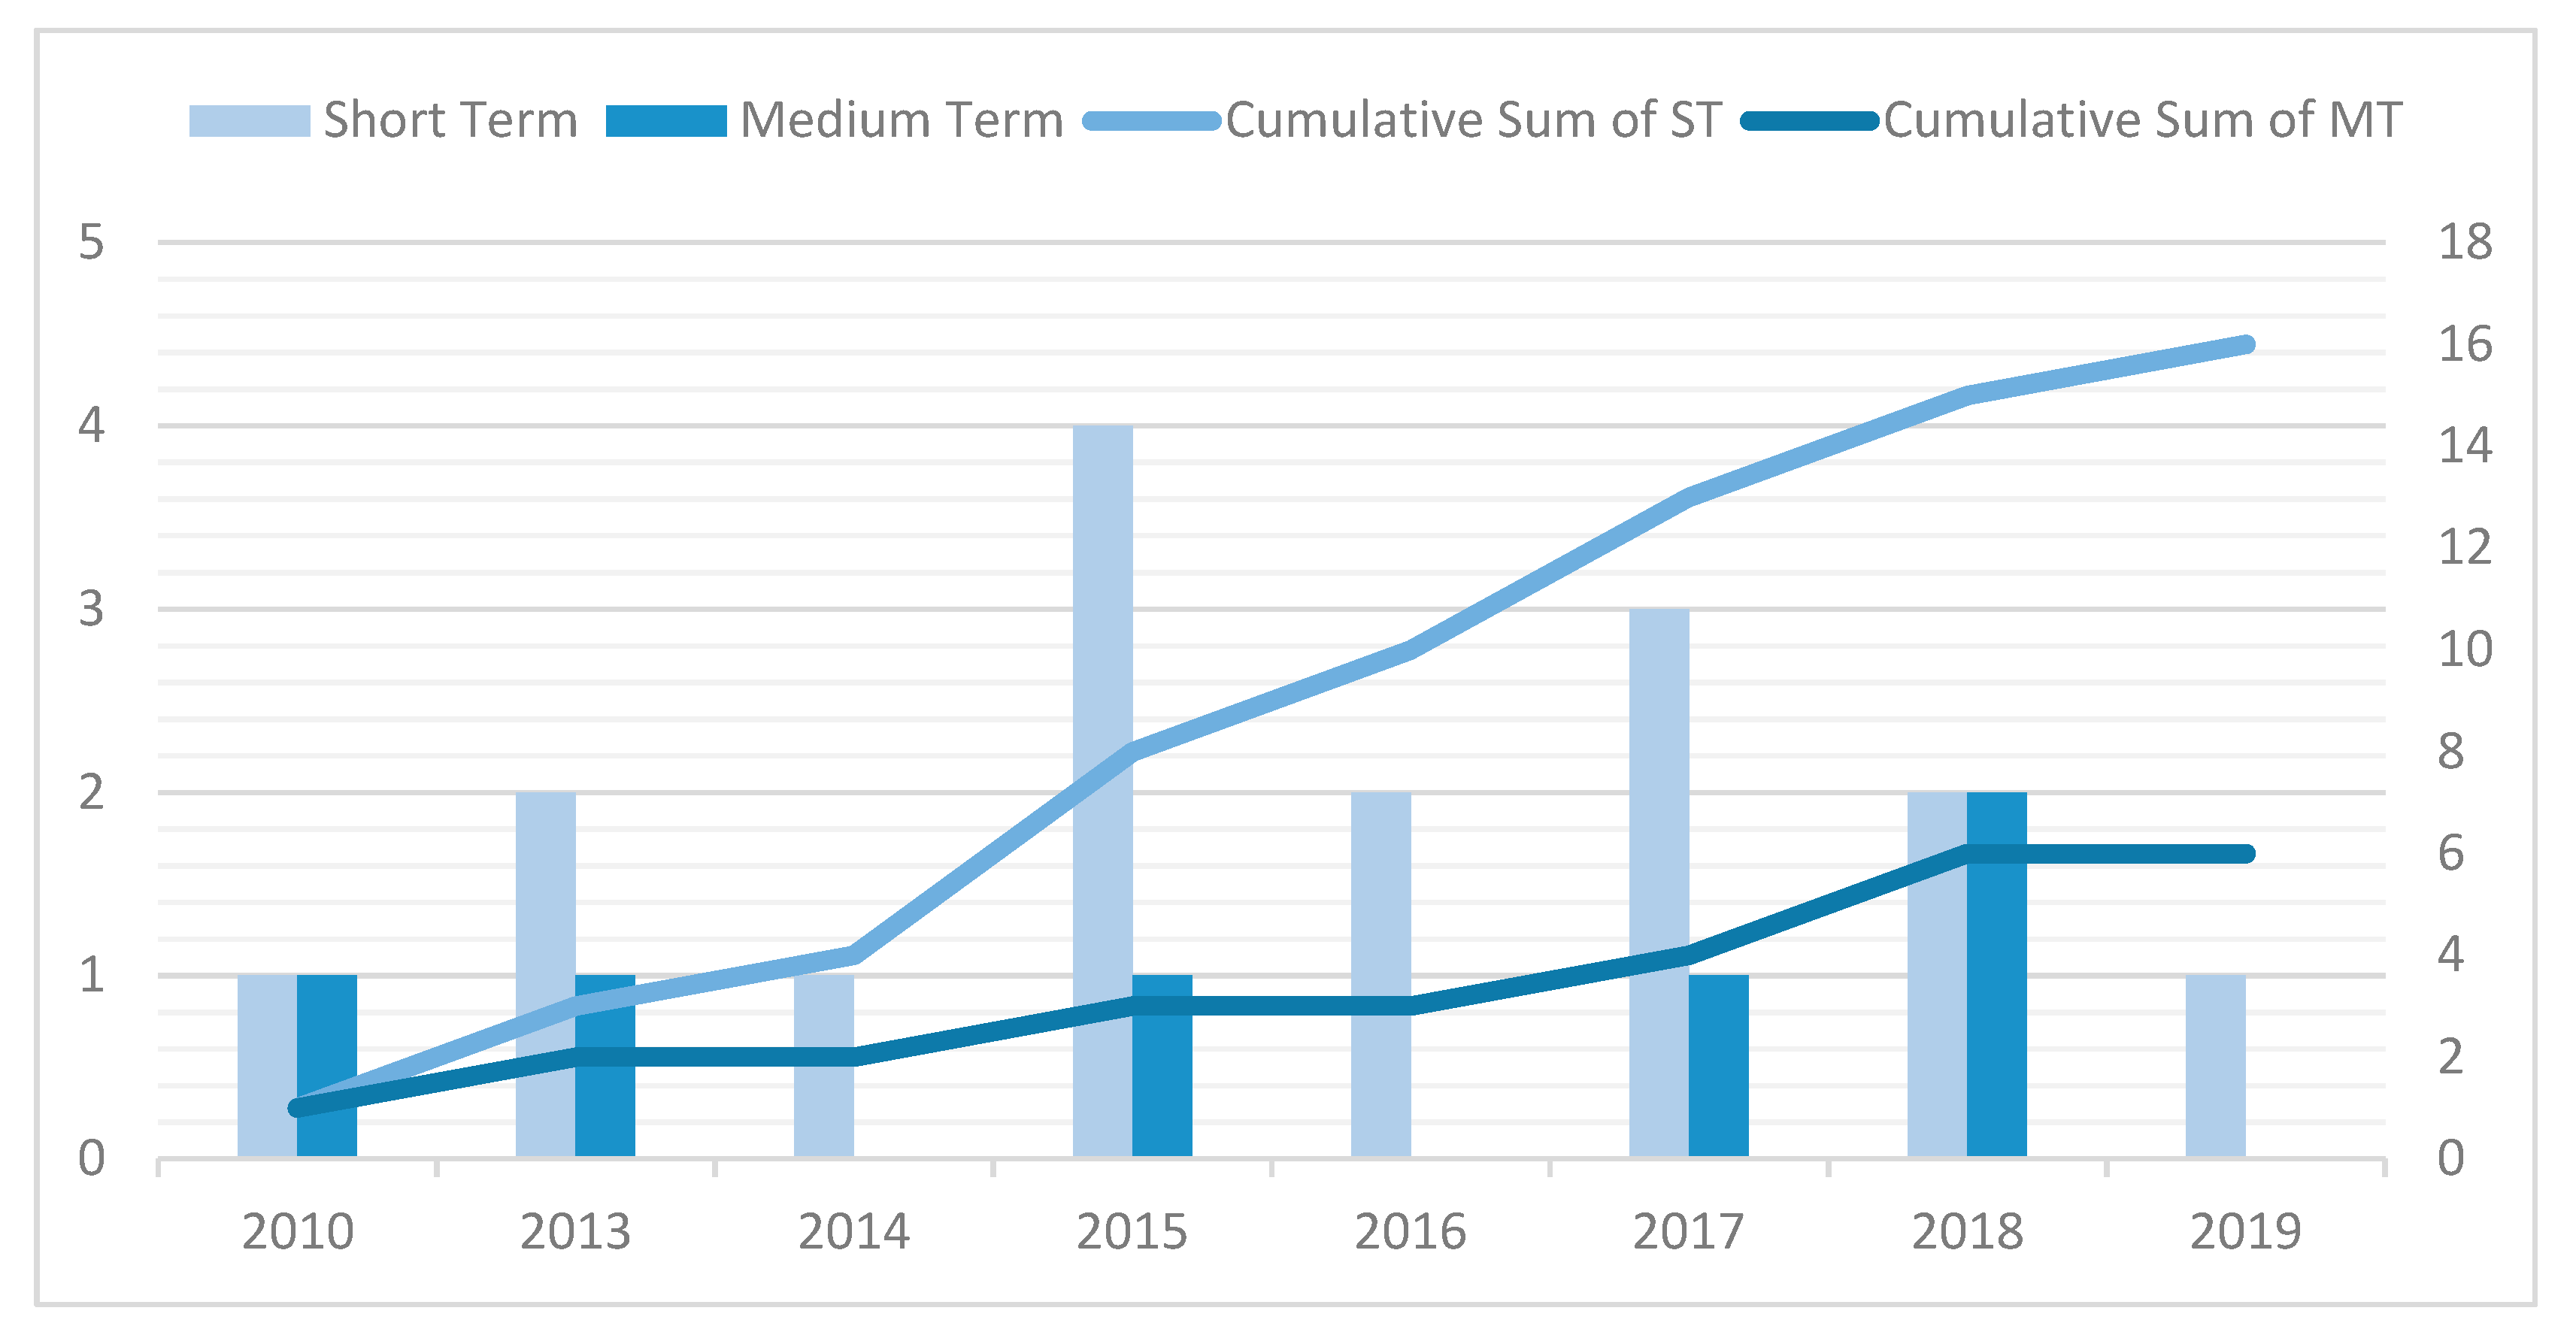
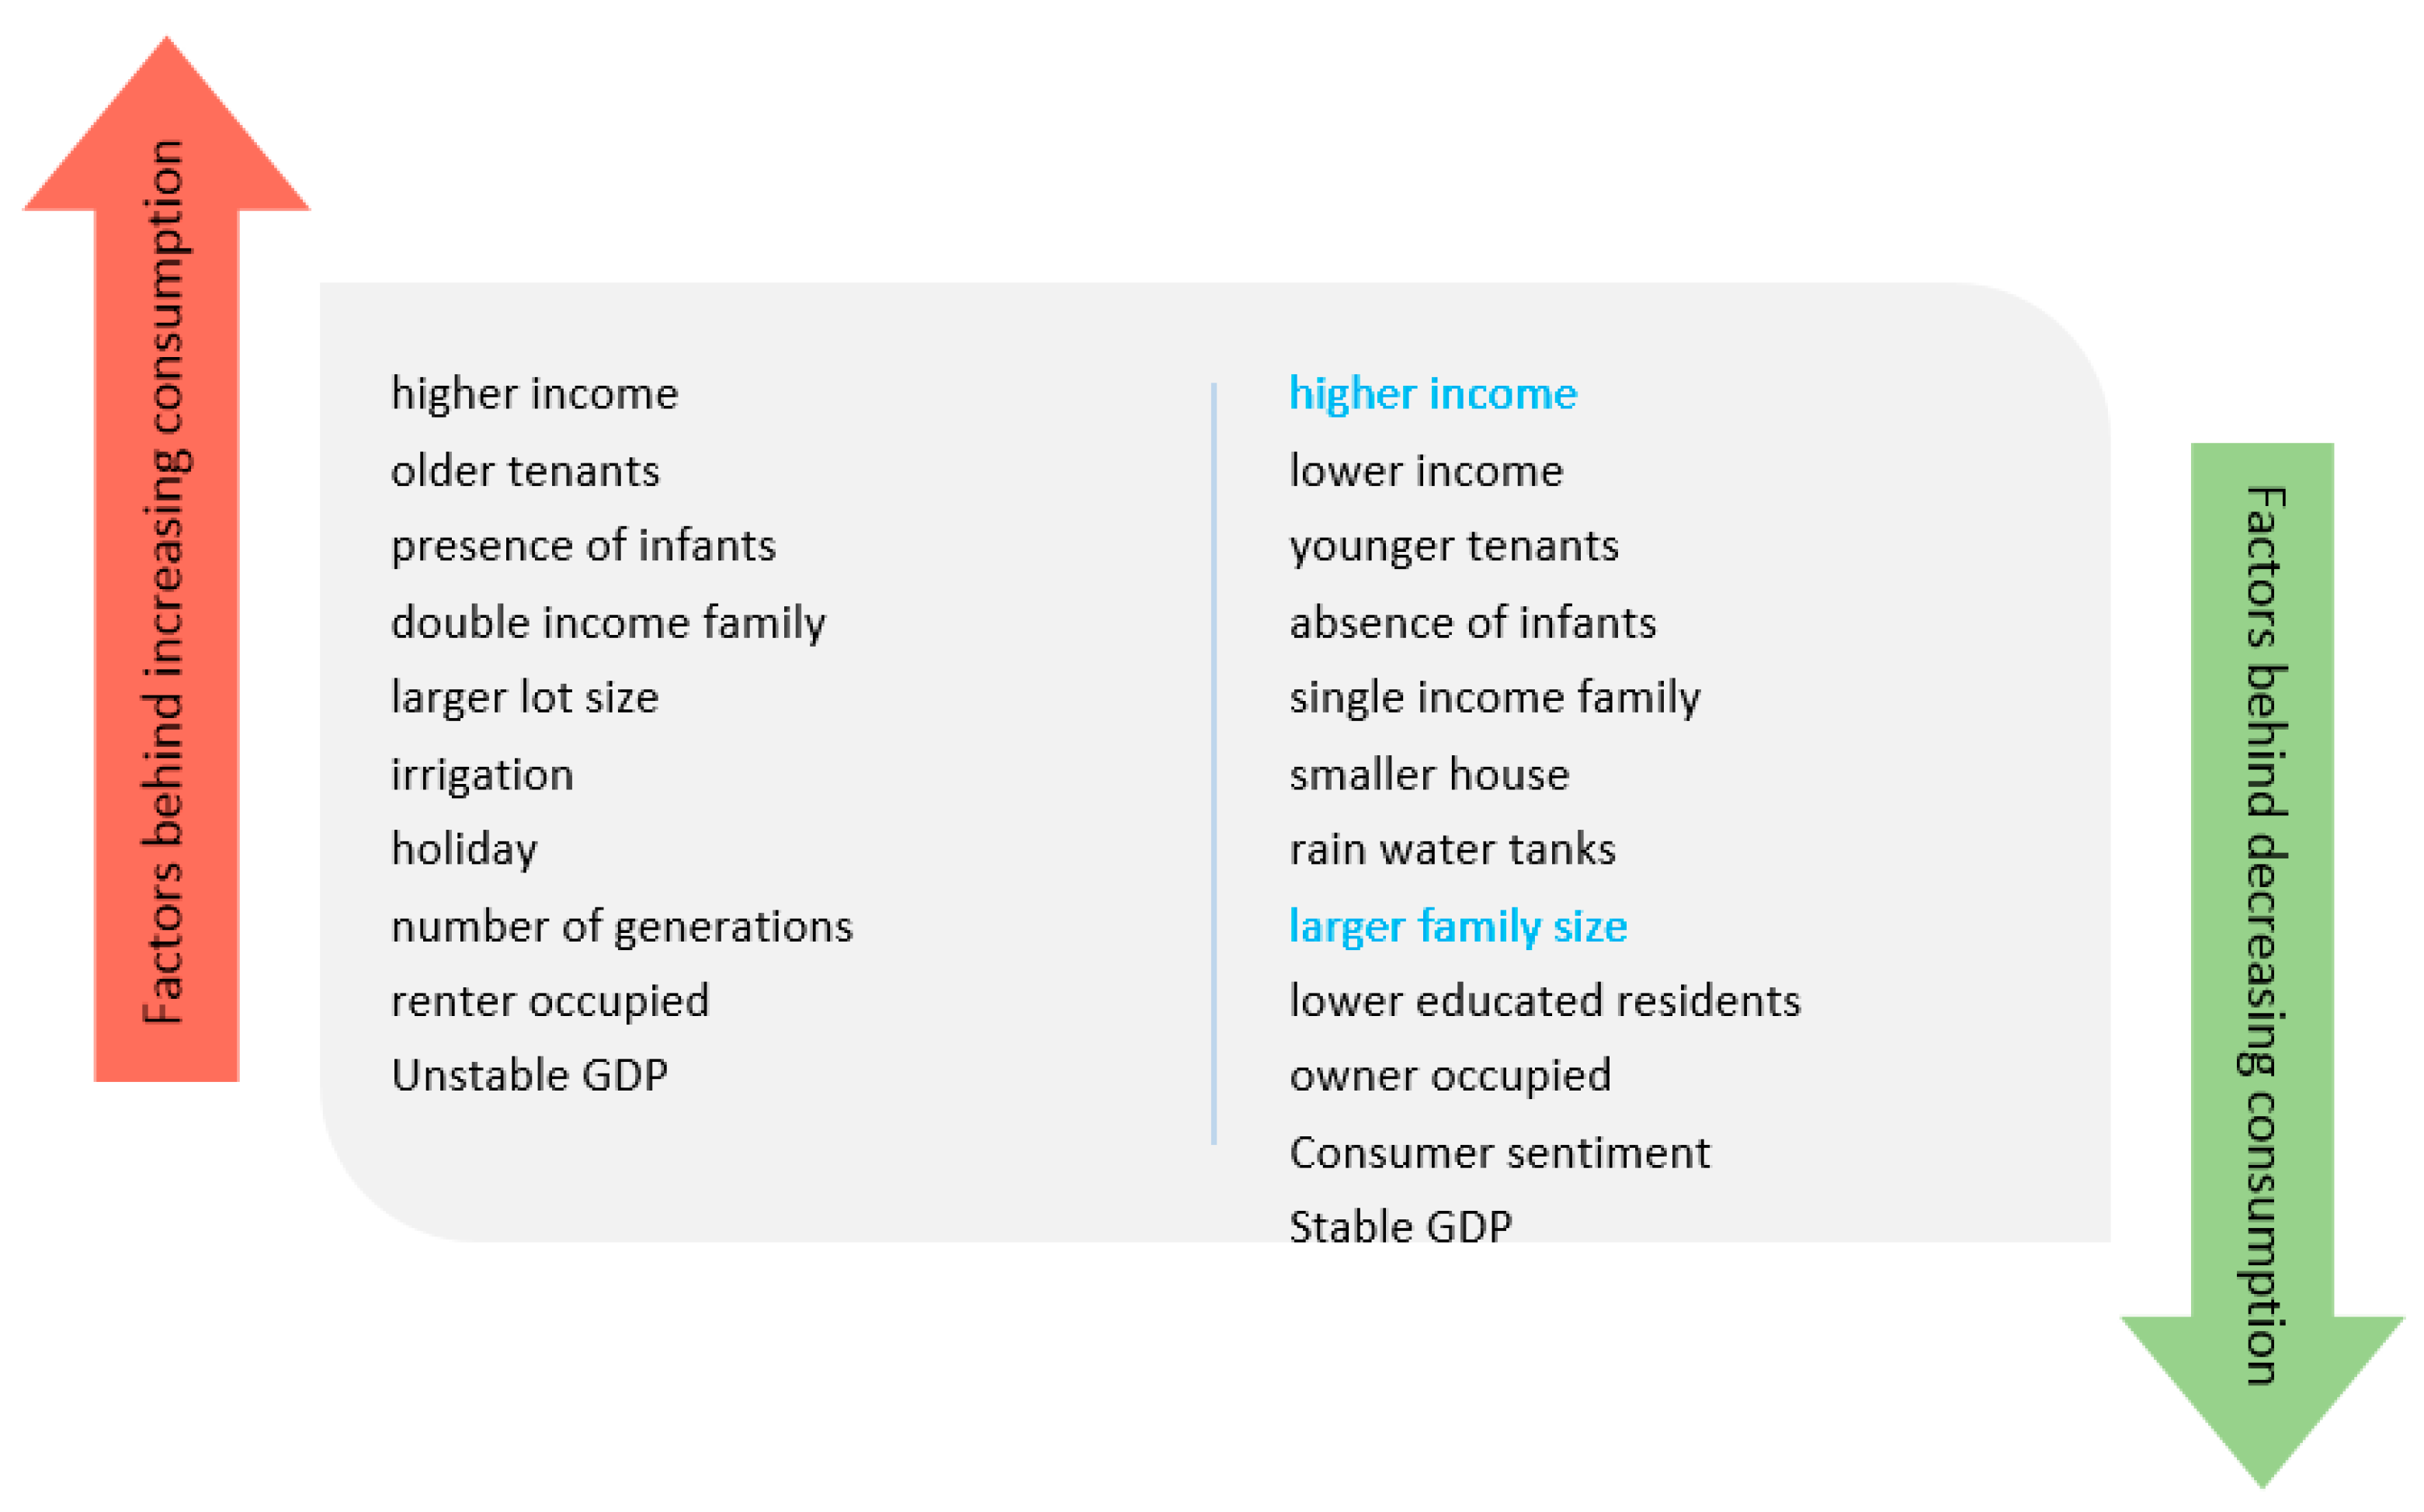
Table 1.
Sample queries and their returned number of documents from the Scopus Database.
| Query | Documents Returned |
|---|---|
| water AND (use OR consumption) AND (classification OR category *ation OR disaggre *) | 899 |
| water AND (use OR consumption) AND (classification OR category *ation OR disaggre *) | 1264 |
| water AND meter * AND data AND (demand OR categorisation OR categorization OR forecast OR predict * OR leak OR usage OR consumption OR insight *) AND NOT (electri * OR soil OR irrigation OR ocean OR dust OR desalin * OR irrigation OR gas OR energy OR waste OR quality OR network OR remote) | 354 |
| (digital OR smart OR intelligent OR advance *) AND water AND meter * AND (consumption OR use OR usage) AND (data OR information OR summary OR detail *) AND NOT electr *) | 178 |
Table 2.
Key characteristics of the literature on water-use feedback.
| Reference | Medium of Feedback | Location of the Study | Number of Participants | Feedback Generation Technique(s) | Water Savings |
|---|---|---|---|---|---|
| [42] | Paper and online | New South Wales, Australia | Paper: 68 households Online: 120 households | Descriptive analytics | Paper: 8.0% Online: 4.2% |
| [37] | Online | New South Wales, Australia | 120 households | Descriptive analytics | 4.2% |
| [33] | Paper | Tokyo, Japan | 246 households | Descriptive analytics | - |
| [6,34] | Paper | New South Wales, Australia | 68 households | Descriptive analytics | 7.6% |
| [35] | Paper | Los Angeles, USA | 374 households | Descriptive analytics | - |
| [43] | Paper and online | San Diego, USA | 301 households | Descriptive analytics | - |
| [31,45] | Visual display | Gold Coast, QLD, Australia | 151 households | Descriptive analytics | 27% in shower volume |
| [38] | Online | Dubuque, IA, USA | 303 households | Descriptive analytics | 6.6% |
| [36] | Paper | Sacramento County, CA, USA | 100 households | Descriptive analytics | - |
Table 3.
Summary of the studies in water demand forecasting.
| Forecast Horizon | Forecast Frequency | Forecasting Technique | |||
|---|---|---|---|---|---|
| Stochastic | Regression | ANN | Hybrid | ||
| Short term | Every second | [61] | |||
| Hourly | [62] | [54] | [46], | [63] | |
| Daily | [64] | [48,56] | [50] | [65] | |
| Event-based | [57] | ||||
| Medium term | Monthly | [47,66,67] | |||
| Bimonthly | [58] | ||||
| Quarterly | [62,68] | ||||
| Yearly | [29] | ||||
Table 4.
Summary of the studies on water end-use categorisation.
| End-Use Categorisation | Technique Used | ||||
|---|---|---|---|---|---|
| Clustering | Regression | SVM | Hybrid | Other | |
| Leak | [74,76] | [76] | [72] | [73,75] | |
| End-use events | [77] | [78] | [69,79,80,81,82,83] | [84,85,86,87,88] | |
Table 5.
Findings from the studies on behaviour analysis.
| Reference | Type | Technique | Considered Disaggregated Events? |
|---|---|---|---|
| [98] | Customer segmentation | Hidden Markov Model | No |
| [99] | Demand profiling | Self-Organising Map, K-means, Dendrogram | No |
| [100] | Customer segmentation | hierarchical cluster analysis | No |
| [101] | Demand profiling | K-means, Fourier Regression Mixture model | No |
| [102] | Customer segmentation | K-means clustering | No |
| [103] | Habit detection and profiling | Time series analysis | No |
| [104] | Customer segmentation | Descriptive analytics | No |
| [105] | Habit detection and profiling | K-means clustering | No |
| [106] | Demand profiling | Diurnal pattern, clustering | No |
| [107] | Customer segmentation | Fuzzy clustering | No |
| [108] | Customer segmentation | Self-Organising Map | No |
| [87] | Demand profiling | Diurnal pattern | No |
| [109] | Demand profiling | Diurnal pattern | No |
| [89] | Demand profiling | Gaussian Mixture Model | No |
| [88] | Habit detection and profiling | Descriptive statistics | No |
| [110] | Habit detection and profiling | Signature pattern Clustering | No |
| [111] | Habit detection and profiling | Factor Analysis, Cluster Analysis, Discriminant Analysis | No |
Table 6.
Summary of studies on behaviour analysis.
| Behaviour Analysis | Applied Technique | |||
|---|---|---|---|---|
| Clustering | Hybrid | Descriptive Analytics | Other | |
| Habit detection and profiling | [105,110] | [111] | [88] | [103] |
| Customer segmentation | [100,102,107] | [104] | [64,108] | |
| Demand profiling | [99,101,106] | [87,89,107] | ||
Table 7.
Summary of the studies based on sample size, data collection duration, and data frequency.
| Sample Size | Data Collection Duration | Data Sample Frequency | |||||
|---|---|---|---|---|---|---|---|
| <2 Weeks | 2 Weeks–<1 Month | 1–3 Months | 4–6 Months | 7–12 Months | Over 12 Months | ||
| 1–100 | [36,61] | [6,34,82] | [78] | very short | |||
| [107] | [49,54,55] | [89] | [73] | short | |||
| [121] | [58,72] | medium | |||||
| 101–200 | [31,32,45,57] | [106] | [37,42] | very short | |||
| [4] | [105] | [110] | short | ||||
| medium | |||||||
| 201–300 | [94] | [50] | [56,79] | [79,87] | very short | ||
| [33] | short | ||||||
| medium | |||||||
| 301–400 | [38] | very short | |||||
| short | |||||||
| medium | |||||||
| 400+ | [81] | very short | |||||
| [64] | [88,103] | [53,62,75,88,98] | short | ||||
| [66] | medium | ||||||
© 2020 by the authors. Licensee MDPI, Basel, Switzerland. This article is an open access article distributed under the terms and conditions of the Creative Commons Attribution (CC BY) license (http://creativecommons.org/licenses/by/4.0/).
Share and Cite
MDPI and ACS Style
Rahim, M.S.; Nguyen, K.A.; Stewart, R.A.; Giurco, D.; Blumenstein, M. Machine Learning and Data Analytic Techniques in Digital Water Metering: A Review. Water 2020, 12, 294. https://doi.org/10.3390/w12010294
AMA Style
Rahim MS, Nguyen KA, Stewart RA, Giurco D, Blumenstein M. Machine Learning and Data Analytic Techniques in Digital Water Metering: A Review. Water. 2020; 12(1):294. https://doi.org/10.3390/w12010294
Chicago/Turabian StyleRahim, Md Shamsur, Khoi Anh Nguyen, Rodney Anthony Stewart, Damien Giurco, and Michael Blumenstein. 2020. "Machine Learning and Data Analytic Techniques in Digital Water Metering: A Review" Water 12, no. 1: 294. https://doi.org/10.3390/w12010294
Note that from the first issue of 2016, this journal uses article numbers instead of page numbers. See further details here.