Article

Characteristics of δD and δ18O of Reclaimed Mine Soil Water Profile and Its Source Water Bodies in a Coal Mining Subsidence Area with High Groundwater Level—A Case Study from the Longdong Coal Mining Subsidence Area in Jiangsu Province, China

1
School of Applied Meteorology, Nanjing University of Information Science and Technology, Nanjing 210044, China
2
State Key Laboratory of Resources and Environment Information System, Institute of Geographic Sciences and Natural Resources Research, Chinese Academy of Sciences, 11A, Datun Road, Chaoyang District, Beijing 100101, China
3
College of Resources and Environment, University of Chinese Academy of Sciences, No. 19A, Yuquan Road, Beijing 100049, China
4
Jiangsu Center for Collaborative Innovation of Geographical Information Resources Development and Application, Nanjing 210023, China
*
Author to whom correspondence should be addressed.
Water 2020, 12(1), 274; https://doi.org/10.3390/w12010274
Submission received: 4 November 2019 / Revised: 10 January 2020 / Accepted: 10 January 2020 / Published: 17 January 2020
(This article belongs to the Section Water Quality and Contamination)

Abstract

:
Coal mining, as one of the key drivers of land degradation worldwide, caused land subsidence problems. In this study, we conducted experimental research to explore the reclaimed mine soil (RMS) water dynamics and its sources in relation to reclaimed land use types using stable water isotopes in the Longdong coal mining area with high groundwater level in east China. We collected water samples seven times in 2017 from all of these water bodies (precipitation, surface waters (river water and water from subsidence pits (WSP)), groundwater and soil water). Our main findings are three fold: (1) the values of slope and intercept of the local meteoric water line of Craig (LMWL) of precipitation for the study area are higher than the global meteoric water line of Craig (GMWL) because of the humid monsoon climate zoon, and the values of δD and δ18O of surface waters and soil water and groundwater deviated from LMWL to some extent with a range of 5–30%, and the D and 18O of precipitation and the surface waters have higher seasonal variation than groundwater; (2) the values of δD and δ18O of RMS for the whole soil profile (0–100 cm) are lower than that of precipitation and have obvious seasonal variations and great fluctuation in the topsoil (0–30/40 cm) and decrease at depth (30/40–70 cm) and stable in deep soil layers (below 70 cm deep); (3) the RMS with forest and crop enhanced water infiltration capacity and soil water mixing strength compared with the waste RMS, so establishment of forest and crops should be encouraged in the RMS; (4) the main sources of topsoil (0–30 cm for crop and 0–40 cm for forest) of RMS are precipitation through infiltration, the main supply for deep soil water (below 70 cm deep) is groundwater, and the soil water for the middle deep soil layers (30/40–70 cm) is mainly from mixing sources of precipitation, groundwater, and river water through pant root water absorbing and groundwater upshifting.

1. Introduction

Soil plays an important role in the hydrology, biodiversity, geochemical cycles, and human health and also produces services goods and resources for humankind.
Coal mining is one of the key drivers of land degradation worldwide both in developed nations such as USA, England, Australia, and Spain and emerging economies such as China, India, and Africa [1]. Reclamation of disturbed soils is done with the primary objective of restoring the land. Therefore, understanding the restoration processes of reclaimed mine soil (RMS) is particularly crucial to the global sustainable development.
China is the largest producer of coal in the world, and its coal production accounts for approximately half of the global production and underground (well) mining is the major coal mining way, which produces approximately 92% of the raw coal in China [2,3]. The resulted land subsidence has emerged as the most prominent problem in coal mining areas. Land subsidence destroys large areas of arable land and threatens the local food security and water logging in the subsided land area. The subsidence problem is particularly serious in coal mining areas in the eastern plains of China, where the groundwater table is shallow. It will further cause a large area of ponding and destroy the farmland water circulation system, including damage of surface water, groundwater, and soil water.
Different from other large coal producers, such as USA and India, where the mining land is generally reclaimed by forests to establish stable ecosystems, while in China, agriculture has become the primary land use pattern of reclaimed land in coal mining areas to ease the pressure on arable land caused by coal mining, restore the soil quality, and maintain the stability of regional ecosystems [4]. The goal of soil reclamation is to reconstruct soil quality (including physical, chemical, and biological indicators) that is suitable for sustaining stable agricultural use. Soil water as a “carrier” of nutrient cycling and biological functions, plays an essential role in the early stages of the transformation of subsided land filling materials, fertility accumulation, and ecological restoration in reclaimed mine soils [5,6].
According to the different degrees of surface subsidence, different filling methods are selected for reclamation. The main filling techniques include fly-ash filling, gangue filling, river and lake silt filling, tailings filling, construction waste filling, non-polluting filling, etc. [4,7]. However, no matter what filling and reclamation technology is used, the soil bulk density, pore distribution, and physical clay content are different due to the different topsoil substitutes, different filling layers, and different thickness of the soil, and then change the profile configuration of the soil to different degrees. Additionally, soil profile and soil texture will affect soil moisture. Therefore, filling and reclamation will inevitably affect soil water movement. How to improve soil water conditions and choose the best soil profile reconstruction technology is the key to improve the productivity of reclamation land [5]. Therefore, it is of great significance to study the rule of water migration (soil moisture sources and its dynamics) in different soil reconstruction phases in the mining area with high groundwater level.
Land use, soil management, and vegetative cover play important roles in restoring quality of RMS [8]. The RMS are pedogenically young soils, developing on anthropogenically altered landscape [9]. Compared with undisturbed soils, the reclaimed soils have higher bulk density, higher rock content, poorer structure, lower porosity, lower water holding capacity, lower infiltration rates, and slower hydraulic conductivity [10,11,12,13]. Evaluation of the effects of past-reclamation land uses on physical and chemical properties, and the roles of soil water content and its dynamics on mine soil reconstruction helps to identify suitable land uses and soil water management for RMS managers.
Compared with the non-collapse area, the overall bulk soil moisture content in the subsidence area is lower, and increases with depth, and the variability with depth is stronger [5]. It is also reported that subsidence can reduce soil water content, while tillage increases soil water content. Reasonable and appropriate tillage can increase the effective water absorption of crops.
In a comprehensive analysis, researchers mainly focus on the non-filling reclamation mode and the influence of soil compaction on soil moisture change. However, there are few studies on the rule of soil moisture migration and soil moisture sources under different soil profile reconstructions with different land uses (cope and forest).
Stable hydrogen and oxygen isotopes of water (δD and δ18O) as natural tracers for water cycle [14,15,16], having characteristics of rapid reaction to water environmental changes [2,3,17], have been widely applied to hydrological processes and climatological studies [18,19,20,21,22,23,24,25,26,27,28]. Different sources of water have distinct isotopic compositions which are useful for quantifying the contributions of various sources of water components [29,30,31,32,33,34,35,36,37,38,39,40,41,42]. It has been proven that the stable isotope technique has been widely applied to water cycle research as the differences of δD and δ18O among different water bodies can be used to trace the interaction between them [5,25,26,27,28]. However, few studies on δD and δ18O of different water bodies in mining areas have been reported.
In this study, we first make assumption that the soil moisture of RMS originates either from precipitation, groundwater, water from subsidence pit, rivers, or lakes in the mine subsidence area and the adjacent region; and the characteristics of δD and δ18O of soil water can be used to trace where it originates from and its dynamics in the RMS profile given we know their isotopic characteristics. We then choose the Longdong coal mining area in east China with high groundwater level as a case study to prove our hypotheses. We collected waters from all of these water bodies (precipitation, rivers, subsidence pits, groundwater, and soil water profiles) during the whole year of 2017 in Longdong coal mining area. We use the stable isotope technology to analyze these above samples, and then combine these isotopic data with precipitation and meteorological data to study the hydraulic connections between soil water and its sources and soil moisture dynamics with different crops or forests during RMS reconstruction processes. These studies can also contribute to the understanding of water recycling in coal mining area, and to provide scientific evidence of the application of stable isotope technology in research on RMS water recycling and to evaluate the effects of post-reclamation land use types (e.g., crops, forest) on the role of soil water dynamics.
In this paper, we introduce our experimental research on RMS water dynamics and its sources using stable water isotopes in mining areas with high groundwater level. The selected research area and analysis methods are introduced in Section 2, results and discussion on isotopic characteristics of different water bodies are presented in Section 3, and conclusions are given in Section 4.

2. Materials and Methods
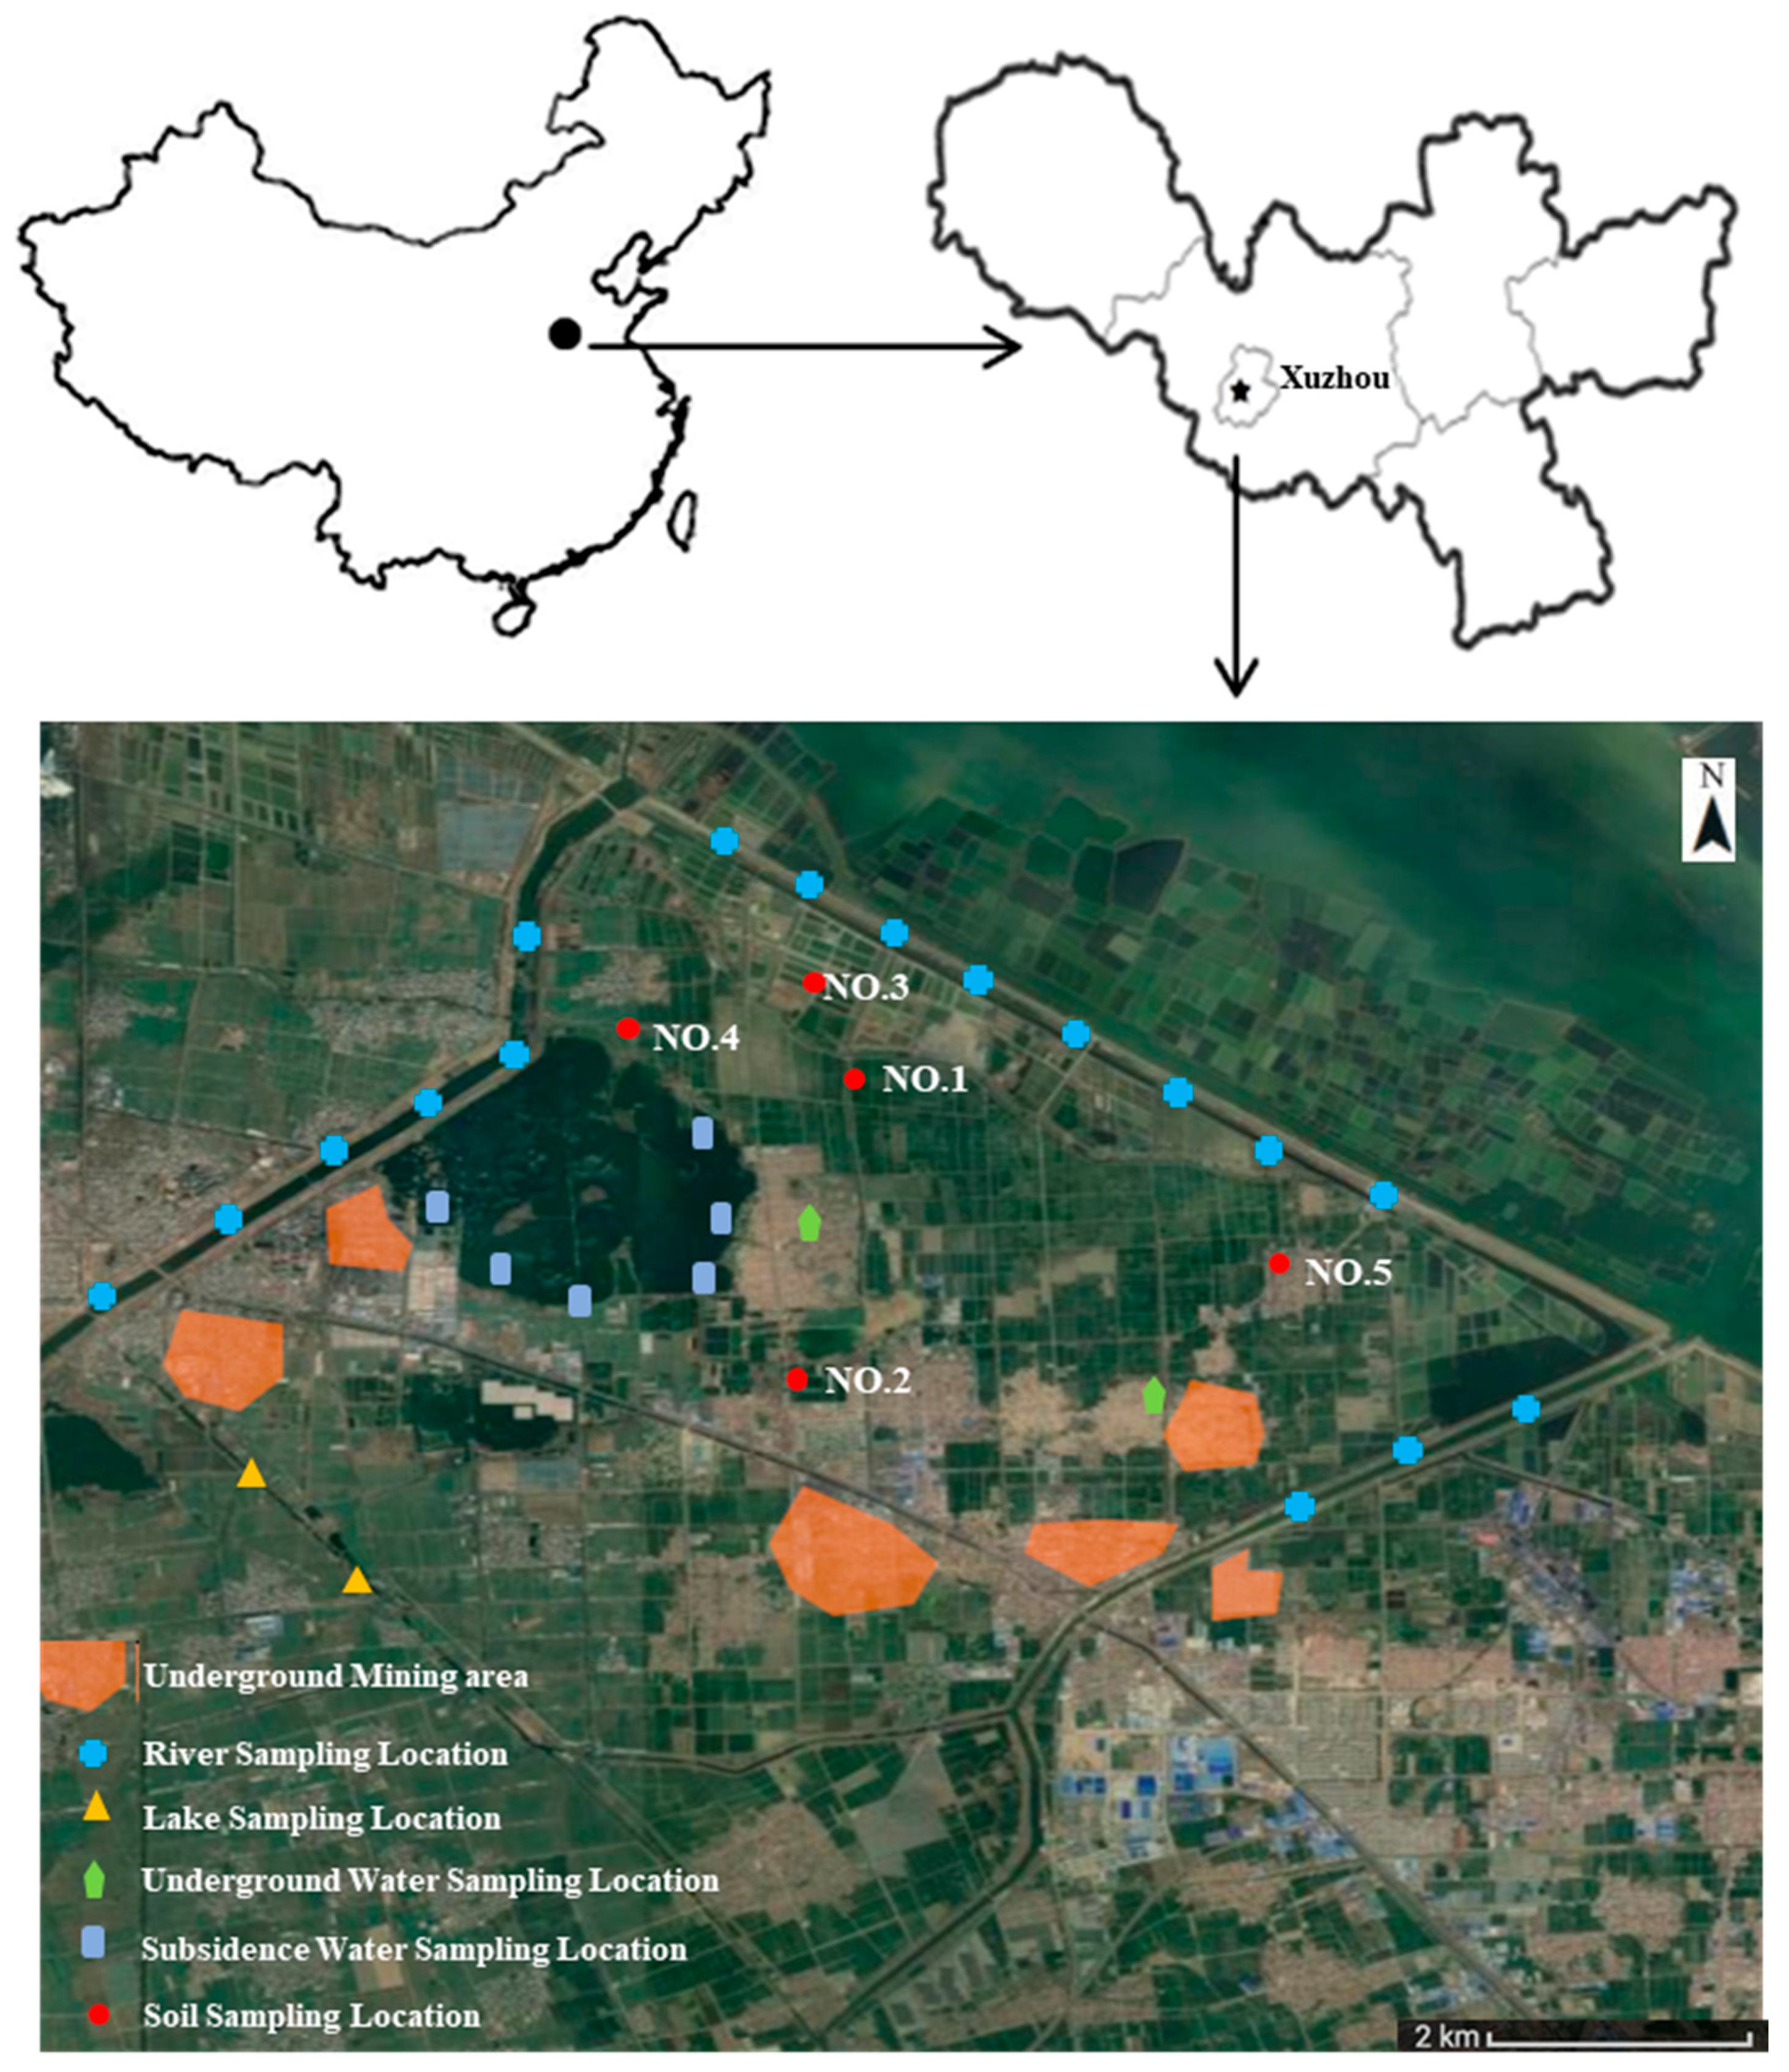
2.1. Research Area

We choose Longdong mining area as a case study area, located in Xuzhou, Jiangsu province, with geographic coordinates of 116.885° E, 34.911° N (Figure 1). The study area belongs to warm temperate, semi-humid monsoon continental zone. The multi-year averaged annual air temperature is 13.7 °C, and the warmest and coldest months are January and July, with mean monthly air temperatures of 0.4 and 27.1 °C, respectively. This area can be divided visibly into dry season (from October to April) and rainy season (from May to September). The multi-year averaged annual total precipitation is 789 mm, distributed unevenly within a year, with 59–63% of rainfall in summer (from June to August) and only 4–5% in winter (from December to February in next year). The prevailing winds are from south-east in summer while from west and north-west in winter, respectively. The annual averaged wind speed is 3.1 m/s. Additionally, annual pan evaporation is 1790 mm/year, distributed unequally among over a year, with maxima (16.7%) and minima observed in July and December or January, respectively. Yellow river alluvium is the main soil parent material which is distributed according to the regularity of “high sand but low viscosity”. The main soil category belongs to fluvo-aquic soil which is both loose and porous, and suitable to plough and sow because of its soil texture and tilth. In addition, the research area is low-lying, the water networks are well converted, geological structure and conditions are complex, and groundwater table is shallow, which has a close relationship with lake seepage.
The Longdong mining area is situated western to Weishan lake, which was constructed in 1982 and put into operation in 1987. The total mining area is about 24.95 km2, and the production capacity reached to 360 million tons a year, with the recoverable 65 million tons. Long term coal mining activities triggered the surface subsidence, forming many water pits with the depths of 0–7 m.
Consequently, land resources, especially cultivated land were destroyed, and the dry ecosystems were forced to evolve in aquatic ecosystems. This severely affected regional water circulation.
According to the different degree of surface subsidence, the river and lake silt filling and tailings filling as the two main filling techniques were selected for reclamation in the study area. The RMS were planted by crops or forests.

2.2. Sampling Methods

2.2.1. Precipitation Sampling

During the observational period (November 2016 to December 2017), precipitation was collected by precipitation collectors which were placed on sample plot randomly. Precipitation was collected in a standard rain bucket, and a round funnel was installed above it to collect rain or snow, with a ping pong ball above the funnel mouth to avoid losses of experimental accuracy that evaporation could cause [43]. The collected precipitation was refilled to a 30-mL plastic centrifuge tube and sealed with parafilm to ensure no air leaching occurred. The tubes were stored in a refrigerator at 4 °C immediately to prevent moisture evaporation. If there was more than one precipitation sample in the same day, the averaged value of these samples was taken for that day. In total, 38 precipitation samples were collected during the study period.

2.2.2. Soil Water Sampling

As shown in Figure 1, we selected three plots (plots No. 1, 2, and 5) from crop land, one plot (No. 3) from forest land, and one plot (No. 4) from waste land. For each selected plot, three soil profiles were dug which randomly distributed within each RMS type and land cover type. The soil samples were collected within the 0–100 cm deep profile at 10 cm intervals and were sealed in bags for water isotopic and other physical and chemical properties analyses. We repeated the above sampling process seven times: in January, February, March, May, July, September, and November. We collected 1050 soil samples in total.

2.2.3. Sampling of the Surface Waters (Rivers, Lakes, and Water from Subsidence Pits (WSP)) and Groundwater (Well Water)

Water samples from rivers, lakes, and subsidence pits were taken from a few centimeters below the surface to ensure the sampled water being fully mixing and no isotope fractionation impaction due to the possible surface water evaporation. The sampling locations are shown in Figure 1. Part of the sampled water was sealed in centrifuge bottles (30 mL) for isotope analysis, and the remaining part was stored in polyethylene bottles (100 mL) for physico-chemical property analyses. The groundwater samples were taken from wells. A total of 58 water samples were collected.

2.3. Isotopic Experimental Analysis

All samples were processed and analyzed in the Isotope Analysis Laboratory of the China University of Mining and Technology.
(1) Soil moisture extraction
Based on the theory of vacuum distillation, the LI-2000 cryogenic vacuum distillation device (Shanghai Analysys Instrument Equipment Co., Ltd, Shanghai, China) for plants and soil moisture was used to extract soil moisture, the extraction time was at least 2 h long to ensure soil moisture was entirely extracted to avoid experimental errors from incomplete extraction. In addition, the extraction process was conducted one more time in the case where the amount of extracted water was less than 1 mL.
(2) Liquid water analysis
In this study, the LGR908-0008 Liquid Water Isotope Analyzer was used to detect the content of δD and δ18O. As for the precision of this instrument, 18O/16O and D/H are above 0.1‰ and above 0.3‰, respectively. The isotopic vales presented in this paper values were normalized against V-SMOW. The analysis was conducted following the procedure of Orlowski et al. [44].

2.4. Isotopic Data Analysis

The statistical analysis method used in this paper is the method suggested by Boschetti et al. [45]. We used a t-student test to verify if differences are statistically significant.
The relationship between δD and δ18O is defined as meteoric water line [46]. The global meteoric water line was first proposed by Craig when he found the linier relation between δD and δ18O of precipitation in the North American continent (global meteoric water line of Craig (GMWL): δD = 8δ18O + 10) [46]. Gourcy et al. [47] further modified GMWL based on worldwide data from IAEA/GNIP database. The updated GMWL research by Gourcy et al. can be summarized as follows: the arithmetic (unweighted) means of isotope ratios in precipitation from nearly 410 stations are described by the equation: δD = 8.07 (± 0.02) δ18O + 9.9 (± 0.1), R = 0.98; and long term means (1961–2000) weighted by the amount of precipitation were calculated considering only the years for which more than 70% of precipitation was analyzed for a given isotope and at least one year of observation was available. The correlation between the weighted means is δD = 8.14 (± 0.02) δ18O + 10.9 (± 0.2), R = 0.98 [47].
Dansgaard further defined the concept of d-excess in 1964 (d = δD − 8δ18O) [48], which can be used to evaluate the degree of deviation of δD and δ18O from the GMWL, and consequently be useful for determining the thermodynamic conditions, water vapor equilibrium condition, geographical condition, and climate pattern of the vapor sources. According to the principle of isotopic fractionation that the light isotope tends to be separated from the fluid water surface first and convert into its gas state (vapor) controlled by molecule distribution rate, and this will lead to the values of δ18O lower than δD in water vapor and the value of d-excess increases. In other words, the value of d-excess of air mass increases with the rapid speed of forming air masses. Sea water is the main moisture source of precipitation and its d-excess equals 0 when the evaporation is under equilibrium condition because evaporation and condensation have same rate. Therefore, the value of d-excess can be used to indicate whether evaporation in the moisture original place is under equilibrium condition or not and the rate of evaporation. The value of d-excess was found to equal to 10 GMWL. Different vapor sources have their own local MWL and values of d-excess reflecting their air-sea conditions [49]. In the study area and its adjusted region, higher D-excess values during winter and early spring are considered to correspond to a lesser proportion of remote moisture, whereas lower D-excess values during summer and autumn correspond to larger amounts of remote moisture transported by summer monsoons [50].
The above GMWL, local MWL (LMWL), and d-excess values were used in this study for water isotopic data analyzing and water sources tracing.

3. Results and Discussion

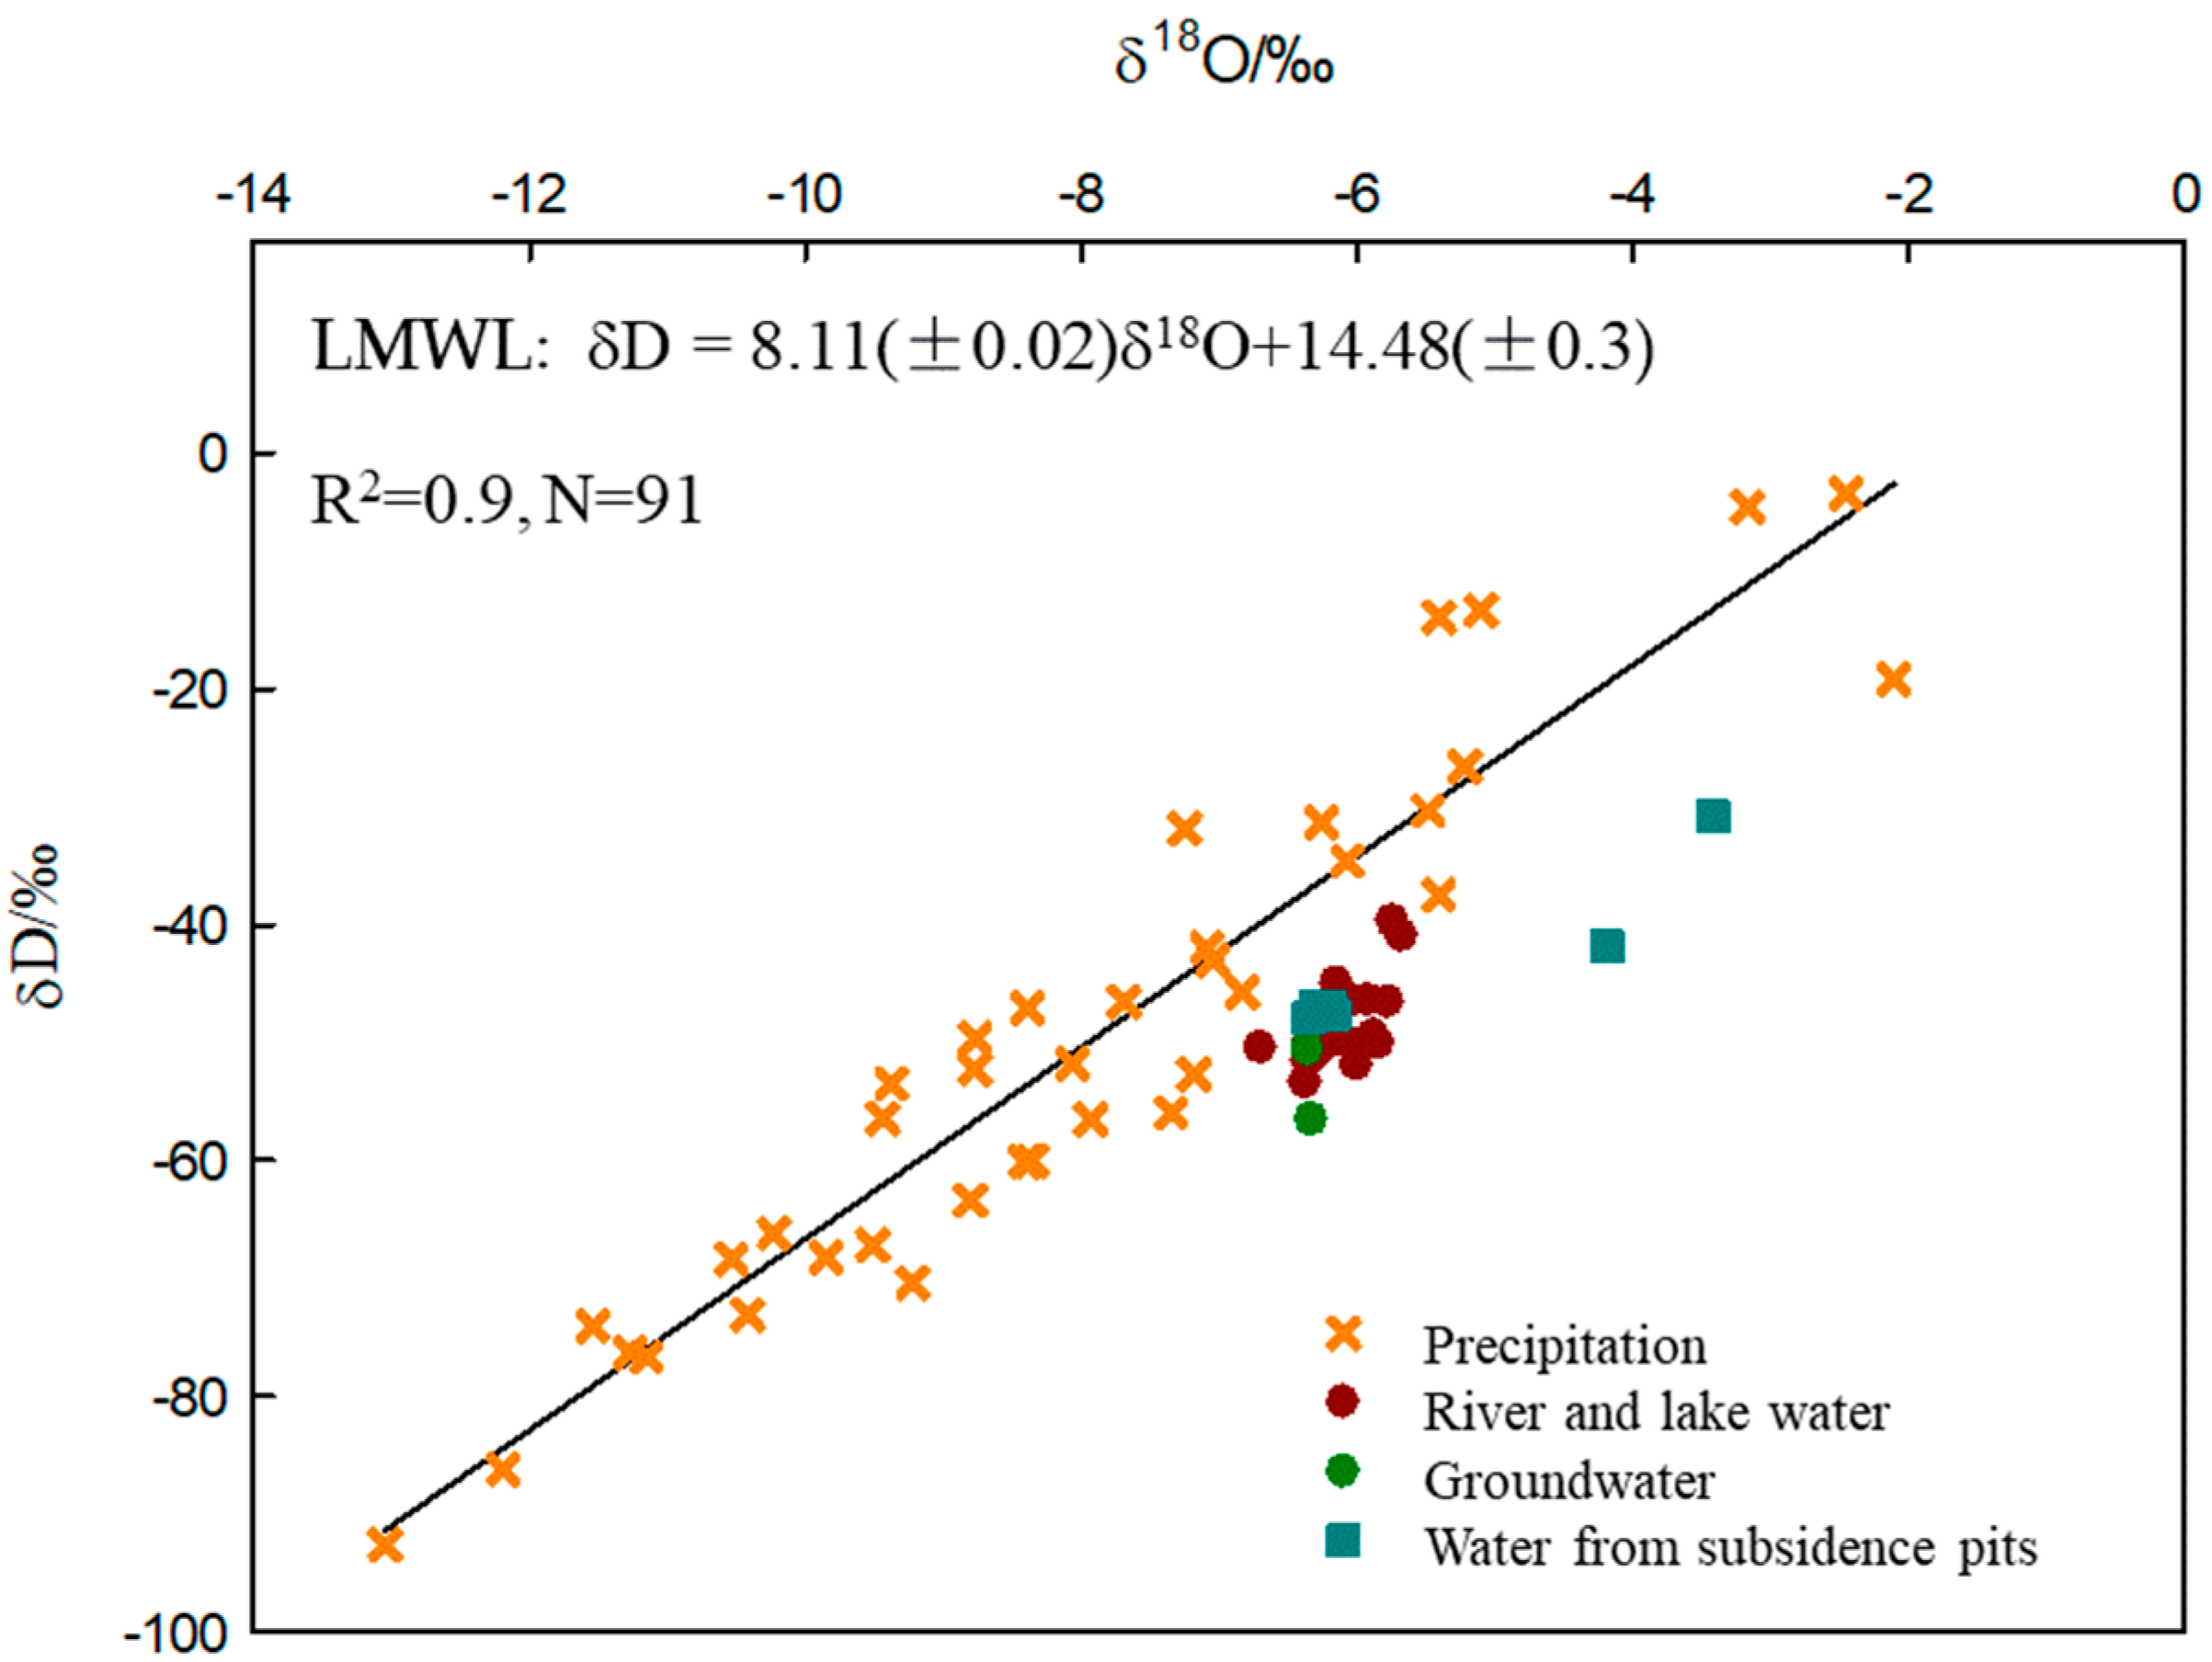
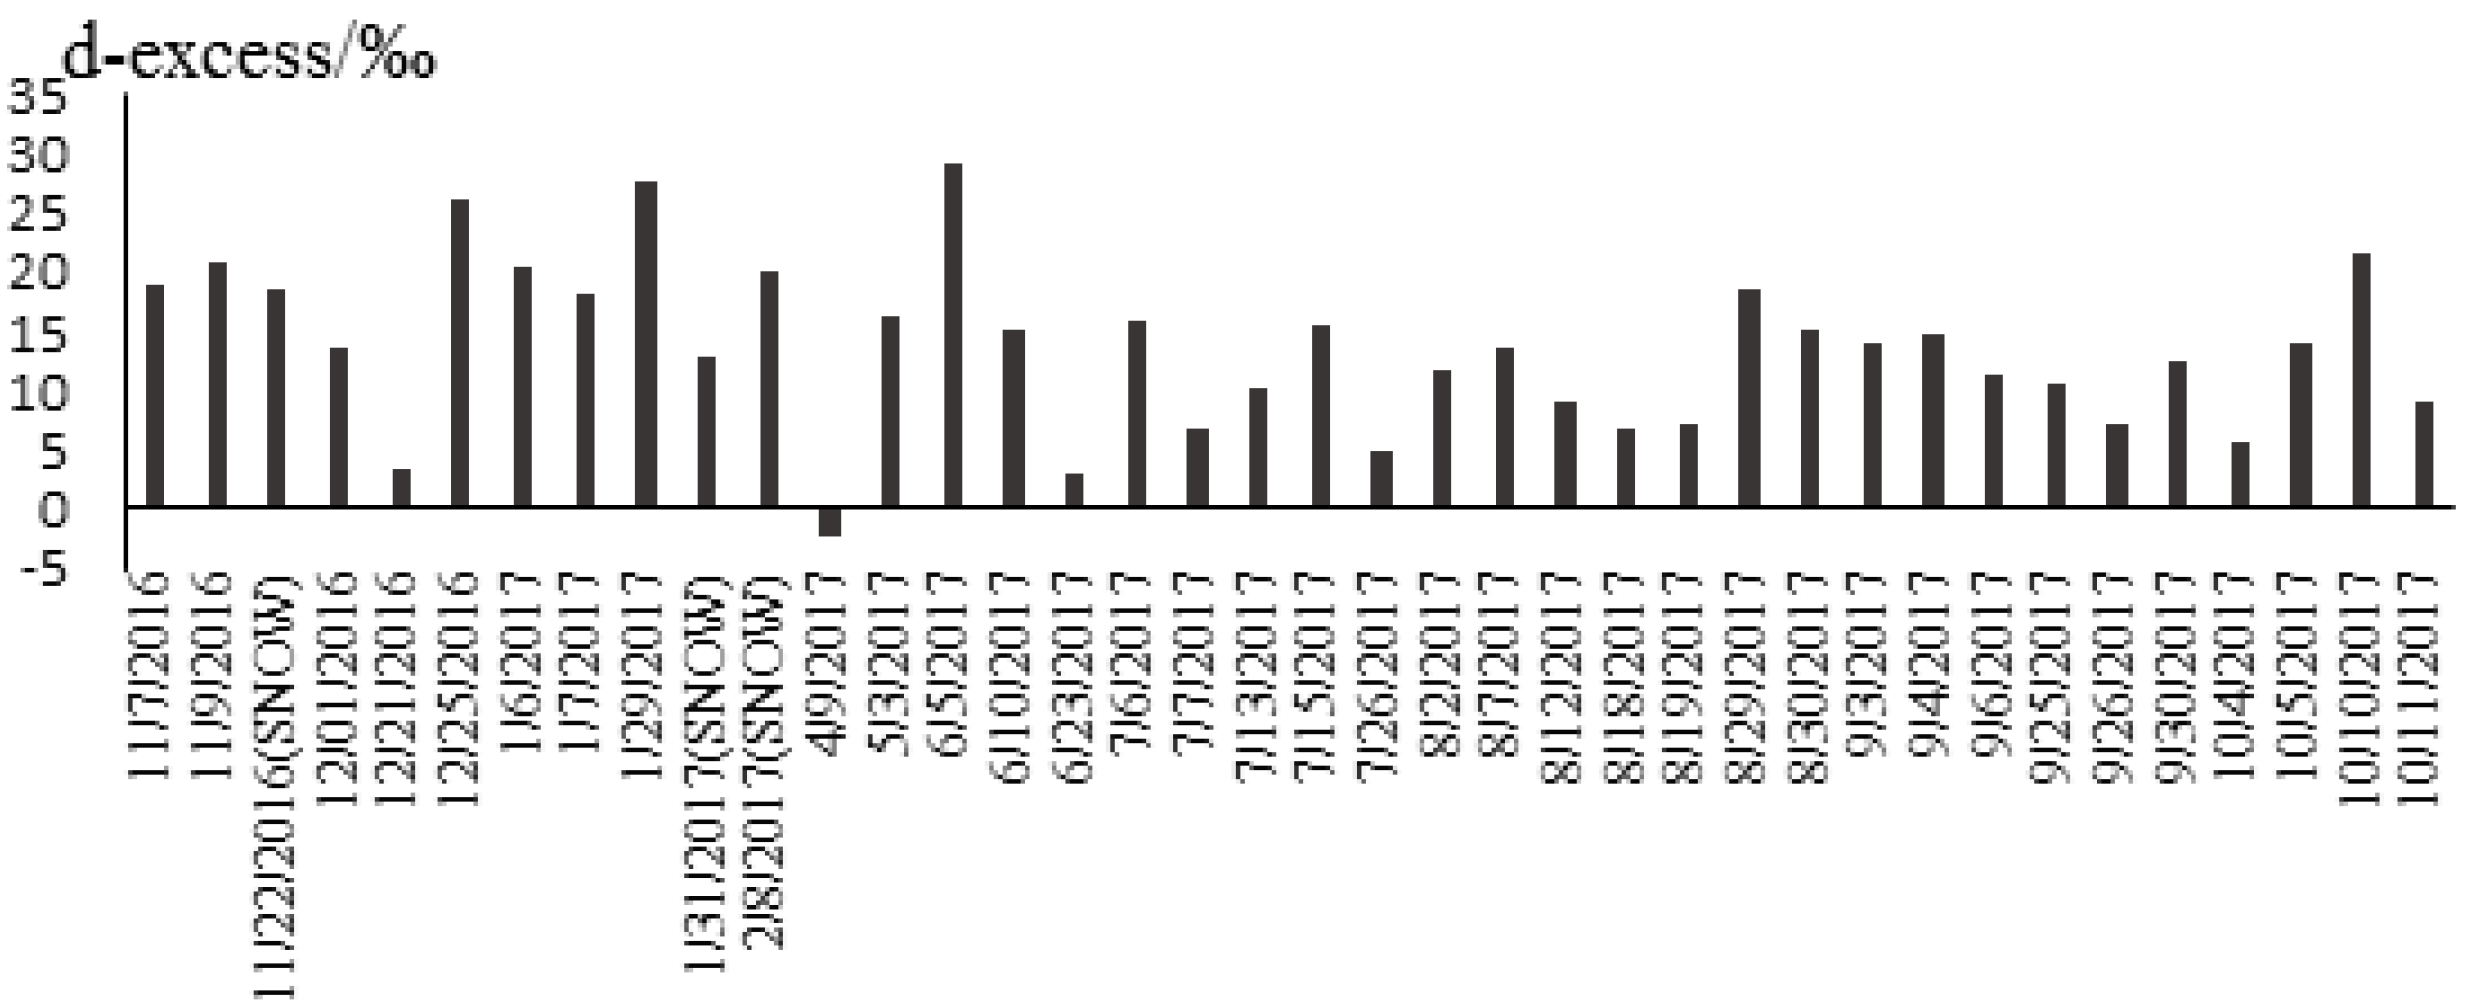
3.1. Characteristics of δD and δ18O of Precipitation

Precipitation is an important link of water cycle, and its isotope composition is determined by the original conditions of vapor sources, atmospheric circulations, and moisture transport processes and pathways [3,51], especially at watershed scales, the δD and δ18O composition of rainfall is not only affected by the large scale factors, such as continental effect and latitude effect, but also affected by local factors, such as precipitation, temperature, topography, and landform [2,3,50,51]. This leads to a large amount of variability between individual precipitation events at a given location [48,52,53,54]. Many researchers reported that the isotopic compositions of precipitation can vary due to changes in synoptic weather patterns [55,56,57,58]. Consequently, changes in δD and δ18O of precipitation follow a certain temporal and spatial variation pattern [59,60,61,62].
The seasonal variations in δD and δ18O of precipitation are shown in Table 1 and Figure 2. The values of δD range from −92.5‰ to −3.5‰, with the mean value of −50.0‰ and the standard deviation of 0.43‰. The values of δ18O ranged from −13.1‰ to −2.1‰, with the mean value of −7.96‰ and the standard deviation of 0.32‰. According to the published research results, the range of δD is from −350‰ to 50‰ in global precipitation [63] and from −210‰ to 2‰ in Chinese rainfall [64], with the mean values of −22‰ and −50‰, respectively; the range of δ18O was from −50‰–10‰ and −24‰–2‰, with the mean values of −22‰ and −8‰, respectively. The variations of δD and δ18O in the research area are within the range of values of global and Chinese rainfall.
δD and δ18O of precipitation have similar seasonal variation amplitudes and patterns. High values of δD and δ18O are found in winter and spring, with the mean value of −28.05‰ and −5‰, respectively, while low values of δD and δ18O are found in summer and autumn (−56.2‰ and −8.55‰, respectively). The compositions of δD and δ18O reflect the levels of isotopic fractionation in regional water circulation. Several factors can affect values of δD and δ18O of precipitation, which are continental and latitude effects at the global scale, while the elevation and seasonal changes play dominant roles at regional scales. Precipitation in study area is mainly affected by the monsoon climate but rarely affected by continent, latitude, and elevation because of its low altitude. The study area belongs to the warm temperate, semi-humid, and continental monsoon zone, which has different dominant monsoons in different seasons, i.e. southeast monsoon in summer while northeast monsoon in winter.
In summer months, a large amount of vapor containing heavier isotopes is carried by the prevailing south wind from the Pacific Ocean because of isotopic fractionation by continuous condensation and transmit processes. Although temperature is high at the same time, the concentration effect by evaporation cannot compensate the depletion of heavier isotopes during the process of vapor transmit, which makes lower values of δD and δ18O of precipitation in the summer monsoon period. However, during the winter monsoon period, drought and cold continental air with stable atmospheric stratification, carried by the dominant northerly wind which has difficultly forming precipitation, has weak depletion of heavier isotopes. The variation trend of δD and δ18O in the district is similar to that in Shijiazhuang [65], Nanjing [66], and Xiamen [67] because these areas are located in the same eastern monsoon zones. From October to May in the next year in these above areas the values of δD and δ18O of precipitation show an increasing dry trend owing to less of rainfall and an increasing trend of air temperature; in summer months (June to August) the values of δD and δ18O of precipitation reached a low level because heavier isotopes are depleted by the scouring effect when the percentage of rainfall in summer reaches 60% of annual precipitation; and during the summer-to-autumn transition period (late August to early October) the values of δD and δ18O of precipitation started to increase until when air temperature still maintains at a high level (>10 °C) and rainfall becomes less. This seasonal trend is different from the results from Müller [68], Stumpp [51], Hughes [69], and Celle-Jeanton [70] because of different atmospheric circulation backgrounds.
As shown in Figure 2, the local meteoric water line (LMWL) is δD = 8.11 (± 0.02) δ18O + 14.48 (± 0.3) (R2 = 0.9, N = 91), and its slope is close to that of the updated GMWL by Gourcy et al. [47] while its intercept is higher than that of the updated GMWL. This is due to the fact that the isotope fractionation rate of D is eight times higher than that of 18O under the conditions of Rayleigh balance and our research area belongs to a humid climate.
In addition, the values of slope and intercept of the LMWL for the warm half year are obviously higher than those for the cold half year, indicating the effects of the different dominant monsoons in summer and winter that the summer south-east monsoon is dominantly affected by humid ocean air mass whereas the winter north-west monsoon is mainly affected by dry continental air mass.
As shown in Figure 3, the values of d-excess range from −2.25‰ to 29.3‰ with the average value of 13.6‰. Out of all the 38 precipitation samples collected in a year-round period, there are 28 samples’ d-excess values higher than 10‰ and six samples’ d-excess values even higher than 20‰, suggesting that evaporation plays an important role in water circulation in the research area. The values of d-excess are higher in the warm half year with the mean value of 12.15‰. Our results are different from the general seasonal pattern of d-excess as mentioned above. Theoretically, d-excess remains unchanged during the transportation from the original place of vapor to the inland. However, the value of d-excess would change when secondary evaporation occurs and the vapor goes back to air mass again caused by regional water circulation, such as the evaporation from open surface water [71,72]. Therefore, based on the above discussion, the higher value of d-excess in the study area in the summer monsoon period would be explained to be triggered by the complex evaporation conditions of the source of vapor and by strong secondary evaporation during the moisture transport.

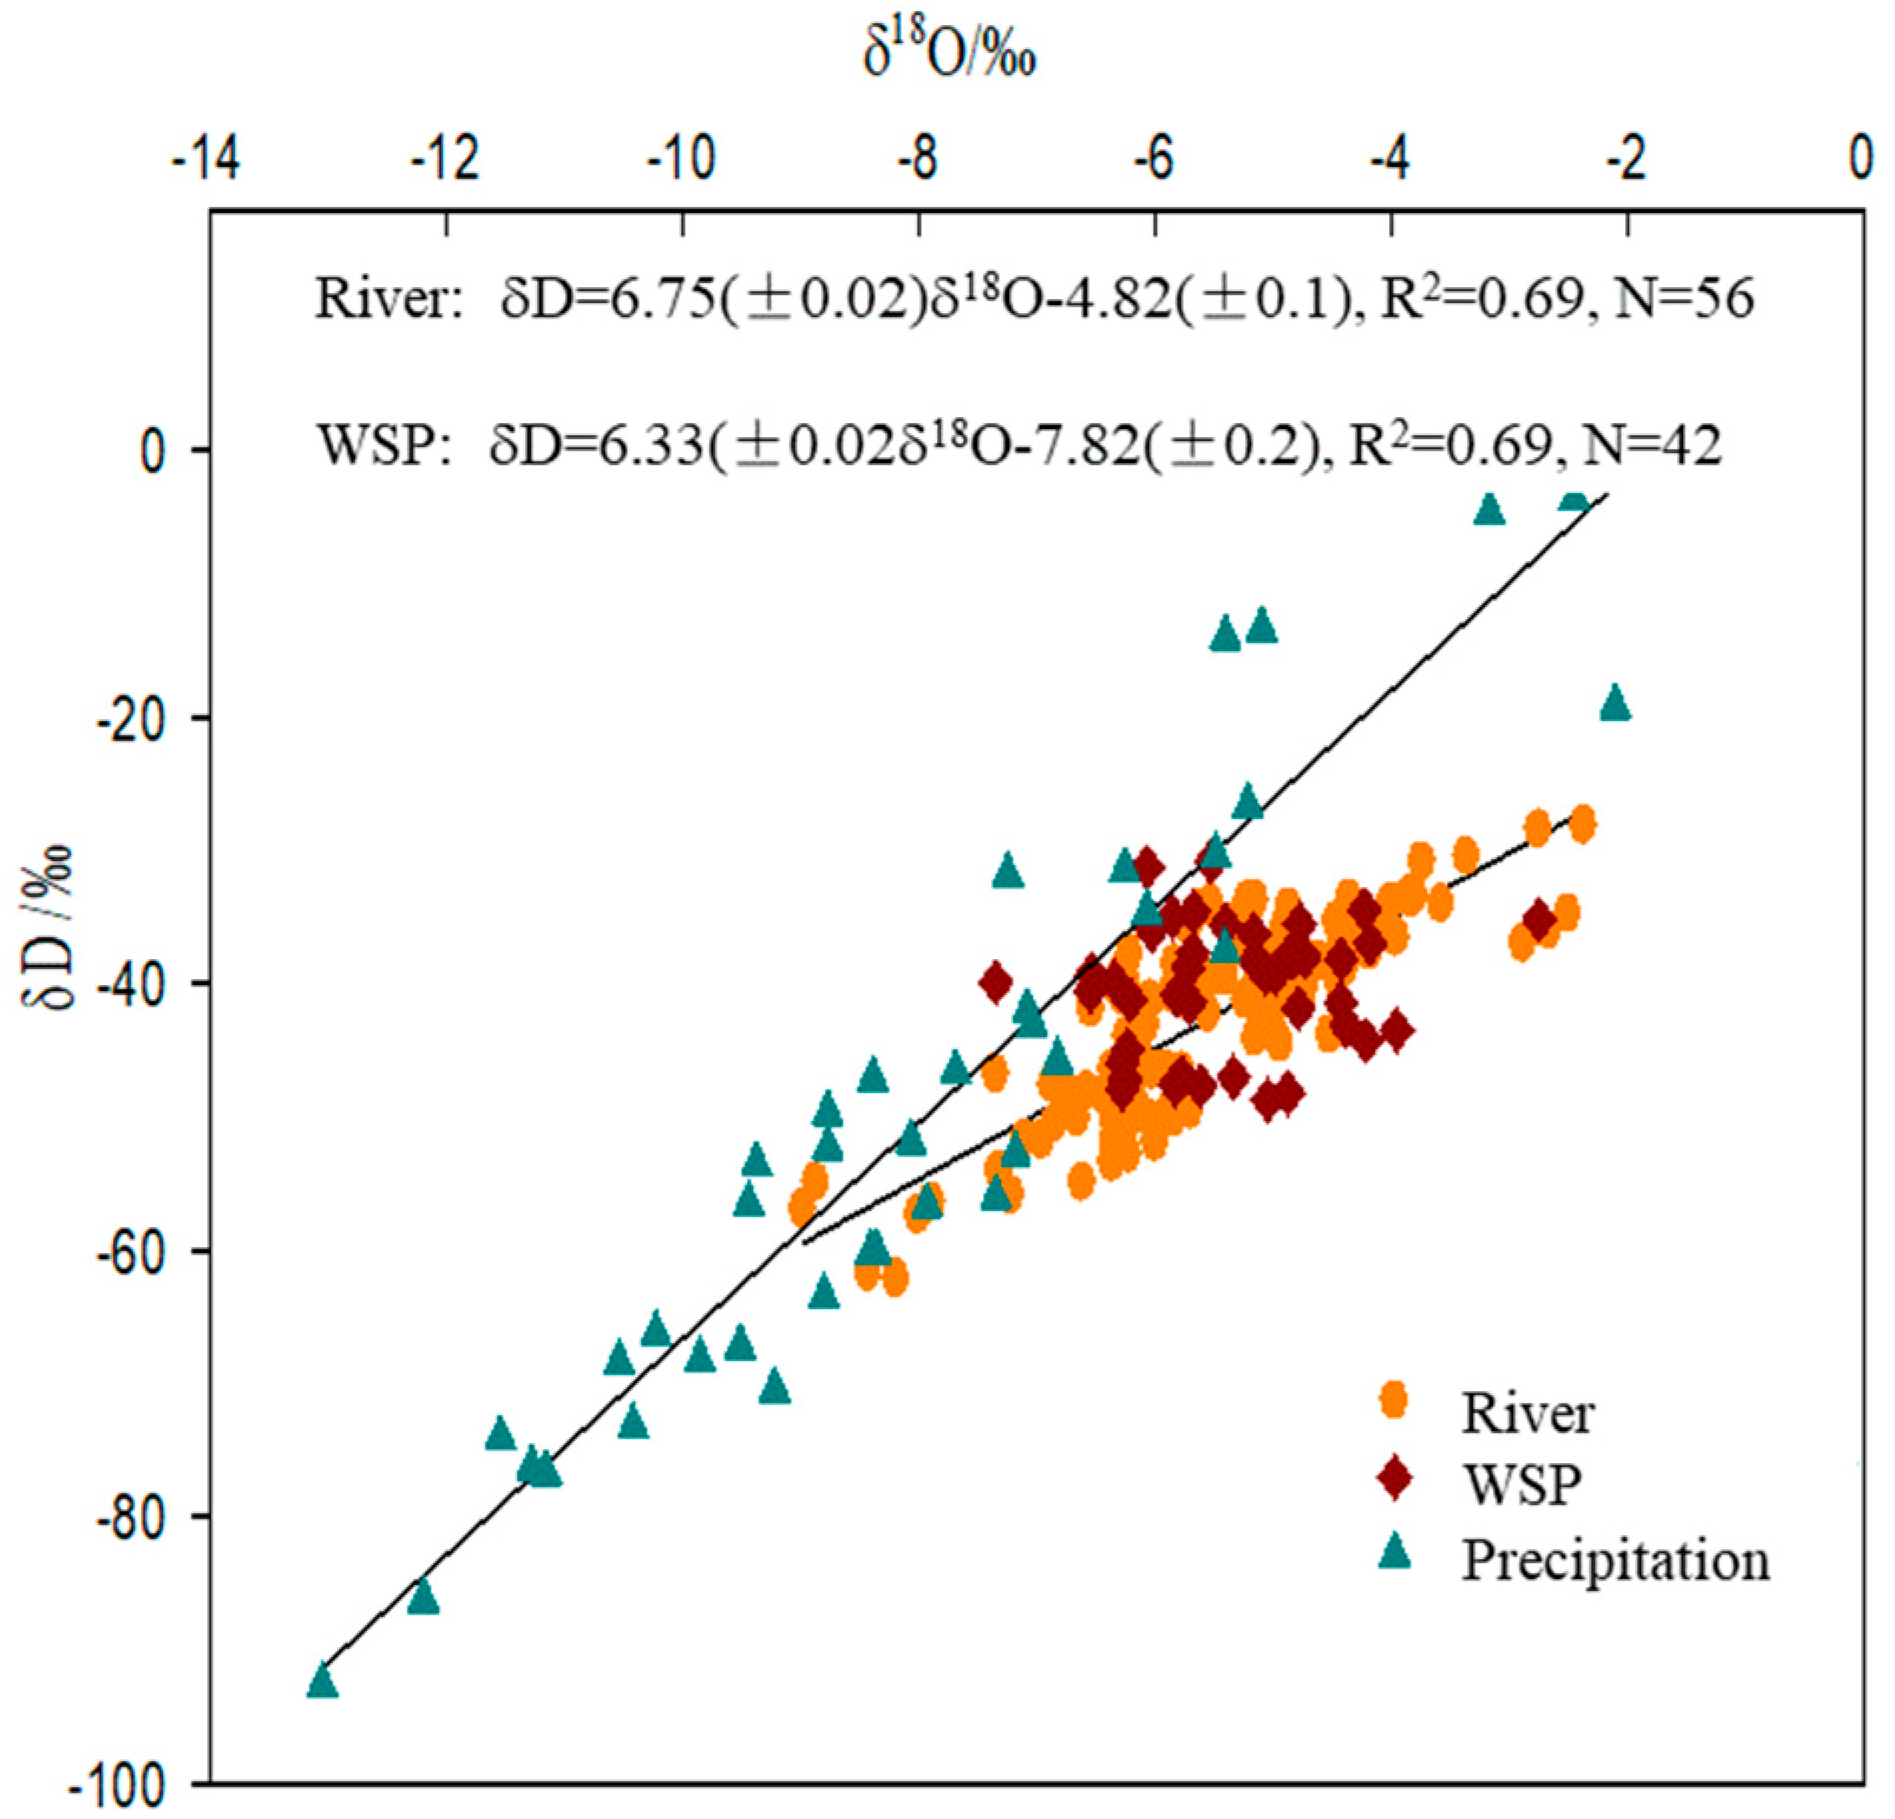
3.2. Characteristics of δD and δ18O of Surface Waters (Rivers, Lakes, and WSP)

For all surface water samples, the values of δD range from −71.64‰ to −28.08‰, with the mean value of −43.77‰ and the standard deviation of 0.18‰, respectively (see Supplementary Tables S1–S3); the values of δ18O ranged from −8.98‰ to 2.75‰, with the mean value of −5.76‰ and the standard deviation of 0.17‰, respectively (see Supplementary Tables S1–S3). Variations of δD and δ18O are lower than that of precipitation, and these results coincide with that of Aaron [73], Rietti-Shati [74], and Tian [75]. This is mainly because evaporation and the mixture of old river water and other water sources during the process of the recharge of river from precipitation, are the comprehensive embodiment of confluence, retention, and conversion [76]. The values of δD varied from −57.96‰ to −30.79‰, with the mean value of −40.45‰ and the standard deviation of 0.14‰, respectively; the values of δ18O varied from −6.35‰ to −3.42‰, with the mean value of −5.15‰ and the standard deviation of 0.15‰, respectively. Variations of δD and δ18O of WSP are smaller than that of river, lake, and precipitation. This is because WSP is a comparative closure which was less affected by external factors. The values of δD and δ18O of river and WSP are higher in January, February, March, and May, and during that time the mean values of δD and δ18O are −37.84‰ and −5.03‰ in river, −38.46‰ and −4.91‰ in WSP, respectively. These higher values of δD and δ18O in these months would be attributed to the recharge of rainfall with smaller values of δD and δ18O in the rainy season. While the values of δD and δ18O are smaller in November, indicating the existence of remaining precipitation of summer months in groundwater which can also recharge river and water subsidence pits during drought season, and that there is a large amount of old rainfall with lower values of δD and δ18O in river and WSP in these months [77].
The mean values of δD and δ18O are higher in river and WSP than that of precipitation. This may be mainly because that part of precipitation forms surface runoff while the remaining part infiltrates into the aeration zone and converts it into underground runoff, and the runoff can recharge river and WSP and isotopic fractionation occurred by evaporation during the recharge process. In addition, the mean values of δD and δ18O are also higher in river and WSP than that of in groundwater, which may result from the following reasons: (i) the river water and WSP are more strongly affected by isotopic fractionation owing to external factors, such as evaporation; (ii) the limited amount of recharge that river water and WSP receive from groundwater.
Based on isotopic data and a simple linear regression method we gain the river water line and WSP line as
δD = 6.75 (± 0.02) δ18O − 4.82 (± 0.1), R2 = 0.69 and
δD = 6.33 (± 0.02δ18O − 7.82 (± 0.2), R2 = 0.69, respectively.
δD and δ18O of river water and WSP deviate from LMWL and drop in the lower right of LMWL, indicating precipitation was the source of river and WSP and isotopic fractionation occurred by evaporation during the recharge process [78]. As seen in Figure 4, the values of slope and intercept of river line are smaller than that of LMWL, but higher than that in America [16] and in the Urumqi River Basin in eastern Tianshan Mountains, China, located in the far northwest of the country [79]. This may be attributed to the fact that our research area belongs to the monsoon zone at middle latitude and has a humid climate pattern. Besides, it is noteworthy that the river line is obviously different from that in Huainan coal mining which is not far from our research area [80], which may be because the latter research only took seven river water samples (in May and November) and the limited samples would not be representative for the characteristics of δD and δ18O in Huainan coal mining year round.
The comparative weaker correlation between δD and δ18O for river and WSP indicates the complex factors affecting them. Apart from natural factors, river and WSP are also affected by human activities, including many towns distributed along the river and long-term coal mining activities. As shown in Figure 5, the values of slope and intercept of river water and WSP are very close, suggesting that these two types of surface water have similar water sources [81].
Runoff is a tie for integrating different water bodies at watershed scales, and has important influences on the δD and δ18O compositions of different water bodies [16,82,83]. In terms of river, seasonal variations of δD and δ18O result from the compositions of δD and δ18O of their main recharge sources [84], such as precipitation, surface runoff, groundwater, and interflow, and by its geographical position, landform, and geomorphology and meteorology [85].

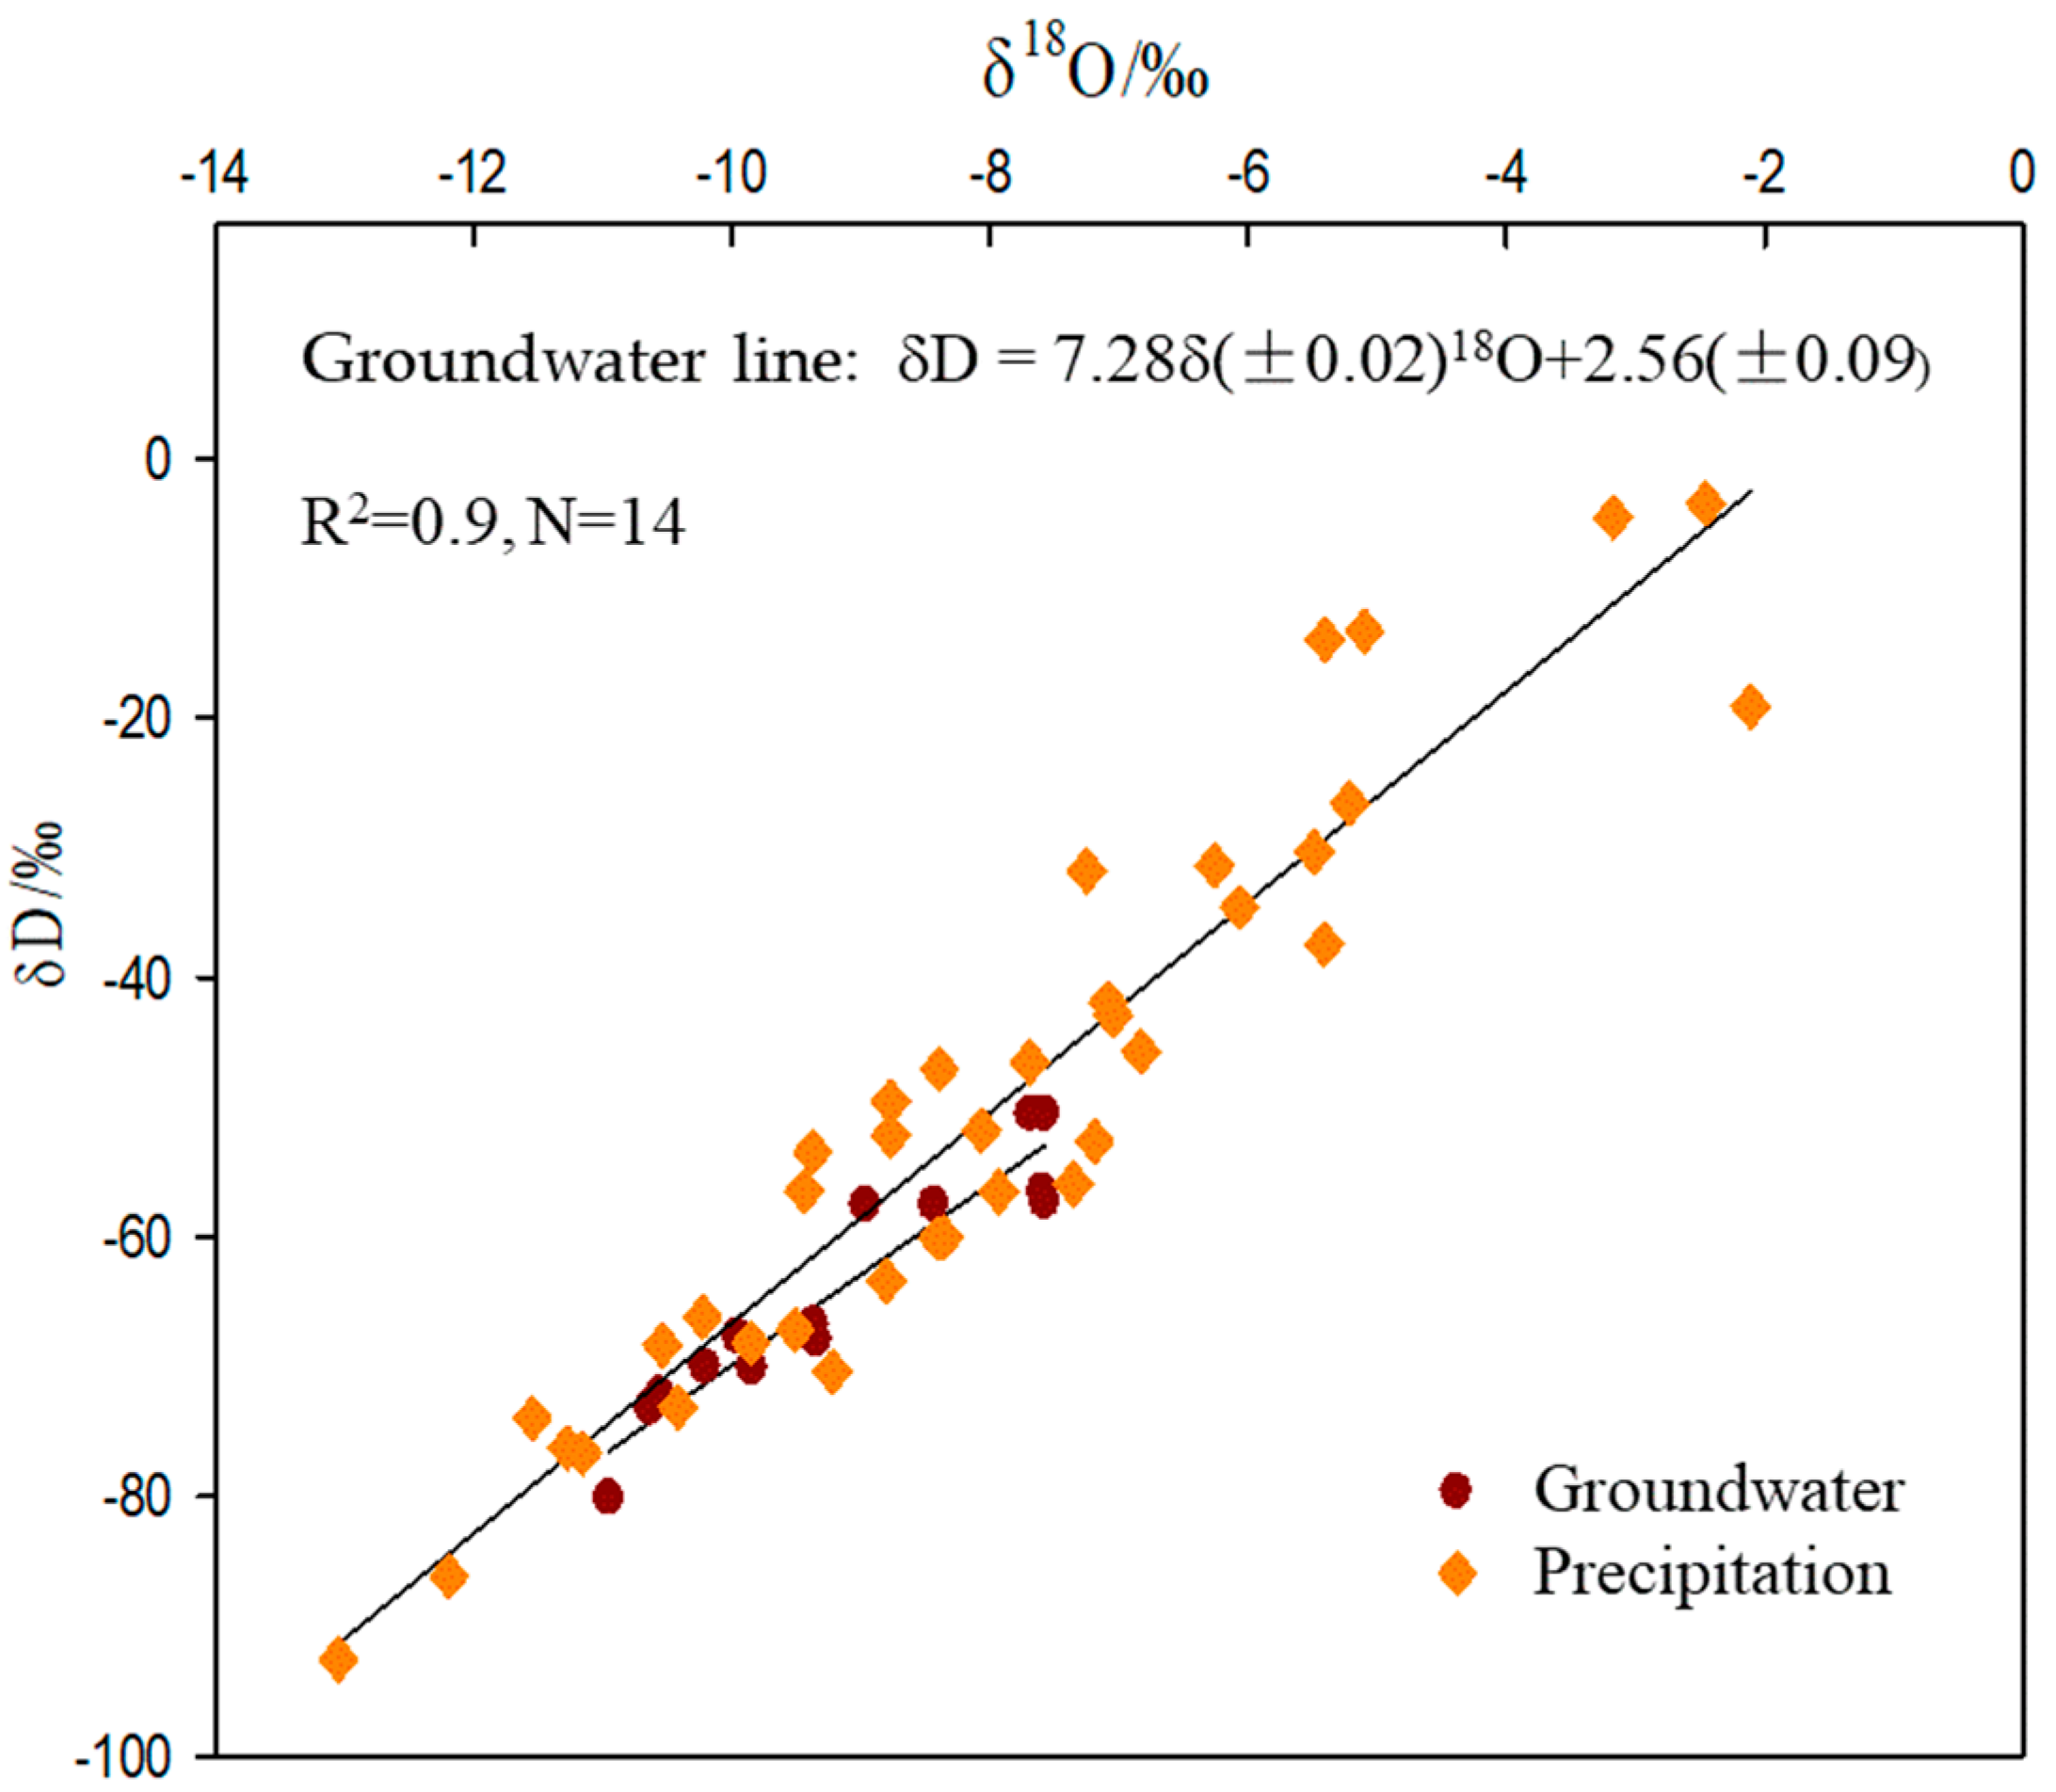
3.3. Characteristics of δD and δ18O of Groundwater (Well Water)

As is shown in Figure 5 (data also shown Supplementary Table S3), the values of δD of groundwater range from −73.25‰ to −47.61‰, with the arithmetic mean value of −61.54‰ and the standard deviation of 0.08‰, respectively.
The values of δ18O vary from −10.84‰ to −9.13‰, with the arithmetic mean value of −8.81‰ and the standard deviation of 0.06‰, respectively. The arithmetic mean values of δD and δ18O of groundwater are lower than that of precipitation owing to the fact that groundwater may contain former precipitation, soil water which has lower values of δD and δ18O. Similar to precipitation, δD and δ18O of groundwater also showed a weak seasonal variation characterized by higher values of δD and δ18O in the dry season and lower values in the rainy season. Our finding is consistent with that of Huawu [86]. The values of δD and δ18O are −57.27‰ and −9.85‰ from July to November and are −43.73‰ and −6.37‰ from January to May, respectively. This character is coherent with that of precipitation. This is mainly because the amount of precipitation in the rainy season accounts for about 60% of the annual total and high percentage of rainfall may infiltrate into deep soil and recharge groundwater, which makes δD and δ18O of groundwater able to retain characteristics of precipitation in the rainy season. The values of δD and δ18O, however, are still lower in November (the mean values of δD and δ18O are −53.59‰ and −7.64‰, respectively) owning to evaporation effect beingweak and the stability of groundwater. The groundwater line is δD = 7.28δ (± 0.02)18O + 2.56 (± 0.09) (R2 = 0.9, N = 14) and the values of slope and intercept are lower than that of precipitation, indicating that evaporation still occurred during the recharge process of precipitation. Besides, the groundwater line is much closer to that of river water. This may suggest that there are cracks in the study area to mix the surface water with groundwater.

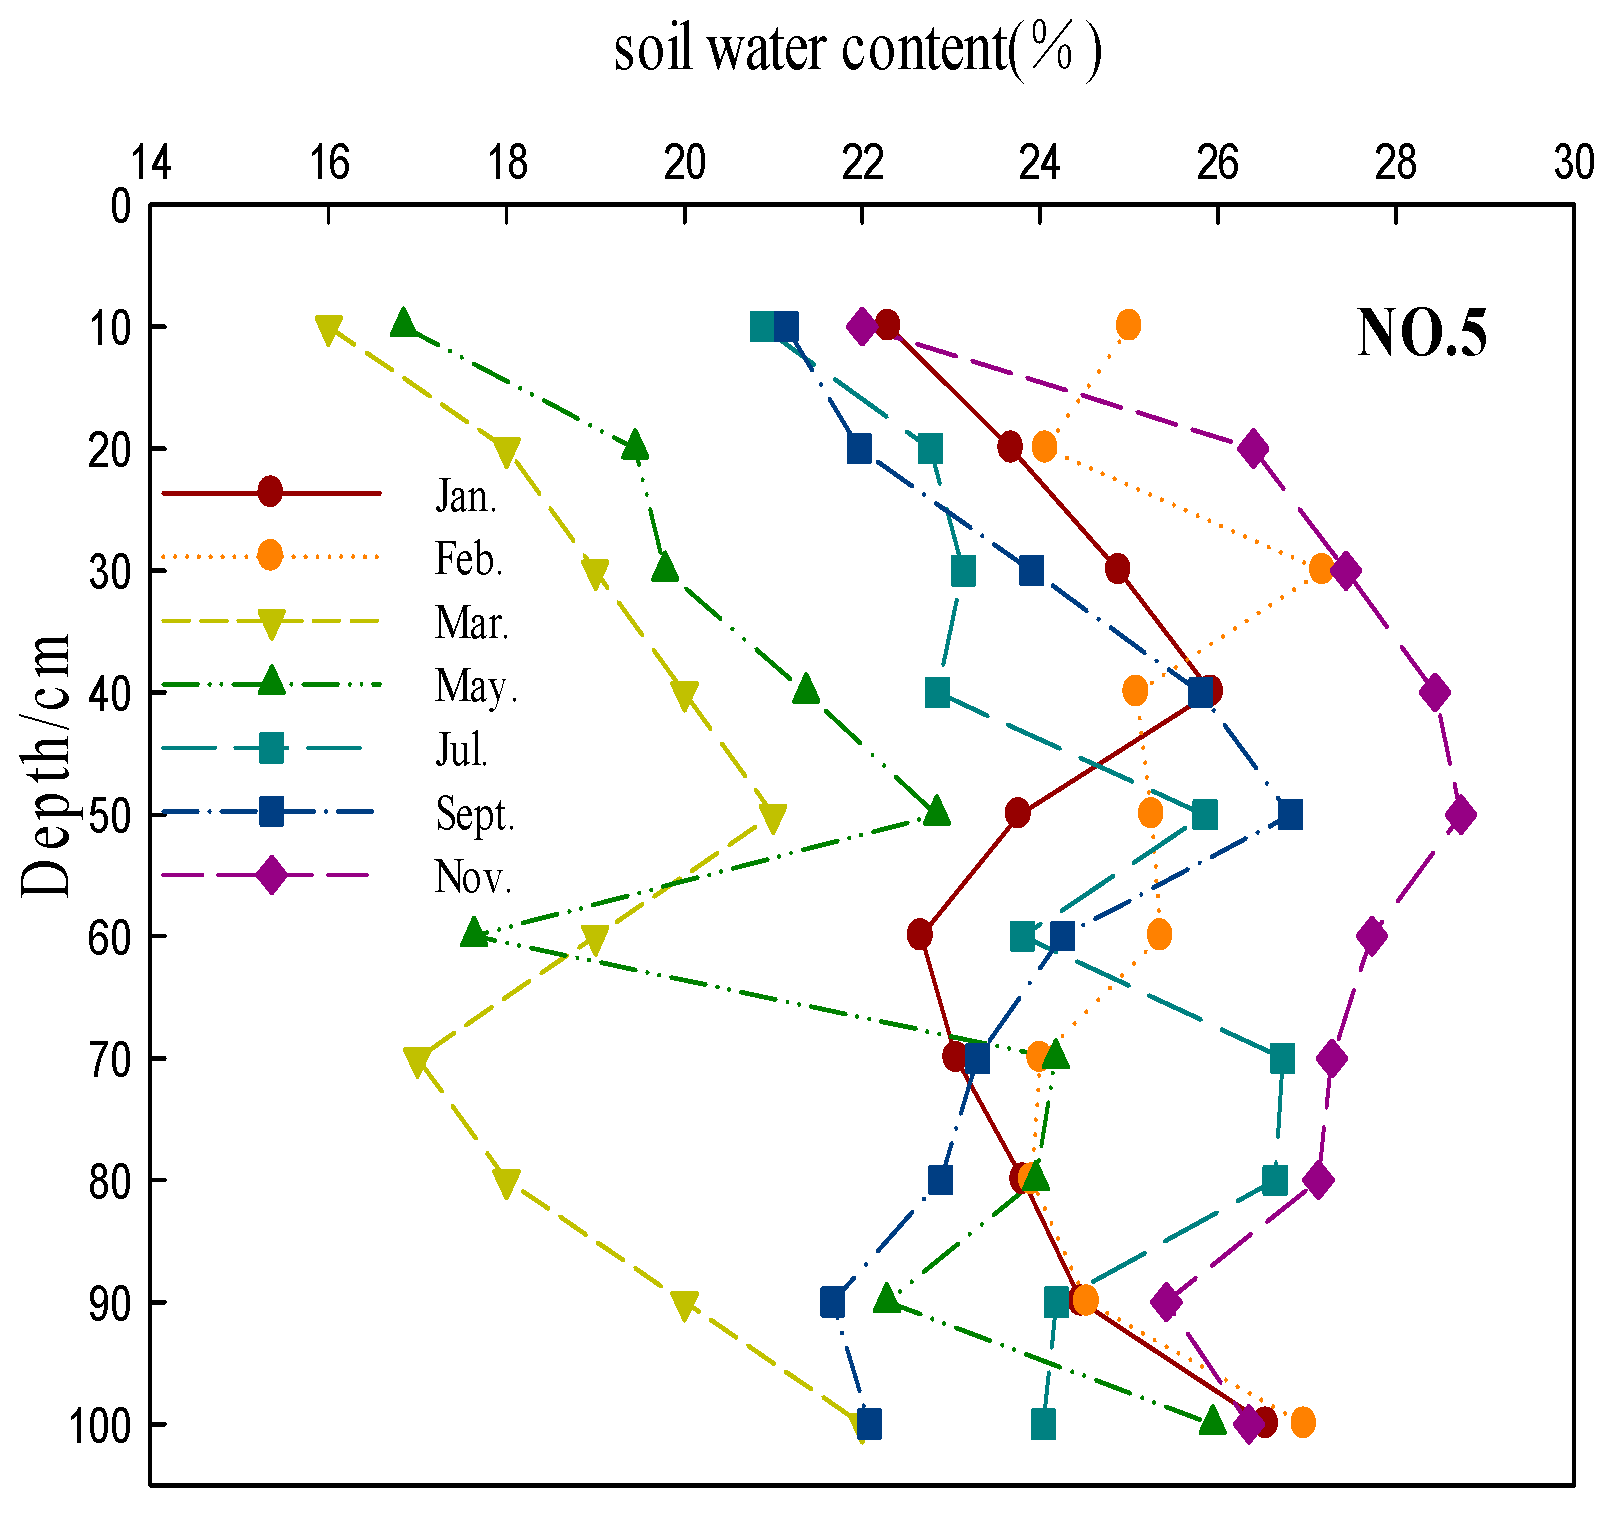
3.4. Soil Water Content Profile of RMS

Soil moisture is referred to as moisture between soil particles [87], which is a key variable controlling the heat and moisture exchange between land and the atmosphere via evapotranspiration. As shown in Figure 6, soil water content during the research period ranged from 7.6% to 37.4%, with the average value was 23.8%. The standard deviation varied from 0.06 to 0.29. Generally, low soil moisture was seen in the topsoil (0–20 cm) caused by strong evaporation, below the depth of 20 cm, there was an increasing trend and increased and comparatively stable below 60 cm.
As shown in Figure 6, soil water content changed consistently in the farmland (samples No. 1, 2, 5), ranging between 8% and 32%, with the mean value of 24%. High values are seen in November, January, and February when evapotranspiration was low caused by wheat and low soil temperature. Due to evaporation caused by increasing temperature and transpiration by wheat growth, soil water content started to drop from March and reached the minimum in May. This is because wheat entered the postulation period when the plant grows rapidly, indicating high demand of water and strong transpiration, and that strong evaporation was triggered by high temperature at that time. Higher soil water content was found in July when the rainy season came and the whole soil profile gained enough water supply. At that time, wheat was reaped, and soybean was cultivated, which means the demand of water drops. Therefore, water moisture at each depth remained at a high level. The value of water moisture dropped from September when the rainy season ended, meaning the decreasing supply of soil water.
Figure 6 (No. 3) shows that forest land had a higher soil water content in general because of its strong function of conservation of water resources, and the range was from 14% to 32%, with the mean value of 24%. Soil water content was low in the topsoil (0–40 cm) of cultivated land in March and May, but high level was found in forest land at that time (above 15%), although this value was lower in the topsoil of forest land compared to that of other months. This big difference of soil water content between the topsoil of cultivated land and forest land was because the latter had lots of forest litter on thw soil surface and had weak evaporation owing to high forest canopy density.
Soil water content was at a middle level in July though water supply was sufficient. This trend was different from that of other land covers because trees consumed a large amount of soil water for maintaining growth via transportation. It is worthy to notice that there was a sharp decrease of soil water content in topsoil of trees (0–40 cm) in September and soil was even more dry than in May. Soil water content for the whole profile was high in November, even though the input of rainfall was small possibly because of the redistribution of water resources. There was a slight drop of soil water content in January and February, considering the decreasing input of rainfall and small effect of evaporation.
The soil water content in waste land (No. 4, Figure 6) varied from 13% to 29%, with a mean value of 23%. There was no obvious regularity in this sample field because this land is uncovered and affected seriously by external environment and human activity.

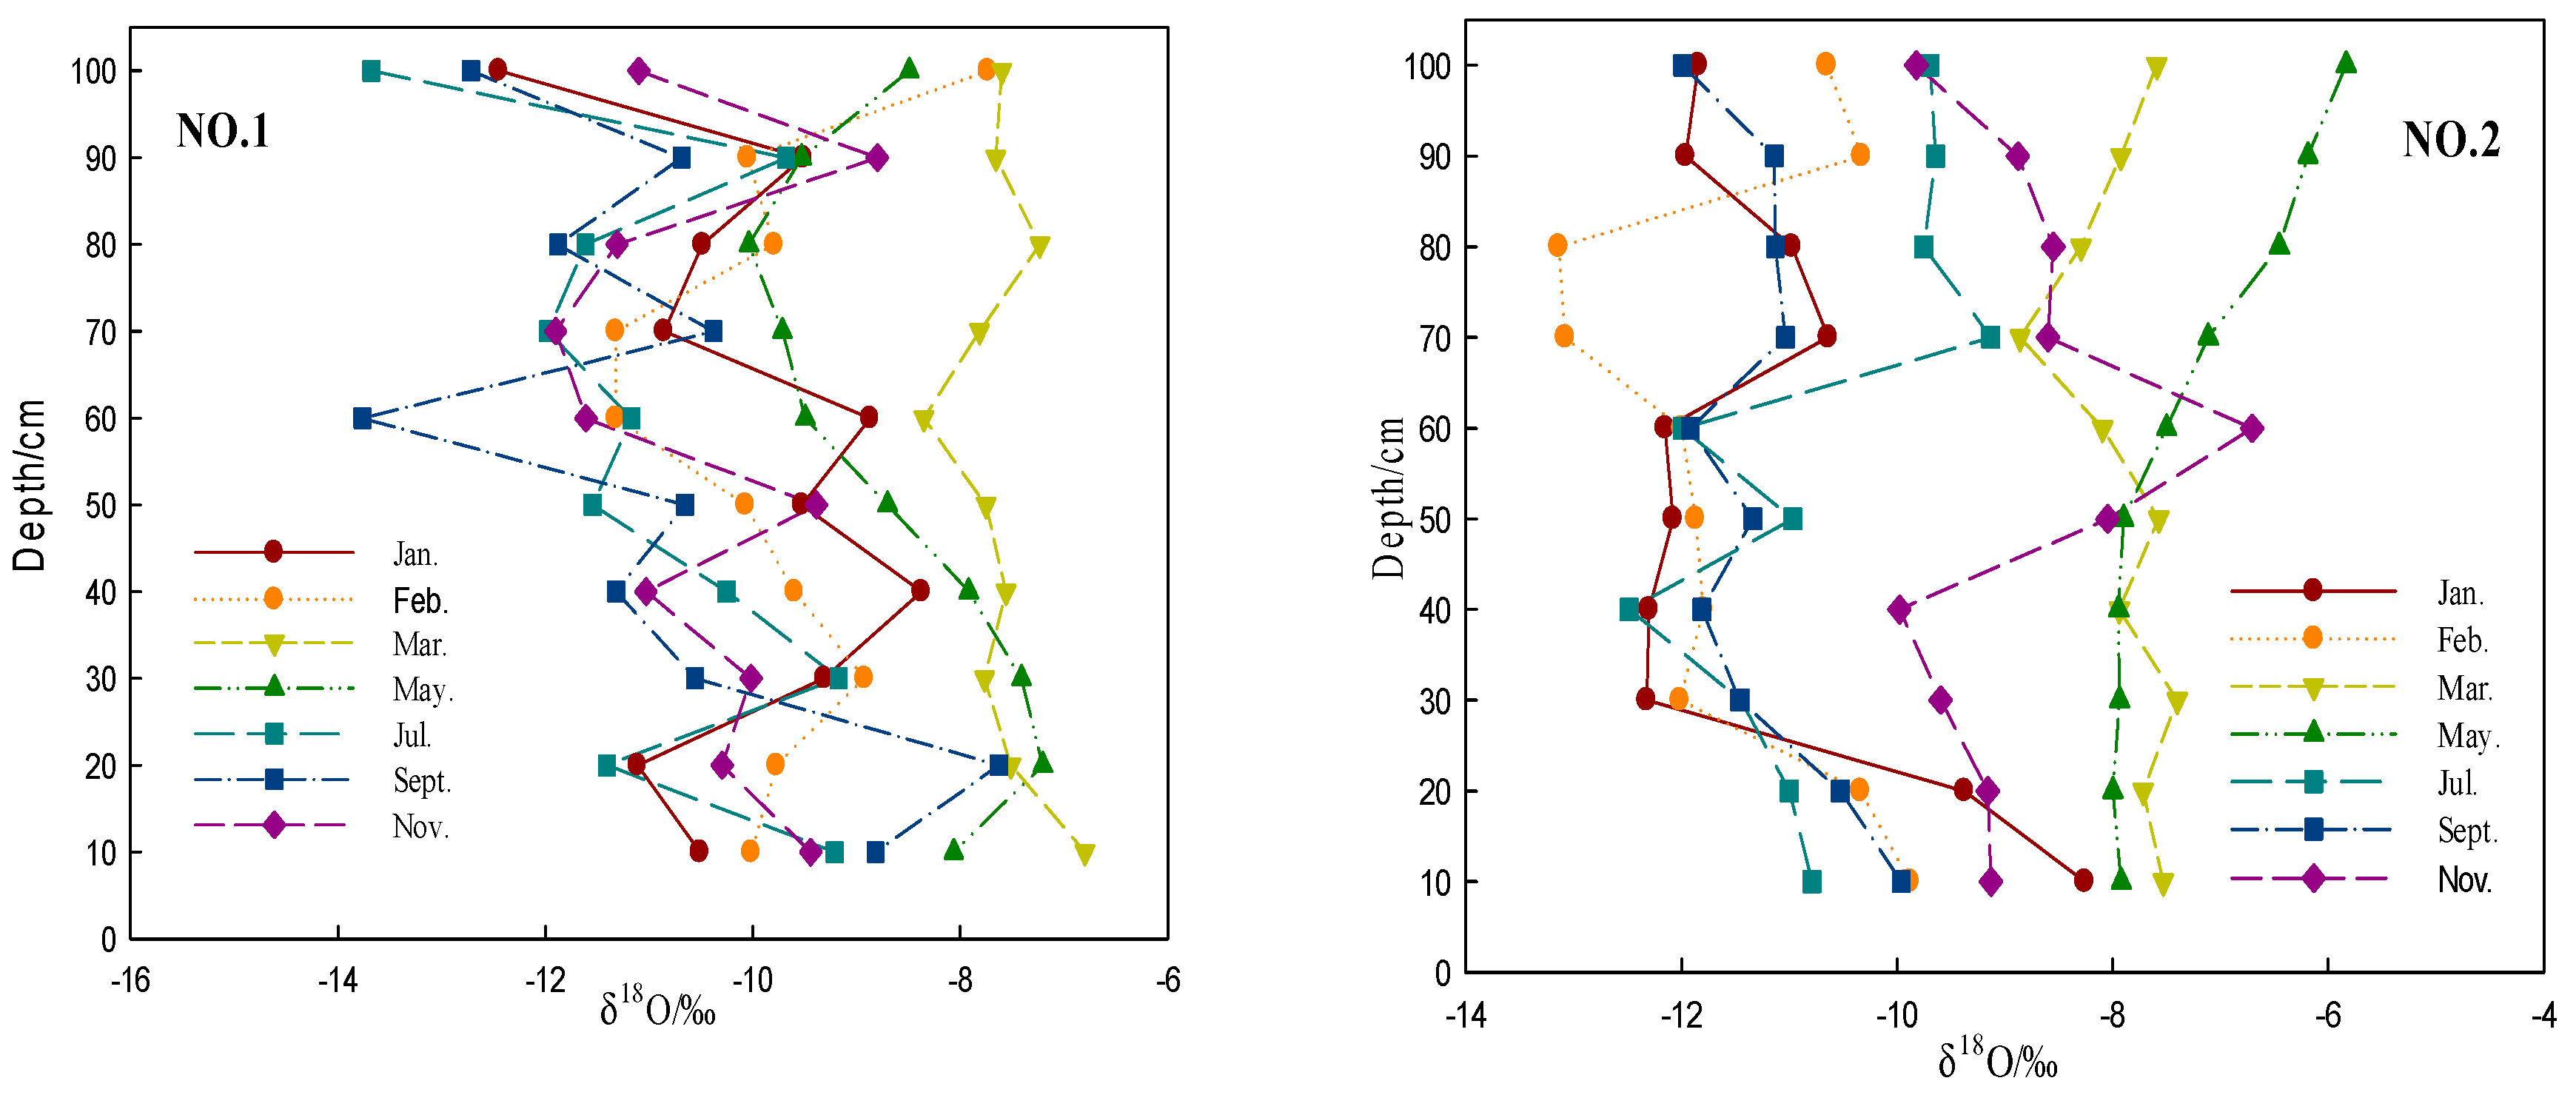
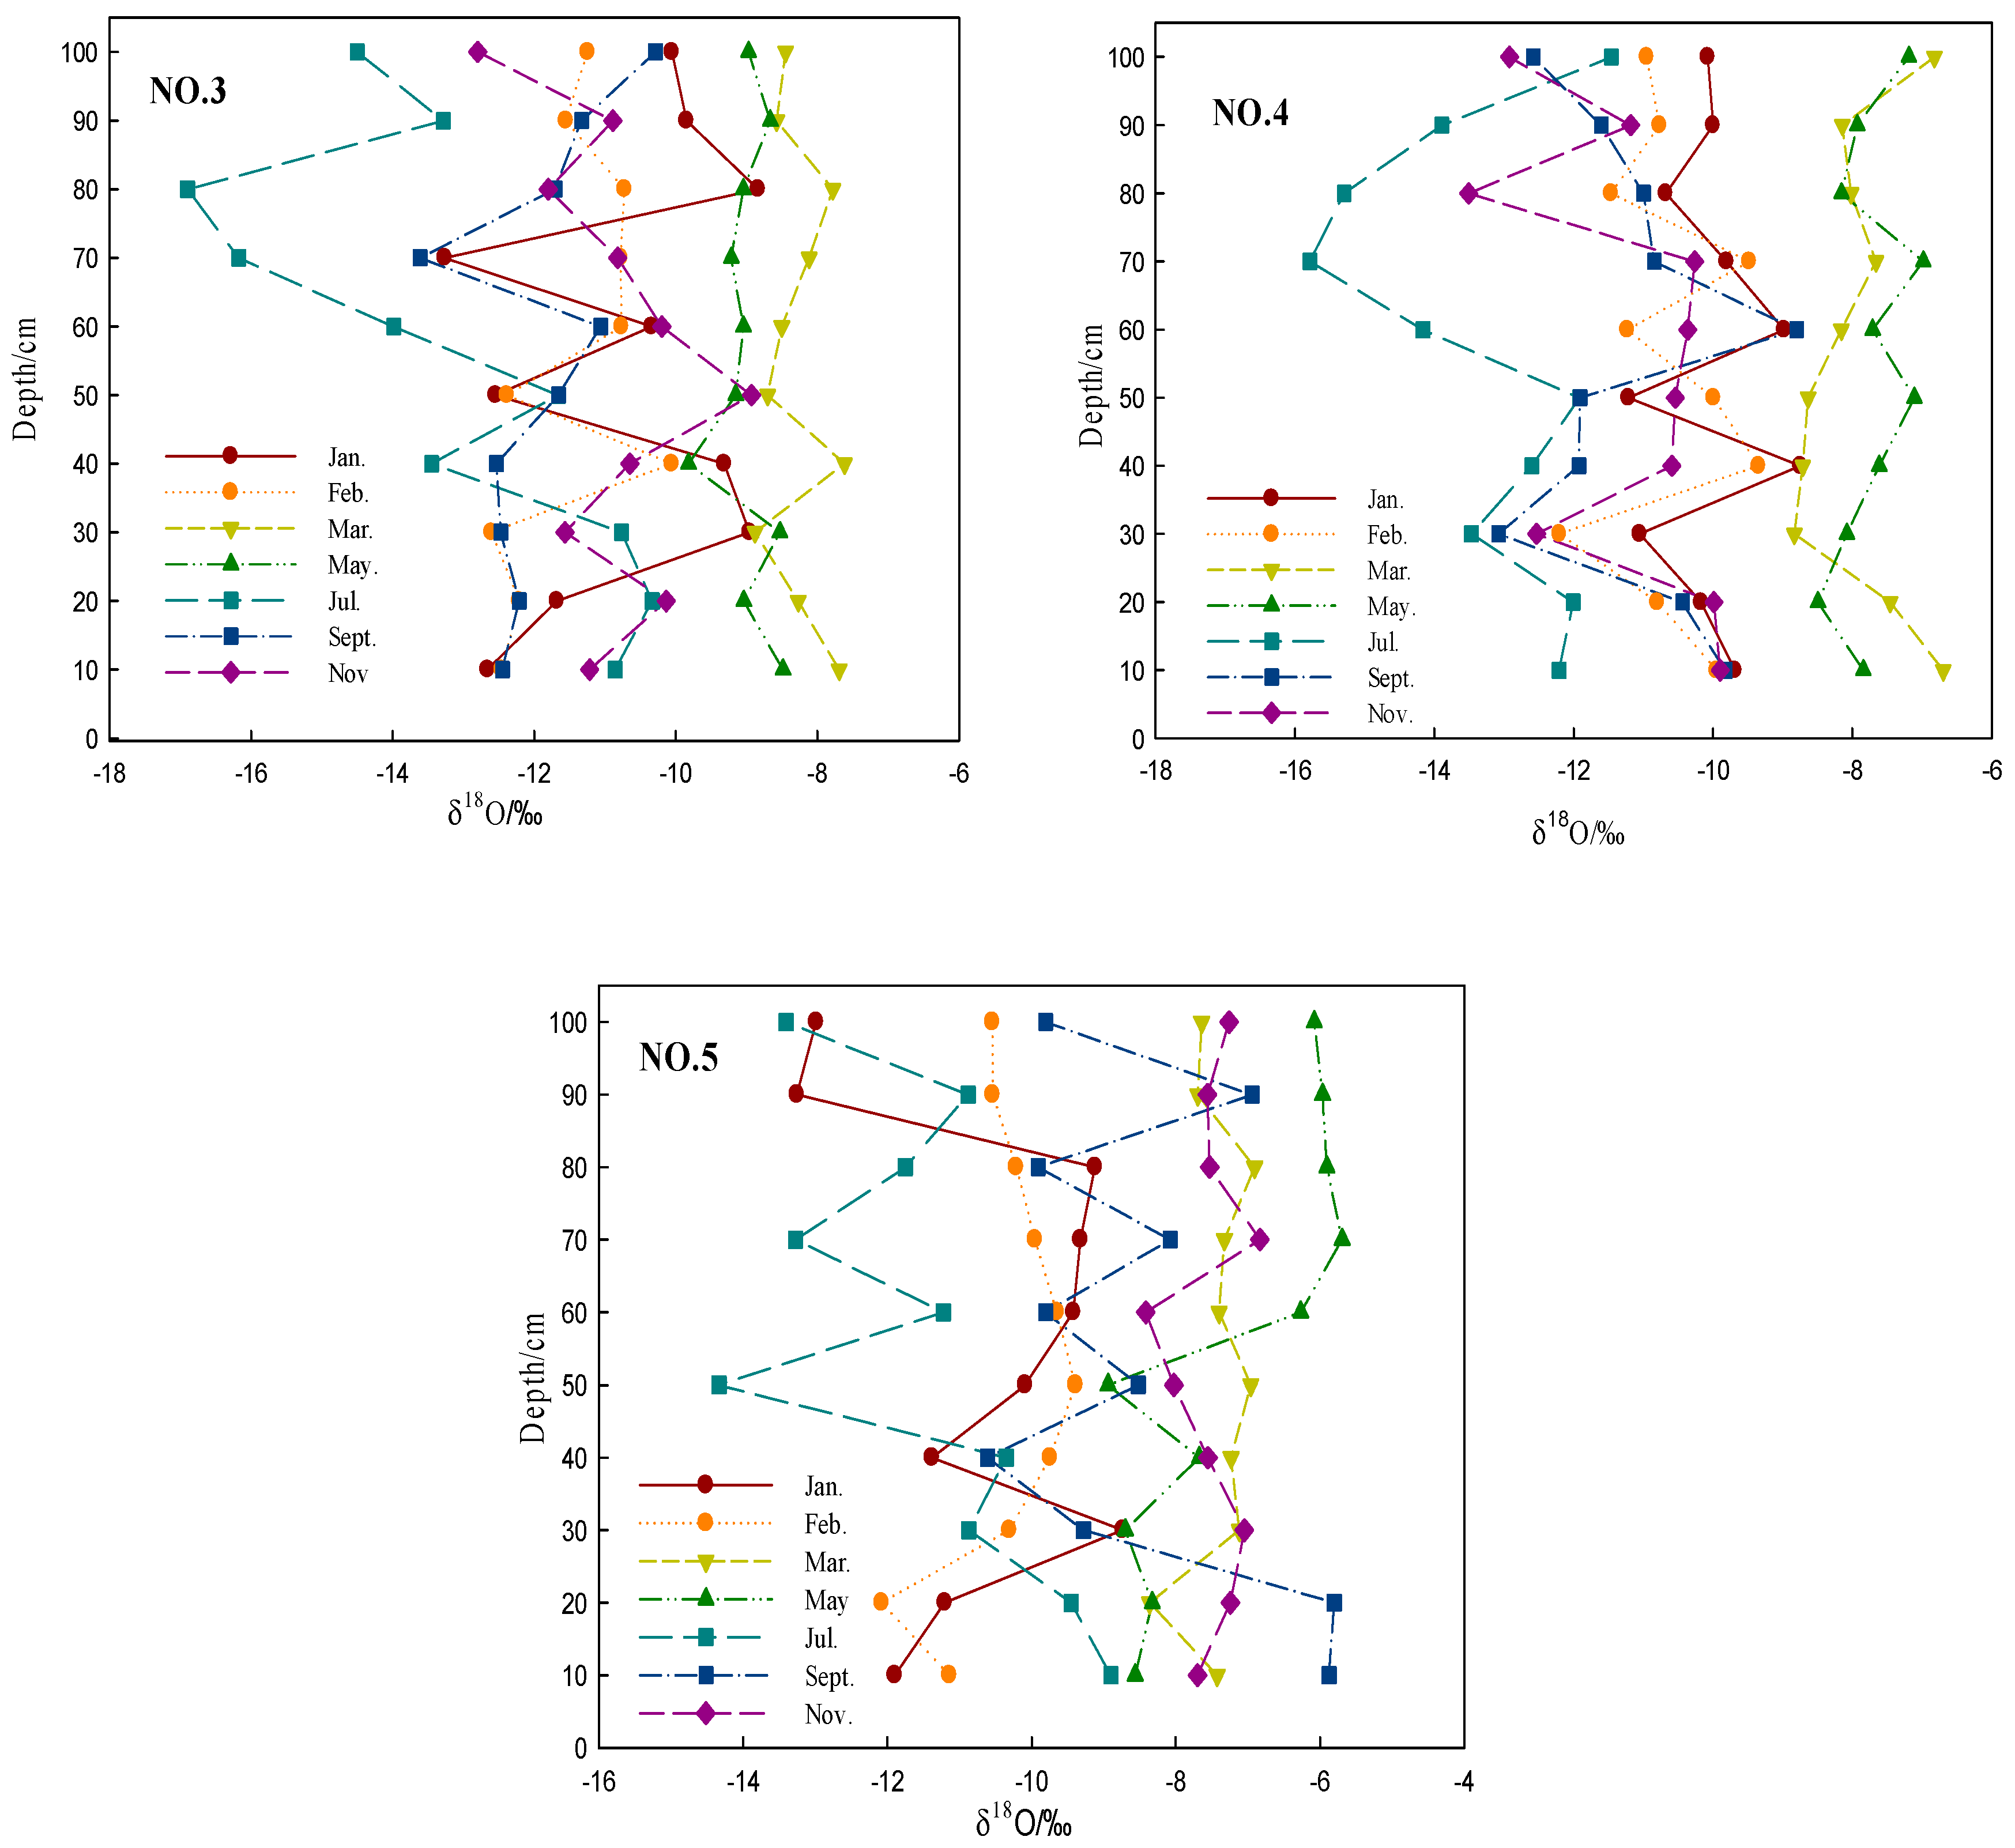
3.5. Water Stable Isotope Characteristics of RMS

As soil water is the flowing medium of material and energy in the soil system, study on soil water transportation is important for the migration of nutrition and pollutants, the generation of runoff, and the recharge of underground water [88]. The recharge sources of soil water include precipitation, groundwater, irrigation water, and small amount of moisture condensation, and soil water dissipation ways mainly include evaporation [89], transpiration [90], water drainage, and runoff. By analyzing δD and δ18O of soil water, we can understand soil water’s evapotranspiration [91], transit mechanism [20], residence time [92], transference, and transition with groundwater [93]. In addition, variation of d-excess in soil water is another research focus which can be used to reflect the process of infiltration and evaporation [94]. Natural variations in stable isotopic compositions of soil waters have been used to investigate recharge (i.e., infiltration and percolation) mechanisms and to estimate transit times of soil waters based on statistical models [95,96,97,98,99,100,101,102,103,104,105,106,107]. δD, δ18O and d-excess of groundwater also change temporally and spatially according to variations of precipitation, groundwater, river, and soil water [108].
As the difference of δD and δ18O among different water bodies can be used to trace the interaction between them, stable isotope technique has been widely applied to water cycle research.
1. General characteristics
Based on isotopic data of 300 soil samples and a simple linear regression method, we gained the regression equations for the three different land types as follows:
  • Farmland: δD = 6.18δ (± 0.02) δ18O − 8.8(± 0.16) (R2 = 0.86, N = 180),
  • Forest land: δD = 6.79 (± 0.02) δ18O − 2.55(± 0.11) (R2 = 0.94, N = 60),
  • Waste land: δD = 5.94 (± 0.02) δ18O − 13.37(± 0.21) (R2 = 0.87, N = 60).
The overall relationship between δD and δ18O of soil water is δD = 6.24δ18O − 8.58 (R2 = 0.85, n = 300) for the three different land use types. The values of δD of soil water ranged from −117.88‰ to −32.51‰, with the mean value of −71.04‰ and standard deviation of 0.20‰; the values of δ18O ranged from −16.90‰ to −4.53‰, with the mean value of −10‰ and the standard deviation of 0.19‰. The mean value of δD and δ18O of soil water was lower than that of precipitation (−50.2‰ and −8.01‰, respectively), suggesting that soil water received more supply from precipitation and also had other sources. In addition, the standard deviation was smaller in soil water than in precipitation, suggesting that δD and δ18O of soil water fluctuate more narrowly than that in precipitation caused by the mixture of soil water and precipitation in different periods during infiltration.
2. Profile characteristics of soil water δD and δ18O
The values of δD and δ18O of soil water changed with depth affected by infiltration, evaporation, soil texture, and soil moisture content, consequently, the soil water isotope features can be used to quantify these effects [109]. As shown in Figure 7, the values of δD and δ18O decrease with depth in general. The great fluctuation is seen in the topsoil (10–30 cm), reflecting the isotopic fractionation caused by soil evaporation. The values of δD and δ18O decreased with depth above 70 cm and remained stable below 70 cm depth, with exceptions possibly because of sampling representativeness or errors. The mean values of δD and δ18O of deep soil water are close to that of groundwater (−49.53‰, −8.37‰, respectively), indicating (i) the deep soil water actively exchanged with groundwater and (ii) precipitation infiltrated into soil mainly in the form of “piston water” and consequently only part of old water can be replaced by new water.
3. Variations of δD and δ18O of soil water with time and land use
From Figure 7, we can see that δD and δ18O of soil water in forest land (No. 3) decreased with depth in months of January, March, May. and November. During these months, heavy hydrogen and oxygen enriched in topsoil because of isotopic fractionation caused by strong evaporation and less rainfall, and deep soil had difficulty gaining water supply from precipitation. It should be noted that the topsoil (0–10 cm) of crop land reached their positive peak in March, while forest land soil was different because the forest land has a strong water conservation function which can still accumulate moisture even in the dry season. May is a transition period from dry to wet seasons, and after soil experienced several month’s drought, soil moisture content remained at a low level. The rainy season started from July when large amount of rainfall infiltrated and pushed old water downward into deeper soil. This undoubtedly narrowed the difference in δD and δ18O between topsoil and deep soil layers. Under the huge influence of precipitation in August and September, the values of δD and δ18O in forest soil profile increased with depth.
The values of δD and δ18O of soil water in waste land (No. 4) decreased with depth firstly in topsoil, and then they increased and finally remained in a steady state in deep soil layers. This may be attributed to the following several reasons: first, the soil texture of waste land was loose and had a higher degree of porosity making moisture remain in the topsoil. This means that the closer to the soil surface, the more affected by evaporation and external disturber factors. Considering this, the values of δD and δ18O decreased from 0 to 40 cm. Apart from that, piston water pushed precipitation and surface soil water downward, and this part of soil water can substitute some old soil water and the percentage of this mixture soil water increased with depth. However, in the shallow root zoon of waste land, the water-resisting layer was formed by interlocks, which prevented the downward movement of the mixture water. Groundwater remained in a stable state all year round because it is slightly affected by external factors. All these factors collectively resulted in the above δD and δ18O soil profiles.
For the whole research sampling period, variations in cultivated land (No. 1, 2, and 5) are obvious, especially in the topsoil (0–10 cm). The standard deviation of farmland reached 0.19‰, larger than the values in forest land and waste land (0.17‰ and 0.16‰, respectively). This may be because that the cultivated land suffered more human activities. The values of δD and δ18O reached a positive peak in March when wheat entered the period of seedling establishment. At that time, water demand level was high, and rainfall was small, making soil moisture reach its negative peak and δD and δ18O reach their maximum value. This also reflects the negative correlation between soil water content and values of δD and δ18O. May is the postulation period of wheat. Although the amount of rainfall was larger than in March and April, precipitation frequency (only four times) and secondary precipitation (about 6 mm) are both small, which made infiltrated water only reach the depth of 10 cm. As a result, high values of δD and δ18O are seen in May. Rainfall reached 32.8 cm in July, at that time, the movement of soil water was in the form of infiltration, whereas the evaporation effect was weak. This made the values of δD and δ18O in July lower than in the former periods, this trend was more obvious in the top 40 cm of soil. A converse trend was found below 40 cm, indicating the infiltration effect plays an important role above 40 cm where new water pushes old water downward. Owning to the drop of rainfall in September, the evaporation effect was obvious again in the topsoil, which made the values of δD and δ18O decrease within the soil depth of 0–40 cm. The values increased to be a fixed value and remained stable below 40 cm depth, suggesting that the 40 cm depth was the depth that evaporation can affect. Wheat was in seedling stage from November to February of next year, during which time crops need only a small amount of water. Besides, although rainfall was small at that time, evaporation was weak caused by low radiation. Consequently, soil moisture was still high for the whole profile in general, with low values of δD and δ18O owing to the weakness of the isotopic fractionation effect.
The reclamation of mine soils with forest and crop (wheat) improved surface soil bulk density [110] and enhanced water infiltration capacity and soil water mixing from the top with precipitation source and from the bottom (below 70 cm deep) with groundwater source. The enhancement of soil moisture mixing from groundwater was stronger by forest than crop. This finding is consistent with the reclamation of mine soils with forest or crop improved water-stable aggregates [110,111]. Therefore, establishment of forest and crops should be encouraged in the RMS.

3.6. Soil Water Sources of RMS Traced by Water Stable Isotope Analysis

Based on water stable isotope analysis, we found that the topsoil (0–30 cm for crop and 0–40 cm for forest) of RMS was mainly influenced by precipitation through infiltration, the deep soil water (below 70 cm deep unsaturated zoon) was mainly supplied from groundwater (saturated zone) by capillary fringe, and the soil water at the depth between 30/40 and 70 cm was from mixing sources of precipitation, groundwater, and river water through pant root water absorbing and groundwater upshifting. The soil water sources of soil profile changed along the seasonal precipitation, evapotranspiration, and plant (crop or forest) growing season.

4. Conclusions

Based on analyses of δD and δ18O of soil water profile and precipitation, WSP, groundwater, and in a mining collapse area with different land uses, we draw conclusions as follows:
  • The values of slope and intercept of LWML for the study area are higher than GMWL owing to the study area belonging to the humid monsoon climate zone, and the D and 18O of precipitation showed high seasonal variation with lower values in summer and higher values in winter. The values of δD and δ18O of the surface water (river and WSP) are higher and their seasonal fluctuations are weaker and about a month lag compared to precipitation. The δD and δ18O of groundwater have very weak seasonal variation and their values are lower than that of precipitation and surface waters owing to groundwater containing former precipitation and soil water which have lower values of δD and δ18O. The values of δD and δ18O of surface water soil waters and groundwater deviated from LMWL to some extent, with changing range from 5% to 30%.
  • The values of δD and δ18O of RMS for the whole profile are −71.04‰ and −10‰, respectively, which are lower than that of precipitation. The values of δD and δ18O decrease with depth in general and had obvious seasonal variations. The great fluctuation is seen in the topsoil (0–30/40 cm) owing to strong isotopic fractionation caused by soil evapotranspiration, and decreased at depth (30/40–70 cm) and remained in a steady state in deep soil layers (below 70 cm deep). The reclamation of mine soils with forest and crop enhanced water infiltration capacity and soil water mixing strength from topsoil with precipitation and from the bottom with groundwater. Therefore, establishment of forest and crops should be encouraged in the RMS.
  • The main source of topsoil (0–30 cm for crop and 0–40 cm for forest) of RMS is precipitation through infiltration, the main supply for deep soil water (below 70 cm deep) is groundwater, and the soil water for the middle deep soil layers (30/40–70 cm) are from mixing sources of precipitation, groundwater, and river water through plant root water absorbtion and groundwater upshifting.

Supplementary Materials

The following are available online at https://www.mdpi.com/2073-4441/12/1/274/s1, Supplementary Part 1: Characteristics of δD and δ18O of Precipitation, Surface Waters (Rivers, Lakes and WSP) and Groundwater (Well Water), including Tables S1–S2; Supplementary Part 2: Raw Data for Water Content of RMS, including Tables S4–S8; and Supplementary Part 3: Raw Data for δ18O profile characteristics of RMS soil water, including Tables S9–S13.

Author Contributions

Conceptualization, B.C.; Data curation, M.G.; Formal analysis, M.G. and B.C.; Funding acquisition, B.C.; Investigation, M.G.; Methodology, B.C. and M.G.; Project administration, B.C.; Resources, B.C.; Software, M.G.; Supervision, B.C.; Validation, M.G. and B.C.; Visualization, M.G. and B.C.; Writing—original draft, M.G.; Writing—review and editing, B.C. All authors have read and agree to the published version of the manuscript.

Funding

This research was funded by the National Key R&D Program of China (2018YFA0606001, 2017YFA0604301, 2017YFA0604302), a project funded by the National Natural Science Foundation of China (41771114) and an international partnership program of Chinese Academy of Sciences (Grant #131A11KYSB20170025).

Acknowledgments

We thank Junfeng Qu (School of Environment Science and Spatial Informatics, China University of Mining and Technology) for help of data collection and analysis and discussion on the draft.

Conflicts of Interest

The authors declare no conflict of interest. The funders had no role in the design of the study; in the collection, analyses, or interpretation of data; in the writing of the manuscript, or in the decision to publish the results.

References

  1. Lechner, A.M.; Baumgartl, T.; Matthew, P.; Glenn, V. The impact of underground longwall mining on prime agricultural land: A review and research agenda. Land Degrad. Dev. 2016, 27, 1650–1663. [Google Scholar] [CrossRef]
  2. Bar-Matthews, M.; Ayalon, A.; Kaufman, A.; Wasserburg, G.J. The Eastern Mediterranean paleoclimate as a reflection of regional events: Soreq cave, Israel. Earth Planet. Sci. Lett. 1999, 166, 85–95. [Google Scholar] [CrossRef]
  3. Rozanski, K.; Araguás-Araguás, L.; Gonfiantini, R. Isotopic patterns in modern global precipitation. Clim. Chang. Cont. Isot. Rec. 1993, 78, 1–36. [Google Scholar]
  4. Zhenqi, H. Principle and method of soil profile reconstruction for coal mine land reclamation. J. China Coal Soc. 1997, 22, 617–622. [Google Scholar]
  5. Mai, M.; Zhao, Y.; Gong, B.; Gan, X.; Guo, Q.; Xu, H. Soil moisture variation in high groundwater level coal mining subsidence in Dongtan Coal Mine. China Coal 2011, 37, 49–52. [Google Scholar]
  6. Song, X.-Z.; Zhao, C.-X.; Wang, X.-L.; Li, J. Study of nitrate leaching and nitrogen fate under intensive vegetable production pattern in northern China. Comptes Rendus Biol. 2009, 332, 385–392. [Google Scholar] [CrossRef]
  7. Xinju, L.; Zhenqi, H.; Jing, L.; Ning, L.; Wenwen, Z. Research progress of reclaimed soil quality in mining subsidence area. Trans. Chin. Soc. Agric. Eng. 2007, 2007. [Google Scholar] [CrossRef]
  8. Palumbo, A.V.; Mccarthy, J.F.; Amonette, J.E.; Fisher, L.S.; Wullschleger, S.D.; Daniels, W.L. Prospects for enhancing carbon sequestration and reclamation of degraded lands with fossil-fuel combustion by-products. Adv. Environ. Res. 2004, 8, 425–438. [Google Scholar] [CrossRef]
  9. Sencindiver, J.C.; Ammons, J.T. 23. Minesoil genesis and classification. In Reclamation of Drastically Disturbed Lands; American Society of Agronomy: Madison, WI, USA, 2000; pp. 595–613. [Google Scholar]
  10. Indorante, S.J.; Jansen, I.J.; Boast, C.W. Surface mining and reclamation: Initial changes in soil character. J. Soil Water Conserv. 1981, 36, 347–351. [Google Scholar]
  11. Thurman, N.C.; Sencindiver, J.C. Properties, classification, and interpretations of minesoils at two sites in West Virginia. Soil Sci. Soc. Am. J. 1986, 50, 181–185. [Google Scholar] [CrossRef]
  12. Dunker, R.E.; Barnhisel, R.I. 13. Cropland reclamation. In Reclamation of Drastically Disturbed Lands; American Society of Agronomy: Madison, WI, USA, 2000; pp. 323–369. [Google Scholar]
  13. Shukla, M.K.; Lal, R.; Ebinger, M. Soil quality indicators for reclaimed minesoils in southeastern Ohio. Soil Sci. 2004, 169, 133–142. [Google Scholar] [CrossRef]
  14. Yi, Y.; Brock, B.E.; Falcone, M.D.; Wolfe, B.B.; Edwards, T.W. A coupled isotope tracer method to characterize input water to lakes. J. Hydrol. 2008, 350, 1–13. [Google Scholar] [CrossRef]
  15. Gammons, C.H.; Poulson, S.R.; Pellicori, D.A.; Reed, P.J.; Roesler, A.J.; Petrescu, E.M. The hydrogen and oxygen isotopic composition of precipitation, evaporated mine water, and river water in Montana, USA. J. Hydrol. 2006, 328, 319–330. [Google Scholar] [CrossRef]
  16. Dutton, A.; Wilkinson, B.H.; Welker, J.M.; Bowen, G.J.; Lohmann, K.C. Spatial distribution and seasonal variation in 18O/16O of modern precipitation and river water across the conterminous USA. Hydrol. Process. Int. J. 2005, 19, 4121–4146. [Google Scholar] [CrossRef] [Green Version]
  17. Gat, J.R.; Gonfiantini, R. Stable Isotope Hydrology. Deuterium and Oxygen-18 in the Water Cycle; International Atomic Energy Agency: Vienna, Austria, 1981. [Google Scholar]
  18. Fekete, B.M.; Gibson, J.J.; Aggarwal, P.; Vörösmarty, C.J. Application of isotope tracers in continental scale hydrological modeling. J. Hydrol. 2006, 330, 444–456. [Google Scholar] [CrossRef]
  19. Xu, Y.; Yan, B.; Luan, Z.; Zhu, H.; Wang, L. Application of stable isotope tracing technologies in identification of transformation among waters in Sanjiang Plain, Northeast China. Chin. Geogr. Sci. 2013, 23, 435–444. [Google Scholar] [CrossRef] [Green Version]
  20. Li, F.; Song, X.; Tang, C.; Liu, C.; Yu, J.; Zhang, W. Tracing infiltration and recharge using stable isotope in Taihang Mt., North China. Environ. Geol. 2007, 53, 687–696. [Google Scholar] [CrossRef]
  21. Nakayama, T.; Taniguchi, M.; Shimada, J. Characteristics of stable isotope ratios in precipitation and groundwater in Lake Biwa basin, Japan. Jpn. J. Limnol. (Jpn.) 2000, 61, 119–128. [Google Scholar] [CrossRef] [Green Version]
  22. Cui, B.-L.; Li, X.-Y. Stable isotopes reveal sources of precipitation in the Qinghai Lake Basin of the northeastern Tibetan Plateau. Sci. Total Environ. 2015, 527, 26–37. [Google Scholar] [CrossRef]
  23. Araguás-Araguás, L.; Froehlich, K.; Rozanski, K. Stable isotope composition of precipitation over southeast Asia. J. Geophys. Res. Atmos. 1998, 103, 28721–28742. [Google Scholar] [CrossRef]
  24. Lu, B.; Sun, T.; Wang, C.; Dai, S.; Kuang, J.; Wang, J. Temporal and spatial variations of δ18O along the main stem of Yangtze River, China. In Monitoring Isotopes in Rivers: Creation of the Global Network of Isotopes in Rivers (GNIR); International Atomic Energy Agency: Vienna, Austria, 2012; pp. 211–220. [Google Scholar]
  25. Ding, T.; Wan, D.; Wang, C.; Zhang, F. Silicon isotope compositions of dissolved silicon and suspended matter in the Yangtze River, China. Geochim. Cosmochim. Acta 2004, 68, 205–216. [Google Scholar] [CrossRef]
  26. Deng, W.; Wei, G.; Li, X.; Yu, K.; Zhao, J.; Sun, W.; Liu, Y. Paleoprecipitation record from coral Sr/Ca and δ18O during the mid Holocene in the northern South China Sea. Holocene 2009, 19, 811–821. [Google Scholar] [CrossRef]
  27. Gat, J.R.; Bowser, C.J.; Kendall, C. The contribution of evaporation from the Great Lakes to the continental atmosphere: Estimate based on stable isotope data. Geophys. Res. Lett. 1994, 21, 557–560. [Google Scholar] [CrossRef]
  28. Froehlich, K.; Kralik, M.; Papesch, W.; Rank, D.; Scheifinger, H.; Stichler, W. Deuterium excess in precipitation of Alpine regions–moisture recycling. Isot. Environ. Health Stud. 2008, 44, 61–70. [Google Scholar] [CrossRef]
  29. Buttle, J.M. Isotope hydrograph separations and rapid delivery of pre-event water from drainage basins. Prog. Phys. Geogr. 1994, 18, 16–41. [Google Scholar] [CrossRef]
  30. Cartwright, I.; Weaver, T.R.; Fulton, S.; Nichol, C.; Reid, M.; Cheng, X. Hydrogeochemical and isotopic constraints on the origins of dryland salinity, Murray Basin, Victoria, Australia. Appl. Geochem. 2004, 19, 1233–1254. [Google Scholar] [CrossRef]
  31. Farber, E.; Vengosh, A.; Gavrieli, I.; Marie, A.; Bullen, T.D.; Mayer, B.; Holtzman, R.; Segal, M.; Shavit, U. The origin and mechanisms of salinization of the Lower Jordan River. Geochim. Cosmochim. Acta 2004, 68, 1989–2006. [Google Scholar] [CrossRef]
  32. Yuan, F.; Miyamoto, S. Characteristics of oxygen-18 and deuterium composition in waters from the Pecos River in American Southwest. Chem. Geol. 2008, 255, 220–230. [Google Scholar] [CrossRef] [Green Version]
  33. Harris, D.M.; McDonnell, J.J.; Rodhe, A. Hydrograph separation using continuous open system isotope mixing. Water Resour. Res. 1995, 31, 157–171. [Google Scholar] [CrossRef]
  34. Hooper, R.P.; Shoemaker, C.A. A comparison of chemical and isotopic hydrograph separation. Water Resour. Res. 1986, 22, 1444–1454. [Google Scholar] [CrossRef]
  35. Karim, A.; Veizer, J. Water balance of the Indus River Basin and moisture source in the Karakoram and western Himalayas: Implications from hydrogen and oxygen isotopes in river water. J. Geophys. Res. Atmos. 2002, 107, ACH 9-1–ACH 9-12. [Google Scholar] [CrossRef]
  36. Machavaram, M.V.; Whittemore, D.O.; Conrad, M.E.; Miller, N.L. Precipitation induced stream flow: An event based chemical and isotopic study of a small stream in the Great Plains region of the USA. J. Hydrol. 2006, 330, 470–480. [Google Scholar] [CrossRef]
  37. McKenna, S.A.; Ingraham, N.L.; Jacobson, R.L.; Cochran, G.F. A stable isotope study of bank storage mechanisms in the Truckee river basin. J. Hydrol. 1992, 134, 203–219. [Google Scholar] [CrossRef]
  38. Merlivat, L.; Jouzel, J. Global climatic interpretation of the deuterium-oxygen 18 relationship for precipitation. J. Geophys. Res. Ocean. 1979, 84, 5029–5033. [Google Scholar] [CrossRef]
  39. O’driscoll, M.A.; DeWalle, D.R.; McGuire, K.J.; Gburek, W.J. Seasonal 18O variations and groundwater recharge for three landscape types in central Pennsylvania, USA. J. Hydrol. 2005, 303, 108–124. [Google Scholar] [CrossRef]
  40. Sklash, M.G.; Farvolden, R.N. The role of groundwater in storm runoff. J. Hydrol. 1979, 43, 45–65. [Google Scholar] [CrossRef]
  41. Winston, W.; Criss, R. Oxygen isotope and geochemical variations in the Missouri River. Environ. Geol. 2003, 43, 546–556. [Google Scholar] [CrossRef]
  42. Turner, J.V.; Macpherson, D.K.; Stokes, R.A. The mechanisms of catchment flow processes using natural variations in deuterium and oxygen-18. J. Hydrol. 1987, 94, 143–162. [Google Scholar] [CrossRef]
  43. International Atomic Energy Agency (IAEA). 2014 IAEA/GNIP Precipitation Sampling Guide; IAEA: Vienna, Austria, 2014. [Google Scholar]
  44. Orlowski, N.; Frede, H.-G.; Brüggemann, N.; Breuer, L. Validation and application of a cryogenic vacuum extraction system for soil and plant water extraction for isotope analysis. J. Sens. Sens. Syst. 2013, 2, 179–193. [Google Scholar] [CrossRef] [Green Version]
  45. Boschetti, T.; Cifuentes, J.; Iacumin, P.; Selmo, E. Local meteoric water line of Northern Chile (18S–30S): An application of error-in-variables regression to the oxygen and hydrogen stable isotope ratio of precipitation. Water 2019, 11, 791. [Google Scholar] [CrossRef] [Green Version]
  46. Craig, H. Isotopic variations in meteoric waters. Science 1961, 133, 1702–1703. [Google Scholar] [CrossRef] [PubMed]
  47. Gourcy, L.L.; Groening, M.; Aggarwal, P.K. Stable oxygen and hydrogen isotopes in precipitation. In Isotopes in the Water Cycle: Past, Present and Future of Developing Science; Aggarwal, P.K., Gat, J.R., Froehlich, K.F.O., Eds.; Springer: Dordrecht, The Netherlands, 2005; pp. 39–51. [Google Scholar] [CrossRef]
  48. Dansgaard, W. Stable isotopes in precipitation. Tellus 1964, 16, 436–468. [Google Scholar] [CrossRef]
  49. Gat, J.R.; Klein, B.; Kushnir, Y.; Roether, W.; Wernli, H.; Yam, R.; Shemesh, A. Isotope composition of air moisture over the Mediterranean Sea: An index of the air-sea interaction pattern. Tellus B Chem. Phys. Meteorol. 2011, 55, 953–965. [Google Scholar]
  50. Vodila, G.; Palcsu, L.; Futó, I.; Szántó, Z. A 9-year record of stable isotope ratios of precipitation in Eastern Hungary: Implications on isotope hydrology and regional palaeoclimatology. J. Hydrol. 2011, 400, 144–153. [Google Scholar] [CrossRef]
  51. Stumpp, C.; Klaus, J.; Stichler, W. Analysis of long-term stable isotopic composition in German precipitation. J. Hydrol. 2014, 517, 351–361. [Google Scholar]
  52. Noone, D.; Simmonds, I. Associations between δ18O of water and climate parameters in a simulation of atmospheric circulation for 1979–95. J. Clim. 2002, 15, 3150–3169. [Google Scholar] [CrossRef]
  53. Sjostrom, D.J.; Welker, J.M. The influence of air mass source on the seasonal isotopic composition of precipitation, eastern USA. J. Geochem. Explor. 2009, 102, 103–112. [Google Scholar] [CrossRef]
  54. Vachon, R.W.; Welker, J.M.; White, J.W.C.; Vaughn, B.H. Moisture source temperatures and precipitation δ18O-temperature relationships across the United States. Water Resour. Res. 2010, 46. [Google Scholar] [CrossRef]
  55. Barras, V.J.; Simmonds, I. Synoptic controls upon δ18O in southern Tasmanian precipitation. Geophys. Res. Lett. 2008, 35. [Google Scholar] [CrossRef]
  56. Scholl, M.A.; Shanley, J.B.; Zegarra, J.P.; Coplen, T.B. The stable isotope amount effect: New insights from NEXRAD echo tops, Luquillo Mountains, Puerto Rico. Water Resour. Res. 2009, 45. [Google Scholar] [CrossRef] [Green Version]
  57. Baldini, L.M.; McDermott, F.; Baldini, J.U.; Fischer, M.J.; Möllhoff, M. An investigation of the controls on Irish precipitation δ18O values on monthly and event timescales. Clim. Dyn. 2010, 35, 977–993. [Google Scholar] [CrossRef]
  58. Lykoudis, S.P.; Kostopoulou, E.; Argiriou, A.A. Stable isotopic signature of precipitation under various synoptic classifications. Phys. Chem. Earth Parts A/B/C 2010, 35, 530–535. [Google Scholar] [CrossRef]
  59. Ulrich, E.; Lelong, N.; Lanier, M.; Schneider, A. Regional differences in the relation between monthly precipitation and bulk concentration in France (Renecofor). Water Air Soil Pollut. 1998, 102, 239–257. [Google Scholar] [CrossRef]
  60. Balestrini, R.; Galli, L.; Tartari, G. Wet and dry atmospheric deposition at prealpine and alpine sites in northern Italy. Atmos. Environ. 2000, 34, 1455–1470. [Google Scholar] [CrossRef]
  61. Celle-Jeanton, H.; Travi, Y.; Loÿe-Pilot, M.-D.; Huneau, F.; Bertrand, G. Rainwater chemistry at a Mediterranean inland station (Avignon, France): Local contribution versus long-range supply. Atmos. Res. 2009, 91, 118–126. [Google Scholar] [CrossRef]
  62. Prathibha, P.; Kothai, P.; Saradhi, I.V.; Pandit, G.G.; Puranik, V.D. Chemical characterization of precipitation at a coastal site in Trombay, Mumbai, India. Environ. Monit. Assess. 2010, 168, 45–53. [Google Scholar] [CrossRef]
  63. Minggang, C.; Yipu, H.; Min, C.; Guangshan, L.; Deqiu, J.; Xihuang, Z. A study on hydrogen and oxygen isotopes composition of precipitation in Xiamen. J. Oceanogr. Taiwan Strait 2000, 19, 446–453. [Google Scholar]
  64. Zheng, S.H.; Hou, F.G.; Ni, B.L. The studies of hydrogen and oxygen stable isotopes in atmospheric precipitation in China. Chin. Sci. Bull. 1983, 13, 801–806. [Google Scholar]
  65. Chen, T.T.; Chen, H.; Han, L.; Xing, X.; Fu, Y.Y. Stable isotopes characters of soil water movement in Shijiazhuang City. Huan Jing Ke Xue 2015, 36, 3641–3648. [Google Scholar]
  66. Wang, T.; Zhang, J.R.; Liu, X.; Yao, L. Variations of stable isotopes in precipitation and water vapor sources in Nanjing area. J. China Hydrol. 2013, 33, 25–31. [Google Scholar]
  67. Chen, Y.T.; Du, W.; Chen, J.; Xu, L. Composition of hydrogen and oxygen isotopes of precipiation and source apportionment of water vapor in Xiamen area. Acta Sci. Circumstantiae 2016, 36, 667–674. [Google Scholar]
  68. Müller, M.H.; Alaoui, A.; Kuells, C.; Leistert, H.; Meusburger, K.; Stumpp, C.; Weiler, M.; Alewell, C. Tracking water pathways in steep hillslopes by δ18O depth profiles of soil water. J. Hydrol. 2014, 519, 340–352. [Google Scholar] [CrossRef]
  69. Hughes, C.E.; Crawford, J. A new precipitation weighted method for determining the meteoric water line for hydrological applications demonstrated using Australian and global GNIP data. J. Hydrol. 2012, 464, 344–351. [Google Scholar] [CrossRef]
  70. Celle-Jeanton, H.; Gonfiantini, R.; Travi, Y.; Sol, B. Oxygen-18 variations of rainwater during precipitation: Application of the Rayleigh model to selected rainfalls in Southern France. J. Hydrol. 2004, 289, 165–177. [Google Scholar] [CrossRef]
  71. Matheney, R.K.; Gerla, P.J. Environmental isotopic evidence for the origins of ground and surface water in a prairie discharge wetland. Wetlands 1996, 16, 109–120. [Google Scholar] [CrossRef]
  72. Gat, J.R. Oxygen and hydrogen isotopes in the hydrologic cycle. Annu. Rev. Earth Planet. Sci. 1996, 24, 225–262. [Google Scholar] [CrossRef] [Green Version]
  73. Diefendorf, A.F.; Patterson, W.P. Survey of stable isotope values in Irish surface waters. J. Paleolimnol. 2005, 34, 257–269. [Google Scholar] [CrossRef] [Green Version]
  74. Rietti-Shati, M.; Yam, R.; Karlen, W.; Shemesh, A. Stable isotope composition of tropical high-altitude fresh-waters on Mt. Kenya, Equatorial East Africa. Chem. Geol. 2000, 166, 341–350. [Google Scholar] [CrossRef]
  75. Tian, L.D.; Yao, T.D.; Shen, Y.P.; Yang, M.X.; Ye, B.S.; Numaguti, A.; Tsujimura, M. Study on stable isotope in river water and precipitation in Naqu River basin, Tibetan Plateau. Adv. Water Sci. 2002, 13, 210–213. [Google Scholar]
  76. Gu, W.Z. Experimental research on catchment runoff responses traced by environmental isotopes. Adv. Water Sci. 1992, 4, 246–254. [Google Scholar]
  77. Lachniet, M.S.; Patterson, W.P. Stable isotope values of Costa Rican surface waters. J. Hydrol. 2002, 260, 135–150. [Google Scholar] [CrossRef]
  78. Gonfiantini, R. Environmental isotopes in lake studies. Handb. Environ. Isot. Geochem. Terr. Environ. 1986, 2, 113–168. [Google Scholar]
  79. Li, X. Stable Isotopes in Different Types of Water and Their Significance during the Wet Season in the Urumqi River Basin, Eastern Tianshan Mountains, China. Master’s Thesis, Northwest Normal University, Lanzhou, China, 2013. [Google Scholar]
  80. Zhang, L.; Qin, X.; Liu, J.; Mu, Y.; An, S.; Lu, C. Characters of hydrogen and oxygen stable isotope of different water bodies in Huainan coal mining area. J. Jilin Univ. (Earth Sci. Ed.) 2015, 45, 1502–1514. [Google Scholar]
  81. Zhao, W.; Ma, J.; Gu, C.; Qi, S.; Zhu, G.; He, J. Distribution of isotopes and chemicals in precipitation in Shule River Basin, northwestern China: An implication for water cycle and groundwater recharge. J. Arid Land 2016, 8, 973–985. [Google Scholar] [CrossRef] [Green Version]
  82. Wassenaar, L.I.; Athanasopoulos, P.; Hendry, M.J. Isotope hydrology of precipitation, surface and ground waters in the Okanagan Valley, British Columbia, Canada. J. Hydrol. 2011, 411, 37–48. [Google Scholar] [CrossRef]
  83. Kendall, C.; Coplen, T.B. Distribution of oxygen-18 and deuterium in river waters across the United States. Hydrol. Process. 2001, 15, 1363–1393. [Google Scholar] [CrossRef]
  84. Halder, J.; Decrouy, L.; Vennemann, T.W. Mixing of Rhône River water in Lake Geneva (Switzerland–France) inferred from stable hydrogen and oxygen isotope profiles. J. Hydrol. 2013, 477, 152–164. [Google Scholar] [CrossRef]
  85. Fan, Y.; Chen, Y.; Li, X.; Li, W.; Li, Q. Characteristics of water isotopes and ice-snowmelt quantification in the Tizinafu River, north Kunlun Mountains, Central Asia. Quat. Int. 2015, 380, 116–122. [Google Scholar] [CrossRef]
  86. Wu, H.; Zhang, X.; Li, X. The variations of δ18O and δD in different water bodies of Changsha region, middle-and-low reach of the Xiangjiang River. Sci. Geogr. Sin. 2014, 34, 488–495. [Google Scholar]
  87. Koster, R.D.; Guo, Z.; Yang, R.; Dirmeyer, P.A.; Mitchell, K.; Puma, M.J. On the nature of soil moisture in land surface models. J. Clim. 2009, 22, 4322–4335. [Google Scholar] [CrossRef] [Green Version]
  88. Schmocker-Fackel, P. A Method to Delineate Runoff Processes in a Catchment and Its Implications for Runoff Simulations. Ph.D. Thesis, ETH Zurich, Zurich, Switzerland, 2004. [Google Scholar]
  89. Zhu, L.; Zhang, H.; Gao, X.; Qi, Y.; Xu, X. Seasonal patterns in water uptake for Medicago sativa grown along an elevation gradient with shallow groundwater table in Yanchi county of Ningxia, Northwest China. J. Arid Land 2016, 8, 921–934. [Google Scholar] [CrossRef]
  90. Ma, Y.; Song, X. Using stable isotopes to determine seasonal variations in water uptake of summer maize under different fertilization treatments. Sci. Total Environ. 2016, 550, 471–483. [Google Scholar] [CrossRef] [PubMed]
  91. Hsieh, J.C.; Chadwick, O.A.; Kelly, E.F.; Savin, S.M. Oxygen isotopic composition of soil water: Quantifying evaporation and transpiration. Geoderma 1998, 82, 269–293. [Google Scholar] [CrossRef]
  92. Brenot, A.; Benoît, M.; Carignan, J.; France-Lanord, C. Insights into stable isotope characterization to monitor the signification of soil water sampling for environmental studies dealing with soil water dynamics through the unsaturated zone. Comptes Rendus Geosci. 2015, 347, 317–327. [Google Scholar] [CrossRef]
  93. Deng, W.P.; Yu, X.X.; Jia, G.D.; Li, Y.J.; Liu, Y.J. An analysis of characteristics of hydrogen and oxygen stable isotopes in Jiufeng Mountain areas of Beijing. Adv. Water Sci. 2013, 24, 642–650. [Google Scholar]
  94. Macaigne, P. Stable isotopes, their use in soil hydrology. In Encyclopedia of Agrophysics; Springer: Dordrecht, The Netherlands, 2011; pp. 849–854. [Google Scholar]
  95. Małoszewski, P.; Rauert, W.; Stichler, W.; Herrmann, A. Application of flow models in an alpine catchment area using tritium and deuterium data. J. Hydrol. 1983, 66, 319–330. [Google Scholar] [CrossRef]
  96. Małoszewski, P.; Zuber, A. Determining the turnover time of groundwater systems with the aid of environmental tracers: Models and their applicability. J. Hydrol. 1982, 57, 207–231. [Google Scholar] [CrossRef]
  97. Saxena, R.K. Seasonal variations of oxygen-18 in soil moisture and estimation of recharge in Esker and Moraine formations: Paper presented at the Nordic Hydrological Conference (Nyborg, Denmark, August-1984). Hydrol. Res. 1984, 15, 235–242. [Google Scholar] [CrossRef]
  98. Darling, W.G.; Bath, A.H. A stable isotope study of recharge processes in the English Chalk. J. Hydrol. 1988, 101, 31–46. [Google Scholar] [CrossRef]
  99. Stewart, M.K.; McDonnell, J.J. Modeling base flow soil water residence times from deuterium concentrations. Water Resour. Res. 1991, 27, 2681–2693. [Google Scholar] [CrossRef]
  100. Maloszewski, P.; Moser, H.; Stichler, W.; Trimborn, P. Isotope hydrology investigations in large refuse lysimeters. J. Hydrol. 1995, 167, 149–166. [Google Scholar] [CrossRef]
  101. DeWalle, D.R.; Edwards, P.J.; Swistock, B.R.; Aravena, R.; Drimmie, R.J. Seasonal isotope hydrology of three Appalachian forest catchments. Hydrol. Process. 1997, 11, 1895–1906. [Google Scholar] [CrossRef]
  102. McConville, C.; Kalin, R.M.; Johnston, H.; McNeill, G.W. Evaluation of recharge in a small temperate catchment using natural and applied δ18O profiles in the unsaturated zone. Groundwater 2001, 39, 616–623. [Google Scholar] [CrossRef] [PubMed]
  103. Asano, Y.; Uchida, T.; Ohte, N. Residence times and flow paths of water in steep unchannelled catchments, Tanakami, Japan. J. Hydrol. 2002, 261, 173–192. [Google Scholar] [CrossRef]
  104. McGuire, K.J.; DeWalle, D.R.; Gburek, W.J. Evaluation of mean residence time in subsurface waters using oxygen-18 fluctuations during drought conditions in the mid-Appalachians. J. Hydrol. 2002, 261, 132–149. [Google Scholar] [CrossRef]
  105. Rodgers, P.; Soulsby, C.; Waldron, S. Stable isotope tracers as diagnostic tools in upscaling flow path understanding and residence time estimates in a mountainous mesoscale catchment. Hydrol. Process. Int. J. 2005, 19, 2291–2307. [Google Scholar] [CrossRef]
  106. Kabeya, N.; Katsuyama, M.; Kawasaki, M.; Ohte, N.; Sugimoto, A. Estimation of mean residence times of subsurface waters using seasonal variation in deuterium excess in a small headwater catchment in Japan. Hydrol. Process. Int. J. 2007, 21, 308–322. [Google Scholar] [CrossRef]
  107. Landon, M.K.; Delin, G.N.; Komor, S.C.; Regan, C.P. Relation of pathways and transit times of recharge water to nitrate concentrations using stable isotopes. Groundwater 2000, 38, 381–395. [Google Scholar] [CrossRef] [Green Version]
  108. Zhang, X.P.; Yao, T.D.; Tian, L.D.; Liu, J.M. Stable oxygen isotope in water mediums in Urumqi River basin. Adv. Water Sci. 2003, 14, 56–60. [Google Scholar]
  109. Xu, Q.; Liu, S.; Wan, X.; Jiang, C.; Song, X.; Wang, J. Effects of rainfall on soil moisture and water movement in a subalpine dark coniferous forest in southwestern China. Hydrol. Process. 2012, 26, 3800–3809. [Google Scholar] [CrossRef]
  110. Qu, J.F.; Hou, Y.L.; Ge, M.Y.; Wang, K.; Liu, S.; Zhang, S.L.; Li, G.; Chen, F. Carbon dynamics of reclaimed coal mine soil under agricultural use: A chronosequence study in the dongtan mining area, Shandong Province, China. Sustainability 2017, 9, 629. [Google Scholar] [CrossRef] [Green Version]
  111. Shrestha, R.K.; Lal, R. Land use impacts on physical properties of 28 years old reclaimed mine soils in Ohio. Plant Soil 2008, 306, 249–260. [Google Scholar] [CrossRef]
Figure 1. Locations of the Longdong coal minding area and of sampling plots. (Soil sampling plots are selected from different land cover types: plots No. 1, 2, and 5 are crop land; plot No. 3 is forest land, and plot No. 4 is waste land).
Water 12 00274 g001
Figure 2. Characteristics of δD and δO18 of precipitation, river water, lake water, water from subsidence pits (WSP), and groundwater. Data also shown in Table 1 and Supplementary Tables S1–S3.
Water 12 00274 g002
Figure 3. Variations in d-excess values of precipitation (data also shown in Table 1).
Water 12 00274 g003
Figure 4. Characteristics of δD and δ18O of river water and WSP comparing with LMWL (Data also shown in Table 1 and Supplementary Tables S1 and S2; WSP: water from subsidence pits; LMWL: local meteoric water line).
Water 12 00274 g004
Figure 5. Characteristics of δD and δ18O of groundwater comparing with LMWL (data also shown Supplementary Table S3; LMWL: local meteoric water line).
Water 12 00274 g005
Figure 6. Changes of soil water content of RMS (No. 1, 2, and 5 are cultivated land, No. 3 is forest land, and No. 4 is waste land; raw data with three parallel replicates are also shown in Supplementary Part 2, Tables S4–S8; RMS: reclaimed mine soil).
Water 12 00274 g006aWater 12 00274 g006b
Figure 7. Characteristics of δ18O of soil water profile of different land use types (raw data with three parallel replicates are also shown in Supplementary Part 3, Tables S9–S13; No. 1, 2, and 5 are crop land; No. 3 is forest land, and No. 4 is waste land).
Water 12 00274 g007aWater 12 00274 g007b
Table 1. Seasonal variability of δD, δ18O, and d-excess in precipitation.
DateδD (‰)δ18O (‰)d-Excess (‰)DateδD (‰)δ18O (‰)d-Excess (‰)
7 November 2016−56.46−9.4419.082017.7.15−66.19−10.2215.61
9 November 2016−4.58−3.1720.792017.7.26−52.65−7.184.83
22 November 2016−73.96−11.5418.382017.8.2−92.53−13.0511.87
1 December 2016−42.94−7.0513.432017.8.7−30.32−5.4913.57
21 December 2016−70.37−9.223.42017.8.12−45.73−6.838.9
25 December 2016−31.79−7.2526.222017.8.18−60.05−8.366.83
6 January 2017−49.59−8.7720.592017.8.19−60.07−8.417.17
7 January 2017−52.18−8.7717.982017.8.29−31.36−6.2618.7
29 January 2017−13.33−5.127.452017.8.3−46.53−7.6915
31 January 2017−51.79−8.0712.742017.9.3−76.22−11.2813.99
8 February 2017−47.1−8.3920.032017.9.4−41.95−7.0914.73
9 April 2017−19.11−2.11−2.252017.9.6−86.12−12.1911.41
3 May 2017−3.5−2.4516.132017.9.25−68.17−9.8510.66
5 June 2017−13.95−5.429.282017.9.26−63.37−8.87.06
1 June 2017−26.59−5.2115.132017.9.3−76.62−11.1612.63
23 June 2017−55.9−7.352.922017.10.4−37.46−5.415.82
6 July 2017−68.34−10.5415.962017.10.5−34.57−6.0713.96
7 July 2017−56.52−7.936.942017.10.1−53.46−9.3821.54
13 July 2017−73.1−10.4210.262017.10.11−67.16−9.518.94

