Article

Batch Study of Cadmium Biosorption by Carbon Dioxide Enriched Aphanothece sp. Dried Biomass

by
Awalina Satya
1,2,
Ardiyan Harimawan
1,
Gadis Sri Haryani
2,
Md. Abu Hasan Johir
3,*,
Saravanamuthu Vigneswaran
3,
Huu Hao Ngo
3 and
Tjandra Setiadi
1,4,*
1
Department of Chemical Engineering, Institut Teknologi Bandung, Jl. Ganesa No 10, Bandung 40132, Indonesia
2
Research Center for Limnology, The Indonesian Institute of Sciences- LIPI, Jl. Raya Bogor-Jakarta km 46, Bogor 16911, Indonesia
3
Faculty of Engineering and Information Technology, University of Technology Sydney, P.O. Box 123, Broadway, NSW 2007, Australia
4
Center for Environmental Studies, Institut Teknologi Bandung, Jl. Sangkuriang 42 A, Bandung 40135, Indonesia
*
Authors to whom correspondence should be addressed.
Water 2020, 12(1), 264; https://doi.org/10.3390/w12010264
Submission received: 30 December 2019 / Revised: 15 January 2020 / Accepted: 15 January 2020 / Published: 17 January 2020

Abstract

:
The conventional method for cadmium removal in aqueous solutions (1–100 mg/L) is ineffective and inefficient. Therefore, a batch biosorption reactor using a local freshwater microalga (originating from an urban lake, namely, Situ Rawa Kalong-Depok) as dried biosorbent was tested. Biosorbent made from three kinds of cyanobacterium Aphanothece sp. cultivars (A0, A8, and A15) were used to eliminate cadmium (Cd2+) ions in aqueous solution (1–7 mg/L). The biosorbents were harvested from a photobioreactor system enriched with carbon dioxide gas of 0.04% (atmospheric), 8%, and 15% under continuous light illumination of about 5700–6000 lux for 14 d of cultivation. Produced dried biosorbents had Brunauer–Emmet–Teller (BET) surface area ranges of 0.571–1.846 m2/g. Biosorption of Cd2+ was pH and concentration dependent. Sorption was spontaneous (ΔG = −8.39 to −10.88 kJ/mol), exothermic (ΔH = −41.85 to −49.16 kJ/mol), and decreased randomness (ΔS = −0.102 to −0.126 kJ/mol·K) on the interface between solid and liquid phases when the process was completed. The kinetic sorption data fitted best to the pseudo-second-order model (k2 = 2.79 × 10⁻², 3.96 × 10⁻², and 4.54 × 10⁻² g/mg·min). The dried biosorbents of A0, A8, and A15, after modeling with the Langmuir and Dubinin–Radushkevich isotherm models, indicated that cadmium binding occurred through chemisorption (qmax, D-R = 9.74 × 10⁻⁴, 4.79 × 10⁻³, and 9.12 × 10⁻³ mol/g and mean free energy of 8.45, 11.18, and 11.18 kJ/mol) on the monolayer and homogenous surface (qmax, Langmuir of 12.24, 36.90, and 60.24 mg/g). In addition, the results of SEM, EDX, and FTIR showed that there were at least nine functional groups that interacted with Cd2+ (led to bond formation) after biosorption through cation exchange mechanisms, and morphologically the surfaces changed after biosorption. Biosorbent A15 indicated the best resilient features over three cycles of sorption–desorption using 1 M HCl as the desorbing eluent. These biosorbents can be a potent and eco-friendly material for treating aqueous wastewater.

1. Introduction

Cadmium (Cd) is one of the extreme acute toxic heavy metals and may present in industrial wastewater discharged by industries involved in dyes, electroplating, Ni–Cd batteries, and others. Potential hazards will arise when bioaccumulation of Cd occurs in the aquatic food chain and is transferred into a human as the top consumer. Numerous diseases linked to Cd toxicity include renal dysfunction, nervous system damage, teratogenic symptom, and so forth. Therefore, it is crucial to treat contaminated wastewater before discharging it into the environment to prevent/reduce adverse effects on the receiving environment [1,2,3].
Biosorption is sorption involving biomaterial as a sorbent, which is an alternative and cost-effective process for removing heavy metals ranging from 1–100 mg/L in wastewater [4]. Biosorption using this range (1−100 mg/L) of concentration is still lacking. Among of different sorbents, a recent study using wheat straw biochar and acid-treated biochar made from agricultural solid waste reported adsorption capacities of the cadmium ion (Cd2+) of 30.65 and 74.63 mg/g, respectively [1]. Furthermore, activated carbon derived from teak sawdust hydrochars (prepared through hydrothermal carbonization and activation using K2CO3 or ZnCl2) resulted in maximum sorption capacities of 614, 208, and 182 mg/g of methylene blue, Cd2+, and Cu2+ (concentration range of 50–900 mg/L), respectively [5].
Dried microalgae-based biosorbent is a promising tool for Cd biosorption since there are an abundance of functional groups (carboxyl, hydroxyl, sulphate, phosphate, amides, etc.) on the surface of this biomass with high affinity to metal cations. Some microalgae species have more functional groups that are selective to certain metal cations [6]. Cultivation using a photobioreactor system is a feasible way to obtain an adequate amount of microalgae biomass as biosorbent as well as a carbon dioxide (CO2) capture system. Cyanobacteria is one excellent example of microalgae because of its higher biomass productivity when cultivated under a CO2-enriched photobioreactor system [7]. The produced biomass of cyanobacterium can be used for many purposes (e.g., for producing fine chemicals, pharmaceuticals, third-generation biofuel, biosorbents, etc.) [7,8].
Averagely, electroplating wastewater in Indonesia contains 0.96 mg/L of Cd [9]. Whereas, the Indonesian Ministry of Environment stated the limitation value for Cd in various industrial effluents ranges from 0.05 to 0.10 mg/L, meaning that it needs a 19.2-fold reduction. The previous reports mentioned that metal removal from aqueous solutions (less than 100 mg/L) is not effectively caused by a lower driving force for adsorption. Therefore, further research on the potential utilization of the microalgae Aphanothece sp. for Cd removal in aqueous solution is still required. Furthermore, only a few studies have been conducted related to the optimization and equilibrium analysis of Cd sorption by Aphanothece sp. as a freshwater cyanobacterium [10,11,12]. Hence, the novelty of this study is the use of modified cyanobacterium of Aphanothece sp. dried biomass as a biosorbent to remove cadmium ions in aqueous solution. Data from this single metallic biosorption system will be useful to further study the biosorption process in multimetallic systems (which is normally found in real wastewater). Carbon dioxide enrichment during microalgae cultivation in a photobioreactor system for producing modified dried biosorbent provided richer active metal (Cd) binding sites compared to that of virgin dried biomass of Aphanothece sp. Detailed physical and chemical characterizations of the dried biosorbent were performed. Experimental parameters such as pH, temperature (T), Cd2+ concentration, as well as biosorbent performance after regeneration were investigated in batch mode. Results of this study were then compared to other studies using various macroalgae [3,13,14,15] and microalgae biomass [6,16,17,18].

2. Materials and Methods

2.1. Dried Biosorbent

In this study, a dried biosorbent made from a local isolate of a cyanobacterium (Aphanothece sp.) originating from Situ Rawa Kalong-Depok (an urban lake located on the West of Java, Indonesia, and lies at the eastern and southern latitudes of 106°53′31.02′′ and 6°23′45.06′′) was used. In the natural habitat, this cyanobacterium was capable of bioaccumulating Cd based on our previous study conducted on this urban lake [19]. The isolate of the wild Aphanothece sp. originating from lake Situ Rawa Kalong-Depok was acclimated photoautotrophically (under 1000 lux) using a laboratory-scale photobioreactor in Blue Green-11 (BG-11) medium for 7 d. Analytical-grade chemicals (Merck, Germany) were used in the preparation of microalgae growth medium. This stock of microalgae suspension was then used as an inoculant on the next step, namely in the microalgae biomass development using a laboratory-scale CO2-enriched photobioreactor (PBR) system.
Basically, the PBR system consisted of three bubble column reactors, and each of them had a working volume of 3 L of BG-11 broth medium. Every bubble column reactor was fed with air streams enriched with CO2 gas inputs of different concentrations of 0.04% (atmospheric), 8%, and 15% and were respectively named as A0, A8, and A15, cultivars. Those cultivars grew under light illumination of about 5700–6000 lux and were harvested after 14 d at pH of 7.2 ± 0.3 and temperature of 28 ± 2 °C. Then, the slurry of harvested biomass was dewatered through centrifugation at 6000 rpm for 5 min using a Hettich-Germany centrifuge and dried at 60 °C for seven days in the oven. Following the pulverizing and sieving process, the dried biomass of Aphanothece sp. was produced to an average diameter of 40.0 µm with a range of 15.5 to 82.6 µm.

2.2. Reagent Preparation
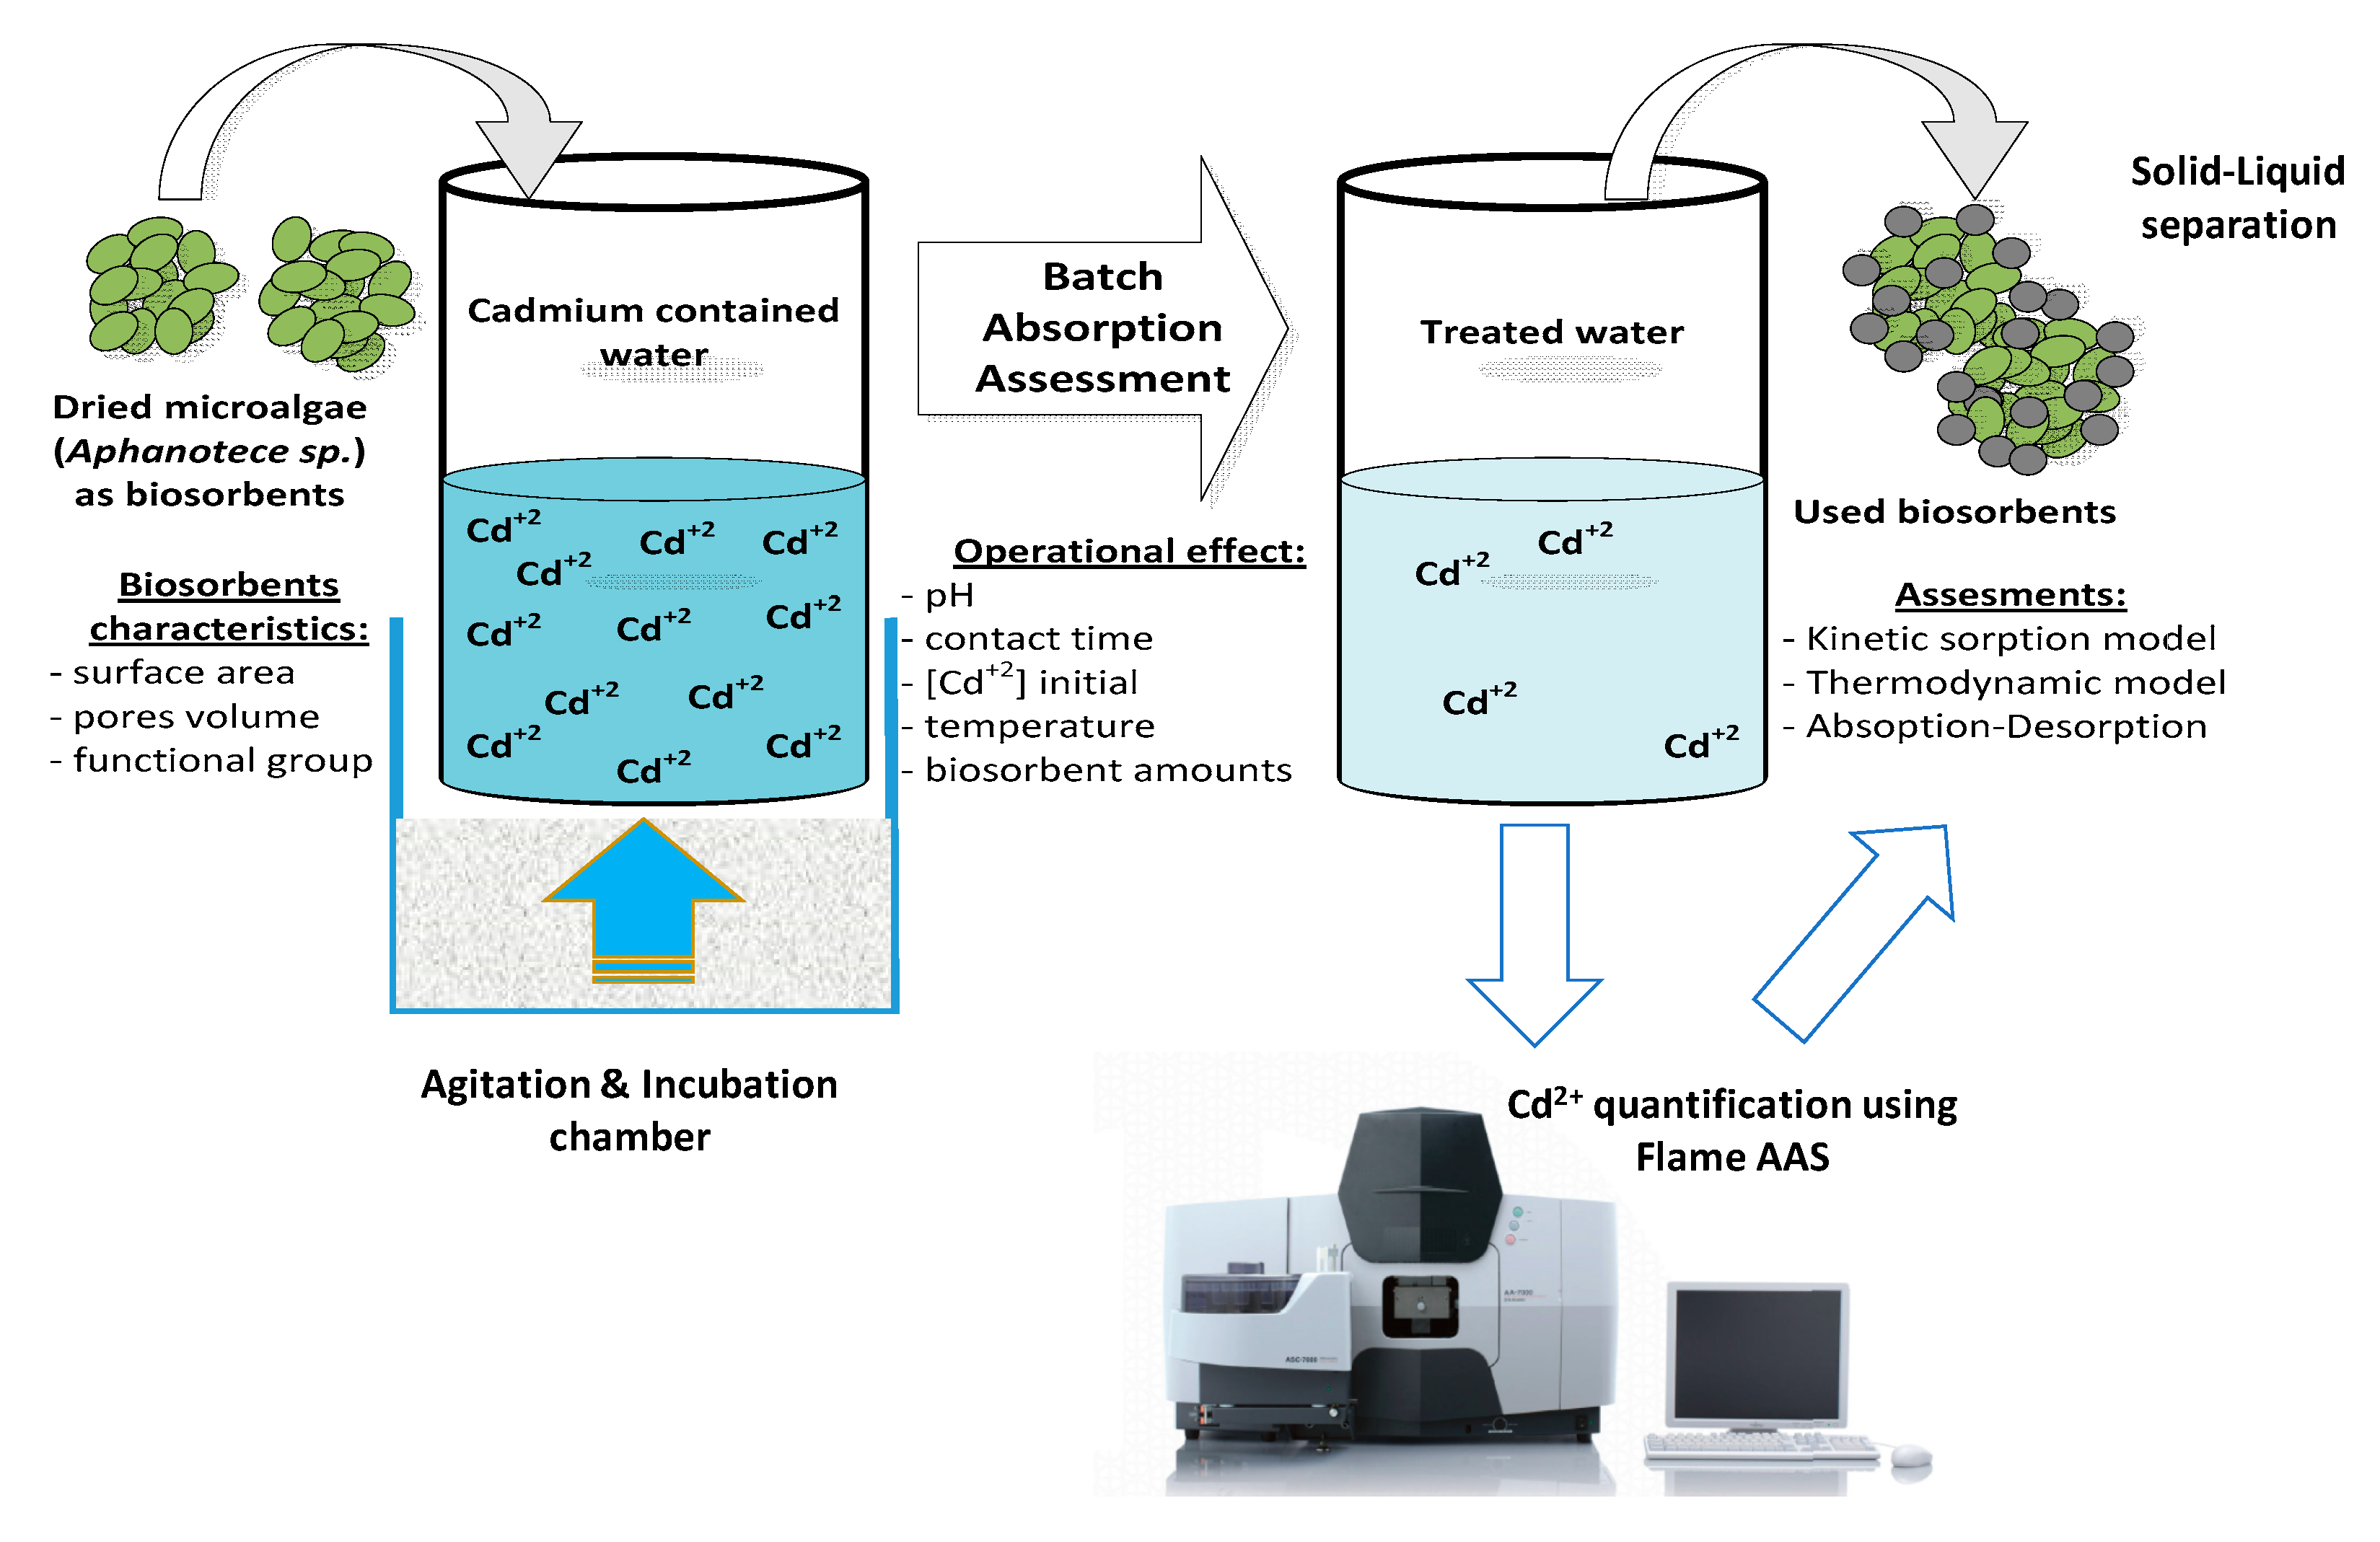
Cadmium stock solution (1000 mg/L) was prepared by dissolving 2.032 g of CdCl2 2.5 H2O (M & B Chemical) in a 1000 mL volumetric flask using deionized water prepared from Kemflo RO System, Indonesia. All experimental solutions of different concentrations were prepared by diluting the stock solution. The pH of the solution was adjusted with 0.1 M NaOH or HCl. All chemicals used were from Merck-Germany, except for cadmium salt for stock solution.

2.3. Batch Sorption

The sorption experiments were carried out in batch mode to assess the removal efficiency of Cd2+ by biosorbent (schematically presented in Figure 1). All experiments were conducted in triplicate in 100 mL clear tubular flasks with 25 mL metal ion solution in a shaking incubator at 120 rpm (Lab Tech, China). The influence of pH, as well as point of zero charge (pHPZC) on Cd2+ sorption, was examined in the pH range of 3.0–11.0. The initial pH of each Cd2+ ion solution (C0) was maintained to the requisite pH value by adding 0.1 M HCl or NaOH into solutions buffered with K-hydrogen phthalate or K-hydrogen phosphate or Na-tetra borate or Na-bicarbonate, corresponding to each pH value. The biosorbent concentration (0.1 g/L) was added to the Cd2+ ion solution and agitated in an incubator shaker at 120 rpm and 30 °C for 60 min. Similarly, the effects of biosorbent concentration (W0) were examined in ranges of 0.1 to 2.0 g/L, initial Cd2+ ion concentrations (C0) of 1.29 to 7.13 mg/L, and a T range of 25 to 50 °C.
The sorption capacity was examined by shaking Cd solution with C0 (2.62 to 7.13 mg/L) at pH 8 and W0 of 0.1 g/L. The mixture was shaken at 120 rpm for 60 min at 30 ± 2 °C. Calculations of the rate of sorption and residual Cd concentration were measured at different times (5 to 180 min). The supernatant was analysed for residual Cd2+ concentration using flame atomic absorption spectroscopy (FAAS) (AA7000, Shimadzu, Tokyo, Japan). A hollow cathode lamp was operated at 8 mA, and analytical wavelength was set at 228.8 nm. All experiments were done in duplicate, and results were presented as the average value. The sorption efficiency (%BE) and sorption capacity (qe) of Cd2+ were calculated using the following Equations (1) and (2):
%   B E =   C 0 C e C 0 × 100
q e = ( C 0 C e ) V m
where qe = the amount of Cd2+ adsorbed at equilibrium (mg/g), V = the volume of solution (L), m = mass of biosorbent (g), and C0 and Ce = the initial and equilibrium concentration of Cd2+ in solution (mg/L).

2.4. Biosorbent Characterization

The surficial morphology of the biosorbent before and after biosorption was examined using scanning electron microscopy (SEM) (JEOL JSM-6360LA, Tokyo, Japan) at 15 kV with a thin layer of gold under vacuum. The occurrence of Cd ions on the biosorbent surface was confirmed using energy-dispersive X-ray spectroscopy (EDX) analysis before and after the sorption process (Hitachi SEM/EDS SU 3500, Tokyo, Japan). Functional groups on both virgin and used biosorbent surface were identified using Fourier transform infrared (FTIR) spectroscopy using the KBr disc method (Prestige 21 Shimadzu). The specific surface area, volume, and diameter of pores of dried biosorbent were determined using the Brunauer–Emmet–Teller (BET) method (Quantachrome Nova Win-NOVA instruments, Boynton beach, FL, USA).

2.5. Desorption Study

A desorption experiment was done using 1 M HCl as the desorbing solution. Three consecutive sorption–desorption cycles were conducted by adding 0.1 g/L Cd2+ of loaded Aphanothece sp. dried biomass in 25 mL of 1 M HCl. This mixture was agitated for 60 min in 30 ± 2 °C, then filtered and analysed for Cd2+ ion concentration in the desorbing solution by FAAS. The effectiveness of desorption (ED) was evaluated by the following Equation (3):
E D =   q D q B × 100
where qD is the amount of desorbed Cd2+ ions (mg/g), and qB is the amount of biosorbed Cd2+ ions (mg/g).

2.6. Data Analysis

The experimental equilibrium and kinetic data for sorption of Cd2+ ions onto dried biosorbent were modelled using the equilibrium and kinetic models described in sections of sorption isotherm and kinetic models [20,21,22]. Different model fitting parameters were employed to compare experimental results to model-based results. Justification is based on the correlation coefficient magnitude for the regression (R2, Equation (4a), the value closest to unity is presumed to be the best fit). The relative standard deviation (RSD) was determined using Equation (4b).
R 2 =   ( q e , m o d e l q e , a v g ) 2   ( q e , m o d e l q e , a v g ) 2 +     ( q e , m o d e l q e , e x p ) 2
R S D =   n = 1 n [ q e q e , m o d e l , n q e , a v g ] × 100 % n
where qe,exp is the equilibrium capacity obtained from the experiment, while qe,avg is the average qe,exp obtained in the experiment.

3. Results and Discussion

3.1. Characterization of Aphanothece sp. Dried Biosorbent

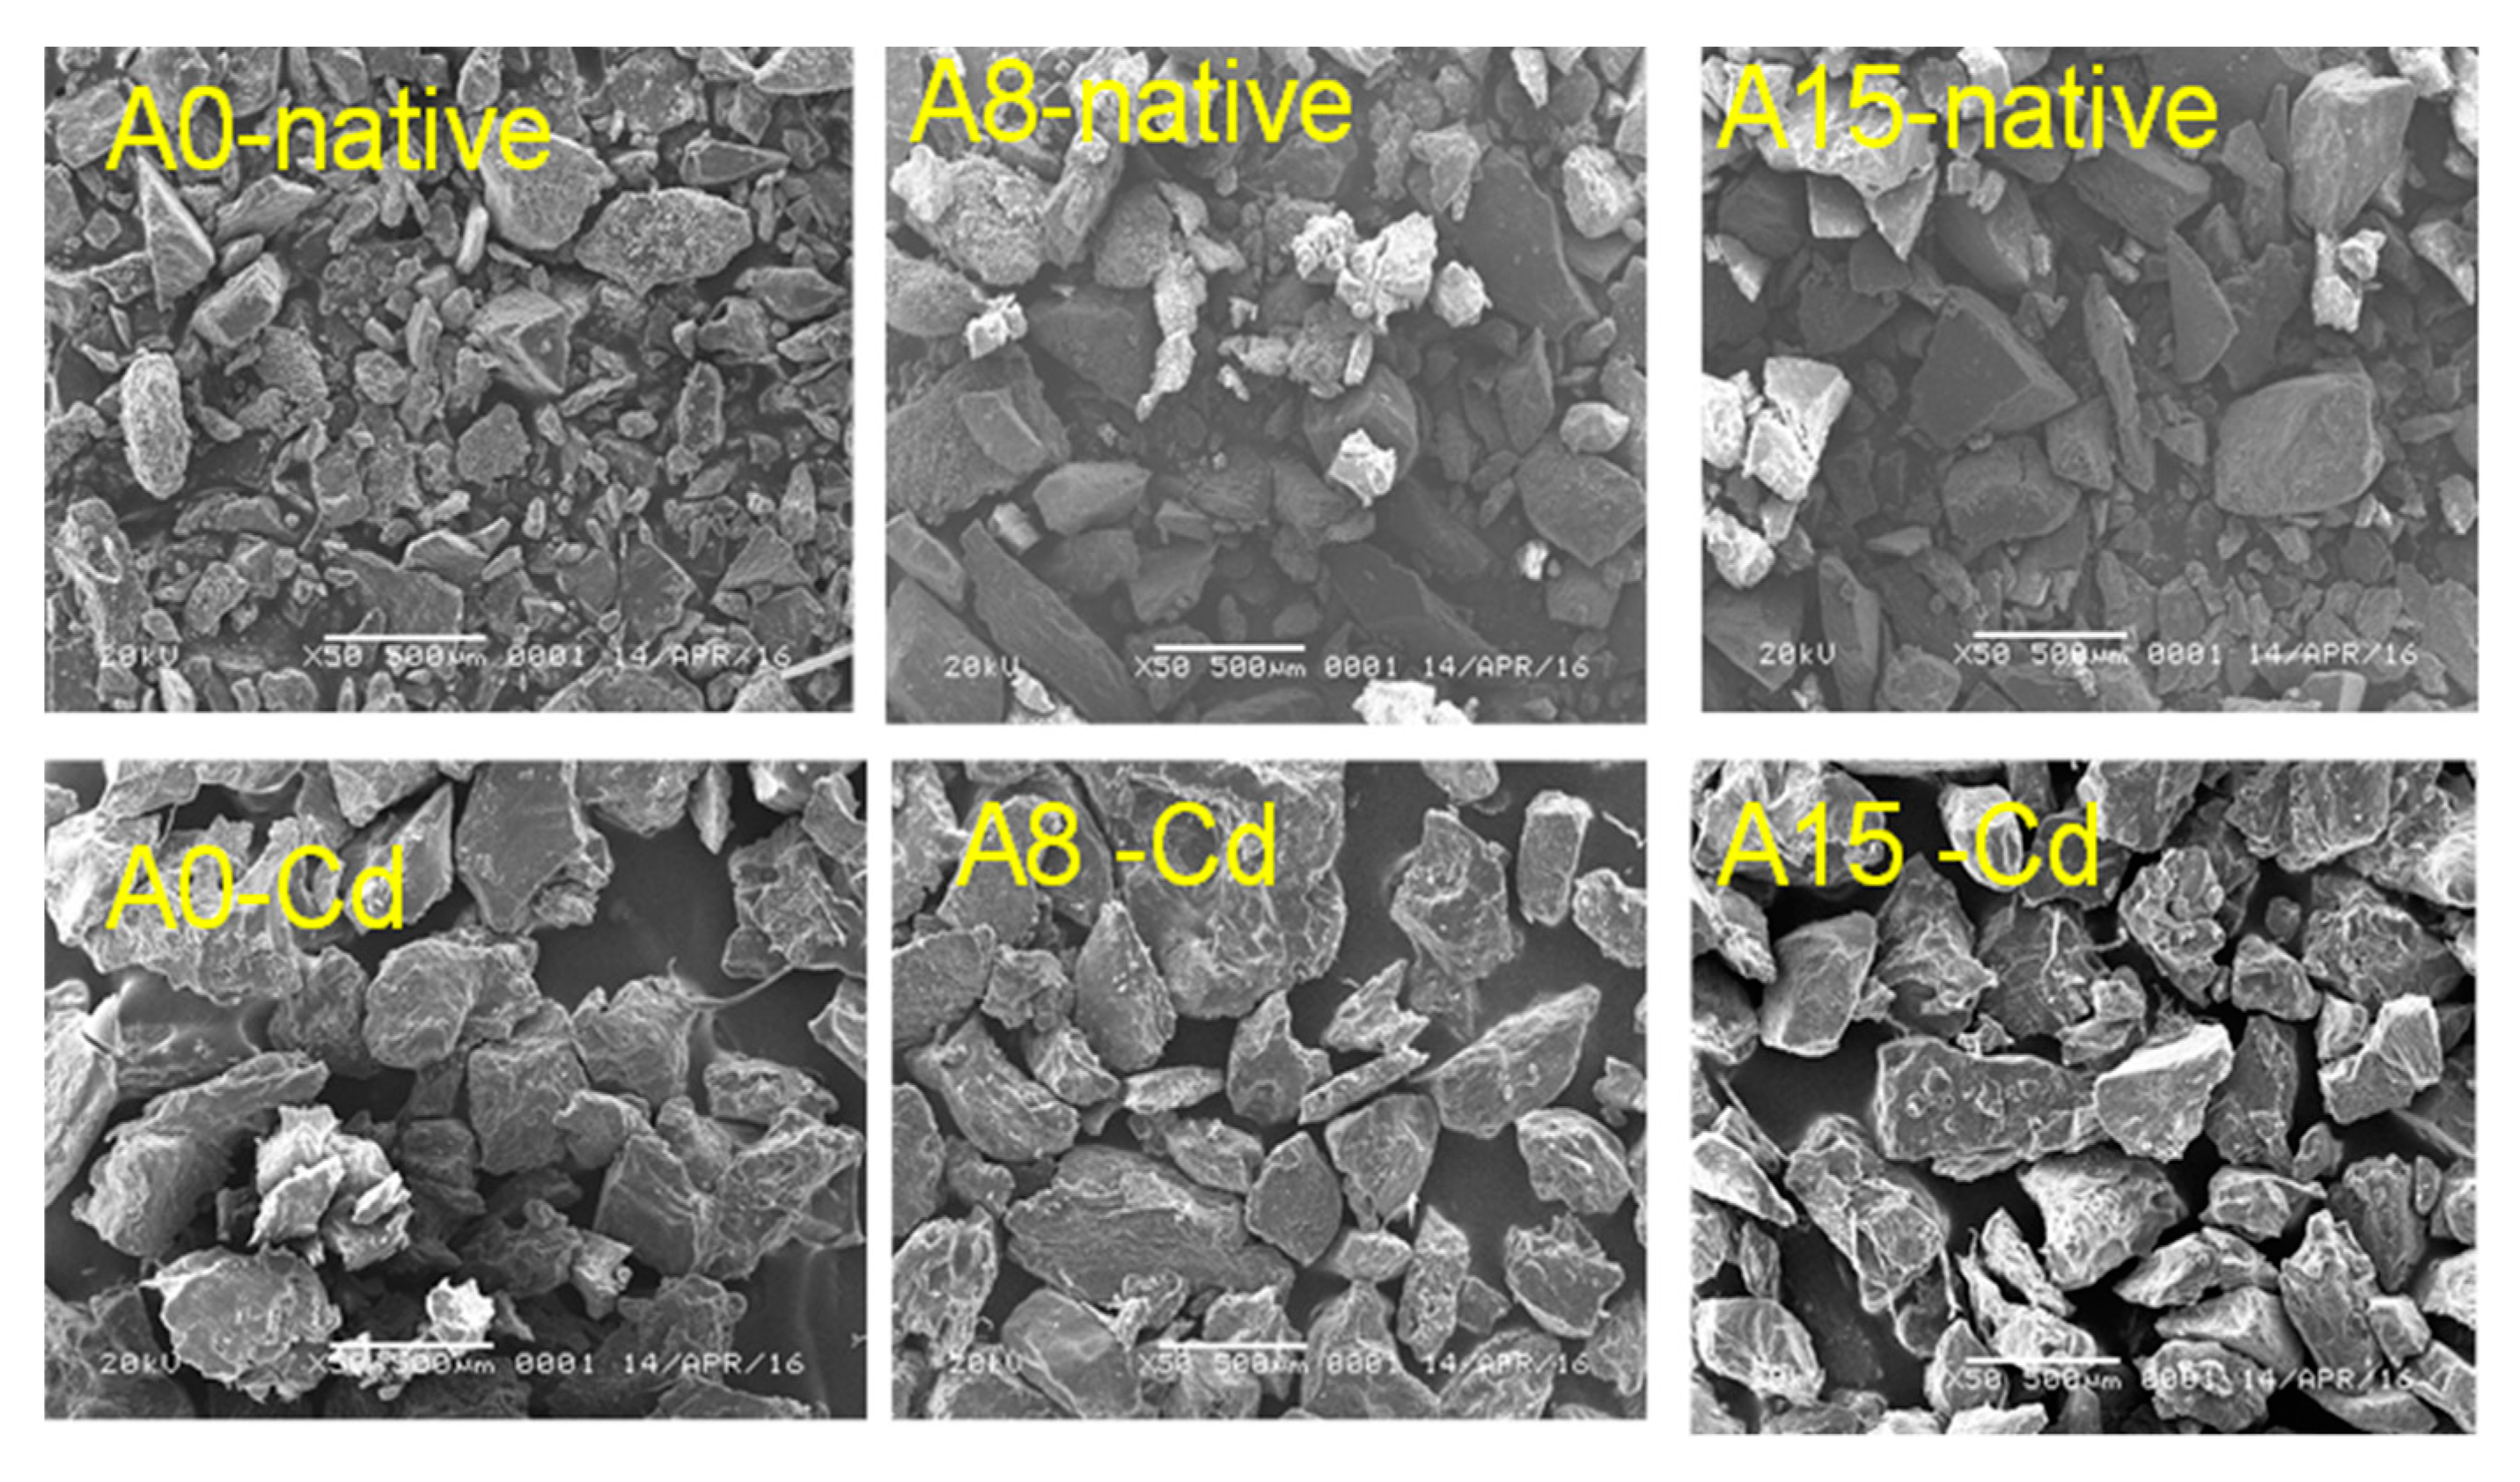
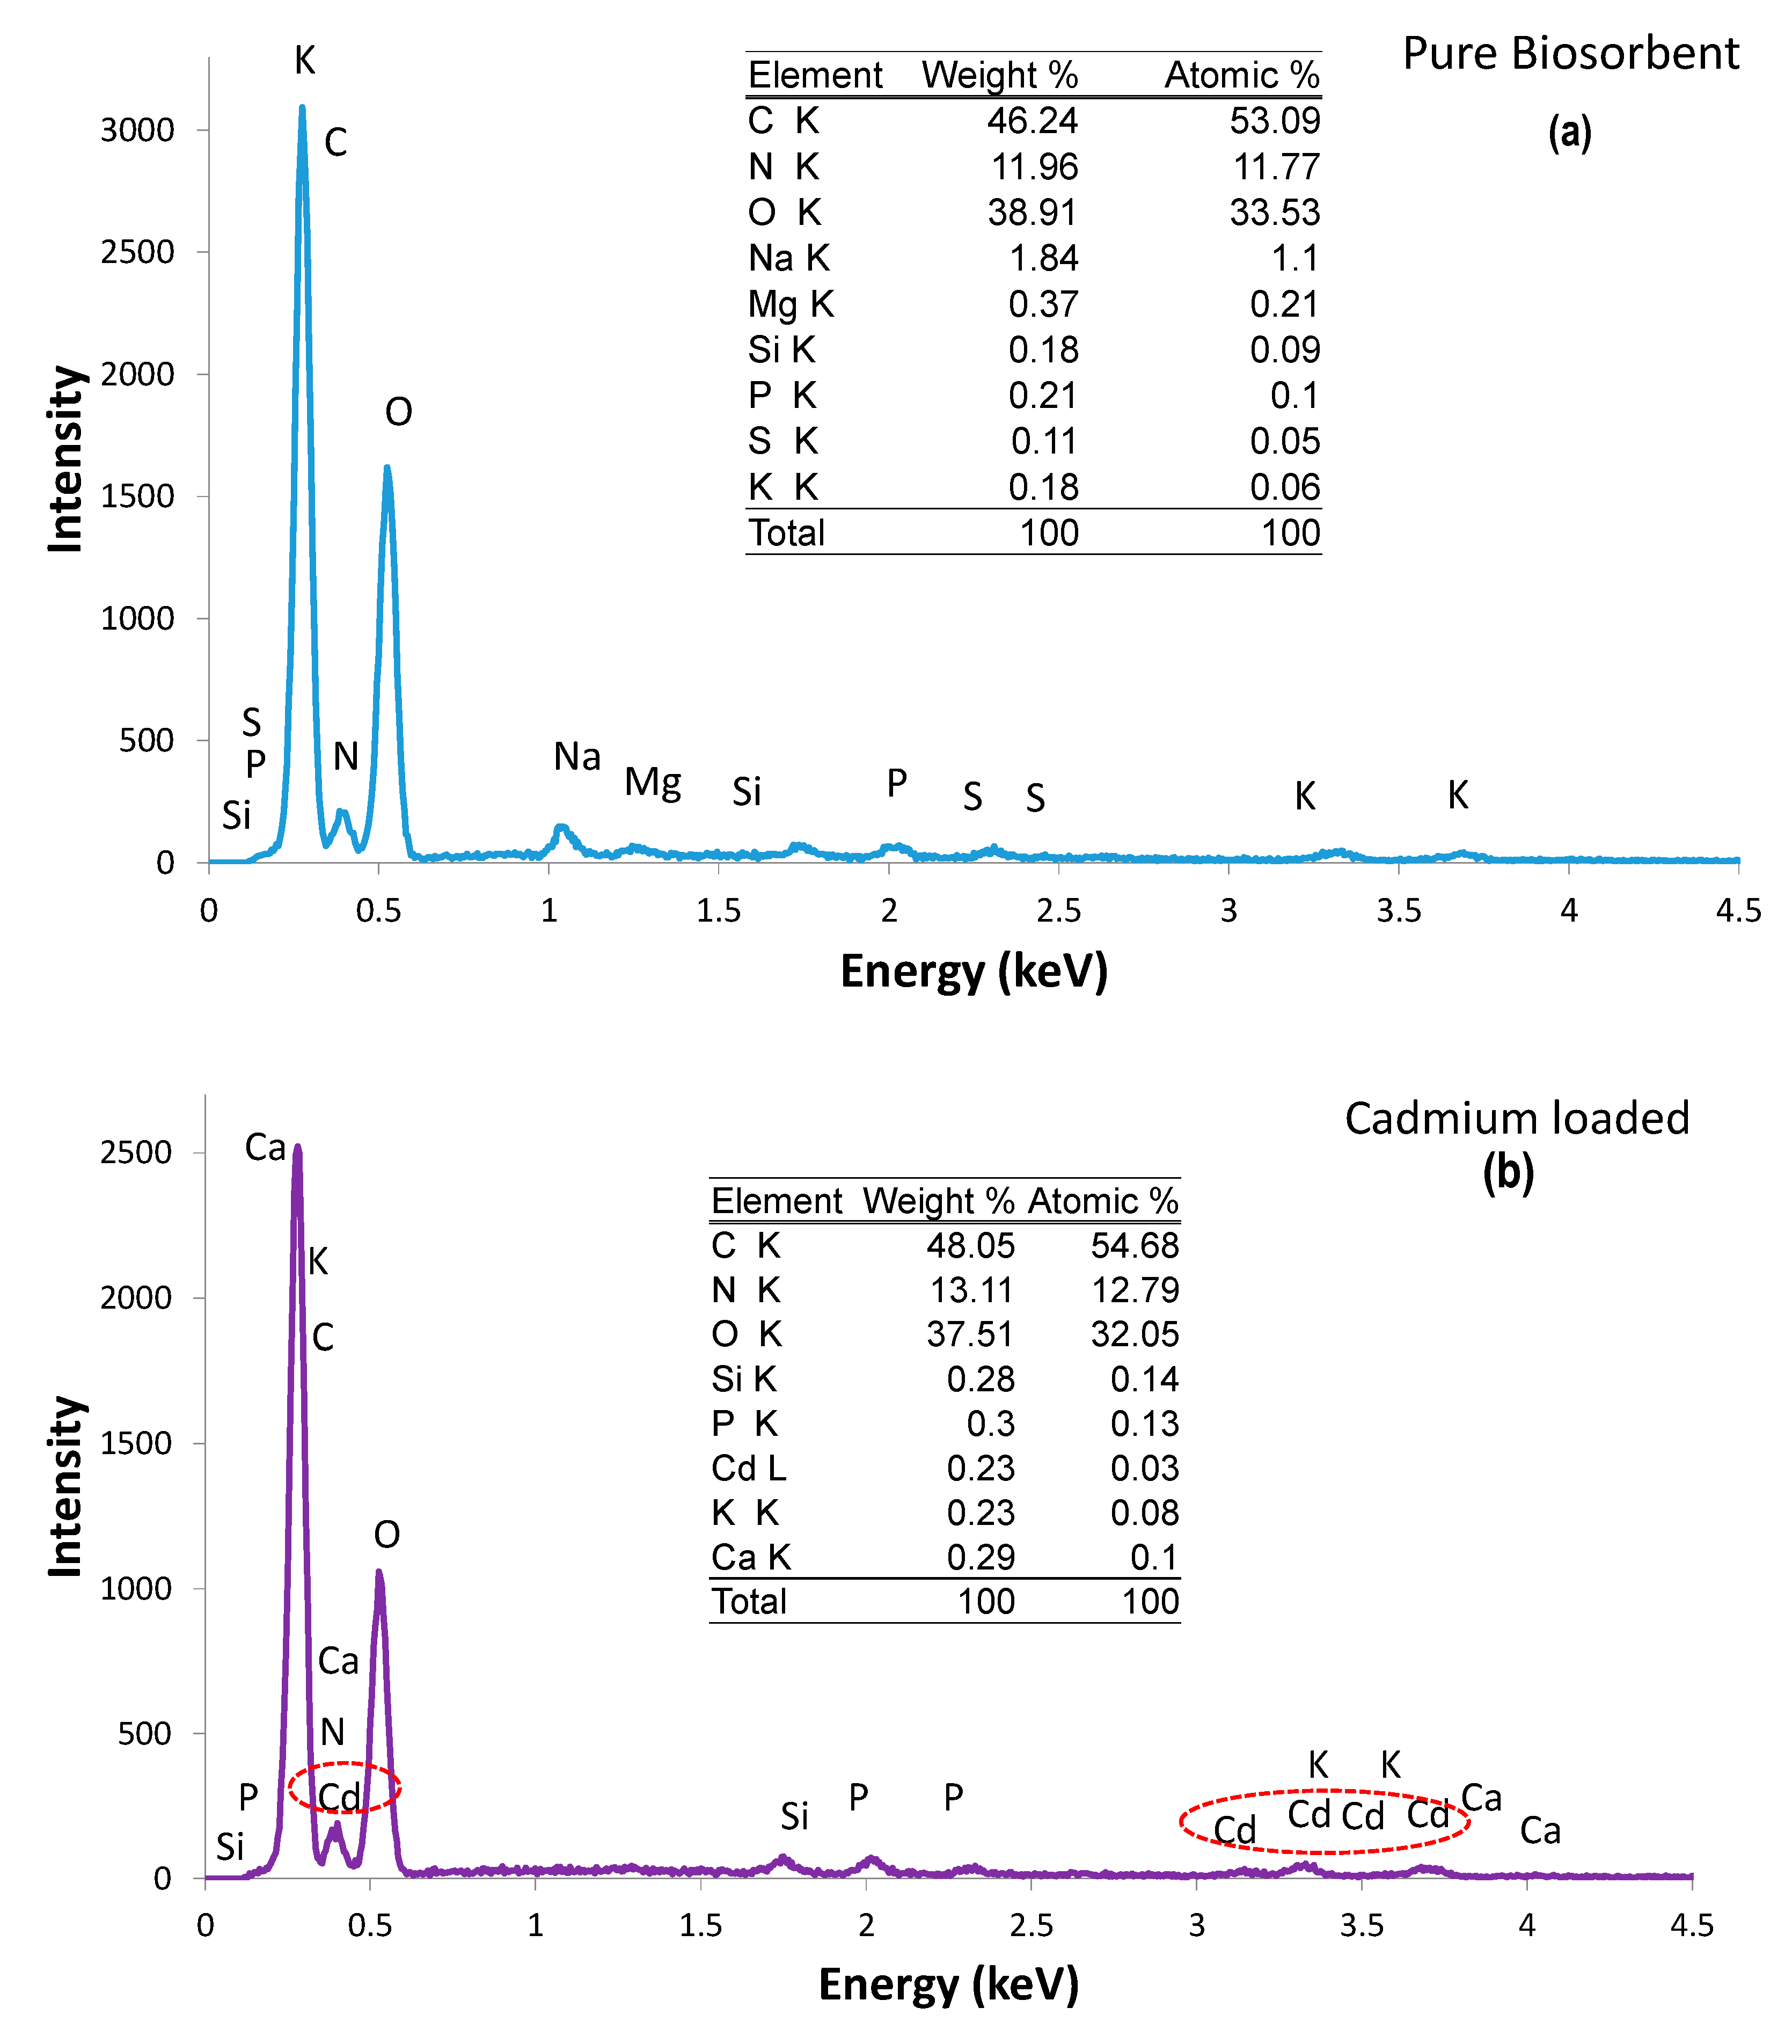
3.1.1. Scanning Electron Microscopy (SEM) and Energy-Dispersive X-ray (EDX)

As shown in Figure 2, the surface of the dried biosorbent appeared to be smooth and dull before biosorption of Cd2+, while after biosorption, the surface became rough, bright, and sharp-ended. This observed surface morphology was attributed to surface precipitation of Cd2+, which was also reported to occur in Parachlorella sp. dried biosorbent when used to remove Cd from an aqueous solution containing 60 mg/L of Cd [16]. Energy spectra of pure biosorbent revealed traces of carbon (C), nitrogen (N), oxygen (O), sodium (Na), magnesium (Mg), silicate (Si), phosphorus (P), sulphur (S), and potassium (K). After sorption, EDX spectra showed traces of C, N, O, Si, P, Cd, K, and calcium (Ca). This outcome suggested that Na, Mg, and S were replaced by Cd (0.23% weight) and Ca (0.29% weight) (Figure 3). These results indicated that the ionic exchange mechanism took place during sorption and confirmed that the interaction between Cd2+ ions was involved in binding sites/functional groups. This kind of biosorption mechanism also occurred in a novel bacterial strain of Halomonas BVR-1 sp. dried pellet biosorbent for removing Cd in an aqueous solution of electronic industry effluent [23].

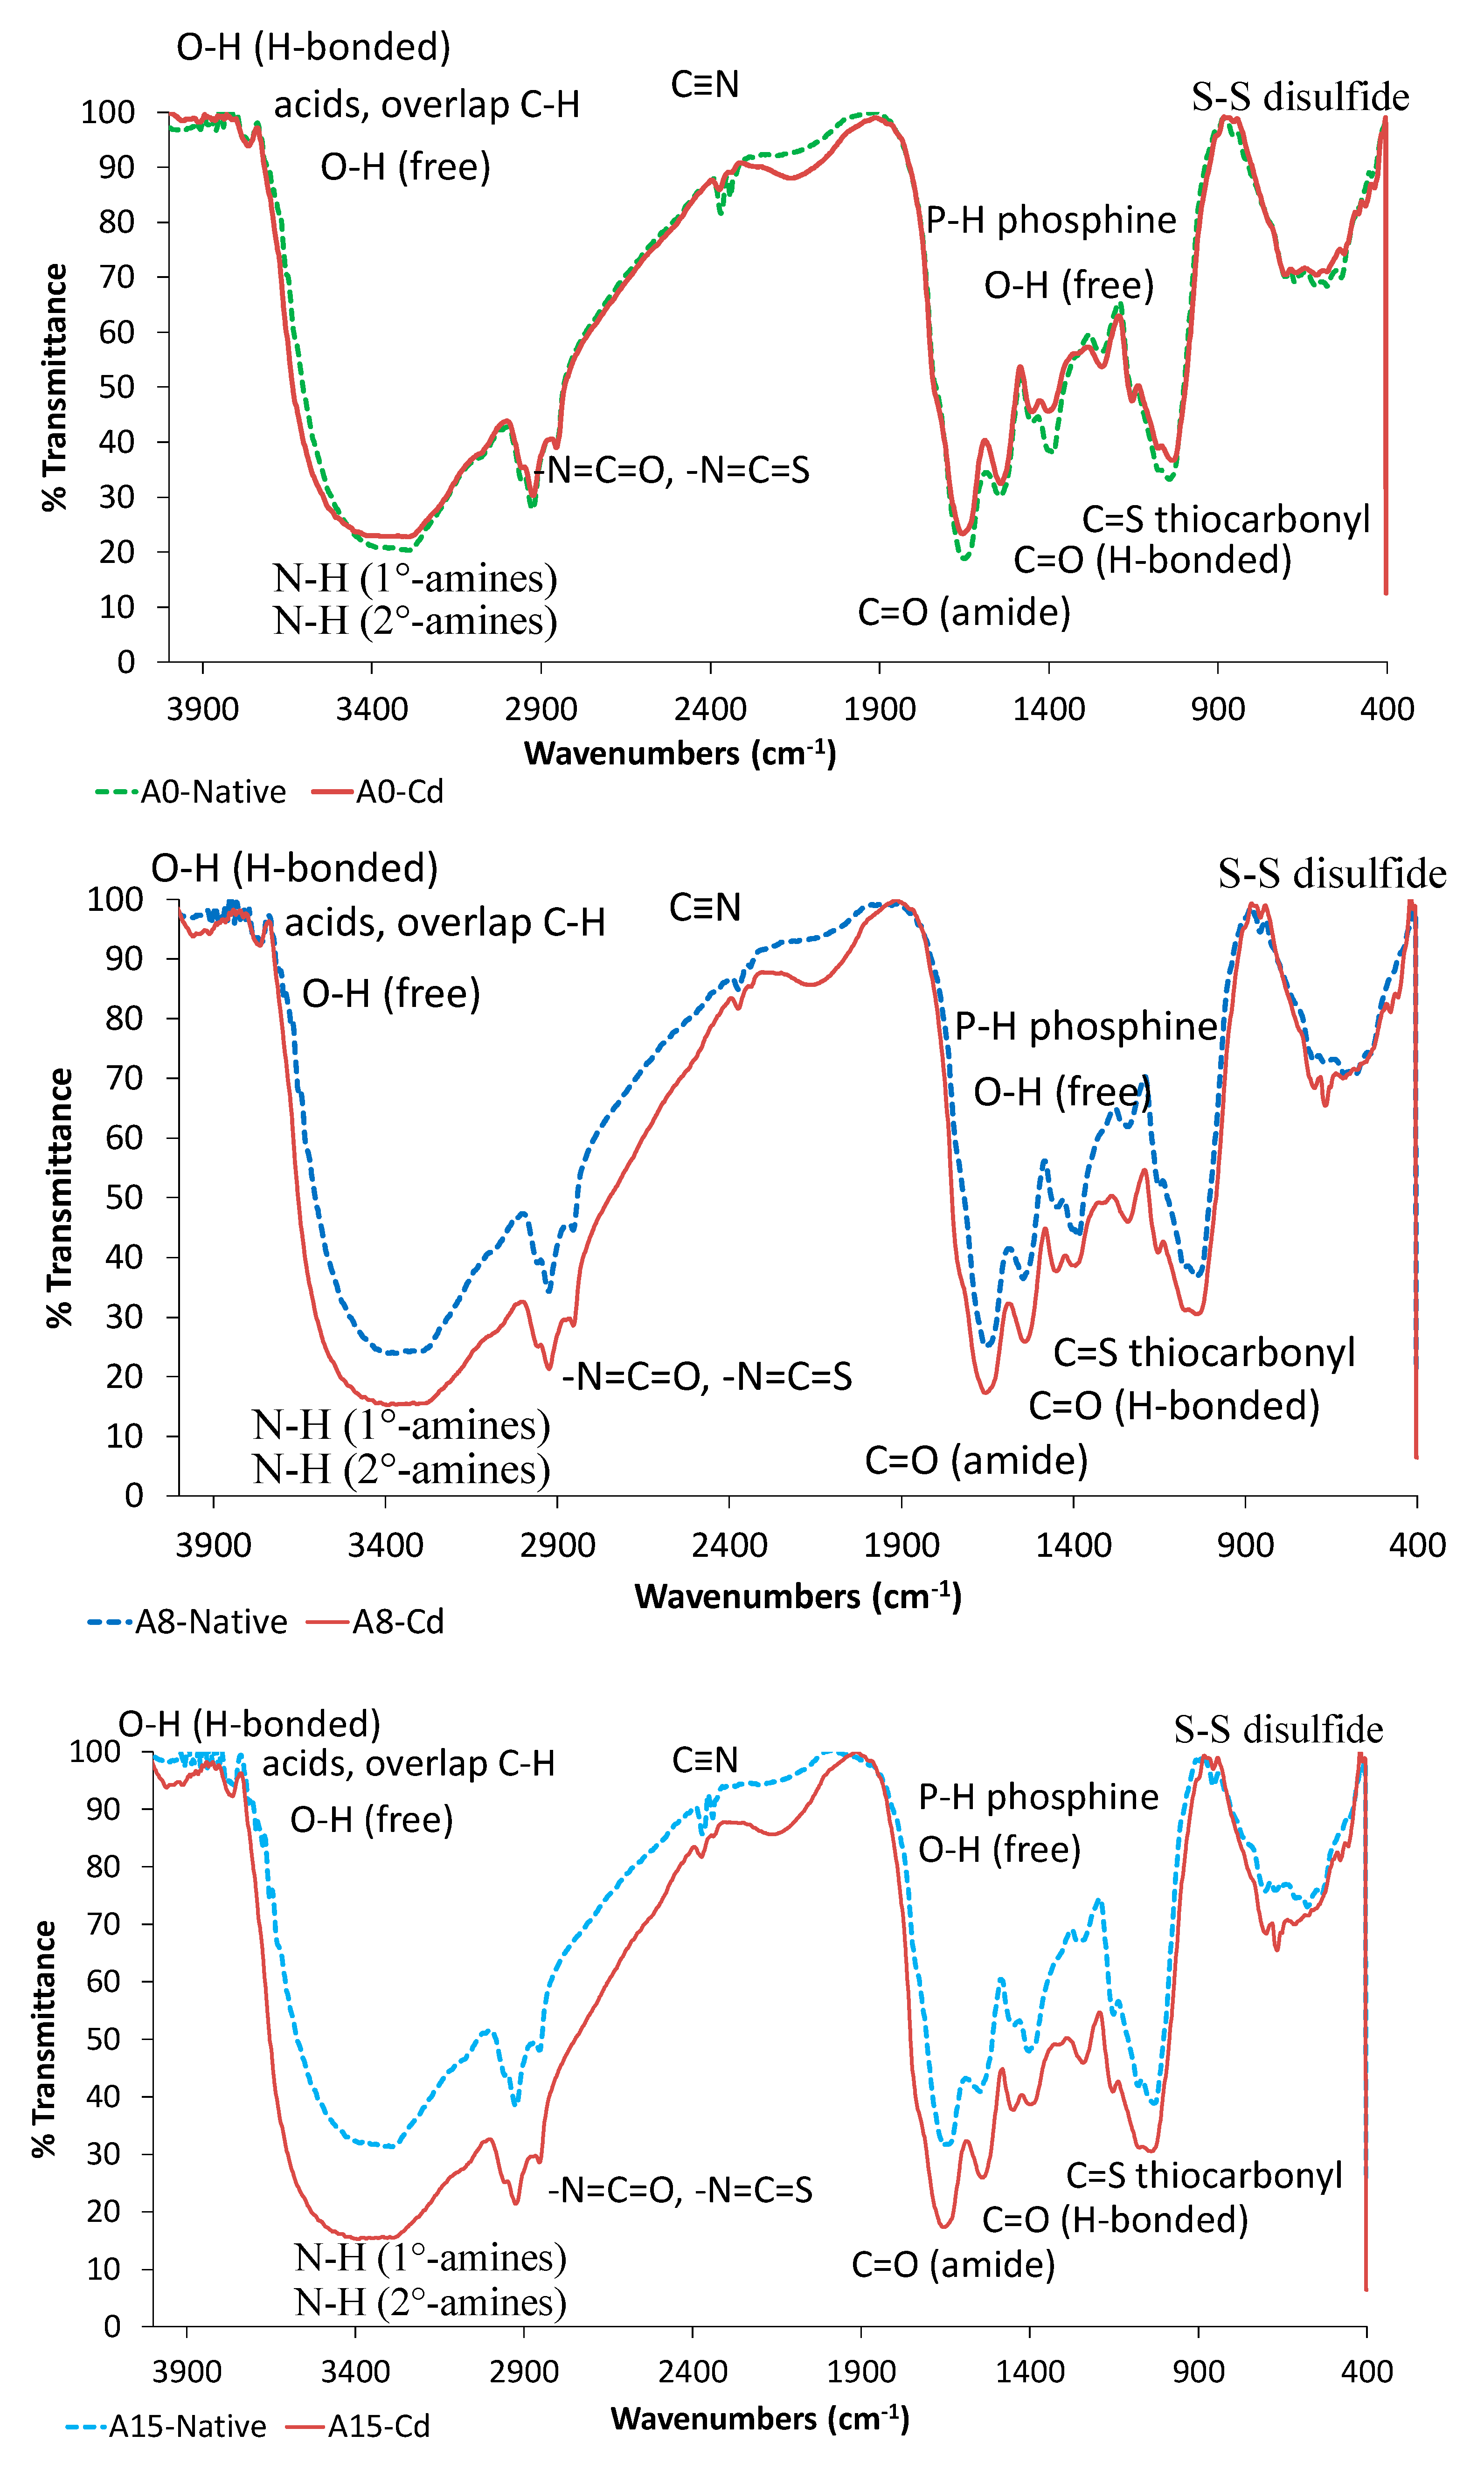
3.1.2. FTIR Analysis

Figure 4 presents FTIR spectra for the biosorbents (A0, A8, and A15) before and after Cd2+ biosorption. The surface of three biosorbents consisted of numerous functional groups: hydroxyls (bonded and free), amines (primary and secondary), carboxylic, amides, thiocarbonyl, disulphides, and sulphur ether. Based on the main peak position assignment, these peaks shifted after the Cd2+ ions bound to functional groups (Table 1). For example, the observed peak at 3292 cm−1 represents O–H groups. The peak shifted to 3282 cm−1 for A0 and 3289 cm−1 for A8 and A15 (modified biosorbents). This shifting occurred due to the formation of a bond between Cd2+ with oxygen. The observed peak at 2926 cm−1 indicated amine groups and shifted to 2924 and 2921 cm−1 after Cd2+ ions interacted with nitrogen.
The peak shifting after the sorption process indicated that functional groups might play a role in the sorption of Cd2+ ions. This finding was also observed in other dried biomass of cyanobacterium Arthrospira (Spirullina) platensis and green microalgae Chlorella vulgaris, before and after biosorption of Ni2+, Zn2+, and Pb2+ in each monometallic system. The lower shifting on the transmittance (or higher absorbance) pattern of the certain functional group indicated an interaction between the functional group to the metal cation [24]. In this study, the main peak shapes were similar for all three biosorbents, but the intensity differed, mostly in biosorbent A15 (which showed the lowest transmittance after binding with cadmium ions). It suggested that, in A15, more functional groups were available to interact with Cd2+ than that of A0 and A8.
The results of SEM, EDX, and FTIR indicated that functional groups present on the biosorbent surface interacted with Cd2+ (led to bond formation) after biosorption through cation exchange mechanisms and also changed the surface morphology of the biosorbent after sorption, which was revealed from SEM results (Figure 2 and Figure 4).

3.1.3. BET Analysis

Results of the BET analysis and pore size distribution (volume and diameter of pores) showed that the surface area of A0 was almost three times smaller than that of A8 and A15 (Table 2). Meanwhile, compared to macroalgae Fucus vesiculosus, which had a surface area of 0.22 m2/g [18], the surface area of the biosorbents of A0, A8, and A15 used in this study were 2.6, 8.39, and 7.89 times larger, respectively. Regarding the diameter of the pore, the biosorbents of A8 and A15 had smaller pores than that of A0. As well, the volume of the pore of A0 was 0.82-fold larger than of both A8 and A15. These findings suggested that A15 was potentially the best biosorbent.

3.2. Biosorption Process Optimization
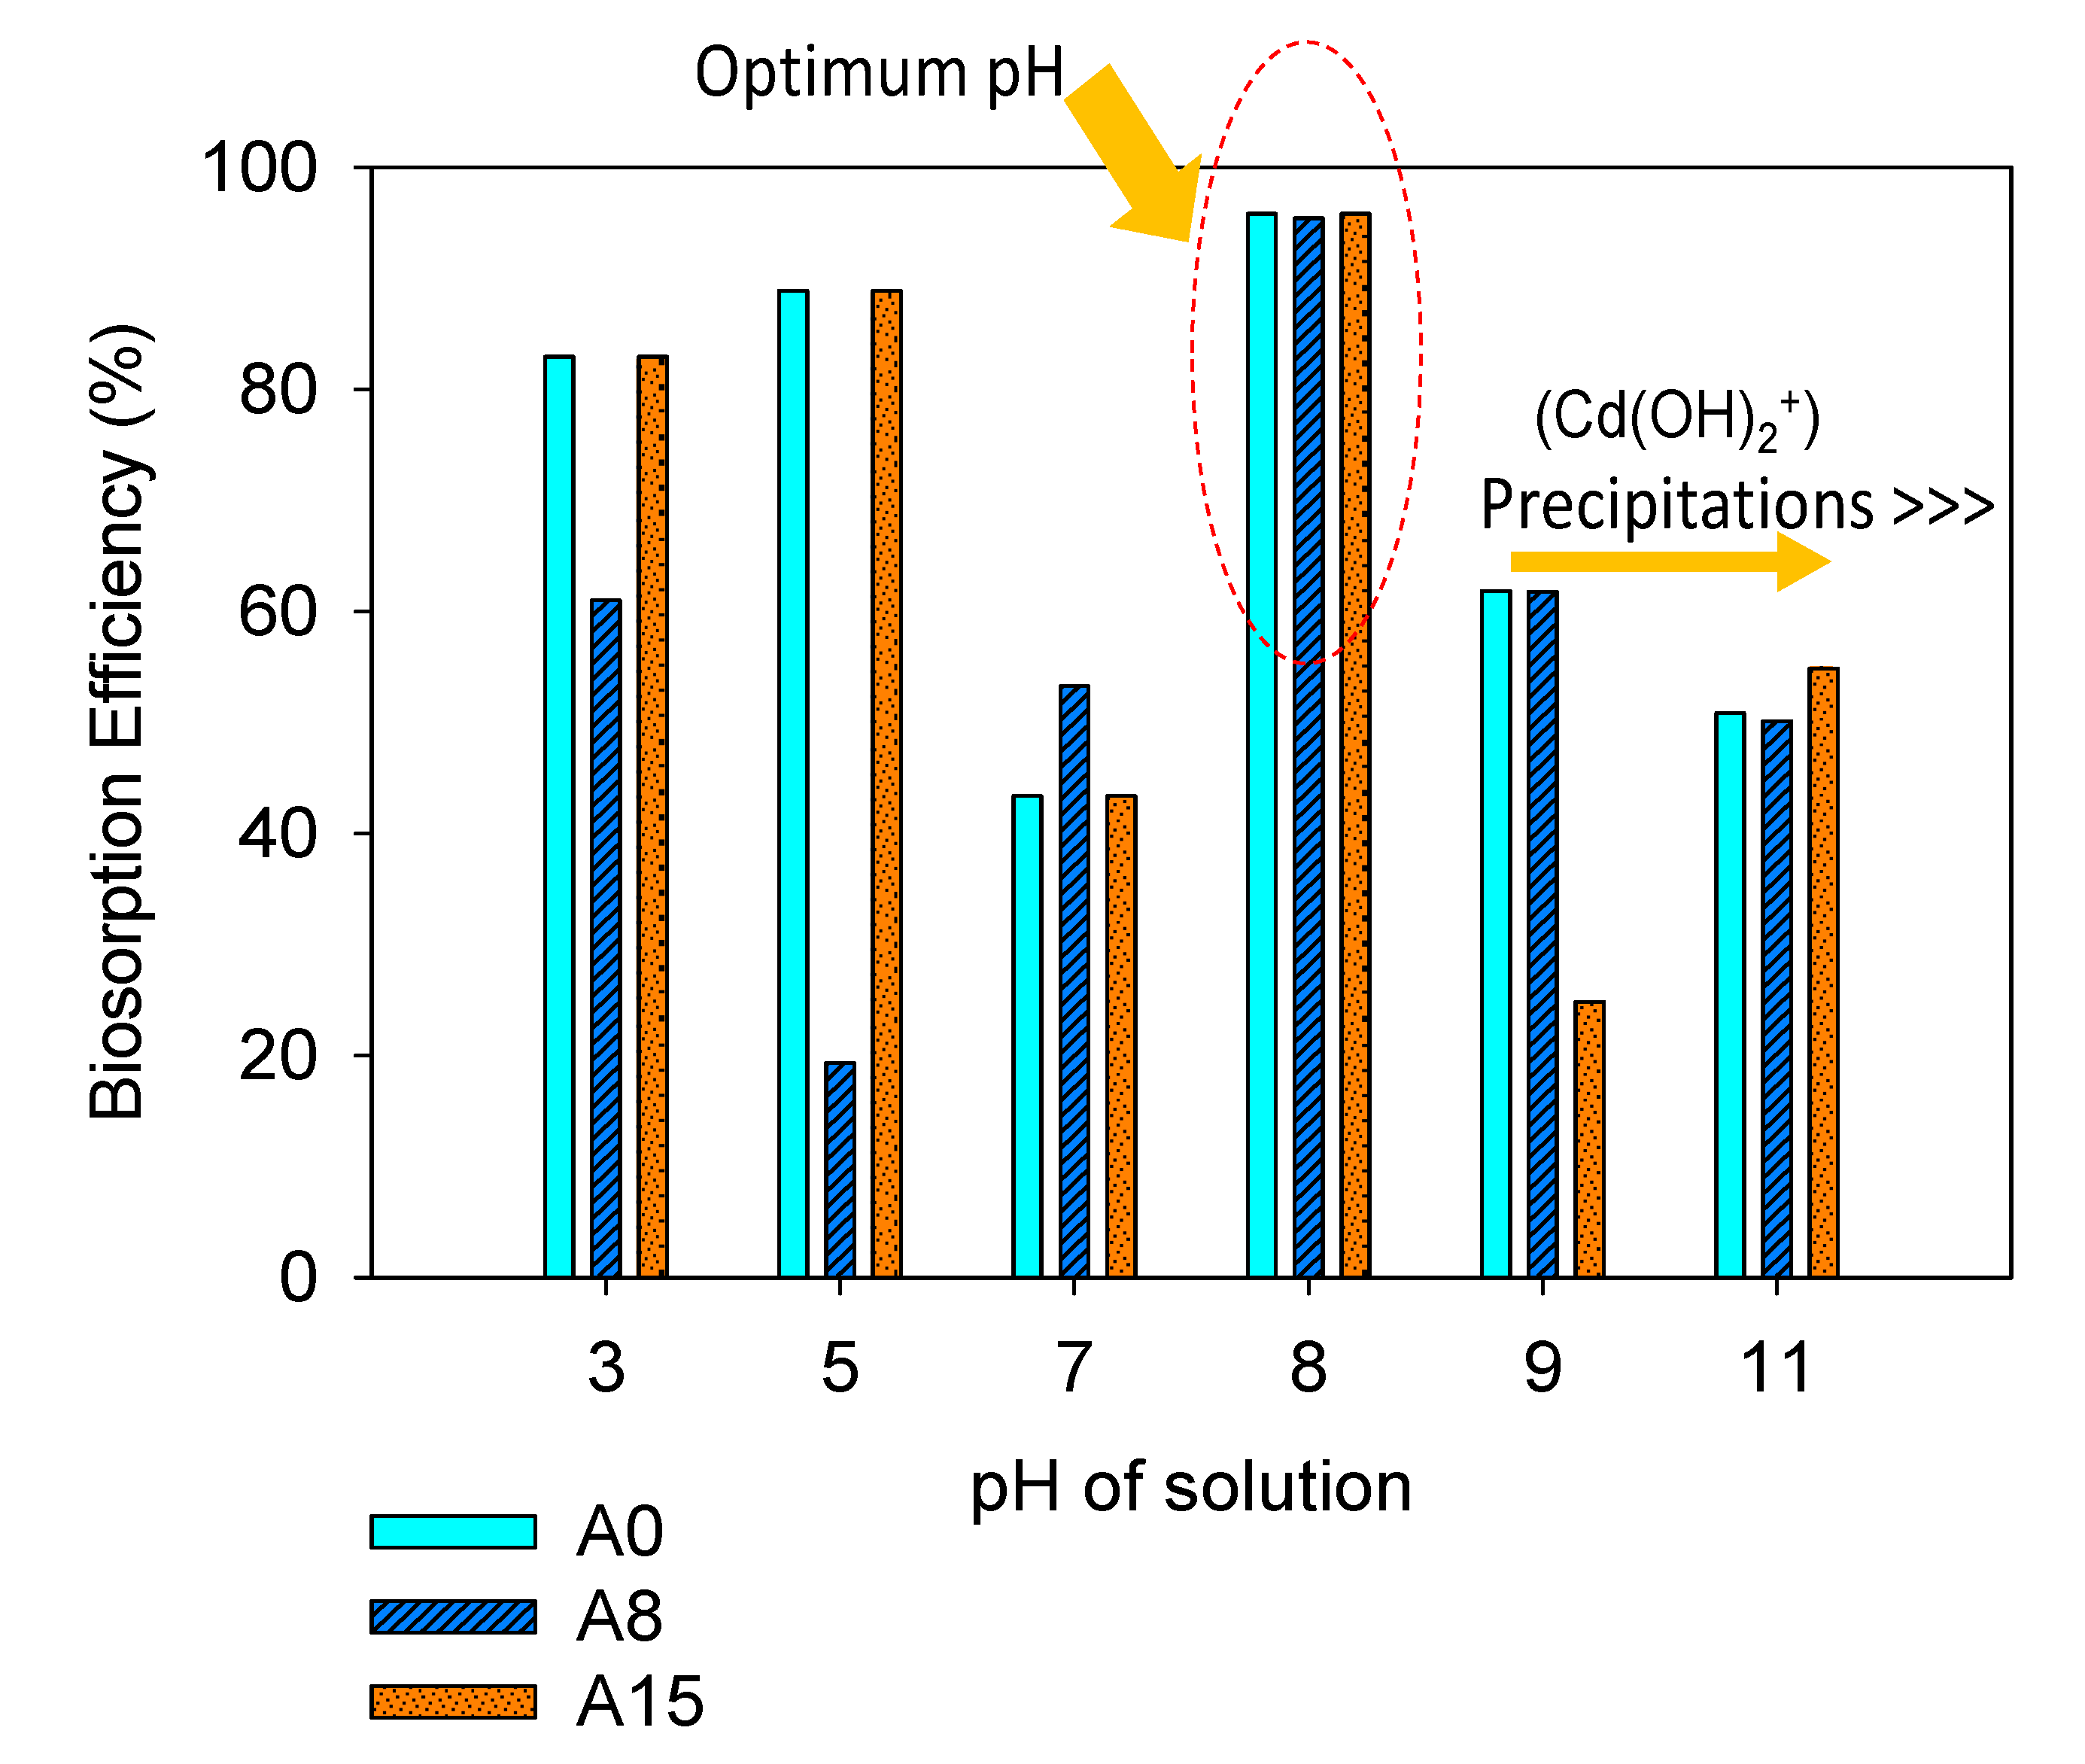
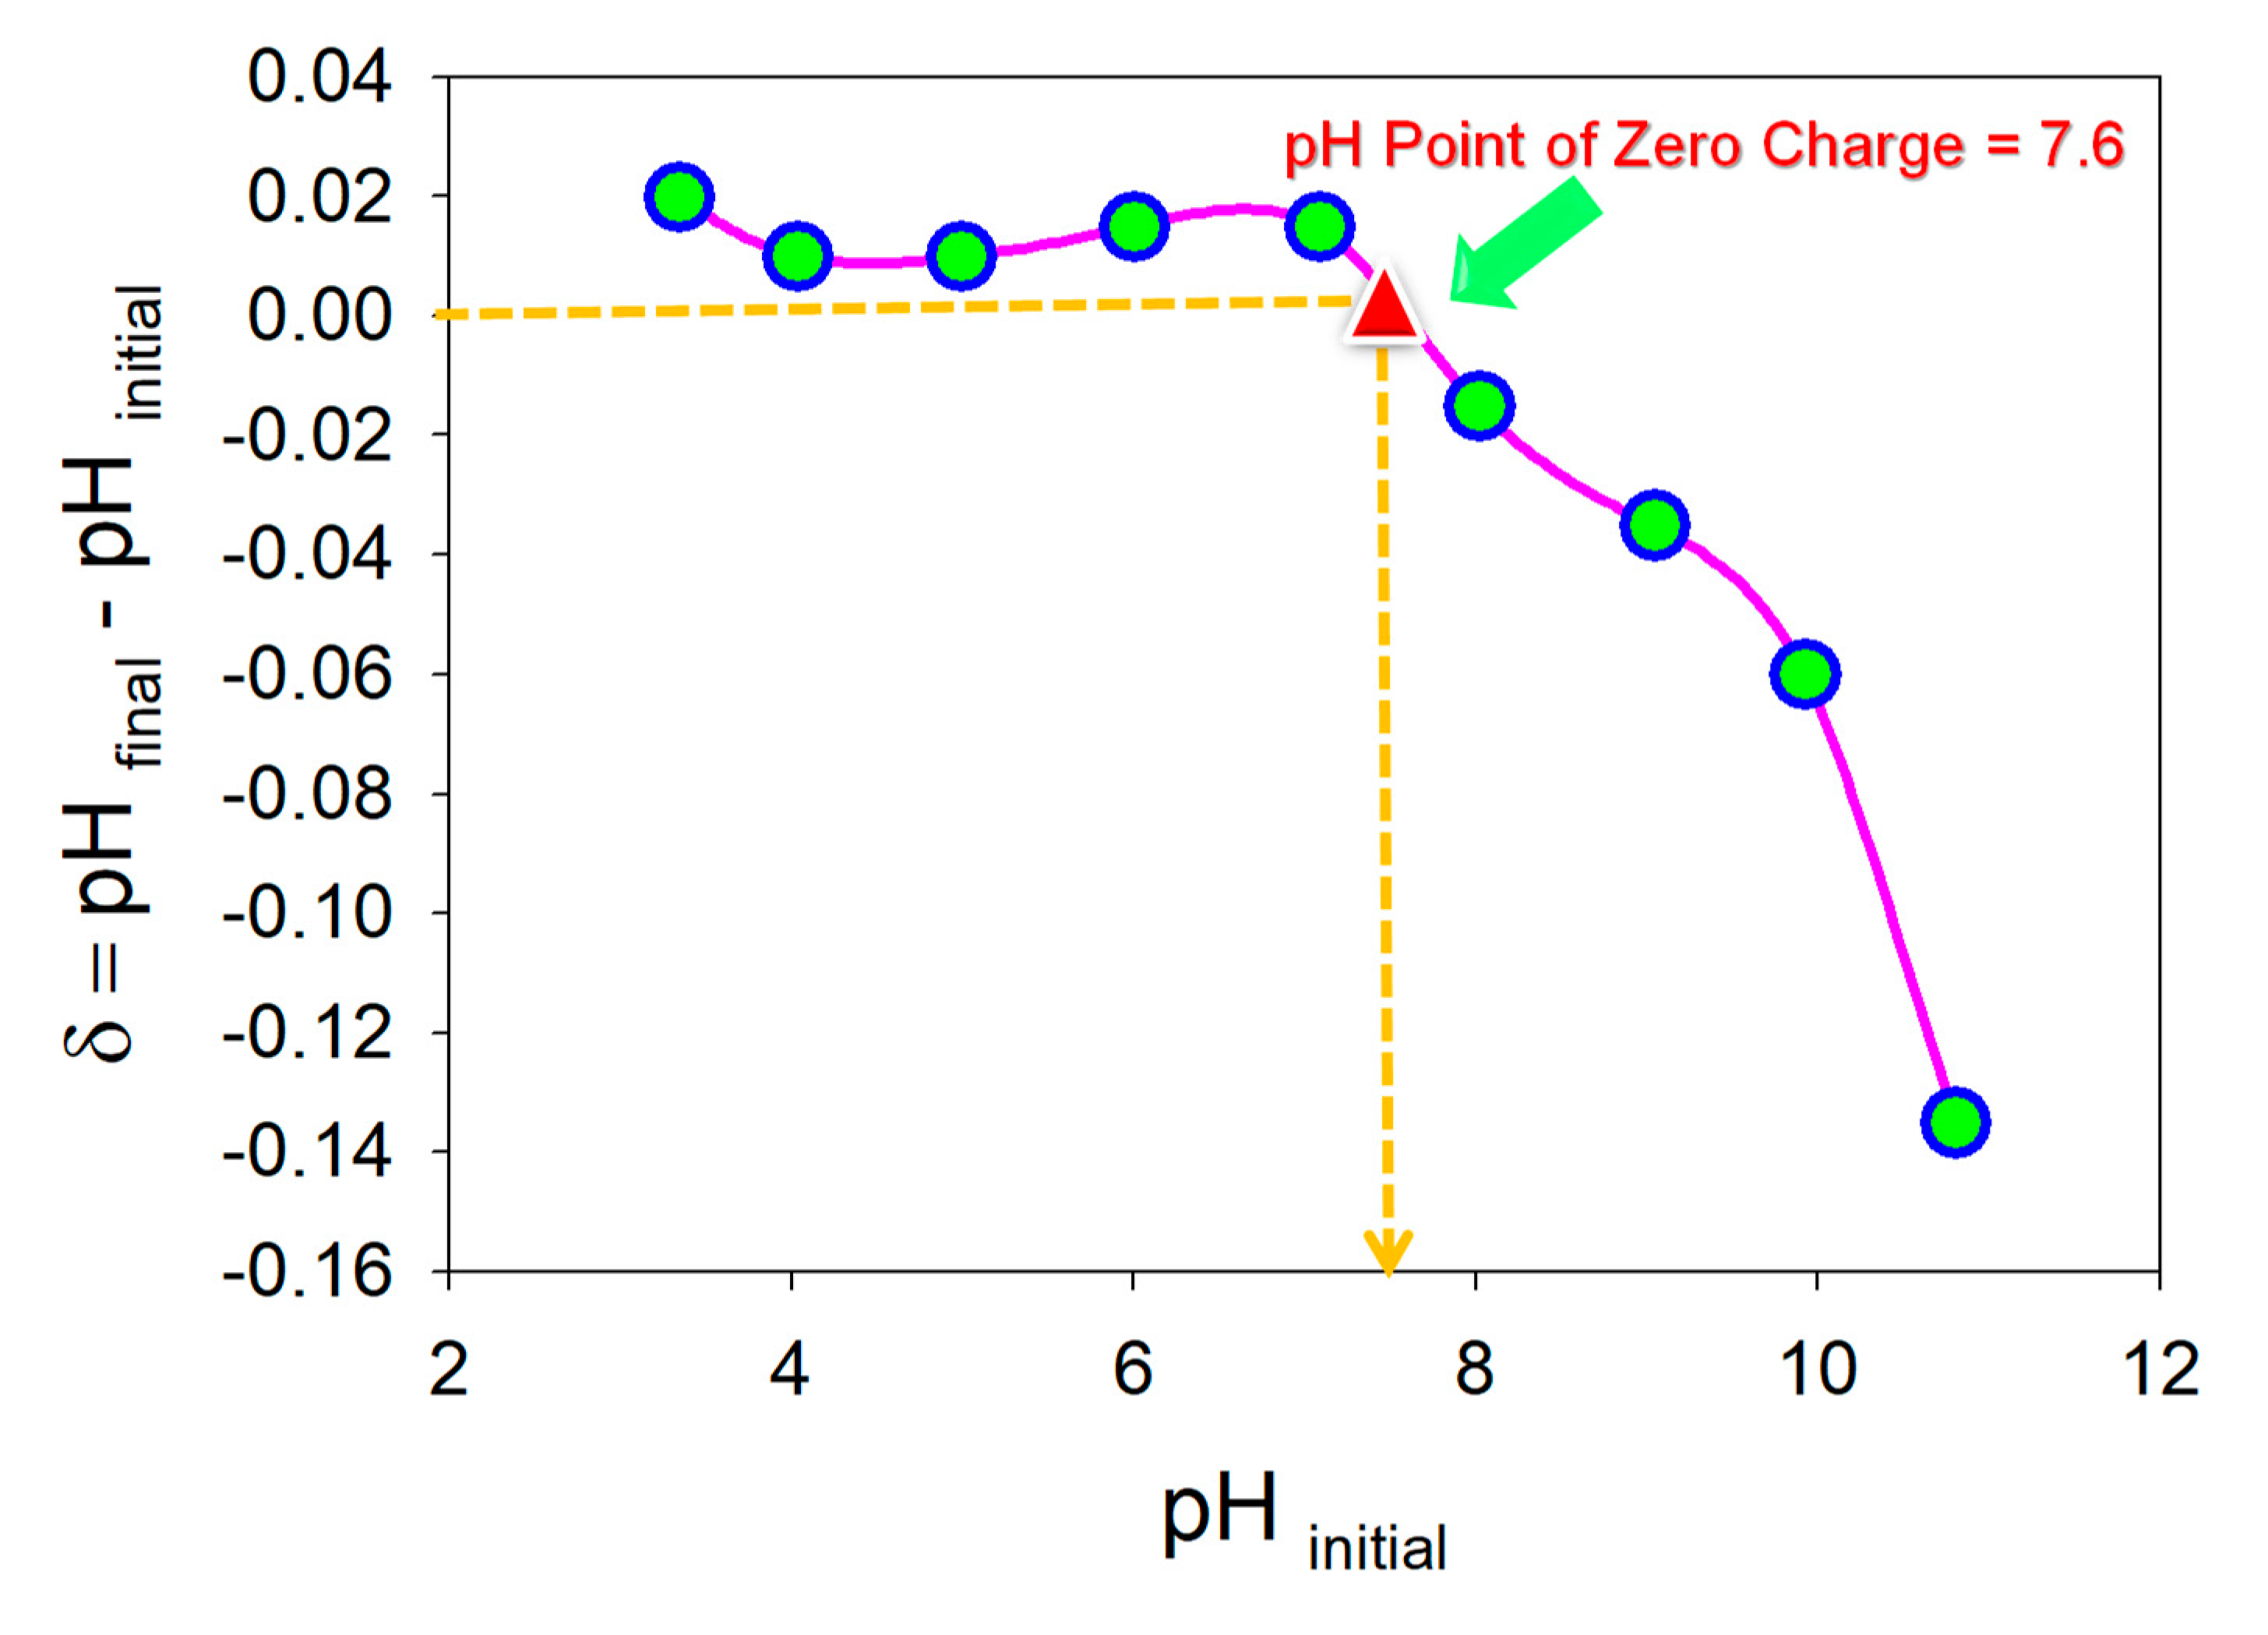
3.2.1. Effect of pH

The biosorption of Cd2+ was influenced by the solution pH (Figure 5). All biosorbents adsorbed large amounts of Cd2+ (95.80%, 95.42%, and 95.80% for A0, A8, and A15) when the solution pH was 8. However, the sorption efficiency declined when the solution pH was lower or higher than 8. A blank test (using solution containing Cd of 1 mg/L without biosorbent added) was done to check precipitation of Cd at different pH levels. Precipitation of Cd ions (e.g., hydroxyl complex compound Cd(OH)2+) started to occur when the solution pH was 9 and was noticeably high when the solution pH was higher.
Further, the pH drift method was conducted to determine the pH of the point of zero charge (pHPZC, pH when the surface of biosorbent has a zero net charge). The pHPZC was found to be 7.6, as noted by its observed inflection point (Figure 6). In this state, a balancing of electrostatic forces between Cd2+ ions and the biosorbent surface occurs. Hereafter, when the pH was greater than pHPZC (pH > 7.6), the total charge on Aphanothece sp. was negative and therefore attracted Cd2+ ions and increased sorption efficiency. At low pH, many hydronium ions are present in the solution, which could compete with Cd2+ for binding with active sites (available functional groups) on the biosorbent surface. Therefore, the optimum pH of 8 was used for further batch sorption experiments.
The sorption capacity obtained in this study (at an optimum pH of 8) was higher compared to that of dried biomass of cyanobacterium Arthrospira (Spirullina) platensis and green microalgae Chlorella vulgaris, which were used to eliminate Ni2+, Zn2+, and Pb2+ in each monometallic biosorption system (pH optimum of 5.0–5.5. and pHPZC were 4.0 and 3.4.) [24]. However, this optimum pH was comparable with study results of Chlorella vulgaris used to remove Cd2+ as reported by Fraile et al. [25]. They suggested that the optimum pH for biosorption was determined by the type of metal cation as well as the available functional groups that adhere on the surface of the biosorbent.

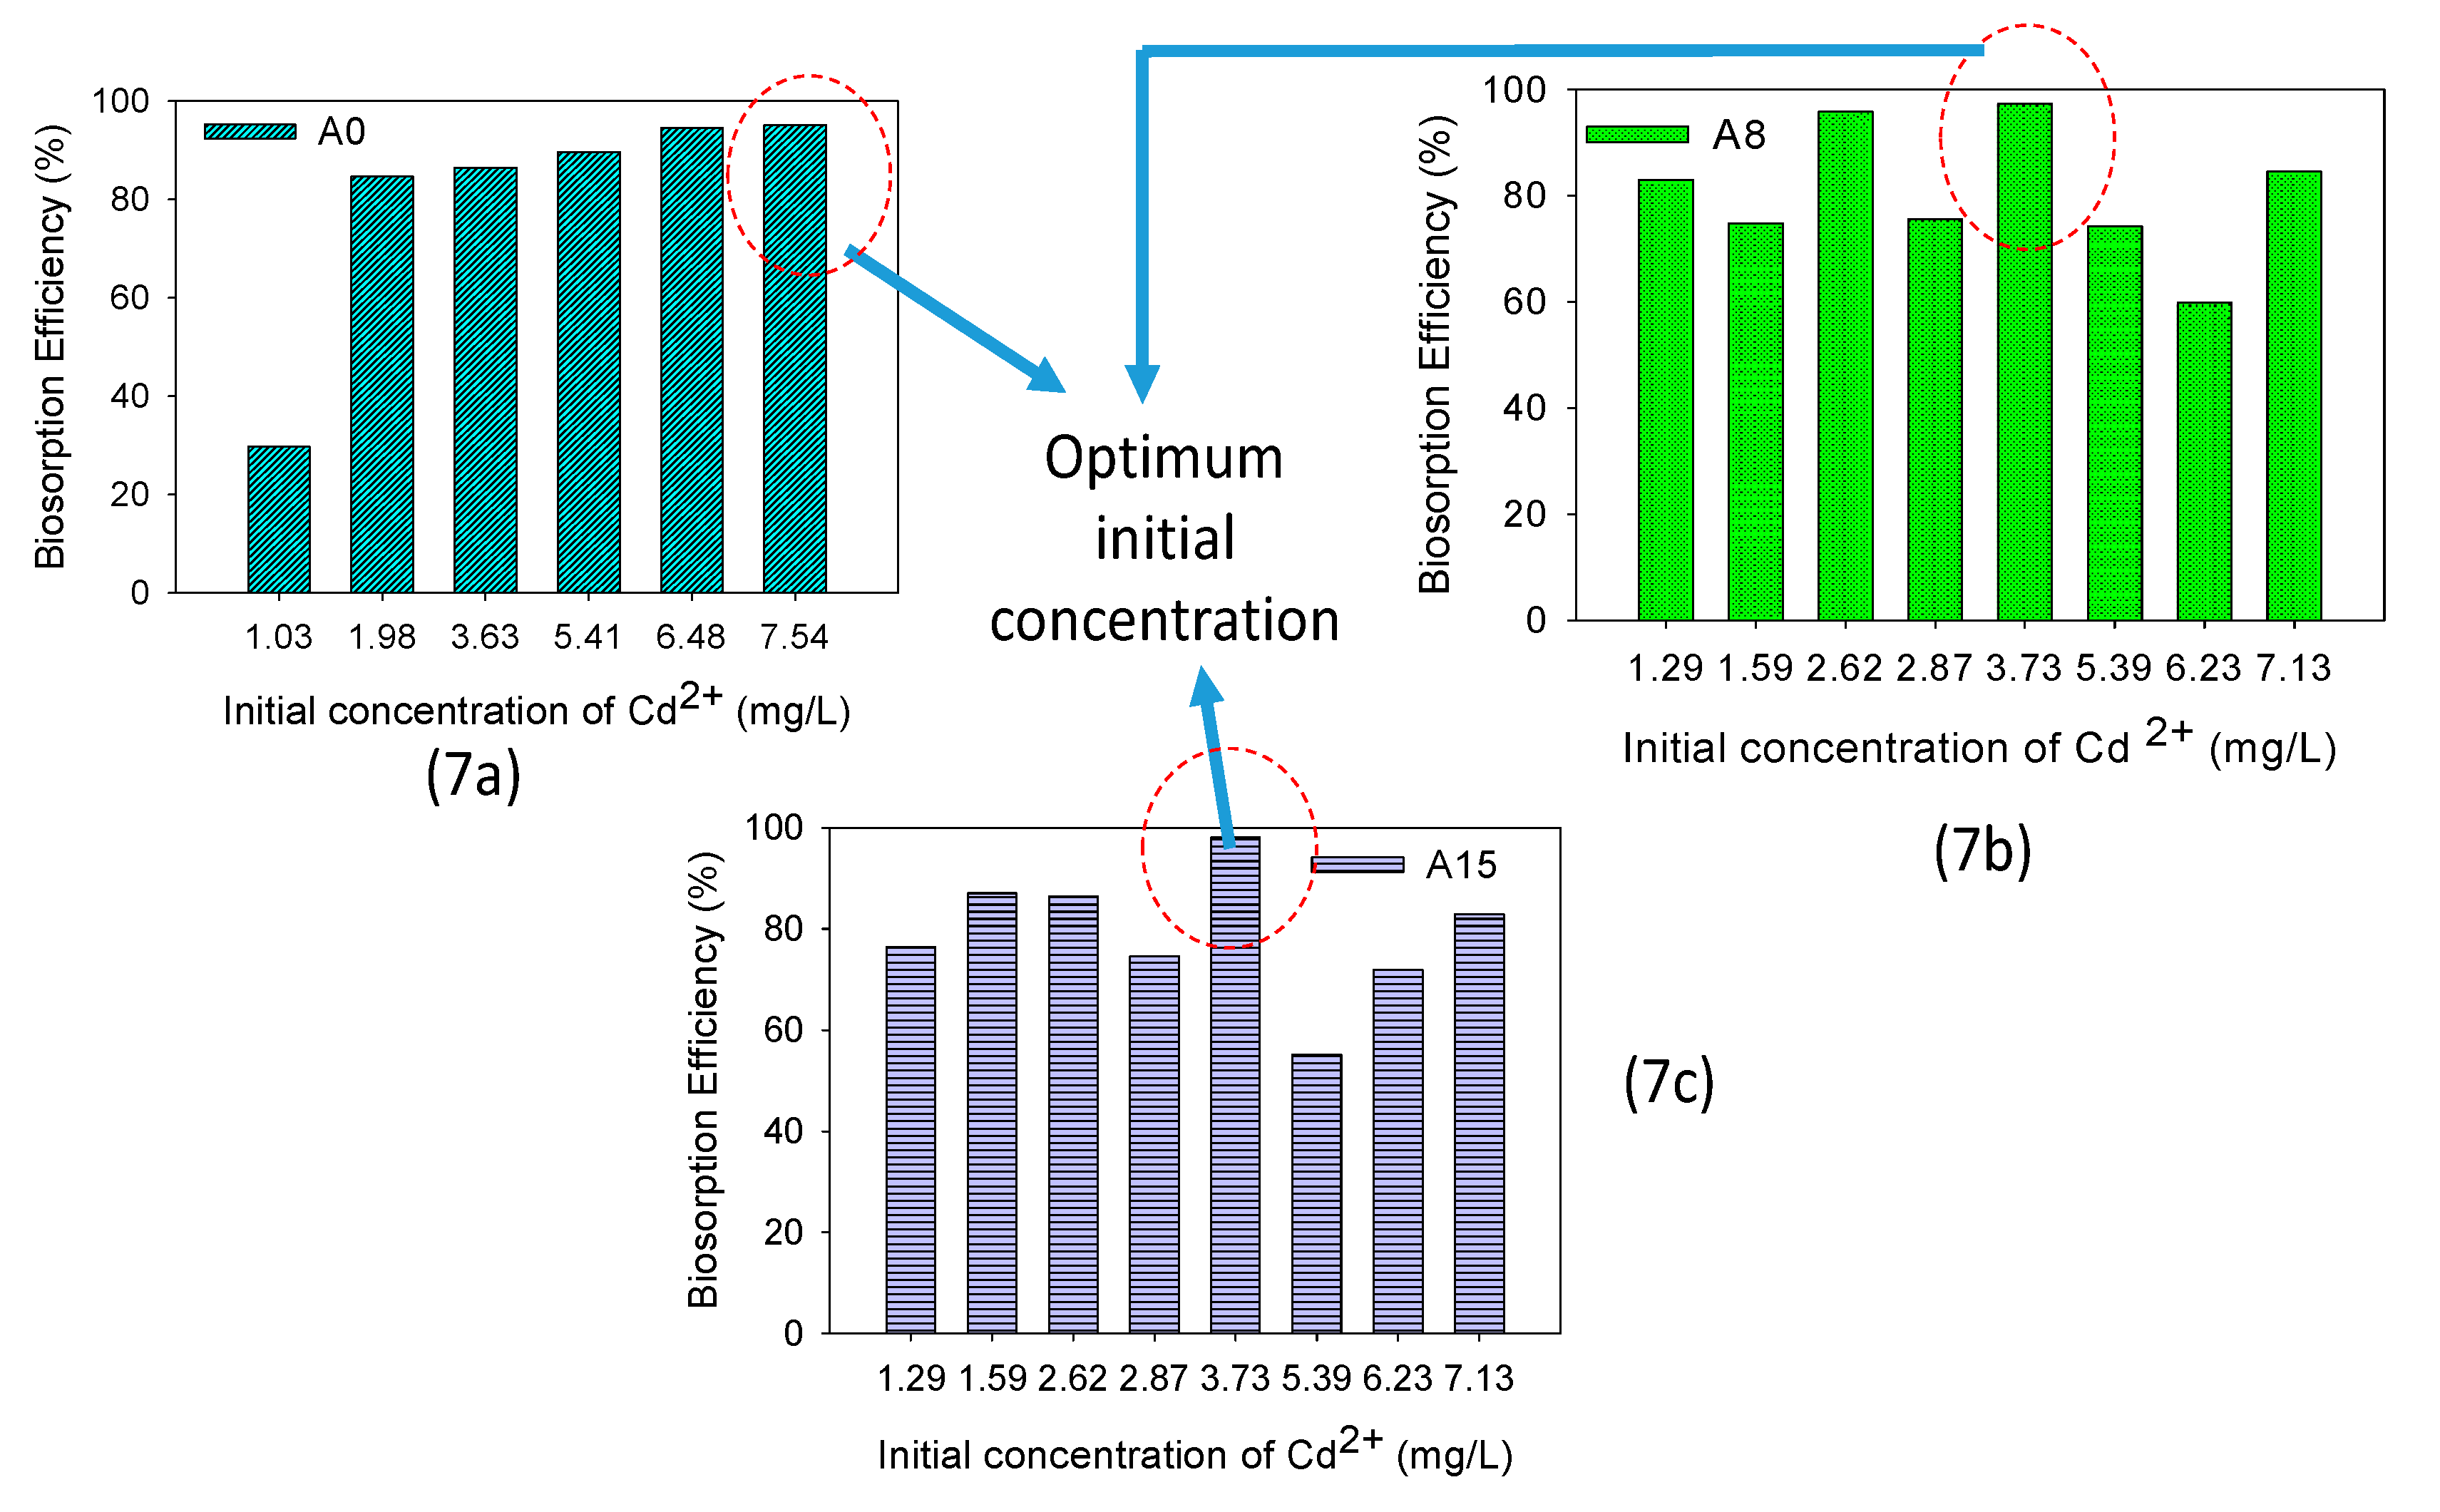
3.2.2. Effect of Cd2+ Initial Concentration

The effect of Cd2+ concentration on sorption was conducted at different initial Cd concentration ranges between 1.03 and 7.54 mg/L. Based on the literature [25,26,27], this range of initial concentration produced mostly inefficient sorption. The highest sorption efficiency was found at Cd2+ initial concentration of 3.73 mg/L; the sorption efficiencies of A0, A8, and A15 biosorbents were 86.42%, 97.32%, and 98.11% (Figure 7). Biosorbent A15 showed the best biosorption efficiency, while in contrast, A0 had the poorest biosorption efficiency. This was probably related to the larger number of functional groups present in A15 than those in A0 and A8, as revealed by FTIR analysis.
The increase in initial concentration enhanced the driving force of the metal ions from bulk solution to biosorbent surface and led to improved sorption capacity. This normal sorption pattern took place in the case of biosorbent of A0 (native biosorbent) (Figure 7a). On the contrary, in the biosorbent of A8 (Figure 7b) and biosorbent of A15 (Figure 7c), the removal efficiency did not rise when the initial concentration increased. This suggests that even though A8 and A15 have more functional groups on their surface than A0, the accessibility on their active sites of A8 and A15 was limited. A similar trend has been observed by other researchers examining Cd sorption using dried biosorbent made from macroalgae Caulerpa fastigiata [13].

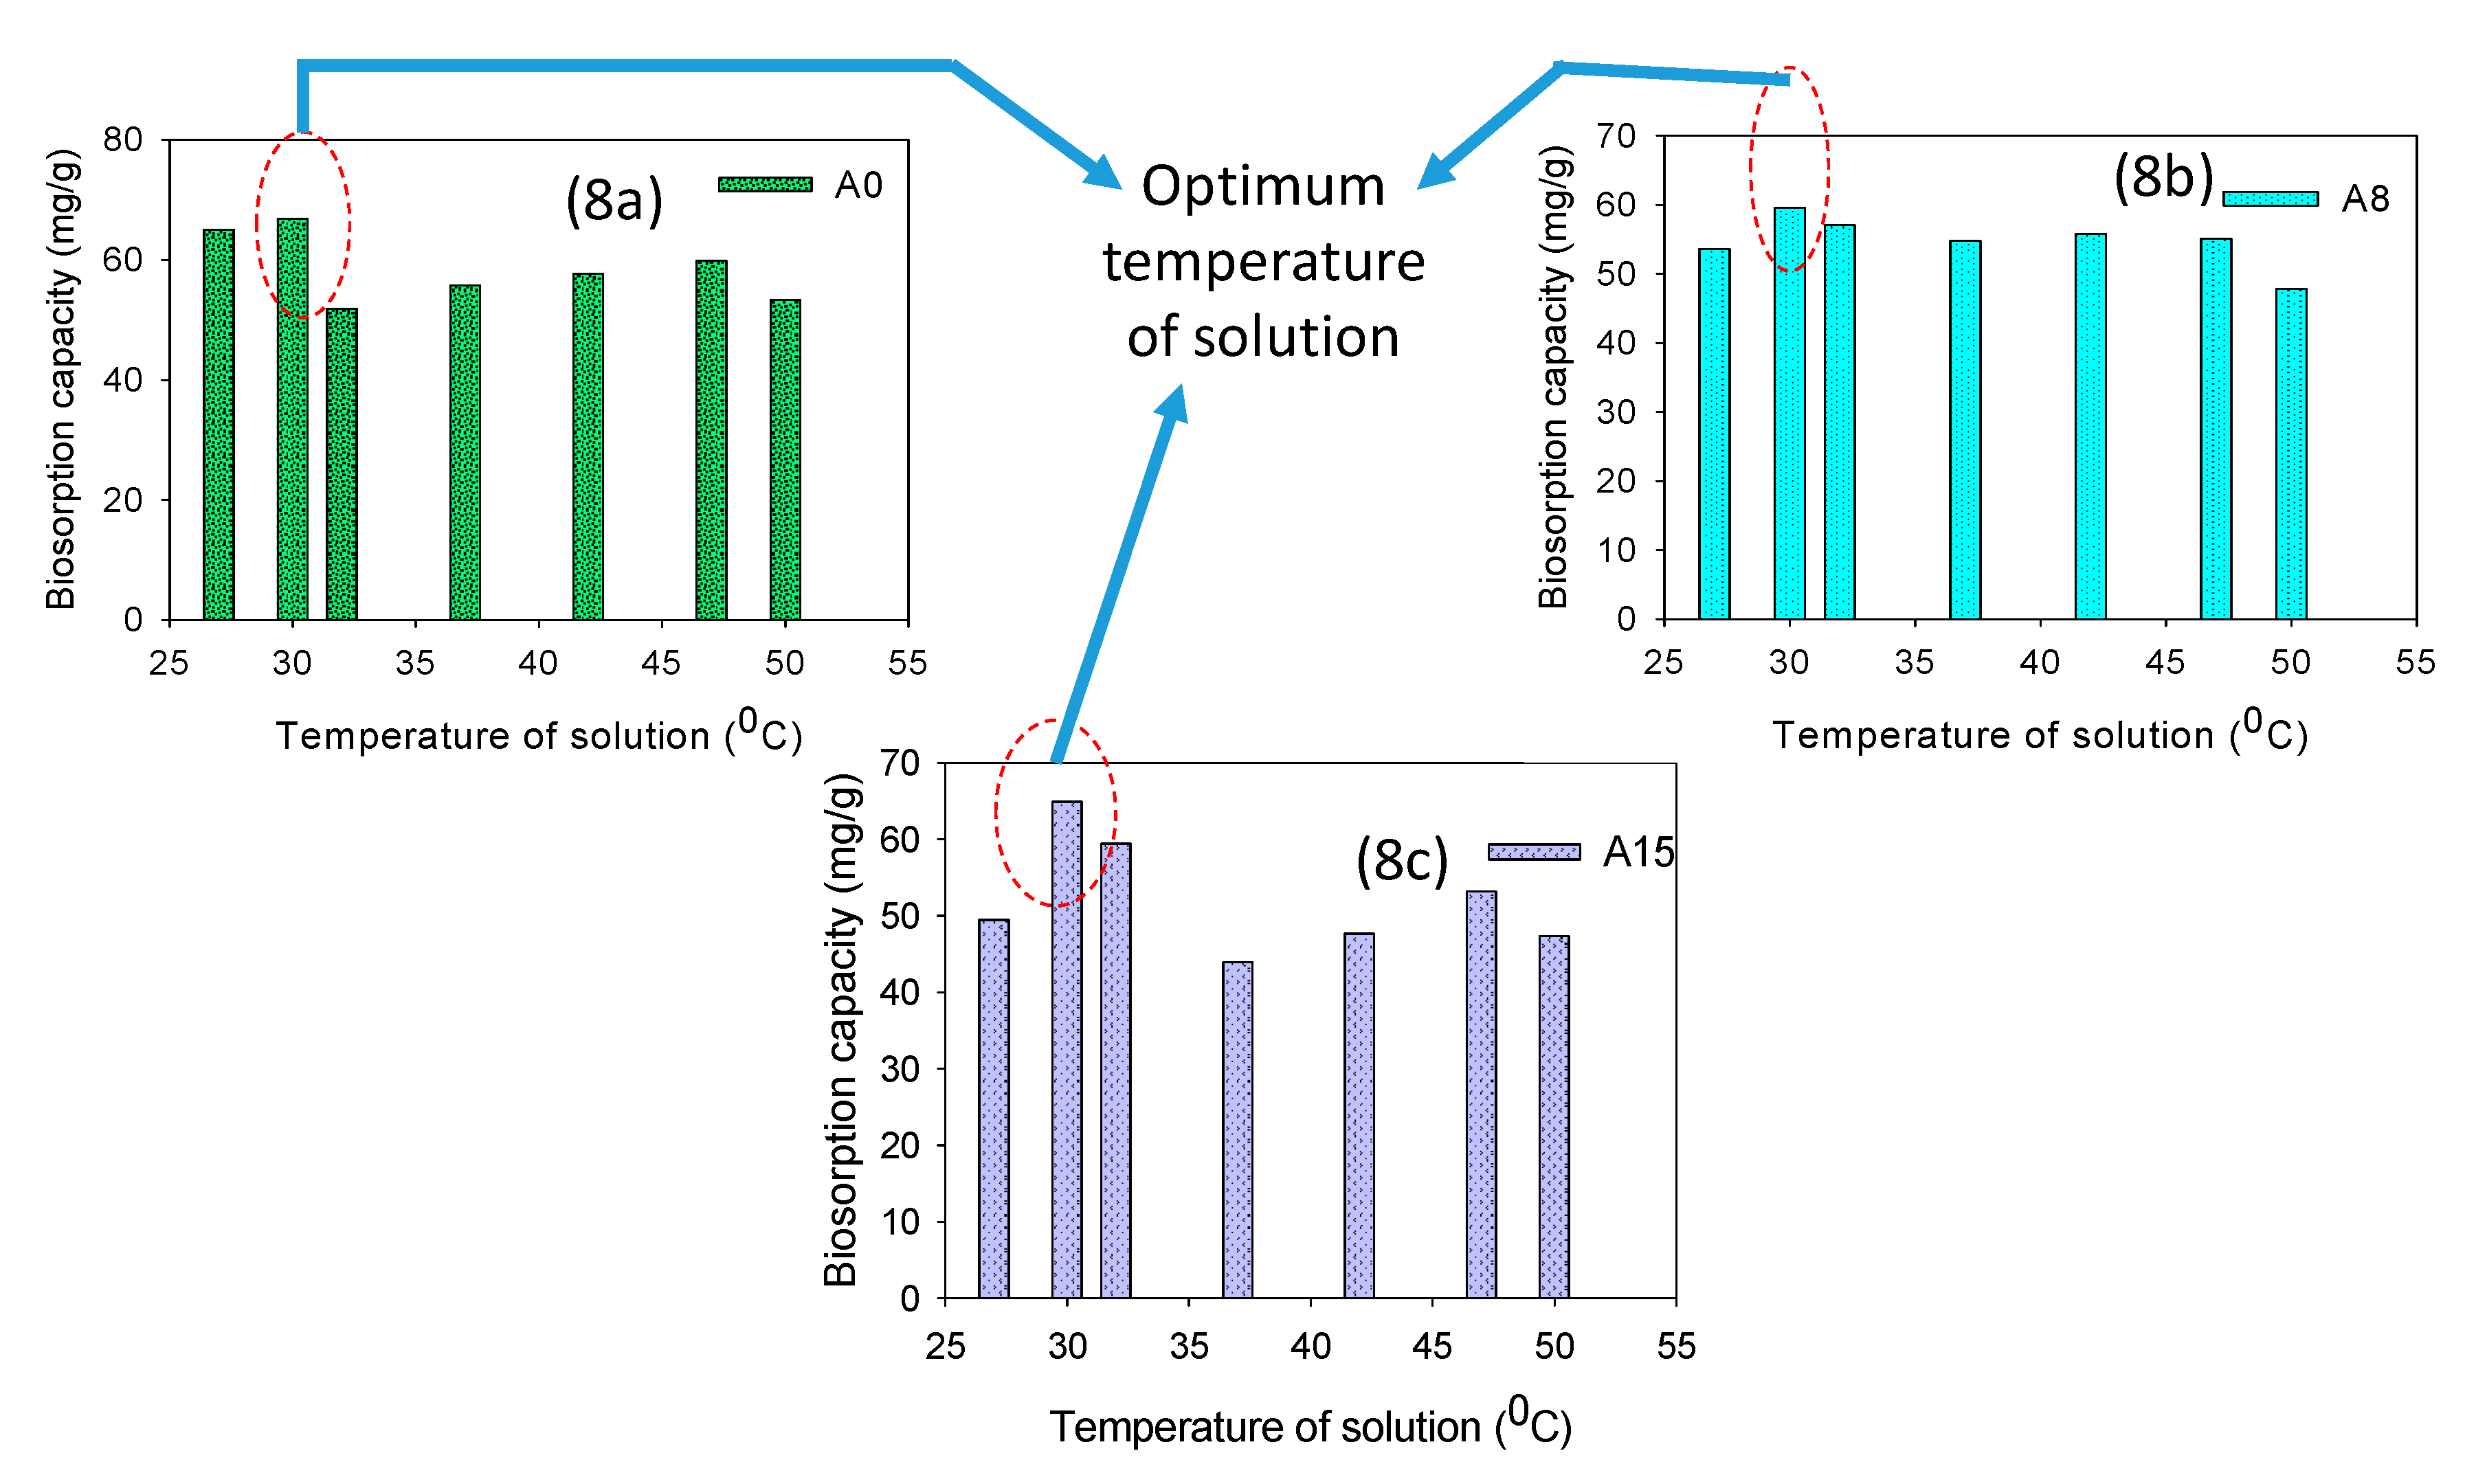
3.2.3. Effect of Temperature and Concentration of Biosorbent

Equilibrium capacity as a function of the temperature of the solution with Cd2+ initial concentration of 8 mg/L was investigated at different solution temperatures ranging between 27–50 °C. The highest sorption capacities of 66.80 mg/g (A0), 57.09 mg/g (A8), and 59.44 mg/g (A15) were observed when the solution temperature was 30 °C (Figure 8). Oppositely, an increase in solution temperature (30 to 50 °C) resulted in less sorption (from 66.80 to 53.33 mg/g for A0, 57.09 to 47.81 mg/g for A8, and 59.44 to 7.34 mg/g for A15). This happened because a high solution temperature destroyed the sorption sites on the biosorbents and may have promoted desorption of bonded metal. A similar trend has been documented for marine macroalgae, namely Caulerpa fastigiata and dried green microalgae Chlorella vulgaris for Cd removal [13,25,28].

3.2.4. Effect of Biosorbent Concentration

The sorption capacity decreased when dried Aphanothece sp. biomass concentration increased (Figure 9). This pattern is similar to dried biosorbent of the green macroalgae Ulva lactuta reported by Sari and Tuzen [15,29]. According to Sari and Tuzen, the decline in sorption capacity was concomitant with the biosorbent concentration caused by the partial aggregation of biosorbent, which reduce the surface area of biosorbent [29]. Hence, fewer functional groups on the biosorbent surface were available for the binding of Cd2+ ions.

3.3. Biosorption Properties of Aphanothece Dried Biosorbent

3.3.1. Sorption Isotherm Models

The isotherm represents the correlation between the amount of adsorbed Cd2+ on biosorbent in equilibrium (qe) and the equilibrium concentration of Cd2+ in aqueous solution (Ce). In this study, three equilibrium isotherm models were examined, namely Langmuir, Freundlich, and Dubinin–Radushkevich (Table 3).
The Langmuir isotherm is a model based on the assumption that metal binding occurs at specific homogenous sites on the biosorbent surface. It can be expressed in linear Equation (5) [15,30] as follows:
C e q e = 1 q m a x b + C e q m a x
where qe (mg/g) = the maximum amount of the metal ion per unit weight of biosorbent to form a complete monolayer on the surface of biosorbent at a certain equilibrium concentration Ce (mg/L); b = Langmuir constant, which is related to the affinity of the binding sites (L/mg); and qmax = the maximum sorption capacity (mg/g), The value of qmax is used for evaluating sorption performance. Plotting between C e q e versus Ce can be used to find the slope 1 q m a x and the intercept 1 b .
The Freundlich isotherm model is based on the sorption of sorbate on a heterogeneous surface [31,32]. In this study, this empirical model is expressed in linear form as follows:
ln q e = ln K F + 1 n C e
where KF and n are equilibrium constants that describe adsorption capacity ((mg/g)/(mg/L))1/n and adsorption intensity, respectively. These isotherm parameters were determined from the slope (1/n) and intercept (ln KF) after plotting ln qe versus Ce.
The Dubinin–Radushkevich (D-R) isotherm model assumes that adsorption occurs on a heterogeneous surface [17]. The linearized equation of D-R isotherm is presented as follows:
l n q e = ln q m a x β ε 2
ε = R T   l n ( 1 + 1 C e )
E = 1 2 β
where β = the activity coefficient constant (mol2/J−2), qmax = the maximum sorption capacity (mol/g), qe = the equilibrium sorption capacity (mol/g), while ε = Polanyi’s potential, T = temperature in K, and R = universal gas constant (J/mol.K). Therefore, by plotting qe against ε 2 , the values of qmax from the intercept and β from the slope can be calculated. The constant of β denotes the mean free energy (E) in kJ/mol of adsorbed cation when transferred from infinity to the surface of the sorbent.
Regarding the coefficient of the determinant (R2), it indicated that the Cd2+ sorption process on the three types of Aphanothece sp. biosorbents obeyed the Langmuir isotherm (R2 = 0.992−0.994) and D-R model (R2 = 0.934−1.000) rather than the Freundlich model (R2 = 0.731−0.904) (Table 3). This confirms that Cd2+ sorption on biosorbents of A0, A8, and A15 was a monolayer sorption process on the homogenous surface. The maximum sorption capacity (qmax, Langmuir) of A15 (60.24 mg/g) was the highest compared to A8 (36.90 mg/g) and A0 (12.24 mg/g). The Langmuir constant (b) related to the free energy of sorption, where the A15 biosorbent elicited the lowest value of b (1.66 L/mg). Therefore, sorption of Cd2+ using A15 proved to be the most spontaneous compared to A0 and A8.
Meanwhile, referring to the D-R isotherm model, the maximum sorption capacity (qmax, D-R) of A15 (0.258 mol/g) was also the highest when compared to that of A8 (0.195 mol/g) and A0 (0.183 mol/g). Those values were higher compared to qmax, Langmuir of the red macroalgae Ceramium virgatum (39.7 mg/g). Conversely, qmax, D-R of Aphanothece sp. was lower than that of Ceramium virgatum (0.470 mmol/g). The free energy (E) also denoted that Cd2+ sorption of the three types of Aphanothece sp. (8.45–12.91 kJ/mol) was categorized as chemisorption since the free energy ranged between 8–18 kJ/mol; this was comparable to Ceramium virgatum (12.71 kJ/mol) as reported by Sari and Tuzen [33]. In general, A15 has more potential than A0 and A8 as a biosorbent for the sorption of Cd2+.

3.3.2. Adsorption Kinetic Models

Implementation of batch sorption in full-scale or continuous processes requires kinetic data for determining the stages of the transport mechanism [34,35,36]. In the present study, pseudo-first-order (PSO-1) and pseudo-second-order kinetic (PSO-2) models have been used to fit the sorption data for providing kinetic data (Table 4).
Pseudo-first-order or the Lagergren kinetic rate equation for the adsorption of a liquid–solid system is derived from solid adsorption capacity. The linearized equation of a pseudo-first-order kinetic model is expressed as follows:
l n ( q e q t ) = ln q e k 1 t
where qe = the amount of solute adsorbed at equilibrium per unit mass of sorbent (mg/g); qt = the amount of solute adsorbed at any given t, and k1 = the rate constant. Fitting between l n ( q e q t ) versus t was used to calculate k1 from the slope.
The pseudo-second-order model can be expressed as a linearized equation as follows:
t q t = 1 k 2 q e 2   + 1 q e   t
where plotting between t q t versus t results in qe and k2.
Table 4 shows that PSO-1 did not fit well with the batch sorption experimental data since R2 was less than 0.950. Meanwhile, the pseudo-second-order kinetic model fitted well with the experimental data and offered the highest R2 value (>0.970) and smaller RSD compared to that of PSO-1. This proved that Cd2+ sorption on dried biomass of Aphanothece sp. followed PSO-2. The equilibrium capacity (qe) of A15 was the highest and is probably related to the number of functional groups posed by A15, as revealed from the FTIR analysis. This finding aligns with the findings reported by Seker et al. [37]. They mentioned that removal of Cd (C0 = 500 mg/L) using cyanobacterium Spirulina platensis followed the PSO-2 model (k2 = 2.01 × 10⁻³ g/µmol.min or equivalent with 0.018 g/mg.min, qe = 51.1 mg/g), which was higher than that in the present study (C0 ranged only between 2.63–6.23 mg/L). Therefore, Aphanothece sp. biosorbents in this study are more advantageous since they can be used to remove Cd from wastewater at a lower initial concentration of Cd.

3.3.3. Thermodynamic Model

The basic criterion for assessing whether the chemical process will proceed or not is the sign and magnitude of Gibbs free energy (ΔG0). The spontaneity of the assessed process represents the negative sign of ΔG0. Therefore, a study on thermodynamic parameters has been carried out on the sorption of Cd2+ onto three types of biosorbent of Aphanothece sp. The thermodynamic parameters consist of changes in standard free energy (ΔG°) in J/mol, enthalpy (ΔH°), and entropy (ΔS°) for any certain adsorption process [38,39]. These were calculated as shown below:
Δ G ° =   R T   ln q e C e
Δ G 0 = Δ H T Δ S
K d = q e C e
where the values of Kd at different temperatures were used based on the Van’t Hoff equation.
ln K d = Δ S R Δ H R T
where Kd is in L/mol, and R is the universal gas constant (8.314 J/mol.K).
The values of ΔH° and ΔS° were calculated from the slope and intercept obtained from the plot of ln Kd against 1/T (Table 5). The ΔG° of all biosorbents in the present study were negative, indicating that sorption proceeded spontaneously. However, the negativity decreased as temperature increased. The ΔH°, as well as entropy ΔS°, were also negative, which signified that sorption occurred exothermically in nature and decreased in its randomness at the solid/solution interface during the sorption process. The values of ΔH° also confirmed that sorption in this study proceeded as chemisorption since the values were between 20.9 and 418.4 kJ/mol. Chemisorption was also observed when using green macroalgae Ulva lactutaH0 = −32.8 kJ/mol) in the study by Sari and Tuzen [29].
This present study showed a better sorption performance compared to other microalgae-based biosorbents, since Aphanothece sp. biosorbents worked at a low initial concentration of Cd2+, and showed a higher sorption capacity (e.g., compared to Spirulina spp. (0.46 mg/g), the maximum sorption capacities of A0, A8, and A15 were 26, 80, and 131 times higher). Compared to cyanobacterium Oscillatoria sp. (qmax = 30.1 mg/g), the sorption capacity of A15 was two times higher than that of cyanobacterium Oscillatoria sp. (Table 6).

3.4. Sorption–Desorption of Biosorbent in Batch Sorption of Cd2+

Reusability test on the dried biosorbent is important for ensuring that the sorption process is economical. In this regard, sorption and desorption experiments were conducted for three cycles to obtain the ratio of desorption to biosorption (D/B). The changes in the ratio of desorption–biosorption were evaluated since this correlates to the reusability potential of the biosorbent [52,53,54]. It was found that the biosorbent of A0 experienced a larger decline in the D/B ratio than that of A8 and A15. The decline in A15 was less than the others (Table 7). The sudden decline probably was due to the loss of functional groups as well as biosorbent mass. It has been reported that a strong acid solution can destroy the functional groups on the surface of biosorbents; therefore, disturbance of the desorption process occurred. However, the desorption process is significant to conduct since it allows recovery of absorbed metals through a simple method (such as electrolysis) for other purposes [29,32,37,55,56].
This study proved that microalgae of Aphanothece sp. (mainly when formed as a dried biosorbent of Aphanothece sp. A15) pose good potential to be used as a double agent, namely as a carbon dioxide biosequestering agent and biosorbent for cadmium cations from aqueous solution. Even this study is limited to a monometallic biosorption system; however, obtained findings are useful as the basis for conducting multimetal biosorption systems (as representing real wastewater).

4. Conclusions

Among the three dried biosorbents of Aphanothece sp. (A0, A8, and A15), A15 exhibited the highest sorption of Cd2+ in aqueous solution (qmax of 12.24, 36.90, and 60.24 mg/g for A0, A8, A15, respectively). The sorption capacity increased when the initial Cd2+ concentration was increased from 1.03 to 7.13 mg/L. The results of FTIR revealed that the amino, carboxylic, hydroxyl, and phosphonate groups took part in Cd2+ binding through an ion exchange mechanism. Langmuir and Dubinin–Radushkevich isotherm models fitted well with experimental data at 30 °C. Mean free energy (from 8.45 to 11.18 kJ/mol) and enthalpy (from 20.9 to 418.4 kJ/mol) confirmed that the sorption process was an example of chemisorption. The kinetic data followed the pseudo-second-order model (k2 range of 2.79 × 10⁻² to 4.54 × 10⁻² g/mg.min) rather than the pseudo-first-order model. Biosorption was exothermic, spontaneous, and tended to be more orderly by the end of the process. Finally, biosorbent of A15 proved to be the most resilient during the three cycles of sorption–desorption. Further research on the biosorption equilibrium and process mechanisms in multimetal systems are required.

Author Contributions

Conceptualization, A.S., A.H., and T.S.; methodology, A.S., A.H., G.S.H., T.S., and M.A.H.J.; software, A.S., A.H., and T.S.; validation, A.S., A.H., G.S.H., and T.S.; formal analysis, A.S.; investigation, A.S.; resources, A.S., T.S., S.V., and H.H.N.; data curation, A.S., M.A.H.J.; writing—original draft preparation, A.S.; writing—review and editing, A.S., A.H., G.S.H., and M.A.H.J.; visualization, A.S.; supervision, A.H., G.S.H., and T.S.; project administration, T.S.; funding acquisition, S.V., H.H.N., and T.S. All authors have read and agreed to the published version of the manuscript.

Funding

The authors are very grateful to the Research Centre for Limnology and the Research Centre for Geotechnology, The Indonesian Institute of Sciences, for providing facilities. Furthermore, the first author acknowledges the financial support provided by the Centre. Collaboration with the University of Technology Sydney is financed by World Class University Program of Institut Teknologi Bandung No 021/WCU-ITB/LL/II/2018.

Conflicts of Interest

The authors declare no conflicts of interest.

References

  1. Naeem, M.A.; Imran, M.; Amjad, M.; Abbas, G.; Tahir, M.; Murtaza, B.; Zakir, A.; Shahid, M.; Bulgariu, L.; Ahmad, I. Batch and Column Scale Removal of Cadmium from Water Using Raw and Acid Activated Wheat Straw Biochar. Water 2019, 11, 1438. [Google Scholar] [CrossRef] [Green Version]
  2. Fernández-González, R.; Martín-Lara, M.Á.; Blázquez, G.; Pérez, A.; Calero, M. Recovering Metals from Aqueous Solutions by Biosorption onto Hydrolyzed Olive Cake. Water 2019, 11, 2519. [Google Scholar] [CrossRef] [Green Version]
  3. Zarei, S.; Niad, M. The isotherm, kinetic and thermodynamic studies of the cadmium uptake by colpomenia sinuosa. Sep. Sci. Technol. 2019, 1–9. [Google Scholar] [CrossRef]
  4. Mohapatra, R.K.; Parhi, P.K.; Pandey, S.; Bindhani, B.K.; Thatoi, H.; Panda, C.R. Active and passive biosorption of Pb(II) using live and dead biomass of marine bacterium Bacillus xiamenensis PbRPSD202: Kinetics and isotherm studies. J. Environ. Manag. 2019, 247, 121–134. [Google Scholar] [CrossRef] [PubMed]
  5. Duy Nguyen, H.; Nguyen Tran, H.; Chao, H.-P.; Lin, C.-C. Activated Carbons Derived from Teak Sawdust-Hydrochars for Efficient Removal of Methylene Blue, Copper, and Cadmium from Aqueous Solution. Water 2019, 11, 2581. [Google Scholar] [CrossRef] [Green Version]
  6. Kumar, K.S.; Dahms, H.; Won, E.; Lee, J.; Shin, K. Microalgae—A promising tool for heavy metal remediation. Ecotoxicol. Environ. Saf. 2015, 113, 329–352. [Google Scholar] [CrossRef]
  7. Gonçalves, A.L.; Rodrigues, C.M.; Pires, J.C.M.; Simões, M. The effect of increasing CO2 concentrations on its capture, biomass production and wastewater bioremediation by microalgae and cyanobacteria. Algal Res. 2016, 14, 127–136. [Google Scholar] [CrossRef]
  8. Ho, S.-H.; Chen, C.-Y.; Lee, D.-J.; Chang, J.-S. Perspectives on microalgal CO2-emission mitigation systems—A review. Biotechnol. Adv. 2011, 29, 189–198. [Google Scholar] [CrossRef]
  9. Sumada, K. Study on the efficiently industrial electroplating waste water treatment installation. J. Teknik Kimia 2006, 1, 26–36. (In Indonesian) [Google Scholar]
  10. Jacob-Lopes, E.; Gimenes Scoparo, C.H.; Queiroz, M.I.; Franco, T.T. Biotransformations of carbon dioxide in photobioreactors. Energy Convers. Manag. 2010, 51, 894–900. [Google Scholar] [CrossRef]
  11. Fernandes, B.D.; Mota, A.; Teixeira, J.A.; Vicente, A.A. Continuous cultivation of photosynthetic microorganisms: Approaches, applications and future trends. Biotechnol. Adv. 2015, 33, 1228–1245. [Google Scholar] [CrossRef] [Green Version]
  12. Markou, G.; Georgakakis, D. Cultivation of filamentous cyanobacteria (blue-green algae) in agro-industrial wastes and wastewaters: A review. Appl. Energy 2011, 88, 3389–3401. [Google Scholar] [CrossRef]
  13. Apiratikul, R.; Pavasant, P. Batch and column studies of biosorption of heavy metals by Caulerpa lentillifera. Bioresour. Technol. 2008, 99, 2766–2777. [Google Scholar] [CrossRef] [PubMed]
  14. Luna, A.S.; Costa, A.L.H.; da Costa, A.C.A.; Henriques, C.A. Competitive biosorption of cadmium(II) and zinc(II) ions from binary systems by Sargassum filipendula. Bioresour. Technol. 2010, 101, 5104–5111. [Google Scholar] [CrossRef] [PubMed]
  15. Areco, M.M.; Hanela, S.; Duran, J.; dos Santos Afonso, M. Biosorption of Cu(II), Zn(II), Cd(II) and Pb(II) by dead biomasses of green alga Ulva lactuca and the development of a sustainable matrix for adsorption implementation. J. Hazard. Mater. 2012, 213–214, 123–132. [Google Scholar] [CrossRef]
  16. Dirbaz, M.; Roosta, A. Adsorption, kinetic and thermodynamic studies for the biosorption of cadmium onto microalgae Parachlorella sp. J. Environ. Chem. Eng. 2018, 6, 2302–2309. [Google Scholar] [CrossRef]
  17. Abdel -Aty, A.M.; Ammar, N.S.; Abdel Ghafar, H.H.; Ali, R.K. Biosorption of cadmium and lead from aqueous solution by fresh water alga Anabaena sphaerica biomass. J. Adv. Res. 2013, 4, 367–374. [Google Scholar] [CrossRef] [Green Version]
  18. Anastopoulos, I.; Kyzas, G.Z. Progress in batch biosorption of heavy metals onto algae. J. Mol. Liq. 2015, 209, 77–86. [Google Scholar] [CrossRef]
  19. Satya, A.; Sulawesty, F.; Harimawan, A.; Setiadi, T. Correlation of Aquatic Parameters to the Cadmium Bioaccumulation Capability onto Microalgae Biomass in an Urban Lake. J. Water Sustain. Univ. Technol. Syd. Xi’an Univ. Archit. Technol. 2018, 8, 59–72. [Google Scholar] [CrossRef]
  20. Ghaedi, M.; Hajati, S.; Karimi, F.; Barazesh, B.; Ghezelbash, G. Equilibrium, kinetic and isotherm of some metal ion biosorption. J. Ind. Eng. Chem. 2013, 19, 987–992. [Google Scholar] [CrossRef]
  21. Geetha, P.; Latha, M.S.; Pillai, S.S.; Koshy, M. Nanoalginate based biosorbent for the removal of lead ions from aqueous solutions: Equilibrium and kinetic studies. Ecotoxicol. Environ. Saf. 2015, 122, 17–23. [Google Scholar] [CrossRef] [PubMed]
  22. Gupta, V.K.; Rastogi, A. Equilibrium and kinetic modelling of cadmium(II) biosorption by nonliving algal biomass Oedogonium sp. from aqueous phase. J. Hazard. Mater. 2008, 153, 759–766. [Google Scholar] [CrossRef] [PubMed]
  23. Rajesh, V.; Kumar, A.S.K.; Rajesh, N. Biosorption of cadmium using a novel bacterium isolated from an electronic industry effluent. Chem. Eng. J. 2014, 235, 176–185. [Google Scholar] [CrossRef]
  24. Ferreira, L.S.; Rodrigues, M.S.; de Carvalho, J.C.M.; Lodi, A.; Finocchio, E.; Perego, P.; Converti, A. Adsorption of Ni2+, Zn2+ and Pb2+ onto dry biomass of Arthrospira (Spirulina) platensis and Chlorella vulgaris. I. Single metal systems. Chem. Eng. J. 2011, 173, 326–333. [Google Scholar] [CrossRef]
  25. Fraile, A.; Penche, F.; Gonzalez, F.; Blazquez, M.; Munoz, J.; Ballester, A. Biosorption of Copper, zinc, cadmium and nickel by Chlorella vulgaris. Chem. Ecol. 2005, 21, 61–75. [Google Scholar] [CrossRef]
  26. Freitas, O.M.M.; Martins, R.J.E.; Delerue-Matos, C.M.; Boaventura, R.A.R. Removal of Cd(II), Zn(II) and Pb(II) from Aqueous Solutions by Brown Marine Macro Algae: Kinetic Modelling. J. Hazard. Mater. 2008, 153, 493–501. [Google Scholar] [CrossRef] [Green Version]
  27. He, J.; Chen, J.P. A comprehensive review on biosorption of heavy metals by algal biomass: Materials, performances, chemistry, and modeling simulation tools. Bioresour. Technol. 2014, 160, 67–78. [Google Scholar] [CrossRef]
  28. Bulgariu, D.; Bulgariu, L. Potential use of alkaline treated algae waste biomass as sustainable biosorbent for clean recovery of cadmium(II) from aqueous media: Batch and column studies. J. Clean. Prod. 2016, 112, 4525–4533. [Google Scholar] [CrossRef]
  29. Sari, A.; Tuzen, M. Biosorption of Pb(II) and Cd(II) from aqueous solution using green alga (Ulva lactuta) biomass. J. Hazard. Mater. 2008, 152, 302–308. [Google Scholar] [CrossRef]
  30. Bakatula, E.N.; Cukrowska, E.M.; Weiersbye, I.M.; Mihaly-Cozmuta, L.; Peter, A.; Tutu, H. Biosorption of trace elements from aqueous systems in gold mining sites by the filamentous green algae (Oedogonium sp.). J. Geochem. Explor. 2014, 144, 492–503. [Google Scholar] [CrossRef]
  31. Gupta, V.K.; Rastogi, A. Sorption and desorption studies of chromium(VI) from nonviable cyanobacterium Nostoc muscorum biomass. J. Hazard. Mater. 2008, 154, 347–354. [Google Scholar] [CrossRef] [PubMed]
  32. Pérez-Rama, M.; Torres, E.; Suárez, C.; Herrero, C.; Abalde, J. Sorption isotherm studies of Cd(II) ions using living cells of the marine microalga Tetraselmis suecica (Kylin) Butch. J. Environ. Manag. 2010, 91, 2045–2050. [Google Scholar] [CrossRef] [PubMed] [Green Version]
  33. Sarı, A.; Tuzen, M. Biosorption of cadmium(II) from aqueous solution by red algae (Ceramium virgatum): Equilibrium, kinetic and thermodynamic studies. J. Hazard. Mater. 2008, 157, 448–454. [Google Scholar] [CrossRef] [PubMed]
  34. Sathvika, T.; Manasi; Rajesh, V.; Rajesh, N. Adsorption of chromium supported with various column modelling studies through the synergistic influence of Aspergillus and cellulose. J. Environ. Chem. Eng. 2016, 4, 3193–3204. [Google Scholar] [CrossRef]
  35. Sari, A.; Mendil, D.; Tuzen, M.; Soylak, M. Biosorption of Cd(II) and Cr(III) from aqueous solution by moss (Hylocomium splendens) biomass: Equilibrium, kinetic and thermodynamic studies. Chem. Eng. J. 2008, 144, 1–9. [Google Scholar] [CrossRef]
  36. Sarada, B.; Prasad, M.K.; Kumar, K.K.; Ramachandra Murthy, C.V. Cadmium removal by macro algae Caulerpa fastigiata: Characterization, kinetic, isotherm and thermodynamic studies. J. Environ. Chem. Eng. 2014, 2, 1533–1542. [Google Scholar] [CrossRef]
  37. Şeker, A.; Shahwan, T.; Eroğlu, A.E.; Yılmaz, S.; Demirel, Z.; Dalay, M.C. Equilibrium, thermodynamic and kinetic studies for the biosorption of aqueous lead(II), cadmium(II) and nickel(II) ions on Spirulina platensis. J. Hazard. Mater. 2008, 154, 973–980. [Google Scholar] [CrossRef] [Green Version]
  38. Blanes, P.S.; Bordoni, M.E.; González, J.C.; García, S.I.; Atria, A.M.; Sala, L.F.; Bellú, S.E. Application of soy hull biomass in removal of Cr(VI) from contaminated waters. Kinetic, thermodynamic and continuous sorption studies. J. Environ. Chem. Eng. 2016, 4, 516–526. [Google Scholar] [CrossRef]
  39. Bhatnagar, A.; Vilar, V.J.P.; Botelho, C.M.S.; Boaventura, R.A.R. Coconut-based biosorbents for water treatment—A review of the recent literature. Adv. Colloid Interface Sci. 2010, 160, 1–15. [Google Scholar] [CrossRef]
  40. Chojnacka, K.; Chojnacki, A.; Górecka, H. Trace element removal by Spirulina sp. from copper smelter and refinery effluents. Hydrometallurgy 2004, 73, 147–153. [Google Scholar] [CrossRef]
  41. Chojnacka, K. Biosorption and bioaccumulation—the prospects for practical applications. Environ. Int. 2010, 36, 299–307. [Google Scholar] [CrossRef] [PubMed]
  42. Sandau, E.; Sandau, P.; Pulz, O.; Zimmermannn, M. Heavy metal sorption by marine algae and algal by product. Acta Biotechnol. 1996, 16, 103–119. [Google Scholar] [CrossRef]
  43. Monteiro, C.M.; Castro, P.M.; Malcata, F.X. Cadmium Removal by Two Strains of Desmodesmus pleimorphus cells. Water Air Soil Pollut. 2010, 208, 17–27. [Google Scholar] [CrossRef]
  44. Tüzün, İ.; Bayramoğlu, G.; Yalçın, E.; Başaran, G.; Çelik, G.; Arıca, M.Y. Equilibrium and kinetic studies on biosorption of Hg(II), Cd(II) and Pb(II) ions onto microalgae Chlamydomonas reinhardtii. J. Environ. Manag. 2005, 77, 85–92. [Google Scholar] [CrossRef]
  45. Schmitt, D.; Muller, A.; Csogor, Z.; Frimmel, F.; Posten, C. The adsorption kinetics of metal ions onto different microalgae and siliceous earth. Water Resour. 2001, 35, 779–785. [Google Scholar] [CrossRef]
  46. Singh, A.; Mehta, S.; Gaur, J. Removal of heavy metals from aqueous solution by common freshwater filamentous algae. World J. Microbiol. Biotechnol. 2007, 23, 1115–1120. [Google Scholar] [CrossRef]
  47. Pérez-Rama, M.; Abalde Alonso, J.; Herrero López, C.; Torres Vaamonde, E. Cadmium removal by living cells of the marine microalga Tetraselmis suecica. Bioresour. Technol. 2002, 84, 265–270. [Google Scholar] [CrossRef]
  48. Chen, C.-Y.; Chang, H.-W.; Kao, P.-C.; Pan, J.-L.; Chang, J.-S. Biosorption of cadmium by CO2-fixing microalga Scenedesmus obliquus CNW-N. Bioresour. Technol. 2012, 105, 74–80. [Google Scholar] [CrossRef]
  49. Katırcıoğlu, H.; Aslım, B.; Rehber Türker, A.; Atıcı, T.; Beyatlı, Y. Removal of cadmium(II) ion from aqueous system by dry biomass, immobilized live and heat-inactivated Oscillatoria sp. H1 isolated from freshwater (Mogan Lake). Bioresour. Technol. 2008, 99, 4185–4191. [Google Scholar] [CrossRef]
  50. Rathinam, A.; Maharshi, B.; Janardhanan, S.K.; Jonnalagadda, R.R.; Nair, B.U. Biosorption of cadmium metal ion from simulated wastewaters using Hypnea valentiae biomass: A kinetic and thermodynamic study. Bioresour. Technol. 2010, 101, 1466–1470. [Google Scholar] [CrossRef]
  51. Sarı, A.; Tuzen, M. Biosorption of total chromium from aqueous solution by red algae (Ceramium virgatum): Equilibrium, kinetic and thermodynamic studies. J. Hazard. Mater. 2008, 160, 349–355. [Google Scholar] [CrossRef] [PubMed]
  52. Akar, T.; Celik, S.; Gorgulu Ari, A.; Tunali Akar, S. Removal of Pb2+ ions from contaminated solutions by microbial composite: Combined action of a soilborne fungus Mucor plumbeus and alunite matrix. Chem. Eng. J. 2013, 215–216, 626–634. [Google Scholar] [CrossRef]
  53. Kumar, D.; Gaur, J.P. Metal biosorption by two cyanobacterial mats in relation to pH, biomass concentration, pretreatment and reuse. Bioresour. Technol. 2011, 102, 2529–2535. [Google Scholar] [CrossRef] [PubMed]
  54. Luo, J.-M.; Xiao, X.; Luo, S.-L. Biosorption of cadmium(II) from aqueous solutions by industrial fungus Rhizopus cohnii. Trans. Nonferrous Metals Soc. China 2010, 20, 1104–1111. [Google Scholar] [CrossRef]
  55. Rangsayatorn, N.; Upatham, E.S.; Kruatrachue, M.; Pokethitiyook, P.; Lanza, G.R. Phytoremediation potential of Spirulina (Arthrospira) platensis: Biosorption and toxicity studies of cadmium. Environ. Pollut. 2002, 119, 45–53. [Google Scholar] [CrossRef]
  56. Rodrigues, M.S.; Ferreira, L.S.; Carvalho, J.C.M.d.; Lodi, A.; Finocchio, E.; Converti, A. Metal biosorption onto dry biomass of Arthrospira (Spirulina) platensis and Chlorella vulgaris: Multi-metal systems. J. Hazard. Mater. 2012, 217–218, 246–255. [Google Scholar] [CrossRef] [PubMed]
Figure 1. The schematic batch mode experiment to assess the efficiency of biosorbent (Aphanothece sp.) for Cd2+ ion sorption.
Water 12 00264 g001
Figure 2. SEM images of three types of dried biosorbent Aphanothece sp. before and after sorption of Cd2+ at a magnification of 50×.
Water 12 00264 g002
Figure 3. EDX spectra of dried biosorbent of Aphanothece sp. (a) before sorption and (b) after sorption using initial Cd concentration of 3 mg/L.
Water 12 00264 g003
Figure 4. Spectra of dried biosorbent Aphanothece sp. types A0, A8, and A15 before and after Cd2+ sorption.
Water 12 00264 g004
Figure 5. Effect of pH on sorption efficiency of Cd2+ onto dried biosorbent of Aphanothece sp. (W0 = 0.1 g/L, C0 = 1 mg/L, tcontacts = 60 min, T = 30 °C, pH = 8).
Water 12 00264 g005
Figure 6. Point of zero charge plot (pHPZC) of Aphanothece sp. (W0 = 0.1 g/L, C0 = 1 mg/L, tcontacts = 60 min, T = 30 °C).
Water 12 00264 g006
Figure 7. Effect of Cd 2+ initial concentration on sorption efficiency of Cd2+ onto dried biosorbent of Aphanothece sp. for (a) adsorbent A0 (CO2 enrichment of 0.04%), (b) adsorbent A8 (CO2 enrichment of 8%) and (c) adsorbent A15 (CO2 enrichment of 15%) (W0 = 0.1 g/L, tcontacts = 60 min, T = 30 °C).
Water 12 00264 g007
Figure 8. Effect of temperature of the solution on sorption efficiency of Cd2+ onto dried biosorbent of Aphanothece sp. for (a) adsorbent A0 (CO2 enrichment of 0.04%), (b) adsorbent A8 (CO2 enrichment of 8%) and (c) adsorbent A15 (CO2 enrichment of 15%) (W0 = 0.1 g/L, C0 = 7.99 mg/L, tcontact = 60 min).
Water 12 00264 g008
Figure 9. Effect of biosorbent concentration on sorption efficiency of Cd2+ onto dried biosorbent of Aphanothece sp. for (a) adsorbent A0 (CO2 enrichment of 0.04%), (b) adsorbent A8 (CO2 enrichment of 8%) and (c) adsorbent A15 (CO2 enrichment of 15%) (C0 = 7.99 mg/L, tcontacts = 60 min, T = 30 °C).
Water 12 00264 g009
Table 1. The observed shifting main peaks of FTIR spectra for biosorbent.
Functional GroupsThe Peak at Wavenumber (cm−1)
Pure A0A0-CdPure A8A8-CdPure A15A15-Cd
Disulfides (S–S), Sulfur ether (SOR)671.23667.37536.21526.57536.21524.64
Thio carbonyl (C=S), Sulfoxide (S=O)1043.491039.631078.211076.281076.281072.42
Carbonyl (C–O) on Alcohols and Carboxylates1544.981539.201548.841541.121544.981539.20
Amines (tertiary, secondary, and primary)2926.012924.092924.092921.092924.092921.09
Carboxylates (C=O)1654.921651.071654.921652.921654.921651.07
Hydroxyls (O–H)3292.493282.843292.493289.433292.493289.42
Table 2. The BET analysis results for the three types of biosorbent (average particle diameter size range of 40.0 µm, in the range of 15.5 to 82.6 µm).
BiosorbentEnrichment of CO2 During CultivationBET Surface Area (m2/g)Average Pore Diameter (Å)Pore Volume (cm3/gram)
A00.04%0.571271.553.88 × 10−3
A88.00%1.846102.704.74 × 10−3
A1515.00%1.735111.294.74 × 10−3
Table 3. Parameters of three linearized isotherm models regarding the three types of Aphanothece sp. biosorbents on batch sorption experiments (T = 30 °C, tcontacts = 60 min, pH = 8, biosorbent concentration of 0.1 g/L, and C0 = 2.62–6.23 mg/L).
BiosorbentLangmuir ConstantsFreundlich ConstantsDubinin–Radushkevich Constants
qmax (mg/g)b (L/mg)R2KF (mg/g(L/g)1/n)nR2qmax (mol/g)E (kJ/mol)R2
1. A012.2443.000.9920.0311.1950.9049.74 × 10−48.451.000
2. A836.9017.130.9940.0940.6960.7314.79 × 10−311.180.998
3. A1560.241.660.9920.1740.8680.8689.12 × 10−311.180.934
Table 4. Pseudo-first-order and pseudo-second-order kinetic model parameters for Cd2+ ion sorption using three types of biosorbent of Aphanothece sp.
Biosorbentqe(experiment)Pseudo-First-Order ParametersPseudo-Second-Order Parameters
(mg/g)k1 (min−1)qe(cal) (mg/g)RSDR2k2 (g/mg.min)qe(cal) (mg/g)RSDR2
A09.303.695.200.830.8232.79 × 10−29.230.320.992
A811.114.148.850.730.9233.96 × 10−211.160.420.972
A1513.624.572.780.210.4124.54 × 10−213.390.120.997
RSD = relative standard deviation, C0 = 3.63 mg/L, pH of 8, T = 30 °C, tcontact = 60 min, W0 = 0.1 g/L.
Table 5. The thermodynamic parameters of Cd2+ sorption using three types of biosorbent of Aphanothece sp. (C0 = 8 mg/L, pH = 8, W0 = 0.1 g/L, tcontact = 60 min).
Temperature (K) Thermodynamic Parameters
G0 (kJ/mol)H0 (kJ/mol)S0 (kJ/mol K)
Biosorbent A0
310−10.23−41.85−0.102
315−9.58
320−9.15
323−8.89
Biosorbent A8
305−10.36−42.76−0.106
310−9.97
323−8.48
Biosorbent A15
303−10.88−49.16−0.126
315−9.17
323−8.39
Table 6. Comparison of maximum sorption capacity of Aphanothece sp. to other algae-based biosorbents.
No.BiosorbentpHC0 (mg/L)qmax (mg/g)References
1Aphanothece A081–712.24This study
2Aphanothece A881–736.90This study
3Aphanothece A1581–760.24This study
4Spirulina spp.7.53.80.46Chojnacka et al. [40,41]
6AER Chlorella3–7-7.74Sandau et al. [42]
8Desmodesmus pleimorphus40.5–547.1Monteiro et al. [43]
9Chlorella vulgaris6-12.45Sandau, Sandau, Pulz, and Zimmermannn [42]
10Chlamydomonas reinhardtii610042.6Tüzün et al. [44]
11Phaeodactylum tricornutum6-1.24Schmitt et al. [45]
12Hydrodictyon reticulatum5-7.2Singh et al. [46]
13Tetraselmis suecica (Kylin) Butch7.80.6–4530.13Pérez-Rama et al. [47]
14Scenedesmus obliquus CNW-N525–20024.4Chen et al. [48]
15Ulva lactuta51028.1Sari and Tuzen [29]
16Oscillatoria sp.2–825–10030.1Katırcıoğlu et al. [49]
17Hypnea valentiae625–50015.79Rathinam et al. [50]
18Ceramium virgatum51039.7Sarı and Tuzen [51]
19Colpomenia sinuosa-5 and 10064.9Zarei and Niad [3]
Table 7. Reusability of three Aphanothece sp. biosorbents on sorption of Cd2+ in aqueous solution.
Sorption Capacity (mg/g)
1. Biosorbent of A0Cycle 1Cycle 2Cycle 3
Sorption (B)59.9363.5158.23
Desorption (D)48.7144.7715.62
The ratio of (D/B)0.810.700.27
2. Biosorbent A8
Sorption (B)5.612.532.02
Desorption (D)5.242.011.13
The ratio of (D/B)0.930.770.56
3. Biosorbent A15
Sorption (B)5.865.915.89
Desorption (D)5.635.814.05
Ratio of (D/B)0.960.980.69
C0 = 1 mg/L (of A8 and A15), C0, Cd = 7.2 mg/L of A0, pH of 8, W0 = 0.1 g/L desorbing solution of HCl 1 M.

