Longevity Aspects of Potable Water Disinfected by Ionic Silver: Kinetic Experiments and Modeling


1
Laboratory of Environmental Engineering & Planning, Department of Civil Engineering, Aristotle University of Thessaloniki, 54 124 Thessaloniki, Greece
2
Laboratory of Chemical and Environmental Technology, Department of Chemistry, Aristotle University of Thessaloniki, 54 124 Thessaloniki, Greece
*
Authors to whom correspondence should be addressed.
Water 2020, 12(1), 258; https://doi.org/10.3390/w12010258
Submission received: 21 November 2019
/
Revised: 7 January 2020
/
Accepted: 14 January 2020
/
Published: 16 January 2020
(This article belongs to the Section Water Quality and Contamination)
Abstract
:In the International Space Station (ISS), Russian and European cosmonauts drink water disinfected by dissolved silver. For this to be effective, the concentration of silver should remain above a certain threshold from the moment of its initial disposition in storage tanks on earth until its final consumption in ISS. Unfortunately, during water tanks transportation to ISS and during storage in ISS, silver concentration has been reported to decrease intensively beyond any reason. This work examines the effect of different materials used in ISS water storage and distribution systems on the reduction of silver concentration. An experimental campaign has been organized where passivated stainless steel (SS), passivated and electropolished SS and titanium alloy coupons (official ISS grades) are exposed to simulated ISS potable water at different silver concentrations, different surface to volume ratios, and at stagnant or flow conditions. The evolution of silver concentration remaining in the bulk water is recorded with respect to the exposure time. A reaction engineering model for the Ag loss to the coupons is developed. The model is fitted to the experimental data in order to derive the reaction rate expression and the corresponding parameters. For passivated SS and electropolished SS the silver deposition rate depends on the initial silver concentration in water but is rather unaffected by the progress of silver deposition on the surface. On the other hand, for Ti alloy, while silver deposition rate still depends on initial silver concentration, it decreases continuously as silver deposition on the surface advances, implying that Ti alloy surface becomes gradually saturated and so prevents further silver deposition. Such a model can be useful for material selection and design of water storage and distribution facilities for ISS.
1. Introduction
Potable water is, after oxygen, the second consumable necessary for crew members to live aboard a spacecraft and by far, the most critical with regards to mass. This is a major concern of crew members in the International Space Station but the situation will be far more severe in future deep space manned missions [1,2]. In the context of manned long term spaceflight missions, prevention of water contamination in the water storage and distribution systems is essential, in order to prevent potential crew health risks. Currently, control of potable water contamination is ensured by the addition of adequate amounts of biocidal agents at production sites [3,4]. There are two water quality standards defined for water consumption by the ISS crew: the US potable water and the Russian potable water. The major differences between the two types of water are summarized as follows: the disinfection agent is silver for the Russian type of water and iodine for the US type of water, the TOC maximum acceptable levels are significantly higher according to the Russian water quality standards, Russian standards enable more minerals than the US ones and the maximum allowable total chromium level is significantly higher in the Russian type of water compared to the US type of water.
So far, the European Space Agency (ESA) has successfully delivered potable water to ISS using ionic silver as biocide [4,5] aboard the Automated Transfer Vehicle (ATV). The introduced silver concentration in water at the production site is 0.5 mg/L, while the threshold of silver concentration for water disinfection and human consumption onboard the ISS is set by the space agencies at 0.2 mg/L. For future long-term missions, ionic silver has been identified as the preferable biocide agent of potable water [6,7,8]. Ionic silver has been acknowledged as an efficient disinfectant agent and can be safely consumed by humans unless it is consumed at high concentrations for a long period of time [9]. On the contrary, although silver nanoparticles gain much attention for disinfection/sterilization applications, their effects on human health are quite unknown [10]. Although potable water, disinfected by ionic silver, has been successfully delivered to ISS, a distinct fluctuation of silver has been observed in this water by performing quality analyses at different stages during water handling, raising concerns about possible water quality degradation [6,7,11]. As confirmed by other studies [12,13] silver depletion relies on surface deposition phenomena occurring on the wetted surfaces. So far, the main type of wetted surface in water storage tanks of Ground Support Equipment (GSE) has been Stainless Steel (SS). Indeed, there are few relevant studies in literature, which show that silver depletion from bulk water might occur on stainless steel, SS, depending on various factors, such as the wetted surface area to water volume ratio (S/V), type of wetted surface, etc [12,13,14,15,16]. However, also other types of materials may come in contact with water and contribute to the variation of silver ions’ concentration [17]. Some of the materials used already in water distribution pipes on ISS are metallic, such as Stainless Steel (SS), acid passivated SS and electropolished SS. Moreover, the potable water tanks to be used in the future space missions will exhibit a bellows configuration with the outer shell made of titanium alloy (Ti-6Al-4V) and the bellows made of SS [6,7].
Only a few studies investigate the mechanisms related to Ag depletion from the bulk water and the consecutive Ag deposition to the wetted surfaces [13,16]. Detailed high-resolution XPS analysis demonstrate the chemical state of deposited Ag on the examined surfaces [12,13,16]. Indeed, spectroscopic analysis confirms that the deposited silver layer of silver on SS surfaces is in the form of both metallic Ag and Ag oxides. Silver oxides are found on the outer surface of the deposits (in a depth less than 1 nm). Interior to these deposits, Ag is in its metallic form, in line with a galvanic deposition mechanism. On the other hand, on the titanium alloy (Ti6Al4V) surface, Ag is found only in its oxidized form (as AgO, a mixture of Ag2O and Ag2O3), suggesting a galvanic replacement, or alternatively, an ion exchange mechanism. Understanding of the underlying phenomena can contribute to optimizing water systems used aboard space vehicles and in terrestrial applications, such as domestic filters and portable water purification systems [18] or drinking water disinfection systems for underprivileged societies [19].
The overall aim of the study is to compare the behavior of different materials that are currently in use for potable water storage and distribution systems of ISS with respect to silver ions loss from water. Moreover, the quantitative assessment of the observed surface phenomena responsible for silver ions reduction into water is considered within the scope of this investigation. The outcomes are useful for the prediction of the longevity of water systems that are based on disinfection with Ag ions and the design of water systems for long term outer space missions, as well.
2. Materials and Methods
In this study, kinetic experiments for the evolution of Ag concentration in potable water are performed. Three types of solid materials, e.g., passivated stainless steel, passivated and electropolished stainless steel and titanium alloy, are introduced into the test cells, where synthetic ISS potable water is added at different silver concentrations and at different surface to volume ratios. The experiments run under stagnant or flow conditions and the concentration of silver ions in the bulk water is recorded with regards to the exposure time. Then a reaction engineering approach [20] is followed aiming to derive kinetic models that describe the rate of silver deposition and to investigate how different conditions may affect this rate.
2.1. Metal Coupons
In the experimental part of this study, water is brought in contact with two types of stainless steel (passivated 316L and 316L passivated and electropolished) and one titanium alloy Ti-6Al-4V in the form of strip coupons (Length × Width × Depth: 76 × 12.7 × 1.6 mm). All coupons are obtained from the Metal Samples company (Munford, AL, USA) which manufactures them according to specifications set for water systems in the ISS.
2.2. Preparation of Synthetic Water and Addition of Silver Ions
The water employed in the tests is synthetic water freshly prepared in the lab according to the Russian water standards, as described elsewhere [12,13,16]. Silver ions are electrolytically added to water, using a silver ionization unit (CSG-1, Clark Zapper, London, UK) equipped with silver electrodes of high silver purity (99.99%). Then water is filtered through a 0.2 μm filter (membrane filter, Pall Corporations, New York, NY, USA). Two silver concentrations are used in the experiments; a high concentration of 10 mg Ag/L in water such as that employed to pre-condition the ATV flight water tanks before launching to the ISS and a low concentration of 0.5 mg Ag/L in water that refers to ISS potable water quality, according to the Russian water standards. Silver ions concentration is determined spectrophotometrically using the LCK 354 method (Hach Lange). Measured silver ions concentration is equal to total silver concentration, as confirmed by Inductively Coupled Plasma Analysis and presented elsewhere [16]. Therefore, in this study Ag concentration refers exclusively to silver ions concentration. Error bars in the figures show the standard deviation with respect to the average value.
2.3. Test Setup
For the experiments at S/V equal to 1.0 cm−1, coupons from each type of material are immersed in a rectangular polypropylene (PP) test cell (20 × 20 × 80 mm), containing 0.5 or 10 mg Ag/L. The test cells of the experiments at low S/V, equal to 0.1 cm−1, are polypropylene (PP) bottles with a cap of total volume of 500 mL. Tests are conducted in nitrogen headspace, according to conditions used in ISS water tanks, while in each series of tests, there is also a blank sample (the test cell contains only water, no solid coupon) in order to examine possible deposition of silver on the polypropylene (PP) walls of the experimental containers.
2.4. Experimental Conditions
Test coupons are exposed to water at the surface to volume ratio (S/V) equal to either 0.1 or 1.0 cm−1. These two S/V values correspond to realistic limiting conditions in the storage tanks of the ISS: 0.1 cm−1 refers to high water level whereas 1.0 cm−1 refers to low water level. Most of the tests at S/V equal to 0.1 cm−1 are long term and last 24 weeks. The intermediate exposure periods are set by the bisection method: 1.5, 3, 6 and 12 weeks. The experiments at S/V equal to 1.0 cm−1 are short term. Preliminary experiments show that in most cases, silver is depleted in a matter of hours; thus, time intervals for exposure of coupons to synthetic water are case specific. Experiments are performed in at least five time intervals, while each experiment is performed in triplicate. The conditions of the exposure of SS and Ti alloy solid surfaces to either high or low silver ions concentration are given in Table 1.
3. Reaction Engineering Approach
Kinetic analysis of silver ions reduction in the water bulk is pursued at two stages: Initially, a generalized model is developed indicating the dependence between the main silver concentration reduction parameters and the measured variables. Then, the experimental results are examined in the context of this model, in order to identify rate determining steps for each set of data and extract explicit relations for the process rates, whenever it is possible.
Generalized Model
Considering that water during the experiments is never saturated with respect to Ag salts and Ag is exclusively in its ionic form, the only process occurring in the liquid is the transfer of Ag ions from the bulk water to the wetted solid surface. This transfer is made by diffusion in case of completely stagnant water and by combined diffusion and convection if water motion is present. The shape of the water domain is in general three dimensional but it can be adequately approximated by a single dimension since the dominant variable for mass transfer kinetics is the distance that the solute has to travel in the liquid in order to reach the solid surface (coupon). So, the geometry of the test cell must be viewed as a one-dimensional slab with length equal to the water volume over the wetted surface, e.g., L = V/S (cm). The one edge of the slab is the wall of the sample which consumes solute and the other edge is the polypropylene (PP) inert surface (wall) of the test cell having virtually no interaction with the solute (zero flux boundary condition).
The transient diffusion equation must be solved numerically in connection with the surface occurring phenomena. Nevertheless, for the present purpose, a lumped approximating solution is preferable for the construction of the model. Let us denote as Ci the concentration of Ag in the liquid at the region of the coupon surface and as c(x) the profile of Ag concentration where x is the distance normal to the coupon surface and t is the time. The problem is described by the following equations:
with boundary conditions
where D is the diffusivity of Ag ions in water.
c(0) = Ci and ∂c/∂x = 0 at x = L,
A lumped presentation of mass transfer kinetics corresponds to a total mass balance for the average Ag concentration in the cell:
where h is a mass transfer coefficient. In case of stagnant water, the above two equations should give similar results for the evolution of the spatial average concentration C. The matching is achieved by considering the concentration profile as a second order polynomial. Fulfillment (by this polynomial) of the two boundary conditions Equation (2) and of an integrated form of Equation (1) leads to the condition h = 3D/L. This result is very important since it introduces a natural time scale for the mass transfer process. The procedure is similar to the well-known linear driving force approximation used extensively in adsorption studies [21]. It is noted that this approach is expected to be very accurate for silver depletion from the bulk higher than 30% but it underestimates mass transfer kinetics at the initial stage (burst effect for low depletion) [22].
The rate of reduction of Ag ions concentration in the region of the solid surface is achieved due to a generalized surface reaction and is described by a functional relation of the form R(Ci,q) (units: mass/(time × area)). This means that the surface reaction rate depends on the local Ag concentration Ci and on the mass of Ag, q, accumulated on the wall (given as mass per area). It should be noted that R is a functional relation indicating parametric dependence which does not imply a simple algebraic expression. The relation between the variables can be described through complex mathematical models.
Ag ions flux to the solid surface must be equal to the rate of reaction on the solid surface, so the following condition must be fulfilled every time:
The quantity q is given (according to its definition) by the equation:
The final model consists of Equations (3)–(5) and must be solved with initial conditions (t = 0) as follows: C = Co and q = 0, where Co is the initial Ag ions concentration in the bulk water. Equations (3)–(5) can be combined (through elimination of R) and be integrated to give the global mass balance:
In the limiting cases of reaction or mass transfer domination the model can be considerably simplified. In case that surface reaction is much slower (limiting step) than mass transfer the model is reduced to a single equation:
In case that mass transfer is the limiting step with the surface reaction being much faster, then the model can be solved analytically to give:
In case of the existence of a maximum Ag ions capacity qm for the solid surface, the solution of the above equation holds up to Cm = Co − Sqm/V (at time tm = Vln(Co/Cm)/(hS)). Then, for time t higher than tm, the concentration remains constant at value C = Cm.
A reasonable approximation of the functional form R(Ci,q) by using a single kinetic curve (q refers to silver loading on the surface) is needed. The first important step is to decide on the reversibility of the process. The term “reversibility” here is not a general one but is related exclusively to bulk concentration. The fact that previous studies confirmed complete exhaustion of silver from the bulk [16] indicates that the process is irreversible, and a relevant expression is chosen.
The contributions of the two factors of the function R are separated. The influence of the rate on Ci is typically due to collisions of bulk ions to the solid surface. For small values of Ci, like in the experiment with the flow in this study, a linear dependence is expected. Regarding the q dependence, it is expected that as q increases the driving force for the reaction decreases leading to an asymptotic value of q denoted as qm. Summarizing, the expression to be used for the reaction rate reads (where k and n are model parameters):
4. Results and Discussion
The results of this study consist of original experimental kinetic data and their treatment through appropriate kinetic modeling. The experimental conditions are close to real conditions during ATV campaigns, in terms of temperature, nitrogen headspace, water storage duration (up to 24 weeks), initial silver concentration and S/V ratio. More specifically, nitrogen headspace is used during potable water preparation and treatment on the ground, with an initial silver concentration of 0.5 mg/L. The higher silver concentration of 10 mg/L is used only for the preconditioning of water tanks to be launched to the ISS. The S/V ratio in the ISS water systems, including full or rather empty water tanks, varies between 0.1 and 1.0 cm−1. Therefore, the results of this study apply to real conditions encountered in space missions.
4.1. Experimental Kinetic Data
All three metallic materials are submitted to stagnant experiments with potable water containing 10 mg/L of silver ions introduced to water electrolytically. The results of silver ions concentration in the bulk with respect to exposure time are shown in Figure 1. Figure 1a presents the results of experiments conducted at surface over volume ratio (S/V) equal to 1.0 cm−1, whereas Figure 1b depicts the results for tests performed at S/V equal to 0.1 cm−1.
Figure 1a shows that the highest Ag loss from the bulk is observed for Ti where after 6d of exposure Ag loss reaches a plateau. In addition, the highest remaining Ag concentration in the bulk water throughout the test is observed for electropolished SS316L material. Ag reduction rate in the bulk is slower for electropolished SS316L than for the passivated SS316L material. Considering the standard deviation of measurements, Ag concentration in the bulk remains statistically constant and reaches a plateau for both SS316L materials.
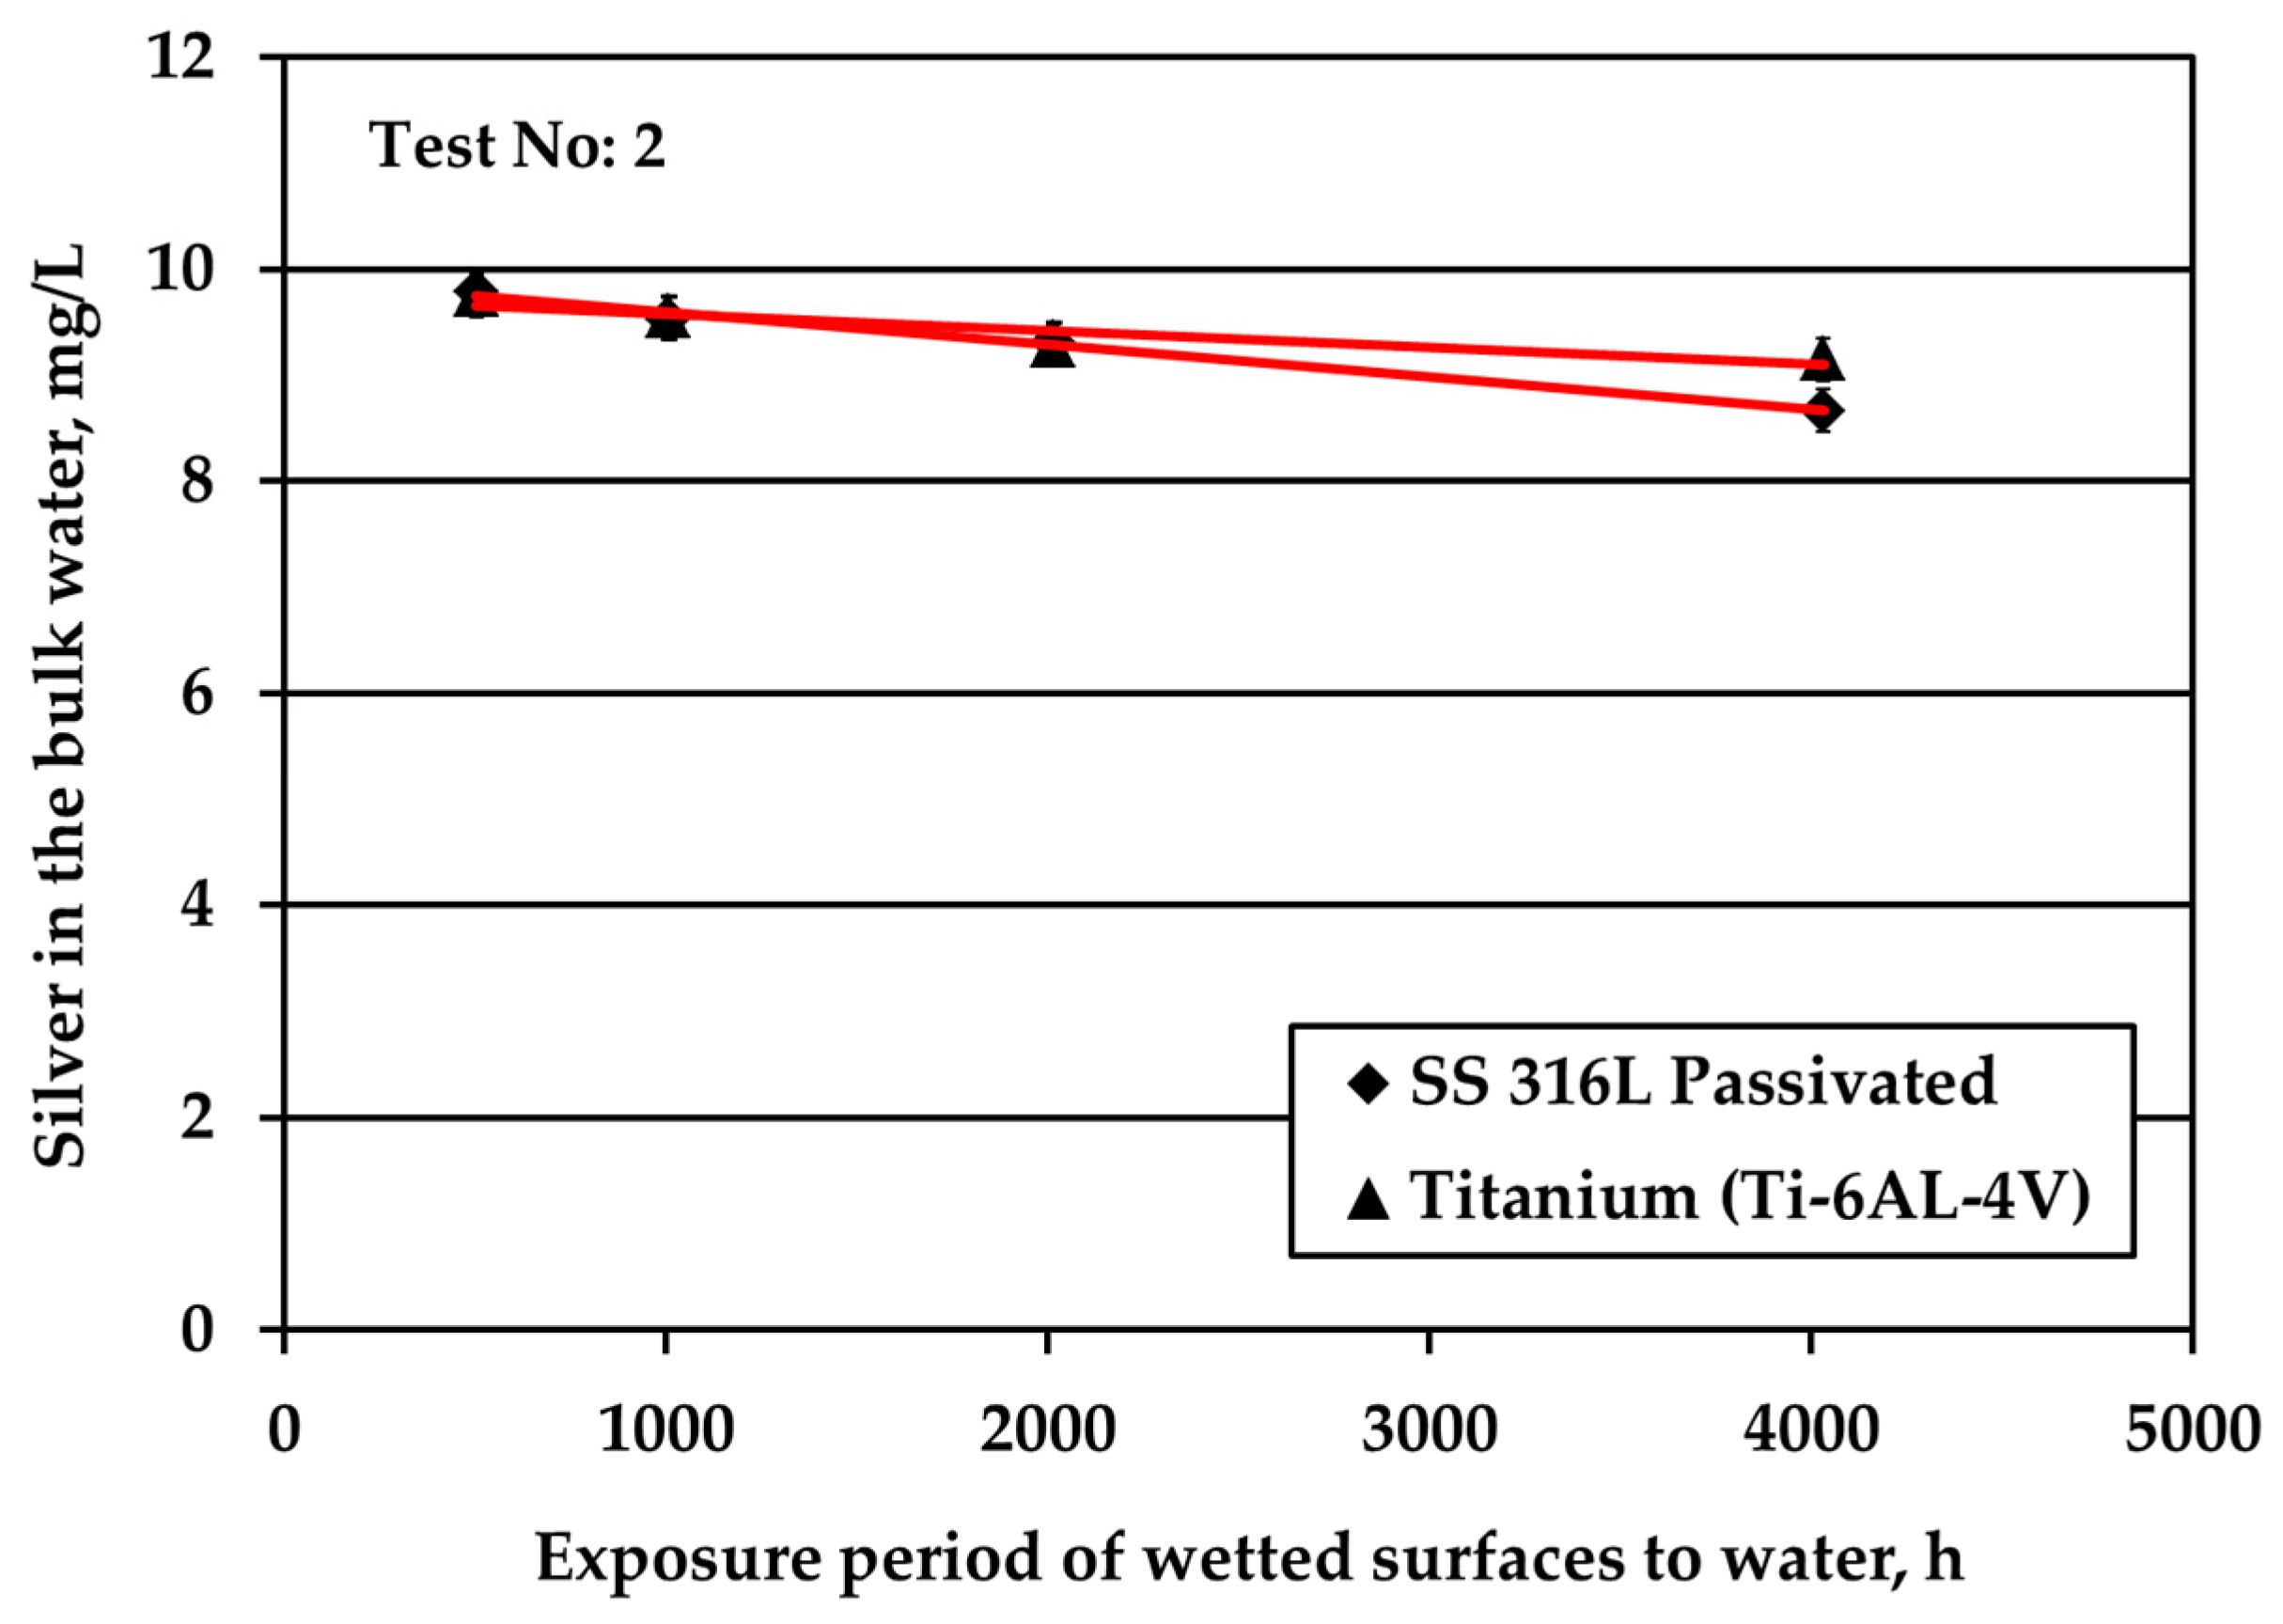
The decrease of the S/V parameter by one order of magnitude, at 0.1 cm−1, leads to a continuous and almost linear reduction of silver, as shown in Figure 1b. The same behavior is presented by the passivated SS, as well. However, the rate in the case of Ti alloy is higher. Regarding the passivated & electropolished SS coupons, there is a change in the rate of Ag reduction after 12 weeks of exposure period that is attributed to employing a different batch of coupons: data points at the initial four exposure times are obtained by using coupons that show higher potential in silver deposition compared to the data points at the two longer times that are more resistant to silver deposition. This behavior is observed although the specifications for the electropolished material are identical for both batches. The difference is attributed to the rather uncontrolled machine finishing of the coupons during their manufacture, as it turned out by the clarifications provided by the manufacturer. Passivated & electropolished SS coupons exposed to water up to 6 days behave similarly to the other two metals, as shown in Figure 1b. However, after 12 weeks of exposure to water with 10 mg/L Ag, Ag concentration is comparable with six weeks of exposure, whereas only a trivial further reduction is observed for up to 24 weeks. On the other hand, it should be taken into consideration that a small reduction in Ag bulk concentration corresponds to high Ag deposition variations since the S/V ratio is low and Ag concentration is high. Ag ion concentration reduction in water is strongly related to the deposition phenomena of Ag onto different types of solid surface material. Previous studies revealed the underlying deposition phenomena for both SS and titanium alloy materials [12,13]. On SS surfaces, silver is deposited in its metallic form, in line with a galvanic deposition mechanism [12]; while on titanium alloy Ti-6Al-4V it is deposited in its ionic form, in line with either a galvanic deposition or ion exchange mechanism [13].
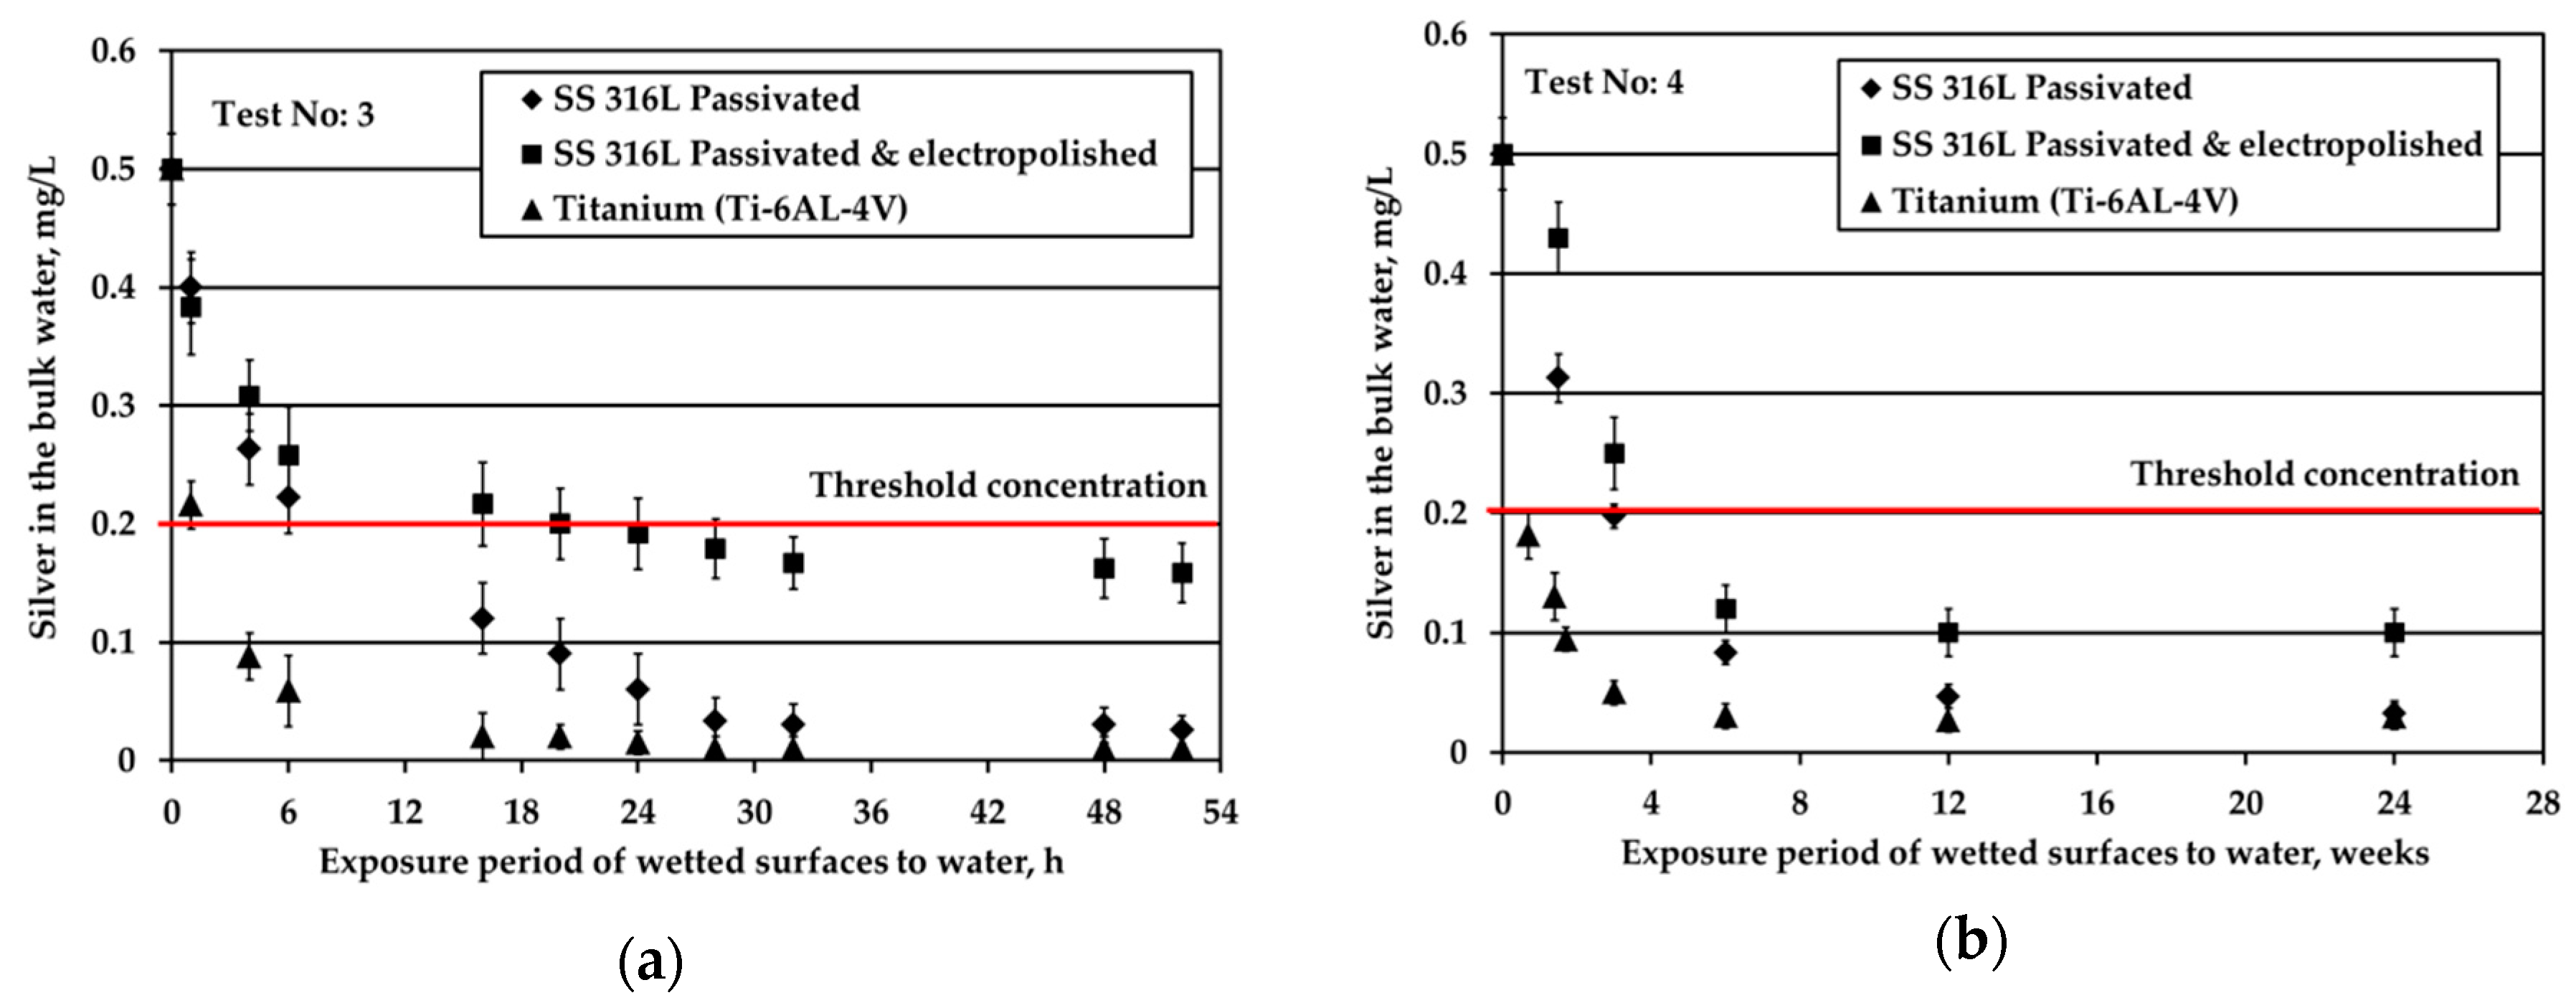
Figure 2 depicts the results obtained when testing the potable water (0.5 mg/L Ag) against three different solid surfaces under stagnant conditions and nitrogen headspace. The red line is added to signify the threshold Ag concentration, 0.2 mg/L, set by the space agencies to warrant sufficient disinfection of potable water. As shown in Figure 2a, at S/V equal to 1.0 cm−1, when water is in contact with Ti alloy, Ag is almost fully depleted after about 6 h of the exposure period. For the SS316L materials, Ag is rapidly reduced from the bulk water in the first 6 h; next, the reduction rate becomes gradual and after 32 h silver reduction rate tends towards a plateau (although a small rate is still noticeable). At the very end of the test, Ag is almost fully depleted in the case of passivated SS316L, while for electropolished SS316L Ag concentration is slightly below the threshold limit of 0.2 mg/L. Regarding titanium alloy, Wallace et al. [6,7] also recorded a remarkable silver reduction in the bulk, since the residual silver ions concentration was only 0.025 mg/L after 1680 h of exposure period and initial silver fluoride concentration into water of 0.4 mg/L. The test coupons were inserted to the test setup at S/V ratio around 0.6 cm−1, while prior to exposure, the test coupons were passivated for 24 h into water containing 100 mg/L silver ions. The results of Figure 2a show that although silver deposition was high during passivation (initial 24 h), its deposition continued during the exposure experiments.
Figure 2b presents the evolution of Ag concentration in the bulk potable water with respect to exposure time under nitrogen headspace and S/V ratio equal to 0.1 cm−1. These conditions are close to the real conditions used in water storage tanks of ground support equipment during ATV missions, where the wetted surface is made of SS material [3]. In this study, when in contact with passivated SS316L, Ag in the bulk water is reduced rapidly for the first six weeks of exposure. After that, the observed Ag reduction continues only gradually even after several months of exposure. Likewise, Roberts et al. [15] observed a considerable silver reduction, higher than 10% of the initial silver concentration, when SS316L solid surfaces were exposed to water containing 0.5 mg/L Ag at a ratio of S/V equal to 0.14 cm−1. In this study, the overall reduction of Ag is calculated around 70% after 21 days of exposure. The results between the two studies are comparable considering the differences in the experimental setup and more specifically in the employed S/V ratios. Moreover, the results are in line with the experiments performed in water tanks used for the ATV missions [3]. After 24 weeks of exposure, Ag was reduced from 0.5 to about 0.1 mg/L in the bulk water. However, the pattern of Ag removal was different. After four weeks of water storage a sharp Ag reduction to slightly above 0.3 mg/L was observed. For the next eight weeks, the rate of reduction was close to zero, whereas for the last 12 weeks the rate of reduction became equal to the initial one that was observed for the first four weeks of water storage. Since these measurements were performed only once, it was concluded that there is strong evidence that silver may be reduced below the threshold limit of 0.2 mg/L and that the water shall be stored not more than three months in SS tanks. Measurements of Ag in water onboard the ISS, where the material of water tank changes from SS (in GSE) to polymeric FEP (in ISS water tanks) revealed that Ag may be further reduced even below 0.1 mg/L [23] posing health risks to cosmonauts.
Similar to passivated SS316L, electropolished SS316L causes a swift reduction of silver in the bulk water during the first six weeks of exposure, whereas later the reduction of silver progresses very slowly. The highest remaining silver concentration in the bulk at the end of the test is observed for electropolished SS316L material. For Ti solid surfaces, Ag reduction in the bulk is significantly faster: Ag concentration is below the threshold of 0.2 mg/L after just five days of exposure, while after six weeks Ag is almost fully depleted.
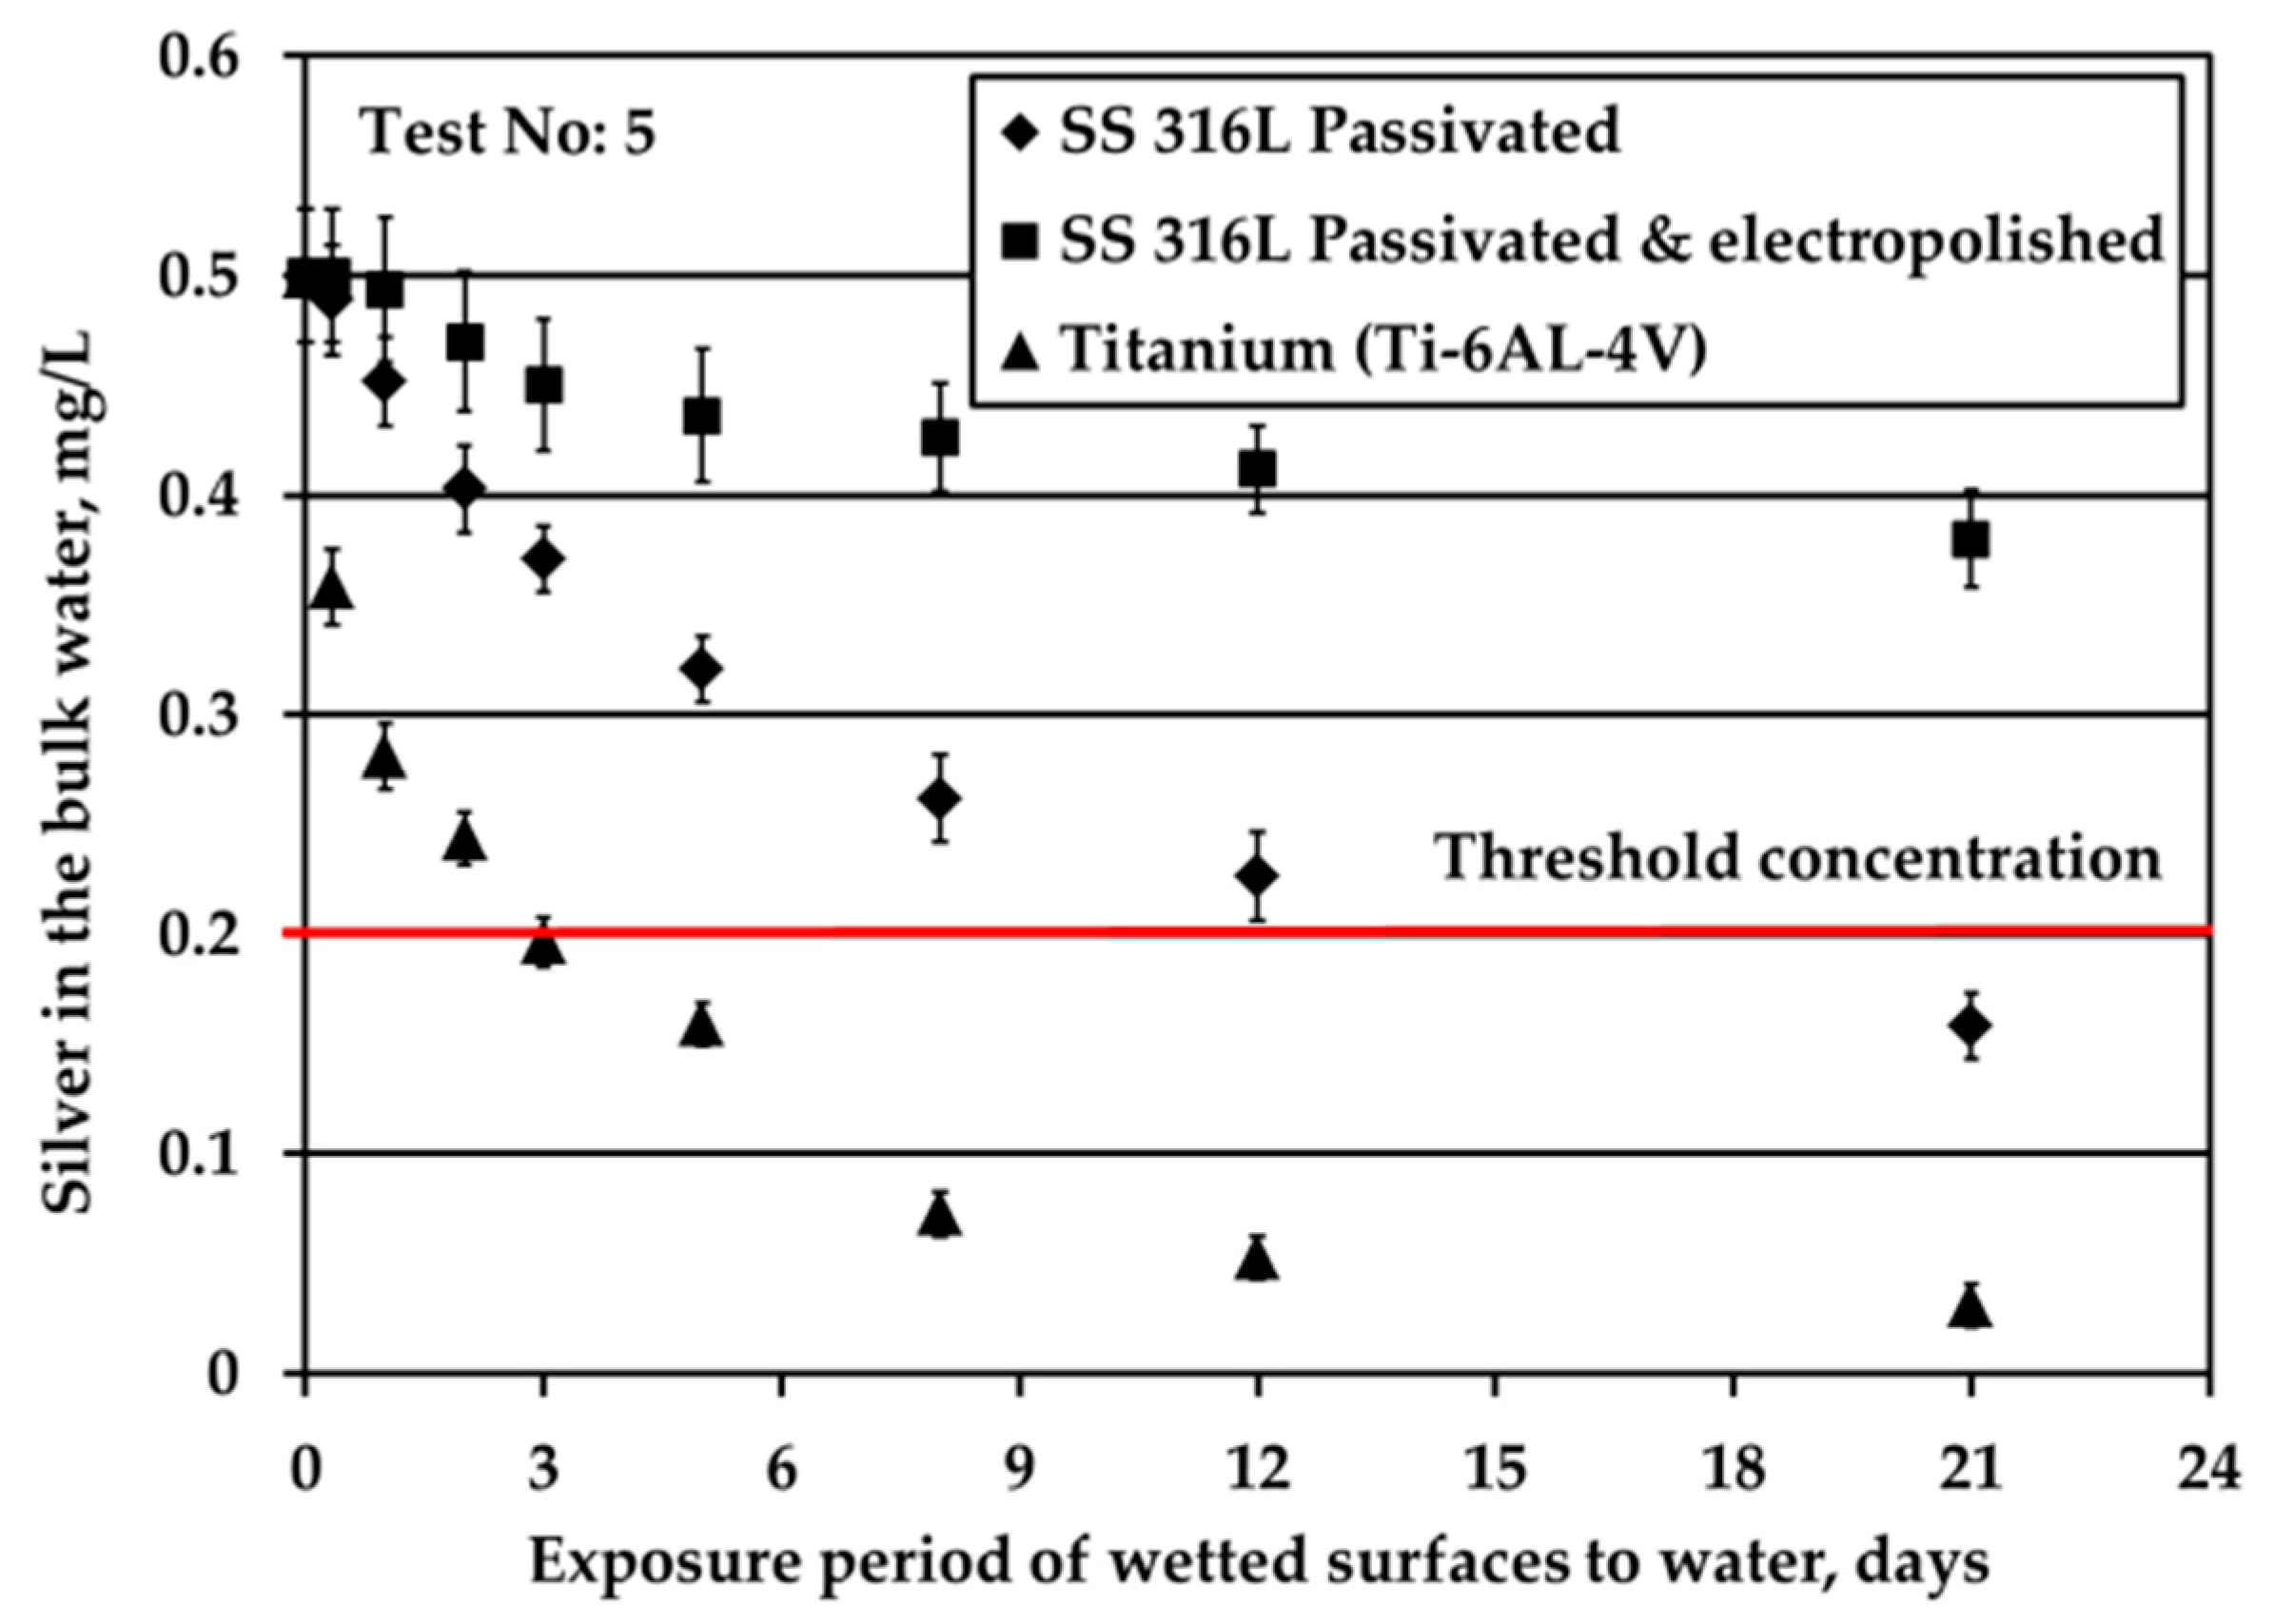
The reduction of Ag concentration in the bulk water with regards to the type of solid surfaces is demonstrated in Figure 3. These tests are conducted under water flow conditions (by applying mechanical shaking), nitrogen headspace and S/V equal to 0.1 cm−1. The aim of these experiments is to examine the depletion of Ag ions when Ag mass transfer limitations are eliminated. The initial Ag ions concentration in water is equal to 0.5 mg/L, similar to that used in ATV water tanks, in order to elucidate phenomena using experimental conditions close to real ones.
Ti alloy surface triggered fast Ag loss from the bulk water since after only three days Ag passes below the limit of 0.2 mg/L Ag. Regarding the SS solid surfaces, Ag loss is faster for passivated SS316L than for electropolished SS316L material. Ag loss for passivated SS316L solid surface is comparable with that reported in ATV processes [4]. Rough comparisons between the Figure 2b and Figure 3 (Ag depletion in potable water in the absence and in the presence of water flow, respectively) indicate that either Ag deposition is independent of water flow or that even minor movements of water during water storage contribute to Ag transfer to the surface (for example, these movements could be because of chamber vibrations).
4.2. Analysis and Modeling of the Experimental Data
According to the generalized model, as described earlier, the characteristic time for mass transfer in the test cell is given as τ = L2/(3D). In this study, the characteristic time corresponds to τ = 6.1 h for S/V = 1 cm−1 and τ = 25 d for S/V = 0.1 cm−1. This characteristic time corresponds to a 63% reduction of initial silver concentration in case of a mass transfer dominated process. The corresponding reduction at time t = 3τ is 95%.
As shown in Figure 2a, Ti alloy solid surface exhibits a reduction of Ag concentration of 56% in just one hour whereas the characteristic time, in this case, is 6.1 h. From this single counterexample, it is quite clear that diffusion is not the only mass transfer mechanism as would be expected for stagnant water. In this particular case mass transfer is about five times faster than a diffusion-controlled process. This can be ascribed to some kind of convection. In order to understand the sensitivity of the mass transfer process on even very slight water motion, the characteristic velocities for diffusion can be denoted as u = D/L = 150 nm/s (S/V = 1 cm−1) and 15 nm/s (S/V = 0.1 cm−1). This means that even floor vibrations or natural convection currents (due for instance to small temperature fluctuations) can considerably increase mass transfer. The issue is that the convection contribution is based on unspecified events, so the mass transfer coefficient is rather arbitrary and so different from experiment to experiment. This fact renders the experiments with mass transfer kinetic contribution useless for extracting information for surface reaction kinetics (unlike in the case of pure diffusion where the known mass transfer coefficient could be part of the model).
In the case where silver loss from the bulk is studied under water flow conditions, water velocities are many orders of magnitude larger than that of diffusion certifying that the kinetics of these particular experiments refer to surface reaction alone without any shadowing from mass transfer in the bulk water.
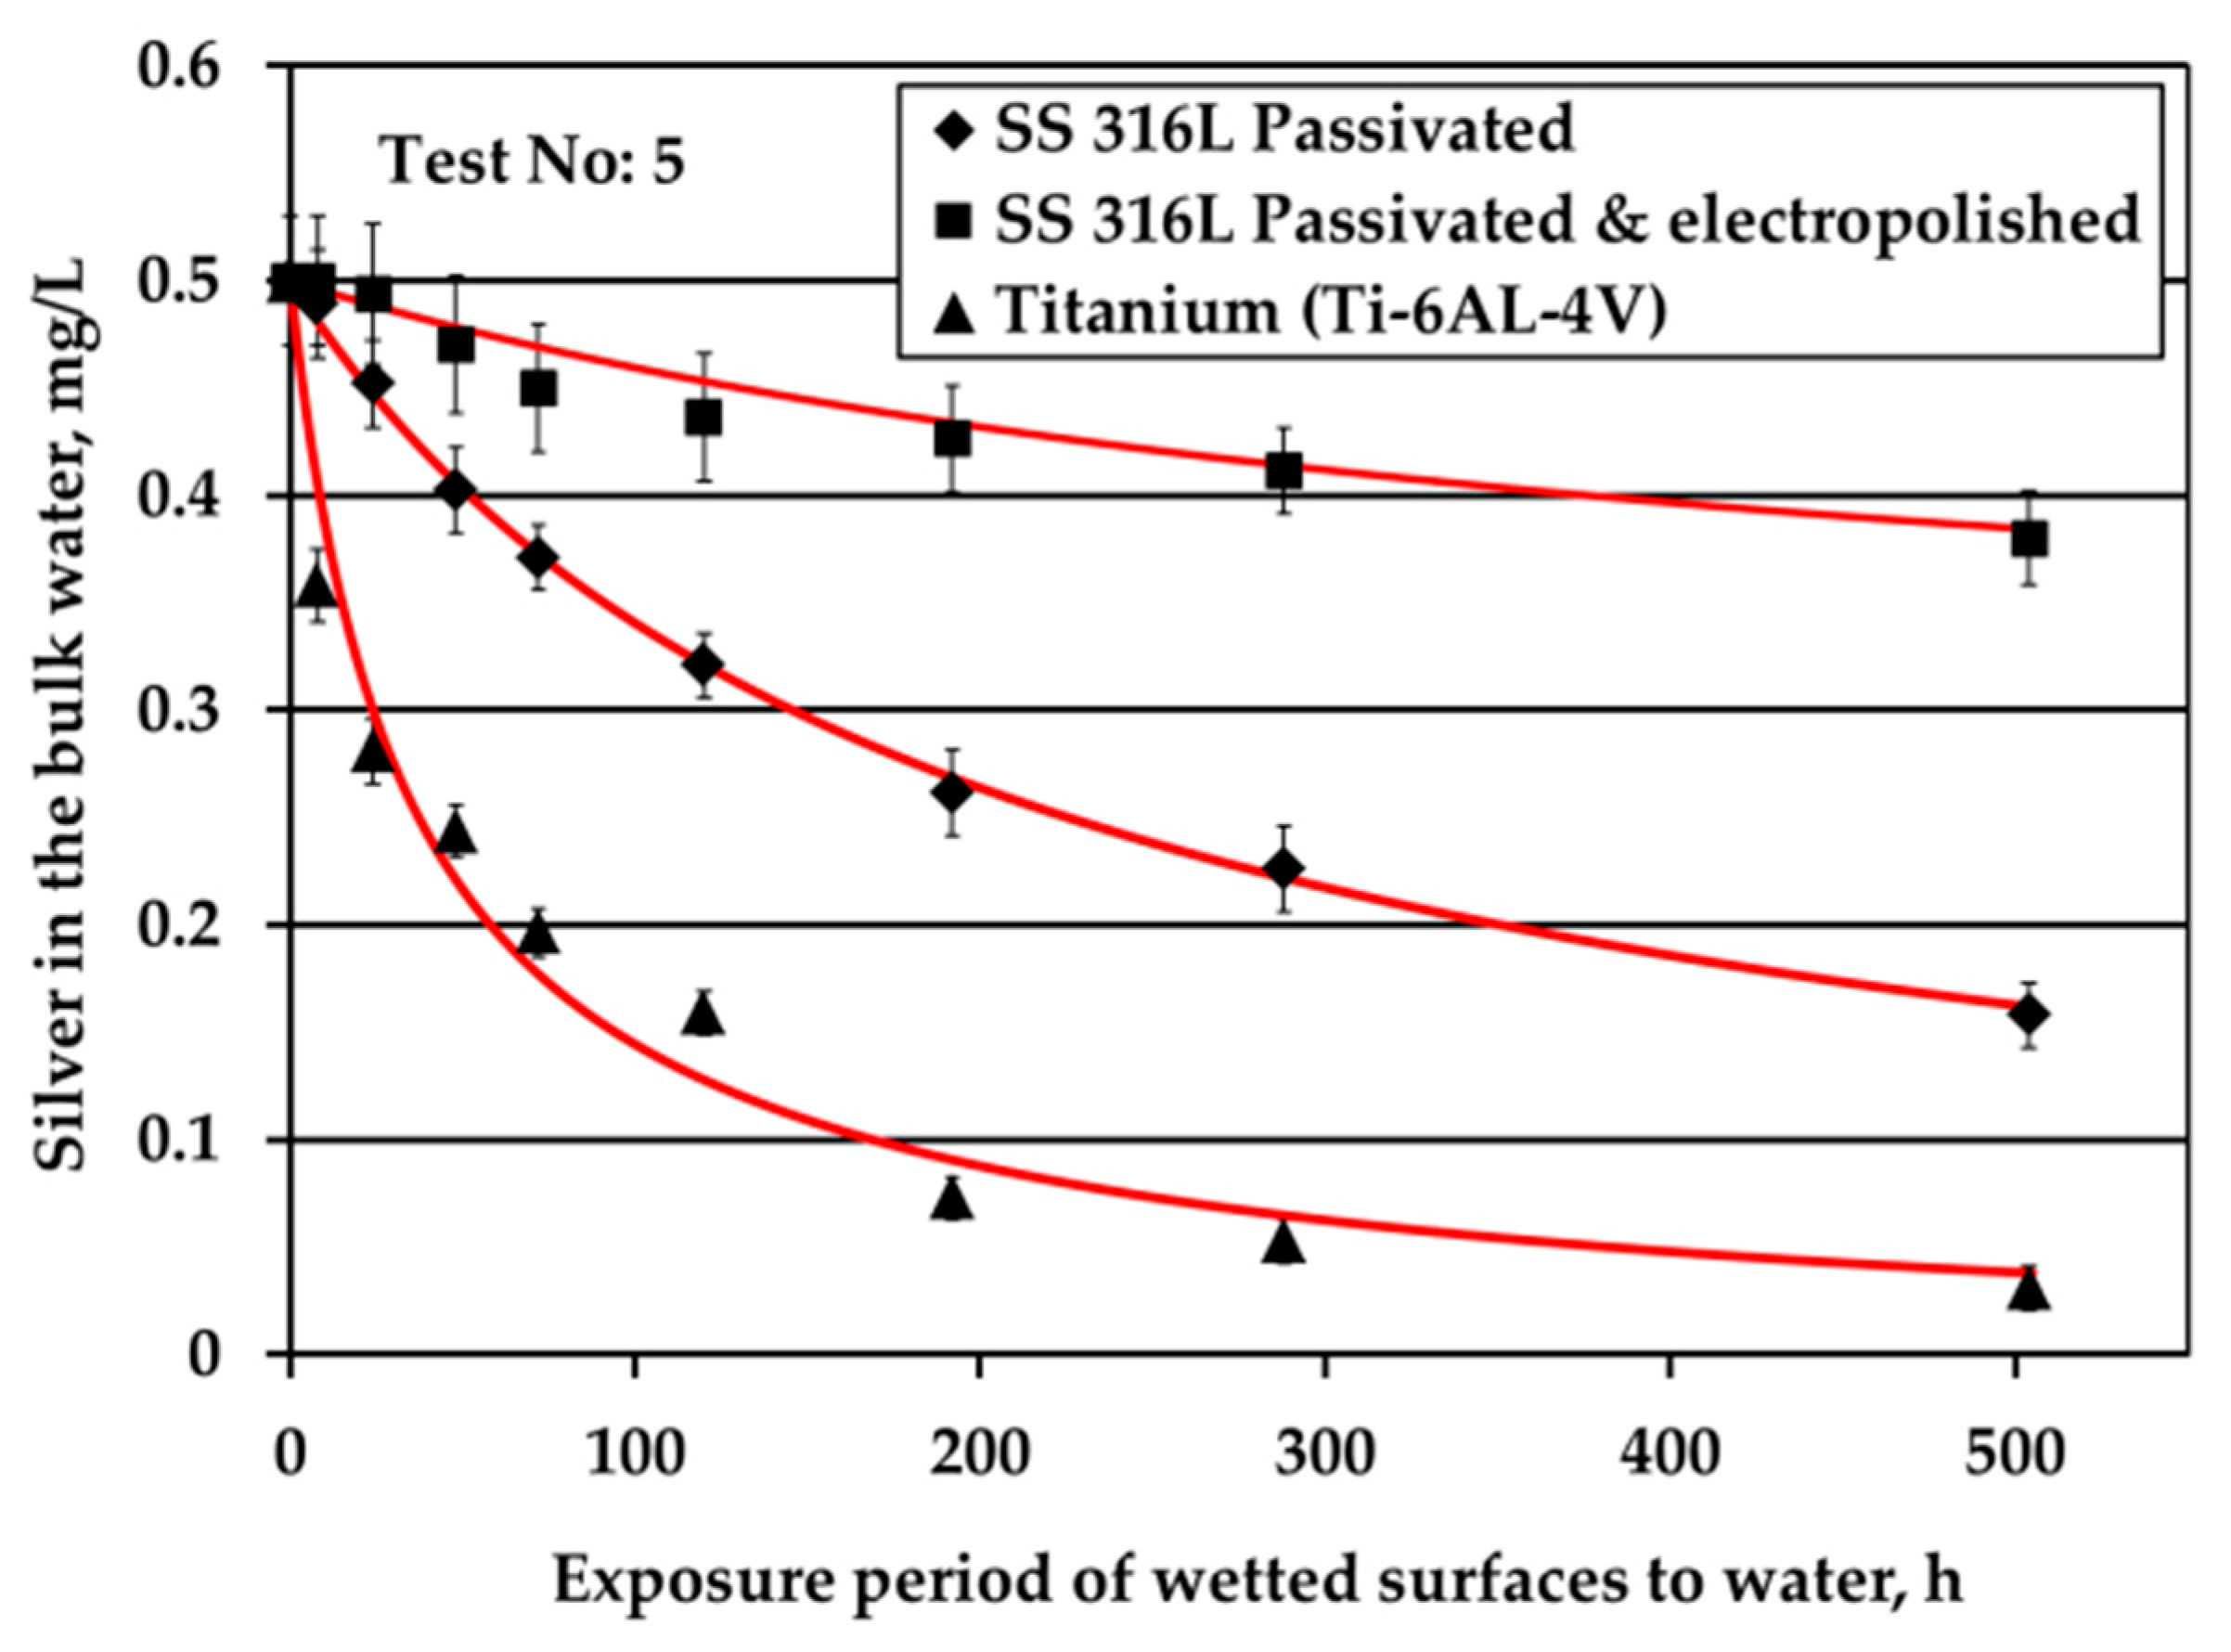
Equation (7) cannot be integrated analytically with the reaction kinetics expression in equation (9), so a numerical integration is employed based on the Euler technique [24]. The parameters k, qm, n are computed such that there is a reasonable agreement between theoretical and experimental evolution of C. It should be noted that a much better fitting could have been achieved by considering a more complex form of function R or assuming different value of n for each material, but such a task is worthless given the scatter of the experimental points. The aim is to extract the simplest possible model giving acceptable results in the range of the experimental data. In this case, the experimental data (taken from Figure 3) and the fitting concentration evolution curves are demonstrated in Figure 4. Hereafter, all kinetic plots are plotted versus time in hours, because all kinetic parameters, e.g., kinetic constants, are calculated and given in hours.
It is worth noticing that the experimental data are fitted using the same value of the exponent n (=1.5) for all three types of examined solid surfaces. This exponent denotes the rate of approaching the asymptotic value qm. The kinetic constant k was found to be k = 0.05 cm/h for passivated SS316L material, k = 0.01 cm/h for electropolished SS316L material and k = 0.3 cm/h for Ti alloy solid surface. They maximum uptake capacity is qm = 0.00555 mg/cm2 for passivated SS316L, qm = 0.002 mg/cm2 for the electropolished SS316L sample and qm = 0.00555 mg/cm2 for the Ti alloy surface, as shown in Table 2.
The same experimental conditions, as regards the S/V ratio and Ag concentration, but in stagnant water conditions produced the results shown in Figure 2b. The kinetic curves are quite similar to those of the test under water flow (Figure 3) for the same exposure period. This is not surprising since the diffusion characteristic mass transfer time is 25 days which for a convection acceleration factor of 5 (as in the test with S/V = 1.0 cm−1) reduces down to five days which is much shorter than the experimental duration. The particular set of data confirms the current analysis but it has no additional information to offer regarding surface reaction kinetics.
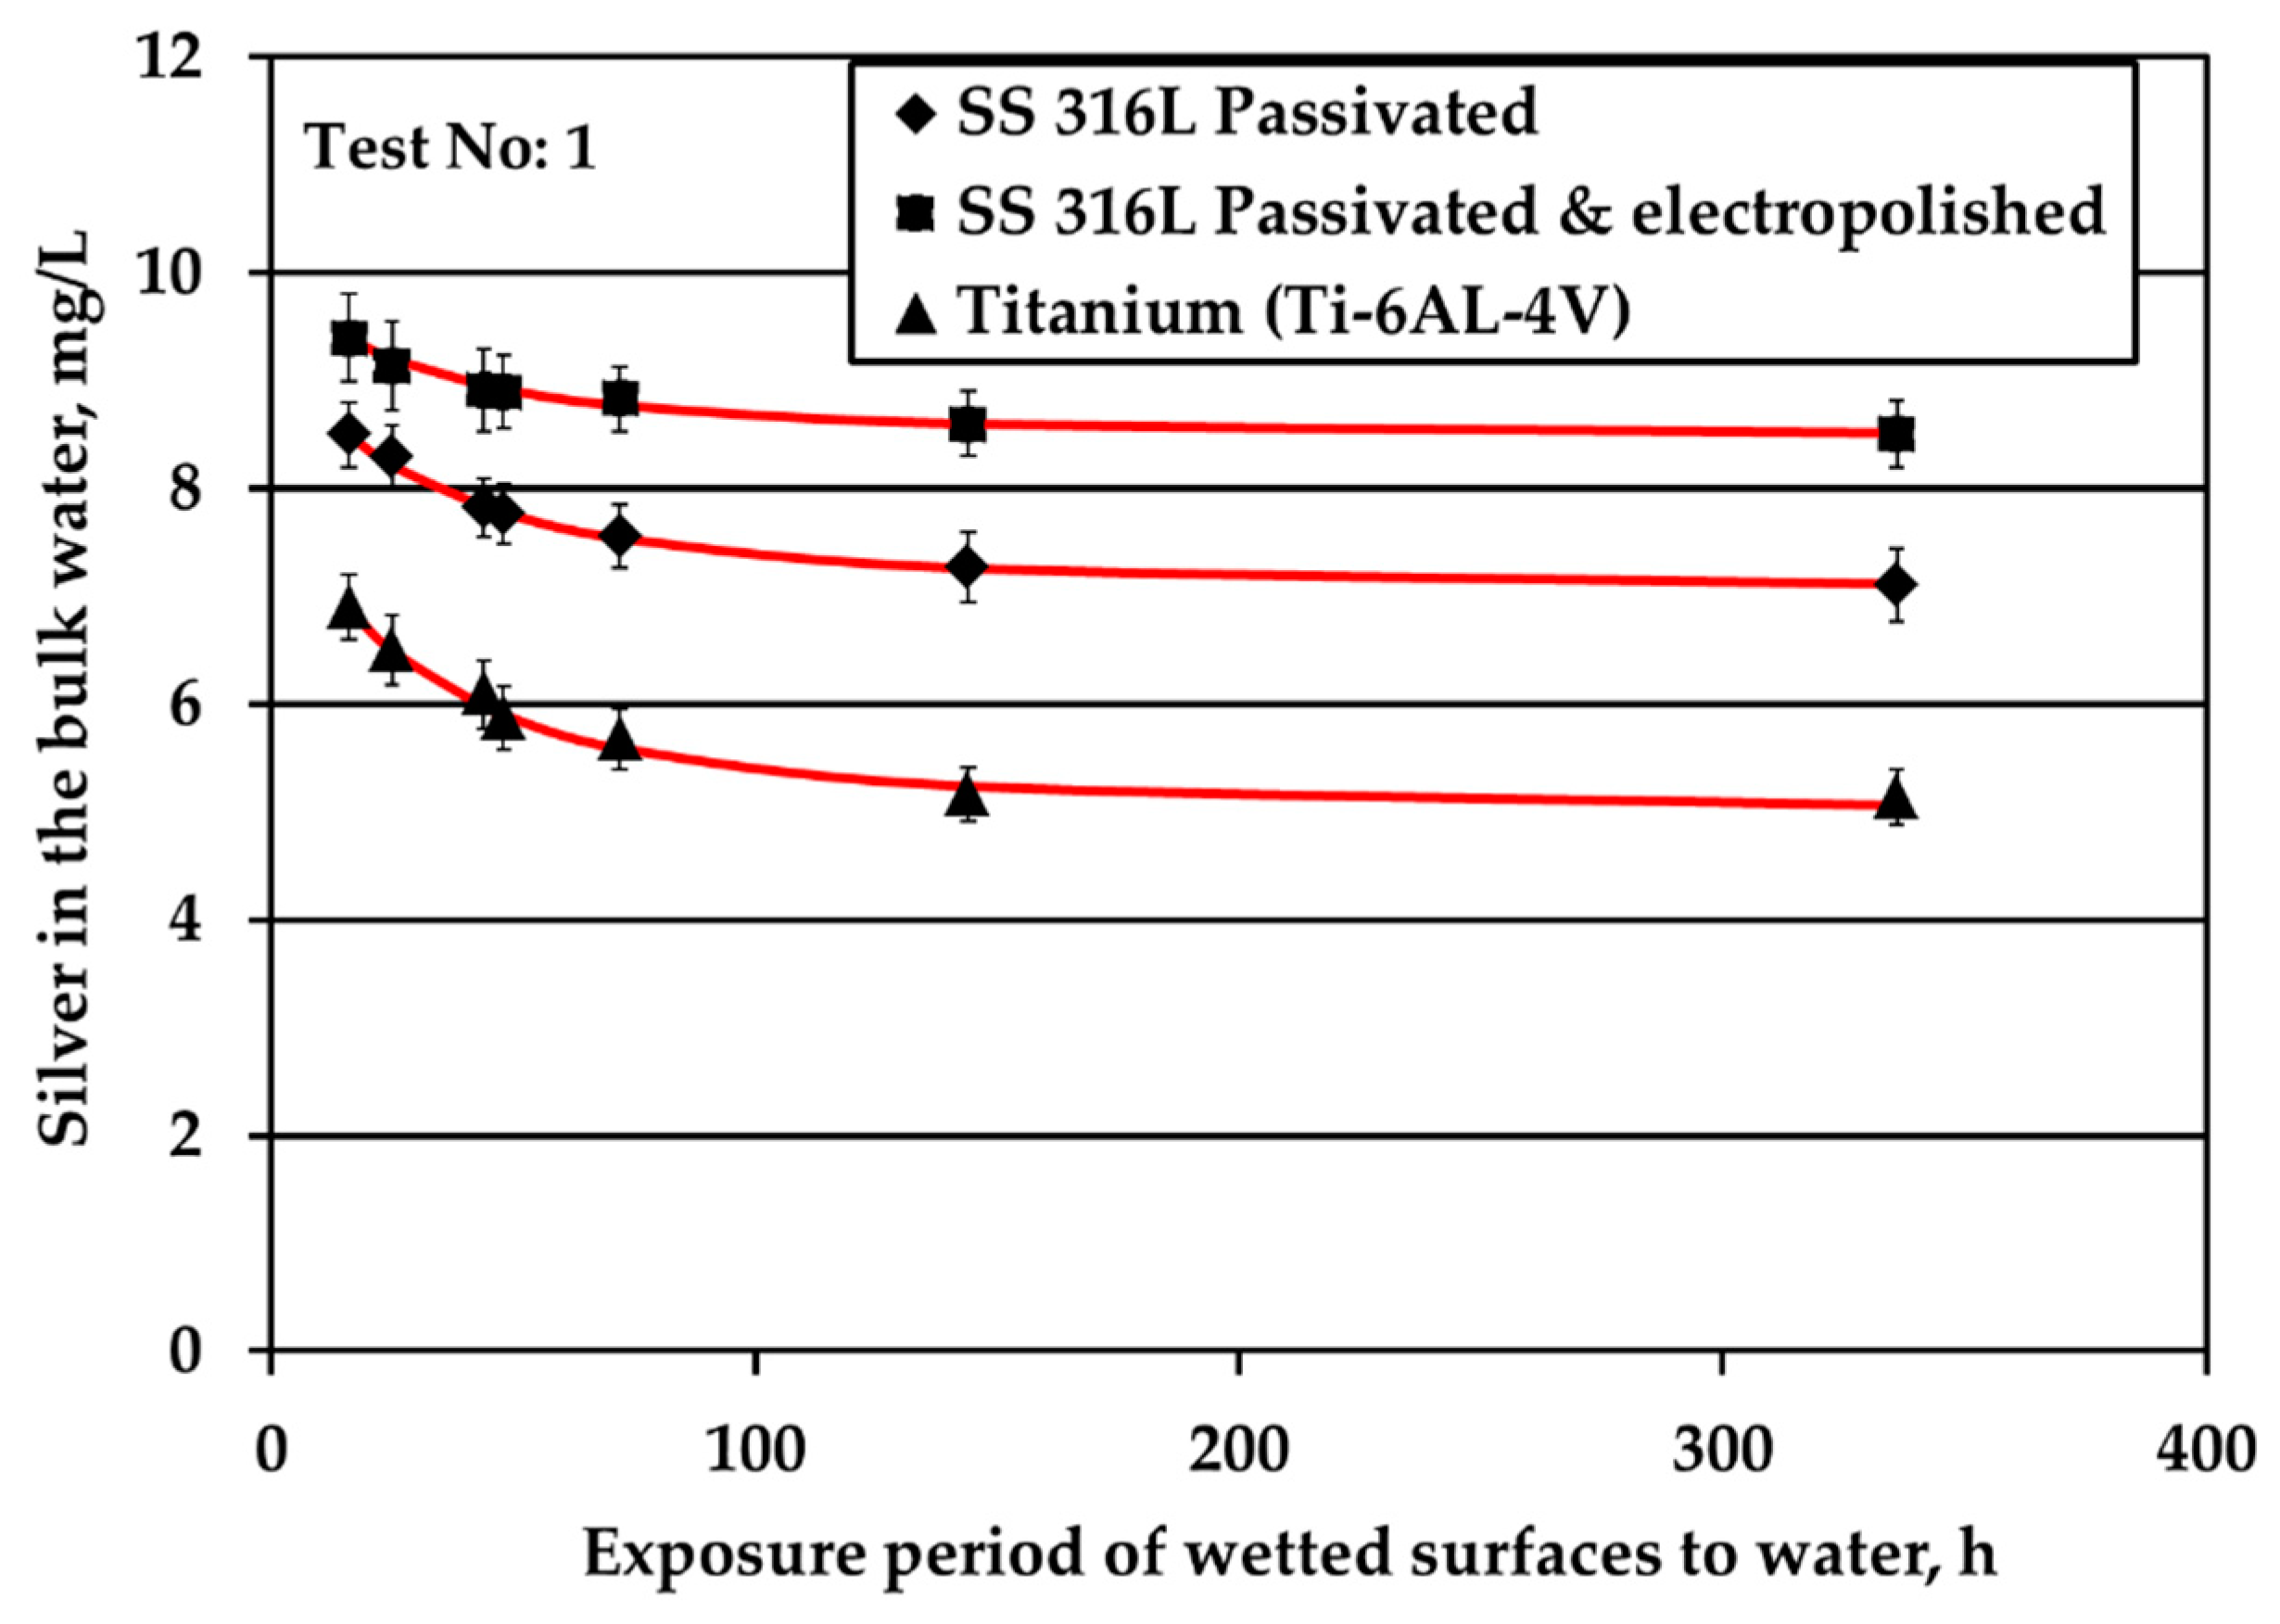
The next set under examination is that of solid surfaces exposed to water with 10 mg/L Ag ions under S/V ratio equal to 1.0 cm−1 (Figure 1a). The characteristic mass transfer time is 6 hours so the initial part of the concentration evolution curve is influenced by mass transfer and cannot be used for kinetic parameter extraction. Nevertheless, the concentration evolution after tin = 16 h is very slow (compared to the mass transfer dynamics) so this part of the process can be safely considered as surface reaction dominated. The type of data here is very different from those of the test performed under water motion since they refer to a much larger bulk Ag concentration, which can be considered constant (approximately equal to its average value) during the examined period. It is attempted to keep the reaction expression similar to these derived previously. So, the following form is considered:
R(Ci,q) = K(1 − q/qm)1.5
The parameter K(mass/area/time) is now a constant since the bulk concentration is assumed constant during the experiment. The above relation is substituted in equation (7). It is noted that the effect of mass transfer can be ignored for t > tin. Let us denote Cin the measured concentration now t = tin. Equation (7) can be integrated analytically (using the solute mass balance q = V(Co−C)/S and the initial condition C = Cin at t = tin) to give:
where B = V/(Sqm). The parameters K and qm are chosen such that the above expression matches the data of Test #1 for tin = 16 h. The values of the parameters computed from the fitting are; passivated SS316L solid surface: K = 0.00011 mg/cm2/h, qm = 0.003 mg/cm2; electropolished SS316L solid surface: K = 5.5 × 10⁻⁵ mg/cm2/h, qm = 0.0015 mg/cm2; Ti alloy solid surface: K = 0.00023 mg/cm2/h, qm = 0.005 mg/cm2.
The experimental and the fitted concentration evolution curves for the test of S/V = 1.0 cm−1 and Ag concentration = 10 mg/L in the absence of water motion are shown in Figure 5. The values of qm are comparable (albeit smaller) than those of the previous analysis for the test performed under water motion. The loading, q, range is part of the corresponding range spanned in the experiments performed under water motion. It is interesting that the values of the kinetic constant K derived from results of tests without water motion (equivalent to kC of test performed under water motion case) are found to be similar or larger to those of the test under water motion, confirming the common knowledge that the surface reaction rate is an increasing function of bulk concentration.
Finally, the results obtained from the experiment with S/V = 0.1 cm−1 and Ag ions concentration equal to 10 mg/L (Figure 1b) are analyzed through the kinetic model. The characteristic mass transfer time is 25 d, but the very slow kinetics after tin = 21 days implies that mass transfer contribution can be ignored for t > tin. So, only the data for passivated SS316L and Ti alloy solid surfaces are useful. The particular data are of specific importance since they correspond to larger values of loading than the so far examined results. It is found then the exponent n in the kinetic expression must take the value 1 (instead of 1.5), in order to match the data for Ti alloy. Equation (7) with the following kinetic expression:
is integrated analytically starting from t = tin to give:
where again B = V(Sqm). The fitting values are K = 7.2 × 10⁻⁶ mg/cm2/h and qm = 0.0089 mg/cm2. The data from passivated SS316L solid surface can be described by a straight line which implies that n = 0 in the kinetic equation. The value of K derived from the data is 3.1 × 10⁻⁶ mg/cm2/h. The q value at the end of the experiment is about four times larger than the q value at the end of test performed under water motion. The experimental and the fitting concentration evolution curves for tests conducted with S/V = 0.1 cm−1 and Ag ions concentration equal to 10 mg/L are shown in Figure 6.
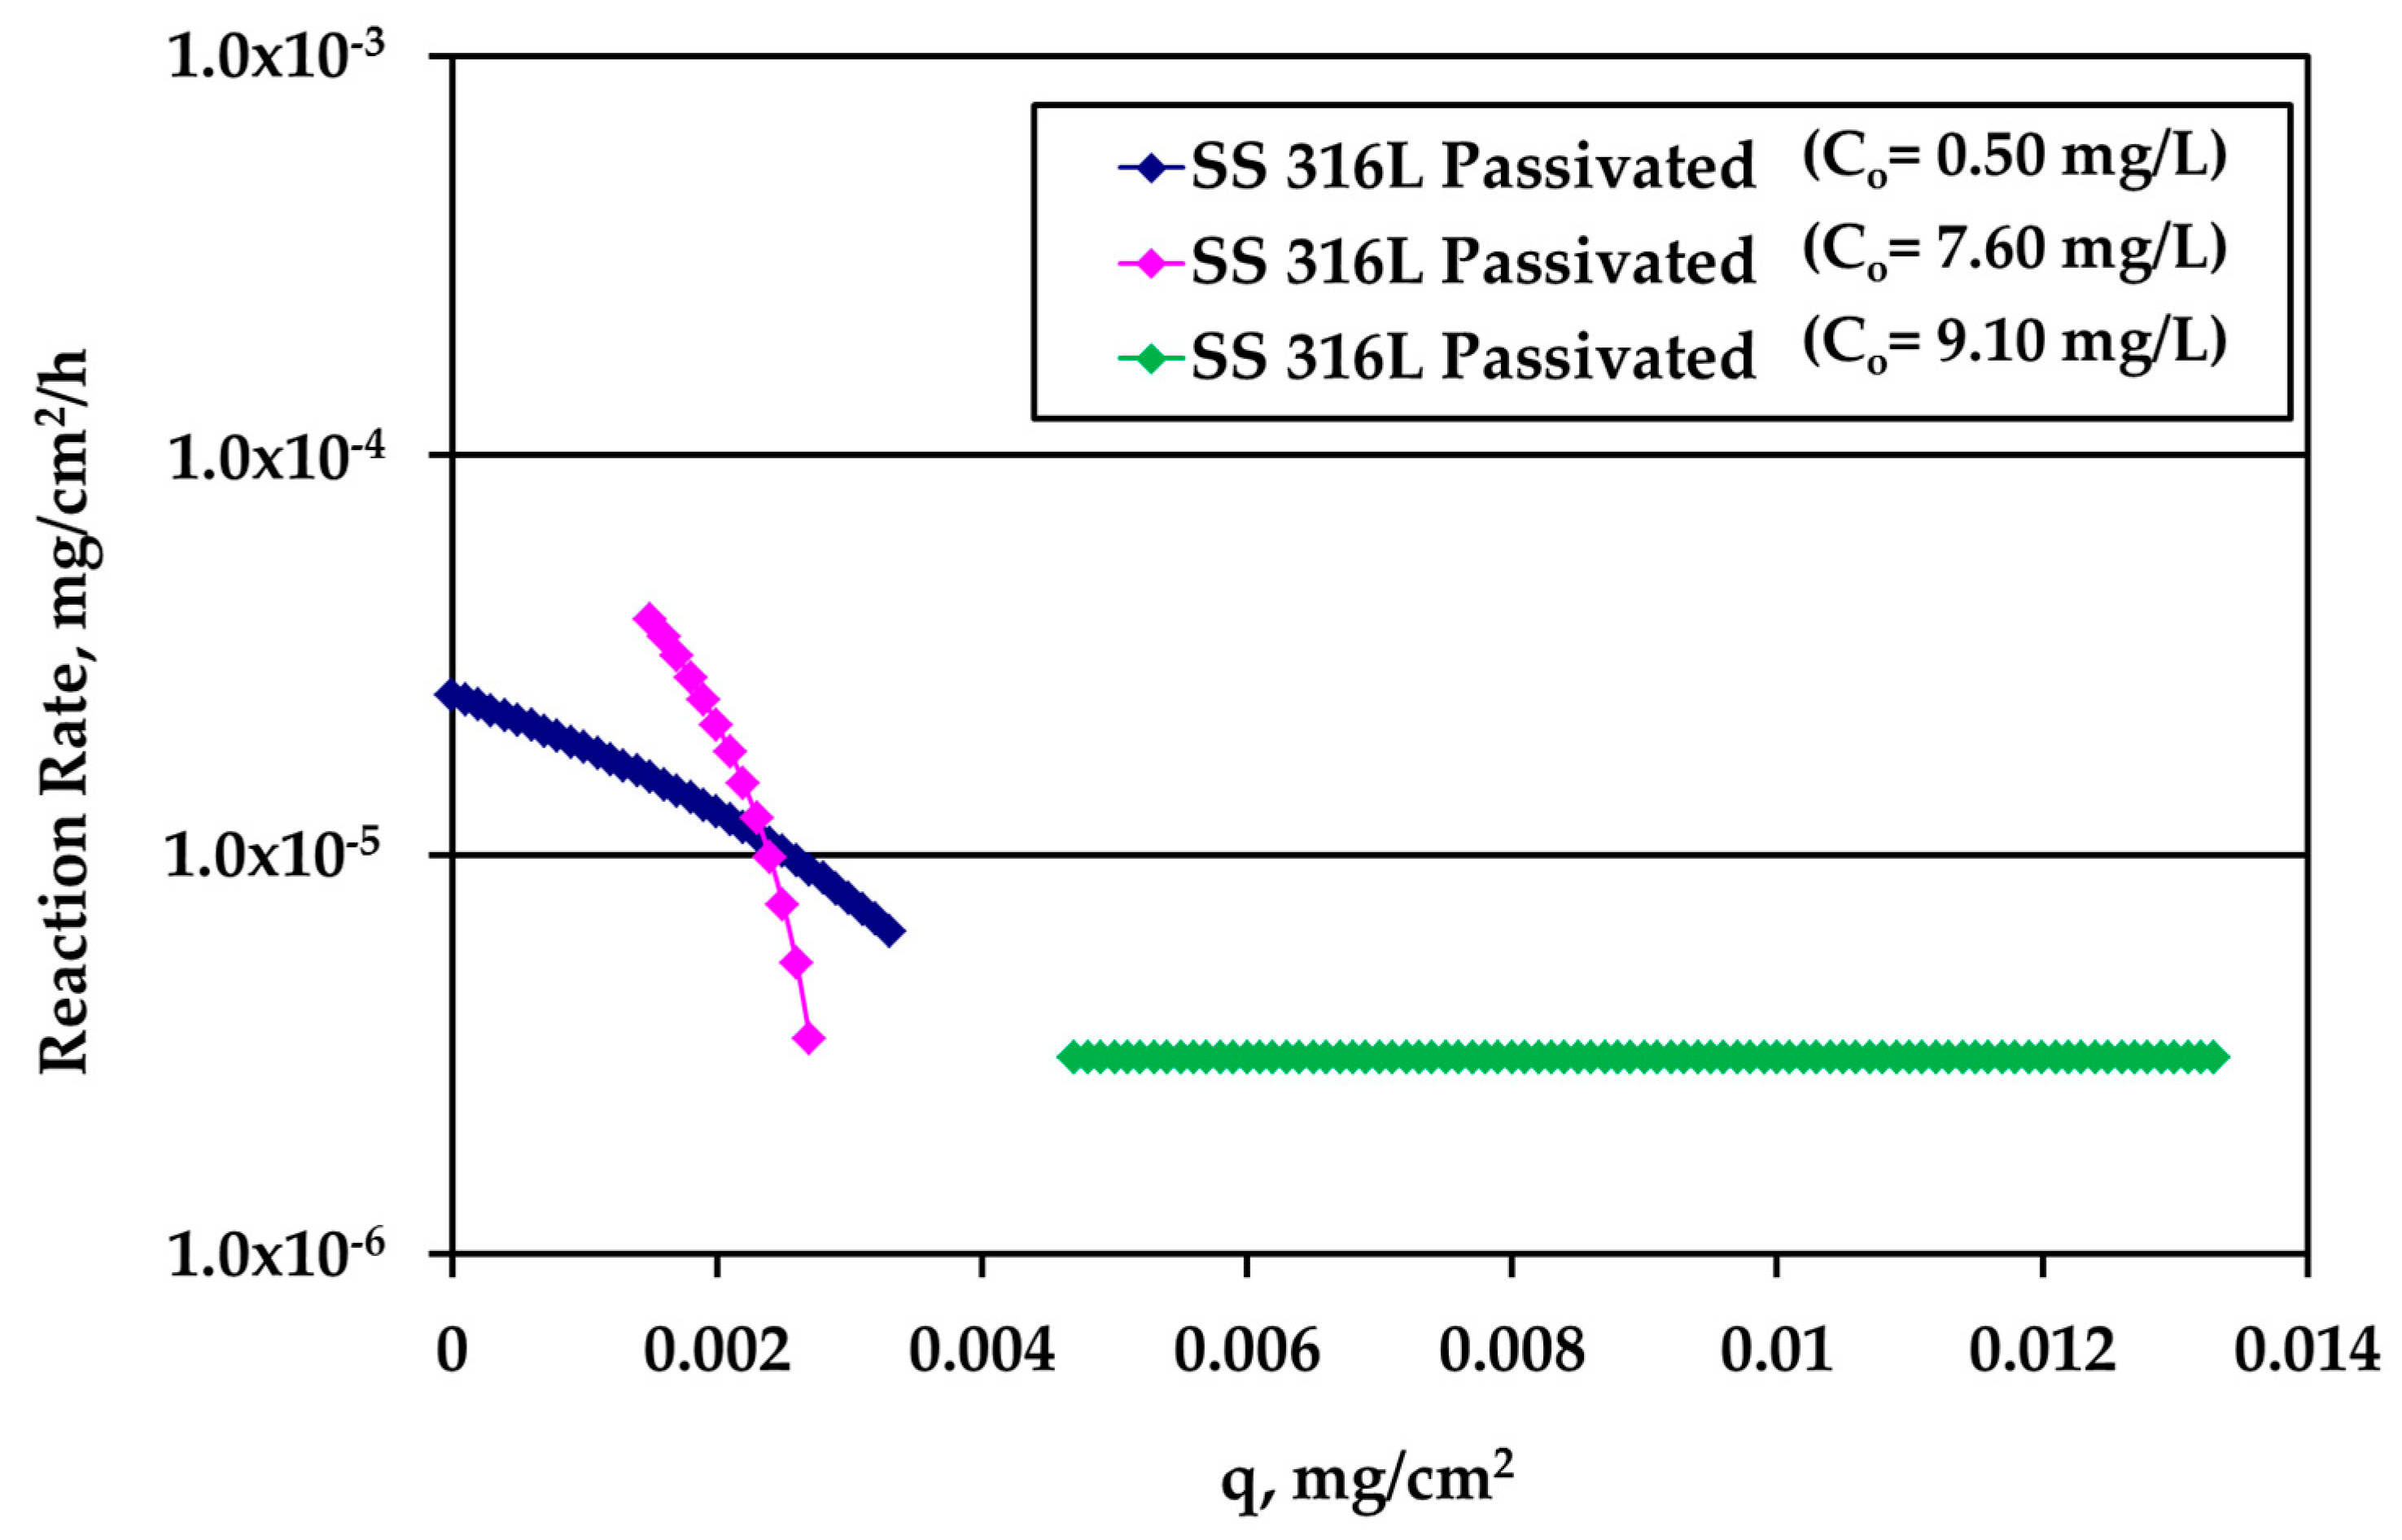
It is very interesting to plot the reaction rate R (mg/cm2/h) versus the loading q using the whole information extracted above from the experiments. The results for passivated SS316L are shown in Figure 7. The different curves refer to different kinetic experiments and to different Ag bulk concentration values.
At low loadings, the rate is larger for larger Ag bulk concentration, as expected. As loading increases, the rate concentration dependence decreases indicating that bulk concentration and loading influence the reaction rate in series and not independent from each other. The crossing of the two different concentration curves is not essential since it is due to the asymptotic behavior of the data obtained during tests with high Ag concentration (10 mg/L) and S/V = 1.0 cm−1. A slight modification of the last experimental point would eliminate this crossing. A loading independent reaction rate appears at large values of q.
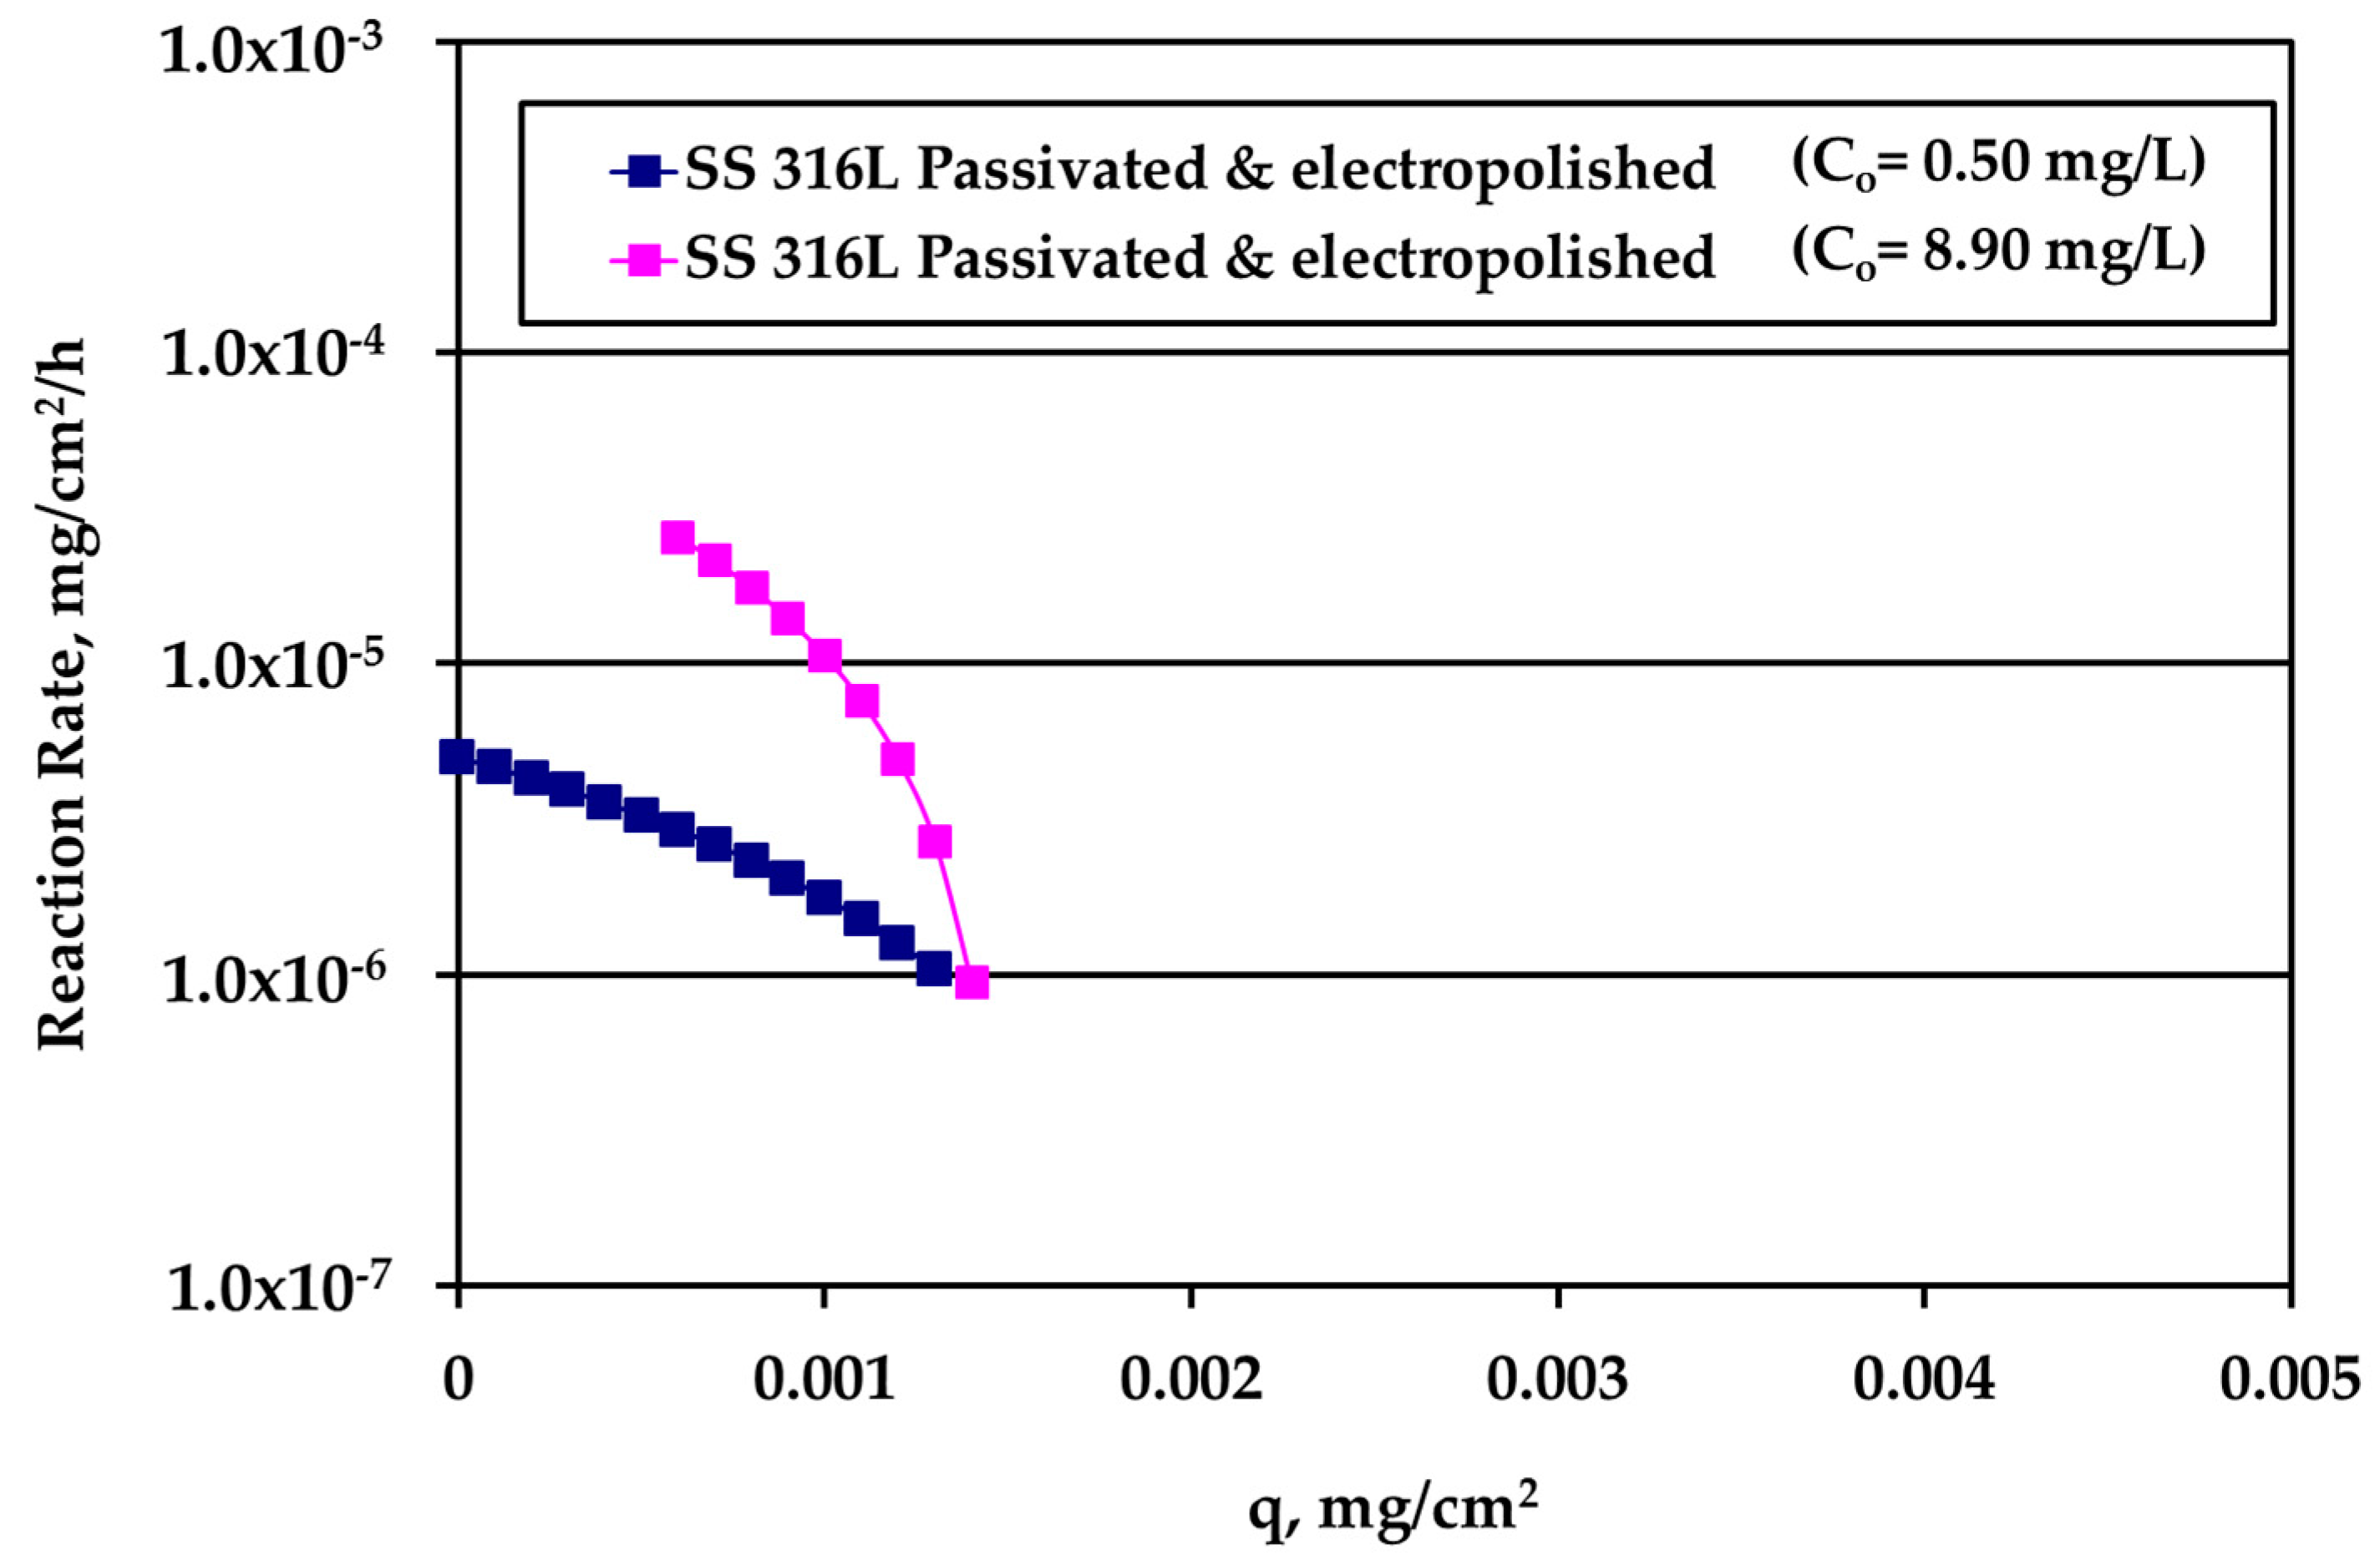
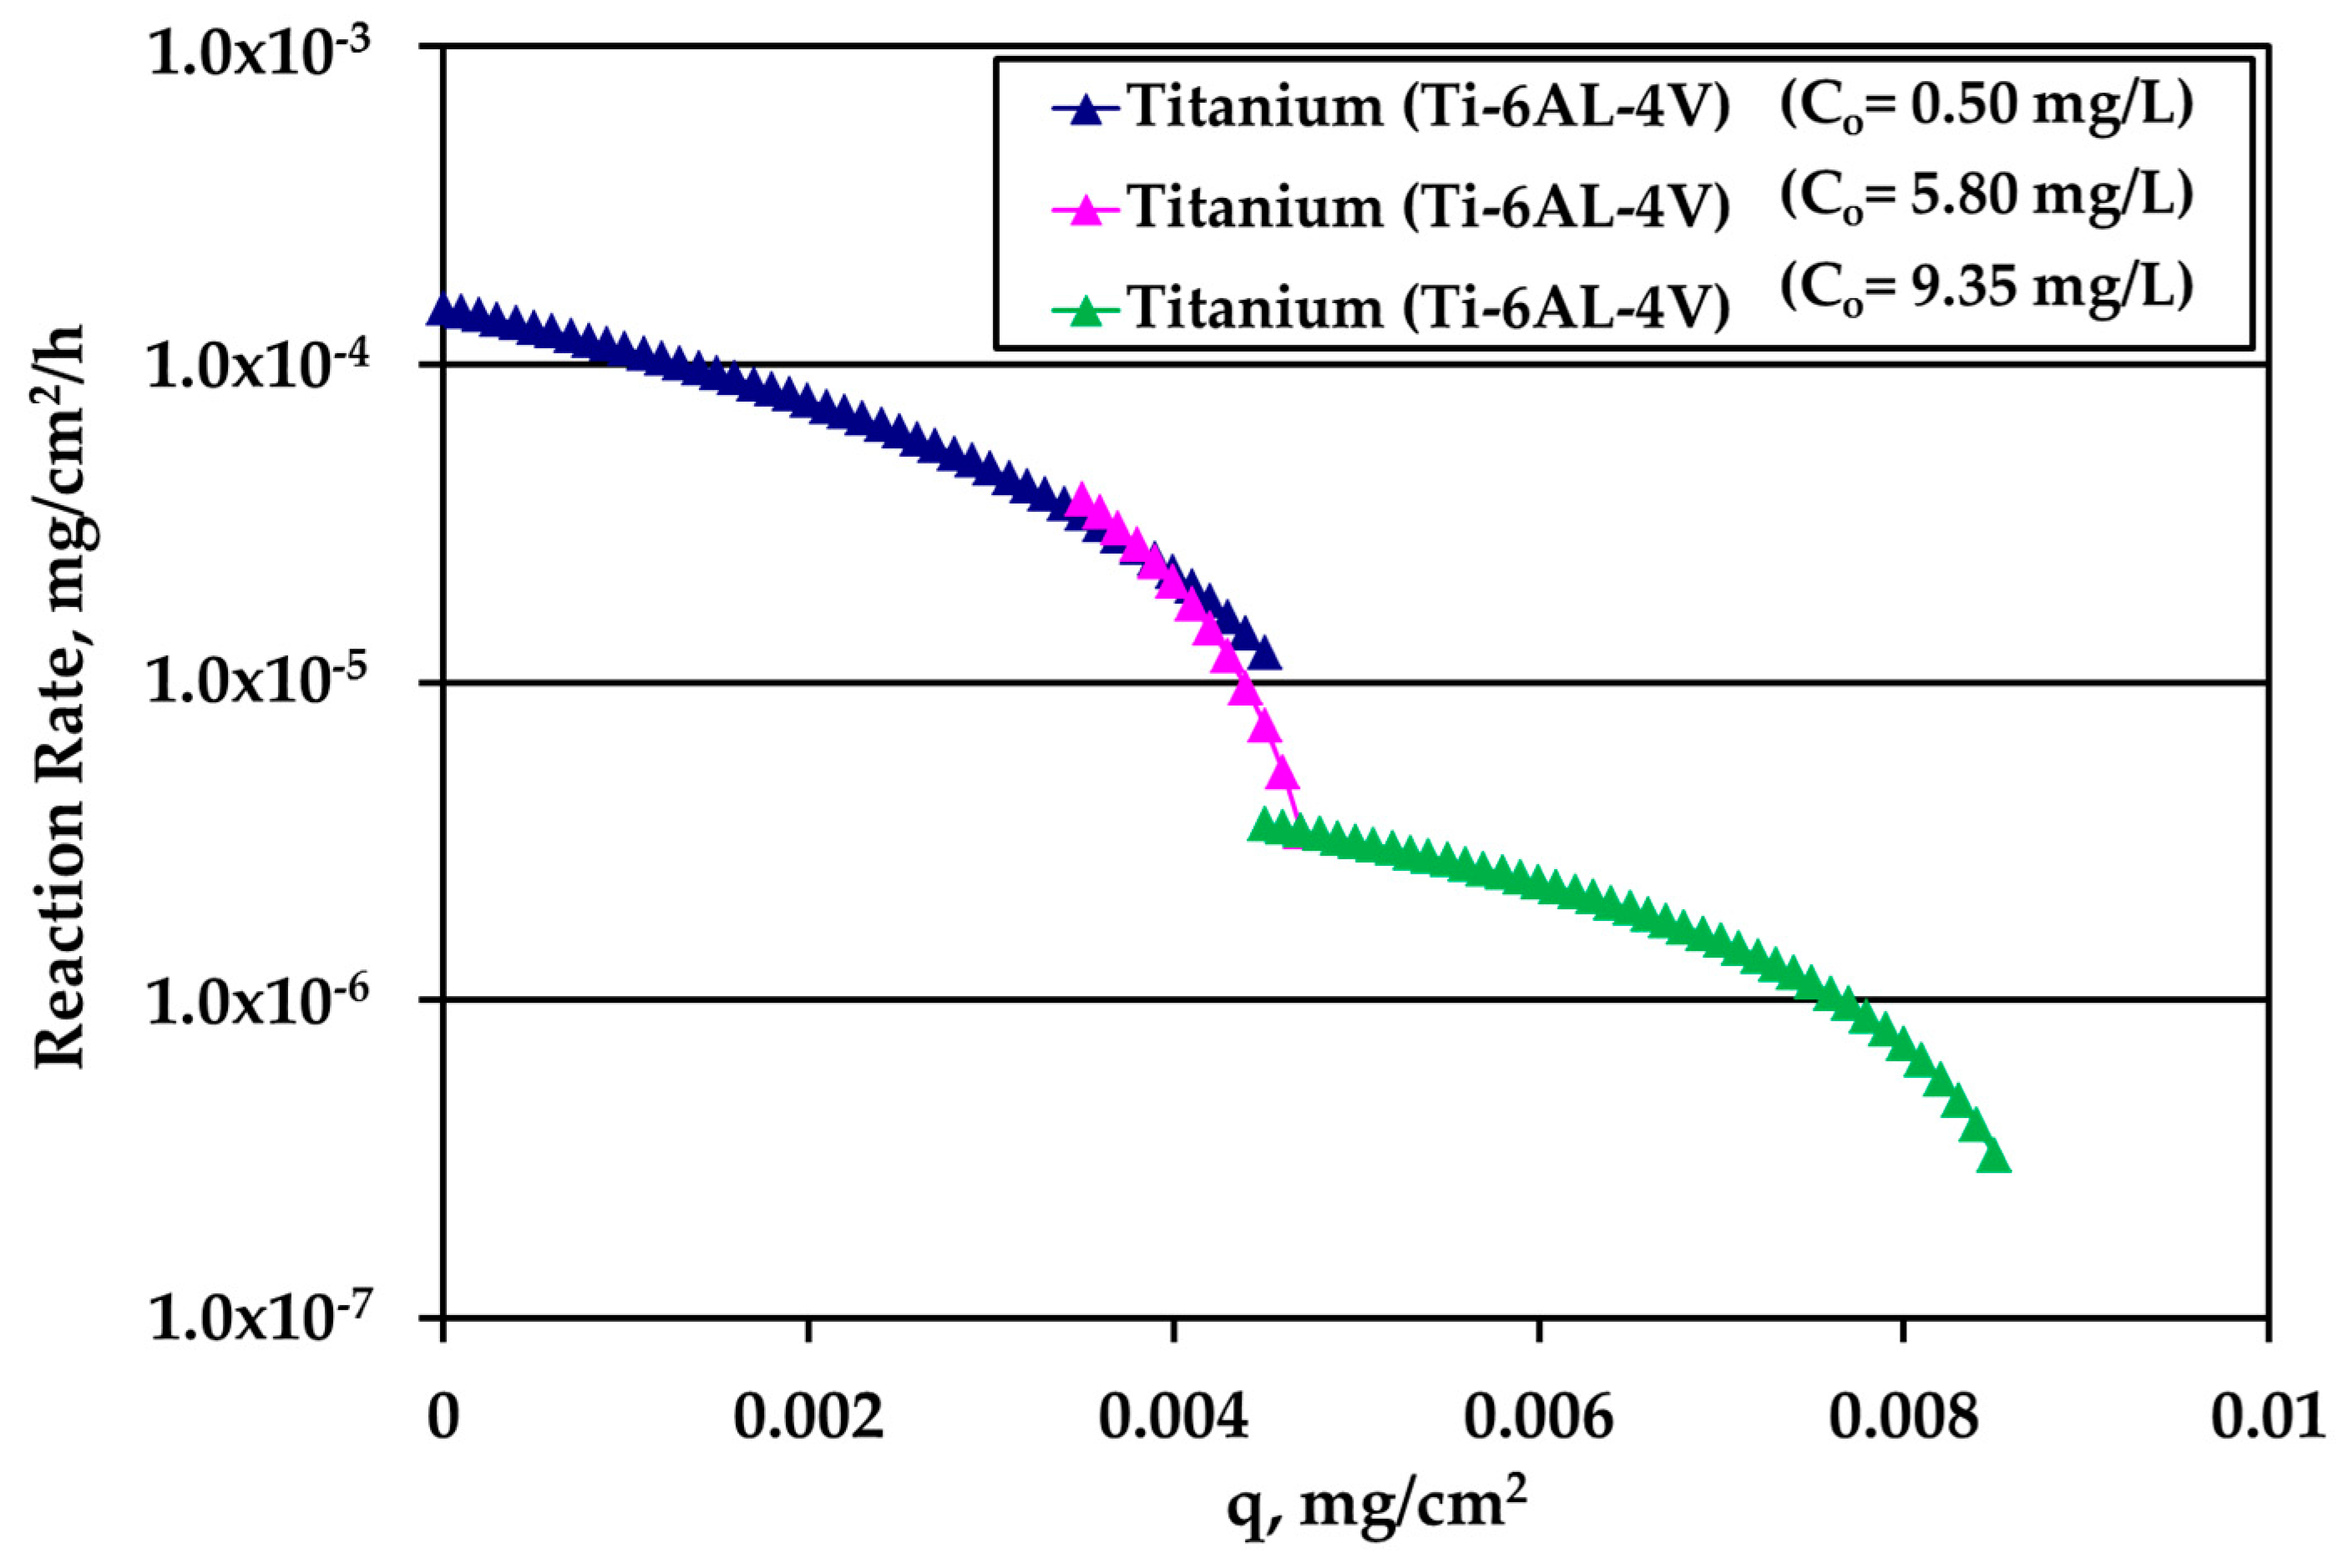
The rate data for electropolished SS316L appear in Figure 8. The rate is clearly higher for higher Ag bulk concentration and the difference decreases as q increases. The loading capacity qm of tests under water motion appears to be much smaller for this solid surface. Finally, the reaction rate for Ti alloy is presented in Figure 9. There is an overlap between the data from the experiments performed under water motion and experiment conducted at high Ag concentration (10 mg/L) and S/V = 1.0 cm−1 in stagnant conditions, indicating an independence from bulk concentration at the common range of loading q. In case of Ti, the whole set of rate data can be described by a single curve for q dependence as it is clear in Figure 9.
Summarizing the findings of this study, the electropolished SS material shows the lowest value of silver deposition capacity, referred herein as loading; however, the surface reaction rate remains stable as loading increases, suggesting that most probably this type of material is prone to continuous silver deposition. On the other hand, for the titanium alloy, the surface reaction rate is progressively decreasing as the silver deposition increases; indicating that under specific conditions the surface of this material can get saturated. If so, this material has a high potency to be used for long term storage of water, without observing further silver depletion from water and posing risks to human health. Still, the outcomes of this study should be investigated further including considerations such as the verification of maximum loading capacity of each candidate material and the reverse phenomena that might occur under real conditions.
A very recent work studies the interaction of Ag ions with a stainless steel surface (304 SS) [25]. The experimentally inventory is certainly more extended than the present one. The focus is on antimicrobial properties of the surface (for terrestrial applications) in contrast with the present work in which the remaining Ag in the bulk liquid is of practical interest. Li et al. [26] demonstrate that no Ag removal from the surface occurs for ultrapure water whereas in case of tap water the removal is very low. Ag can be removed from the surface only using chemical means. This is in perfect agreement with the present argument that Ag is incorporated into the metal through a chemical reaction. On this ground, it can be stated that the Ag incorporation to the metal surface kinetics is erroneously treated as a typical adsorption process, as shown by Li et al. [26]. All the adsorption kinetic models are tested against the data and it was found that the pseudosecond order one describes better the data. It is reminded that they are purely empirical models offering no extrapolation capabilities (see Ref. [25] for a detailed analysis to the subject). On the other hand, here the correct interpretation of chemical reaction domination has been made and chemical reaction expressions that describe the experimental data were derived.
Further to the direct findings of the present work like the superiority of Ti over SS surfaces for the particular application examined (retaining of Ag in the bulk liquid), its major contribution is that a specific framework is proposed for the modeling and subsequently design of water storage systems for long term missions. It was shown that an essential step of the Ag removal from the bulk mechanism is the surface reaction. This mechanism can be isolated by the intense stirring of the experimental set-up allowing in this way the derivation of surface reaction kinetic expressions. These expressions can be further improved in the future by considering additional experimental data and consulting the theoretical background of the galvanic replacement process. The final stage of the proposed procedure is the modeling of the storage system operation in the space station. In that case, diffusion has a considerable influence on the Ag removal kinetics and it must be modeled in detail. Also, the effect of varying water level due to water consumption must be considered. This type of modeling will eventually allow the overall optimization of the water storage system in the ISS. Obviously, the derivation of surface reaction kinetic rate, which is the purpose of the present work, is an essential step of the above strategy.
5. Conclusions
This study focuses on the kinetic behavior of silver deposition on three different materials that are currently used in potable water systems of ISS. A reaction engineering model is developed taking into consideration the experimental set up. The form and parameters of surface reaction rate expression are derived by fitting the model to the experimental data for bulk Ag concentration evolution. For passivated SS, both silver bulk concentration and surface loading affect the surface reaction rate at low loadings whereas a loading independent reaction rate appears at large values of silver loading. Similar behavior in case of low loading is found for electropolished SS. Finally, for Ti alloy, the reaction rate decreases continuously as the silver loading increases (in contrast to SS). The results of this study are valuable for the selection of water container materials. Further experimental testing is needed for the identification of the maximum loading capacity for electropolished SS and Ti alloy and of the reversibility aspects of loading, as well.
Author Contributions
Conceptualization, M.P. and M.K.; methodology, M.P., V.T. and M.K.; software, M.K.; validation, M.P., V.T., E.D. and M.K.; formal analysis, M.K. and V.T.; investigation, M.K., M.P. and V.T.; resources, M.P.; data curation, M.K. and V.T.; writing—original draft preparation, M.P. and M.K.; writing—review and editing, M.K.; M.P.; V.T. and E.D.; visualization, V.T.; supervision, M.K. and E.D.; project administration, M.P.; funding acquisition, M.P. All authors have read and agreed to the published version of the manuscript.
Funding
This research was funded by the European Space Agency (ESA) (Co. No. 4000109529/13/NL/CP).
Conflicts of Interest
The authors declare no conflict of interest.
Abbreviation
| c | localized Ag ion concentration |
| C | spatially average bulk Ag ion concentration |
| Ci | Ag ion concentration adjacent to the active surface |
| Co | initial value of C |
| D | diffusivity of Ag ions in water |
| h | mass transfer coefficient |
| k, K, n | reaction kinetic model parameters |
| L | effective liquid depth in the test cell |
| q | mass of Ag accumulated at active surface |
| qm | maximum value of q |
| R | surface reaction rate |
| S | active surface area in the test cell |
| t | time |
| tin, Cin, B | auxiliary parameters used to fit the model to the data |
| V | liquid volume in the test cell |
| u | characteristic velocity for diffusion |
| x | distance from the active surface |
| τ | characteristic time for mass transfer in the test cell |
References
- Jones, T.D. The view from here: Moving beyond earth: NASA’s steps through 2020. Aerosp. Am. 2012, 50, 16–19. [Google Scholar]
- Vicente, N.; Walker, C. Europe’s ticket to deep space: The Orion European service module. ESA Bull. Eur. Space Agency 2017, 169, 8–19. [Google Scholar]
- Grizzaffi, L.; Lobascio, C.; Bruno, G.; Saverino, A. ATV Water Preparation Campaign. SAE Int. Tech. Pap. Ser. 2008. [Google Scholar] [CrossRef]
- Rebeyre, P. ‘ATV Water Quality: ATV1 and ATV3 Water Quality Overview’; European Space Research and Technology Centre: Noordwijk, The Netherlands, TEC-MMG/2012/324; 2012. [Google Scholar]
- Lobascio, C.; Bruno, G.; Grizzaffi, L.; Meucci, L.; Fungi, M.; Giacosa, D. Quality of ATV Potable Water for ISS Crew Consumption. SAE Int. 2004, 113, 1122–1129. [Google Scholar]
- Wallace, W.T.; Castro-Wallace, S.L.; Kuo, C.K.M.; Loh, J.L.; Hudson, E.; Gazda, B.D.; Lewis, J.F. ‘Effects of Material Choice on Biocide Loss in Orion Water Storage Tanks’. In Proceedings of the 46th International Conference on Environmental Systems, Vienna, Austria, 10–14 July 2016; pp. 1–10. [Google Scholar]
- Wallace, W.; Wallace, S.; Loh, L.; Kuo, C.; Hudson, E., Jr.; Marlar, T.; Gazda, D. Effects of Materials Surface Preparation for Use in Spacecraft Potable Water Storage Tanks. Acta Astronaut. 2017, 141, 30–35. [Google Scholar] [CrossRef]
- Li, W.; Calle, L.M.; Hanford, A.J.; Stambaugh, I.; Callahan, M.R. Investigation of Silver Biocide as a Disinfection Technology for Spacecraft: An Early Literature Review. In Proceedings of the 48th International Conference on Environmental Systems, Albuquerque, NM, USA, 8–12 July 2018; pp. 1–17. [Google Scholar]
- Wadhera, A.M.D.; Fung, M.M.D. Systemic Argyria Associated with Ingestion of Colloidal Silver. Dermatol. Online J. 2005, 11, 1–12. [Google Scholar]
- Ahamed, M.; Alsalhi, M.S.; Siddiqui, M.K. Silver nanoparticle applications and human health. Clin. Chim. Acta 2010, 411, 1841–1848. [Google Scholar] [CrossRef] [PubMed]
- Rebeyre, P. ATV Water Process Overview—ATV Water Delivery System, Water Production and Transportation to Launch Site, Water Quality Control; European Space Research and Technology Centre: Noordwijk, The Netherlands, 2012; TEC-MMG/2010/29. [Google Scholar]
- Petala, M.; Tsiridis, V.; Mintsouli, I.; Pliatsikas, N.; Spanos, T.; Rebeyre, P.; Darakas, E.; Patsalas, P.; Vourlias, G.; Kostoglou, M.; et al. Silver deposition on stainless steel container surfaces in contact with disinfectant silver aqueous solutions. Appl. Surf. Sci. 2017, 396, 1067–1075. [Google Scholar] [CrossRef]
- Mintsouli, I.; Tsiridis, V.; Petala, M.; Pliatsikas, N.; Rebeyre, P.; Darakas, E.; Kostoglou, M.; Sotiropoulos, S.; Karapantsios, T. Behavior of Ti-6Al-4 V surfaces after exposure to water disinfected with ionic silver. Appl. Surf. Sci. 2018, 427, 763–770. [Google Scholar] [CrossRef]
- Callahan, M.R.; Adam, N.K.; Roberts, M.S.; Garland, J.L.; Sager, J.C.; Pickering, K.D. Assessment of Silver Based Disinfection Technology for CEV and Future US Spacecraft. SAE Int. 2007. [Google Scholar] [CrossRef]
- Roberts, M.S.; Hummerick, M.E.; Edney, L.S.; Bisbee, A.P.; Callahan, R.M.; Loucks, S.; Pickering, K.D.; Sager, J.C. Assessment of Silver Based Disinfection Technology for CEV and Future US Spacecraft: Microbial Efficacy. SAE Int. 2007. [Google Scholar] [CrossRef]
- Petala, M.; Tsiridis, V.; Darakas, E.; Mintsouli, I.; Sotiropoulos, S.; Kostoglou, M.; Karapantsios, T.; Rebeyre, P. ‘Silver deposition on wetted materials used in the potable water systems of the International Space Station’. In Proceedings of the 46th International Conference on Environmental Systems, Vienna, Austria, 10–14 July 2016; pp. 1–12. [Google Scholar]
- Adam, N.M. Compatibility Study of Silver Biocide in Drinking Water with Candidate Metals for the Crew Exploration Vehicle Potable Water System. SAE Tech. Pap. Ser. 2009. [Google Scholar] [CrossRef]
- Shamsuddin, N.; Das, D.B.; Starov, V.M. Membrane-Based Point-Of-Use Water Treatment (PoUWT) System in Emergency Situations. Sep. Purif. Rev. 2016, 45, 50–67. [Google Scholar] [CrossRef]
- Parr, J.M.P.; Kim, Y. Electrochemical silver dissolution and recovery as a potential method to disinfect drinking water for underprivileged societies. Environ. Sci. Water. Res. Technol. 2016, 2, 304–311. [Google Scholar] [CrossRef]
- Ranade, V. Computational Flow Modeling for Chemical Reactor Engineering, 1st ed.; Academic Press: London, UK, 2001. [Google Scholar]
- Tien, C. Adsorption Calculations and Modeling, 1st ed.; Butterworth–Heinemann: Boston, MA, USA, 1994. [Google Scholar]
- Crank, J. The Mathematics of Diffusion, 1st ed.; Oxford University Press: Oxford, UK, 1975. [Google Scholar]
- Straub, J.E., II; Plumlee, D.K.; Schultz, J.R. ISS Expeditions 16 through 20: Chemical Analysis Results for Potable Water. In Proceedings of the 40th International Conference on Environmental Systems, Barcelona, Spain, 11–15 July 2010; pp. 1–15, AIAA-2010-6042. [Google Scholar]
- Kopchenova, N.V.; Maron, I.A. Computational Mathematics, 1st ed.; Mir Publisher: Moscow, Russia, 1975. [Google Scholar]
- Kyzas, G.Z.; Kostoglou, M. Green adsorbents for wastewaters: A critical review. Materials 2014, 7, 333–364. [Google Scholar] [CrossRef] [PubMed]
- Li, N.; Li, X.; Yang, Y.; Liu, Y.; Zhao, L.; Zhou, Z. Adsorption-desorption behavior of silver ions on stainless steel as a proxy for disinfection of domestic hot water. Desalin. Water Treat. 2019, 151, 230–241. [Google Scholar] [CrossRef]
Figure 1.
Silver loss from the bulk water (initial Ag concentration: 10 mg/L) for all three examined materials under nitrogen headspace and stagnant conditions for S/V equal to (a) 1.0 cm−1 and (b) 0.1 cm−1.
Figure 1.
Silver loss from the bulk water (initial Ag concentration: 10 mg/L) for all three examined materials under nitrogen headspace and stagnant conditions for S/V equal to (a) 1.0 cm−1 and (b) 0.1 cm−1.

Figure 2.
Silver loss from the bulk water (initial Ag concentration: 0.5 mg/L) for all three examined materials under nitrogen headspace and stagnant conditions for S/V equal to: (a) 1.0 cm−1; (b) 0.1 cm−1.
Figure 2.
Silver loss from the bulk water (initial Ag concentration: 0.5 mg/L) for all three examined materials under nitrogen headspace and stagnant conditions for S/V equal to: (a) 1.0 cm−1; (b) 0.1 cm−1.

Figure 3.
Silver loss from the bulk potable water for all three materials under continuous water flow conditions (S/V = 0.1 cm−1).
Figure 3.
Silver loss from the bulk potable water for all three materials under continuous water flow conditions (S/V = 0.1 cm−1).

Figure 4.
Experimental data of silver loss during tests under water flow conditions along with fitting curves.
Figure 4.
Experimental data of silver loss during tests under water flow conditions along with fitting curves.

Figure 5.
Experimental data of silver loss (obtained during test with S/V = 1.0 cm−1 and Ag concentration = 10 mg/L in the absence of water motion) along with fitting curves.
Figure 5.
Experimental data of silver loss (obtained during test with S/V = 1.0 cm−1 and Ag concentration = 10 mg/L in the absence of water motion) along with fitting curves.

Figure 6.
Experimental data of silver loss (obtained during tests conducted with S/V = 0.1 cm−1 and Ag ions concentration equal to 10 mg/L) with time for Ti alloy and passivated SS316L solid surfaces along with fitting curves.
Figure 6.
Experimental data of silver loss (obtained during tests conducted with S/V = 0.1 cm−1 and Ag ions concentration equal to 10 mg/L) with time for Ti alloy and passivated SS316L solid surfaces along with fitting curves.

Figure 7.
Reaction rate dependence on silver loading for passivated SS316L solid surface for various silver (bulk) concentration values.
Figure 7.
Reaction rate dependence on silver loading for passivated SS316L solid surface for various silver (bulk) concentration values.

Figure 8.
Reaction rate dependence on silver loading for electropolished SS316L solid surface for various silver (bulk) concentration values.
Figure 8.
Reaction rate dependence on silver loading for electropolished SS316L solid surface for various silver (bulk) concentration values.

Figure 9.
Reaction rate dependence on silver loading on titanium for various silver (bulk) concentration values.
Figure 9.
Reaction rate dependence on silver loading on titanium for various silver (bulk) concentration values.


Table 1.
Experimental conditions of the exposure of SS316L passivated, SS 316L passivated + electropolished and Titanium (Ti-6Al-4V) solid surfaces.
Table 1.
Experimental conditions of the exposure of SS316L passivated, SS 316L passivated + electropolished and Titanium (Ti-6Al-4V) solid surfaces.
| Test No | Surface to Volume Ratio, S/V (cm−1) | Silver Ions Concentration (mg/L) | Water Flow Conditions | Duration |
|---|---|---|---|---|
| 1 | 1.0 | 10 | Stagnant | 14 days |
| 2 | 0.1 | 10 | Stagnant | 24 weeks |
| 3 | 1.0 | 0.5 | Stagnant | 52 h |
| 4 | 0.1 | 0.5 | Stagnant | 24 weeks |
| 5 | 0.1 | 0.5 | Flow (mechanical shaking) | 21 days |
Table 2.
Kinetic constants and maximum uptake capacity for each of the tested materials.
| Parameter | Passivated SS | Passivated and Electropolished SS | Titanium Alloy (Ti6Al4V) |
|---|---|---|---|
| Kinetic constant, k (cm/h) | 0.05 | 0.01 | 0.3 |
| Maximum uptake capacity, qm (mg/cm2) | 0.00555 | 0.002 | 0.00555 |
© 2020 by the authors. Licensee MDPI, Basel, Switzerland. This article is an open access article distributed under the terms and conditions of the Creative Commons Attribution (CC BY) license (http://creativecommons.org/licenses/by/4.0/).
Share and Cite
MDPI and ACS Style
Petala, M.; Tsiridis, V.; Darakas, E.; Kostoglou, M. Longevity Aspects of Potable Water Disinfected by Ionic Silver: Kinetic Experiments and Modeling. Water 2020, 12, 258. https://doi.org/10.3390/w12010258
AMA Style
Petala M, Tsiridis V, Darakas E, Kostoglou M. Longevity Aspects of Potable Water Disinfected by Ionic Silver: Kinetic Experiments and Modeling. Water. 2020; 12(1):258. https://doi.org/10.3390/w12010258
Chicago/Turabian StylePetala, Maria, Vasilios Tsiridis, Efthymios Darakas, and Margaritis Kostoglou. 2020. "Longevity Aspects of Potable Water Disinfected by Ionic Silver: Kinetic Experiments and Modeling" Water 12, no. 1: 258. https://doi.org/10.3390/w12010258
Note that from the first issue of 2016, this journal uses article numbers instead of page numbers. See further details here.