Using a Tank Model to Determine Hydro-Meteorological Thresholds for Large-Scale Landslides in Taiwan


1
Department of Earth Sciences, National Cheng Kung University, No. 1, University Road, Tainan City 701, Taiwan
2
Multi-hazard Risk Assessment Division, National Research Institute for Earth Science and Disaster Resilience, 3-1, Tennodai, Tsukuba, Ibaraki 305-0006, Japan
3
Department of Geosciences, National Taiwan University, No.1, Section 4, Roosevelt Road, Taipei 10617, Taiwan
*
Author to whom correspondence should be addressed.
Water 2020, 12(1), 253; https://doi.org/10.3390/w12010253
Submission received: 3 December 2019
/
Revised: 14 January 2020
/
Accepted: 15 January 2020
/
Published: 16 January 2020
(This article belongs to the Special Issue Rainfall Thresholds and Other Approaches for Landslide Prediction and Early Warning)
Abstract
:Rainfall thresholds for slope failures are essential information for establishing early-warning systems and for disaster risk reduction. Studies on the thresholds for rainfall-induced landslides of different scales have been undertaken in recent decades. This study attempts to establish a warning threshold for large-scale landslides (LSLs), which are defined as landslides with a disturbed area more massive than 0.1 km2. The numerous landslides and extensive rainfall records make Taiwan an appropriate area to investigate the rainfall conditions that can result in LSLs. We used landslide information from multiple sources and rainfall data captured by 594 rain gauges to create a database of 83 rainfall events associated with LSLs in Taiwan between 2001 and 2016. The corresponding rainfall duration, cumulative event rainfall, and rainfall intensity for triggering LSLs were determined. This study adopted the tank model to estimate conceptual water depths (S1, S2, S3) in three-layer tanks and calculated the soil water index (SWI) by summing up the water depths in the three tanks. The empirical SWI and duration (SWI–D) threshold for triggering LSLs occurring during 2001–2013 in Taiwan is determined as SWI = 155.20 − 1.56D and D ≥ 24 h. The SWI–D threshold for LSLs is higher than that for small-scale landslides (SSLs), those with a disturbed area smaller than 0.1 km2. The LSLs that occurred during 2015–2016 support this finding. It is notable that when the SWI and S3 reached high values, the potential of LSLs increased significantly. The rainfall conditions for triggering LSLs gradually descend with increases in antecedent SWI. Unlike the rainfall conditions for triggering SSLs, those for triggering LSLs are related to the long duration–high intensity type of rainfall event.
1. Introduction
In the past two decades, the frequency of occurrence of extreme rainfall events and large-scale natural hazards has increased significantly worldwide [1,2,3,4,5,6], causing substantial economic losses and human casualties. In past studies [7,8,9], the characteristics of a large-scale landslide have been reported, including (1) extremely high movement velocity, (2) a large collapse volume, and (3) deep excavations into bedrock. Nevertheless, discriminating large-scale landslides (LSLs) from small-scale landslides (SSLs) requires many in situ observations, which remain difficult to accomplish extensively. In practical terms, the mass movement velocity and excavation depth are both difficult to observe, so the disturbed area or volume is mainly treated as a scale indicator of a landslide [10]. In the study, large-scale landslides (LSLs) are defined as landslides with a disturbed area more massive than 0.1 km2. Although the occurrence frequency of LSLs is much lower than that of SSLs, LSLs induce rapid alterations of the topography, causing calamities on a far greater scale than do SSLs. Moreover, the Earth’s surface processes in mountainous areas are significantly affected by LSLs.
For better evaluation of landslide hazards induced by rainfall-triggered LSLs, it is essential to comprehend the circumstances that induce failure and the mass movement following collapse [11,12]. Accurate landslide information on occurrence time, size, and location are beneficial for comprehending when, where, and how slopes may collapse following heavy rainfall [13]. Rainfall is well known as one of the significant factors in landslide occurrence, so in-depth knowledge of the effects of rainfall conditions is required. At present, Taiwan has an early-warning system for debris flows based on the relationship between rainfall intensity and effective rainfall [14]. The effective rainfall contributing to debris-flow occurrence includes the cumulative rainfall during the considered rainfall event and its 7-day antecedent rainfall before the rainfall event. However, there is no early-warning system for massive landslides in Taiwan. To control damage, the rainfall conditions that induce LSLs must be determined and used to define a rainfall threshold as a criterion of early-warning for the prevention and mitigation of disasters.
Rainfall parameters, including duration, intensity, cumulative rainfall, and antecedent rainfall, have been utilized in many previous studies to identify the essential rainfall conditions for shallow landslide occurrence [15,16,17,18,19]. Among the characteristics of rainfall, the cumulative rainfall represents the total height of precipitation on the ground surface, but it may not reflect the intratelluric water content, which involves the processes of infiltration, drainage, and even evapotranspiration. Kuo, et al. [20] adopted the traditional dual-factor analysis, i.e., rainfall intensity versus rainfall duration (I-D), cumulative rainfall versus rainfall duration (R-D), and rainfall intensity versus cumulative rainfall (I-R), to investigate in preliminary terms the rainfall thresholds for triggering LSLs. They reported that the cumulative rainfall might be the deterministic factor in triggering LSLs. However, the complicated relationship between the meteorological trigger and the hydrological cause was not considered in the study of Kuo, et al. [20]. Bogaard and Greco [21] have proposed analyzing the precipitation thresholds for landslides and debris flows from a hydro-meteorological point of view. In their study, the soil water index (SWI) is treated as a proxy for both meteorological trigger and hydrological cause.
The SWI proposed by Sugawara, et al. [22] is derived from a three-layer tank model. The value of the SWI is estimated to represent the depth of the remaining water in the three-layer tank. Similarly, Segoni, et al. [23] discovered that the performance of a regional scale landslide warning system could be improved by using soil moisture data instead of antecedent rainfall. The influences of infiltration and drainage on water content within slopes are considered when calculating the SWI. Currently, the Japan Meteorological Agency (JMA) adopts the SWI as the conceptual soil water content affected by antecedent rainfall as well as event rainfall [24]. Furthermore, the tank model has been successfully applied to discuss the influence of water infiltration on deep-seated landslides [25,26]. The estimation of groundwater supply caused by infiltration using the tank model can be considered as an indicator of pore water pressure changes in the deep layer of a slope. Chen, et al. [27] first proposed the SWI–D curve as an empirical rainfall threshold for shallow landslides in Taiwan. They noted that the SWI can be used as the indicator of the antecedent rainfall condition and recommended establishing a suitable warning system in Taiwan.
For landslide early warning systems, the thresholds for LSLs would be different from those for SSLs. Thus, different disaster alerts and evacuation strategies would be produced [21,28,29]. It would be worthwhile to create a regional warning threshold for landslides of different scales for Taiwan. However, the rainfall thresholds for landslides having a sizable disturbed area (i.e., exceeding 0.1 km2) have rarely been determined for Taiwan in the past due to the limited number of cases. In this study, an LSL dataset containing information on landslide and rainfall parameters is created to carry out statistical analysis of multiple rainfall parameters. Then SWI and rainfall duration can be used to determine the critical threshold for triggering LSLs. Moreover, this study attempts to construct a multi-threshold model different from the single threshold for shallow landslides constructed in the past to provide a new landslide warning model, which can be used at different stages or for landslides of different scales. The threshold will provide invaluable information for helping disaster management authorities to alert the general public and prepare for prevention and disaster mitigation.
2. Study Area
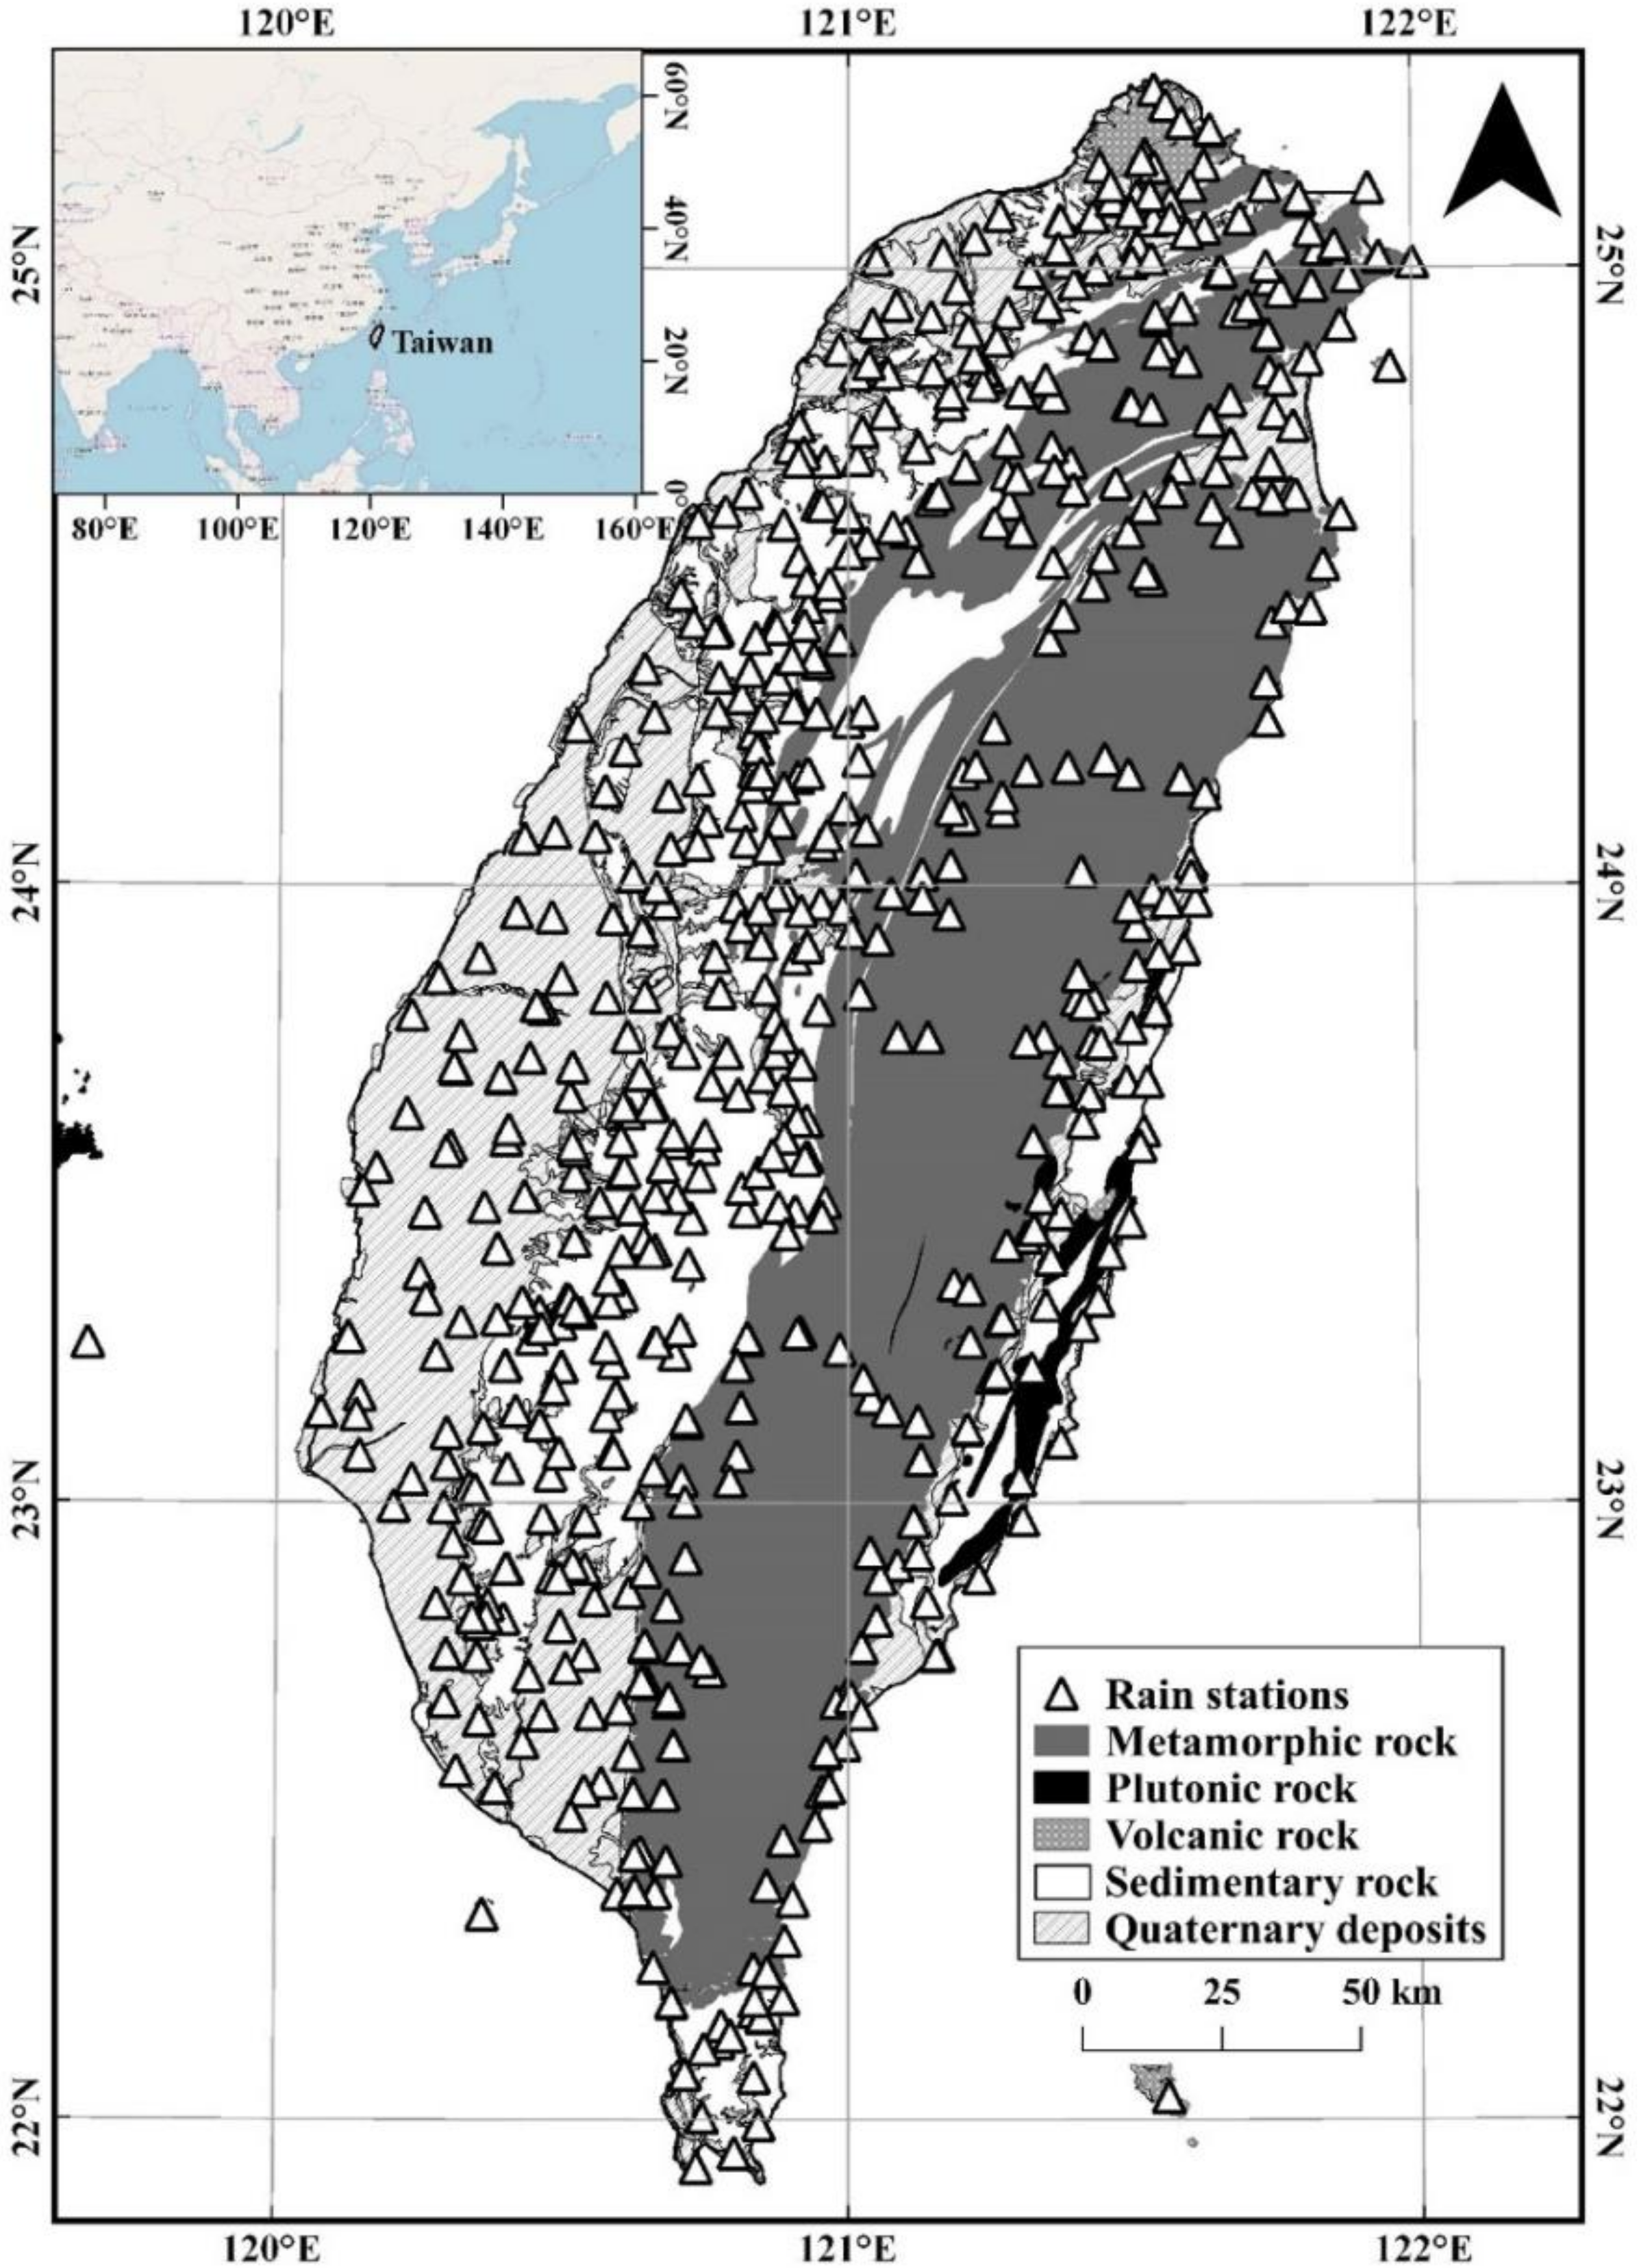
Taiwan is located at the convergent plate boundary where the Philippine Sea plate subducts below the Eurasian plate at a velocity of 80 mm/year; hence, it experiences a high orogenic uplift rate (5–7 mm/year) and frequent earthquakes [30]. This high orogenic uplift rate is responsible for an active mountain belt with many summits higher than 3000 m above sea level (a.s.l.) [31]. Almost 48% of the mountain range in Taiwan is higher than 1000 m a.s.l., and the montane slopes are frequently steeper than 45° and have thin (<1 m) regolith cover [32,33]. The mountains in Taiwan have a steep slope and significant relief, and the rock formations are highly fractured and fragile. These geological settings are unfavorable to slope stability. Taiwan is also situated in the East Asian monsoon belt and in the region of subtropical climates, so Taiwan has a humid and warm climate. The annual rainfall is 2500 mm, and on average, 3–5 typhoon strikes occur yearly [34,35]. Torrential precipitation during the summer seasons often triggers geological hazards. In short, the geological and topographic conditions make Taiwan a high-risk region for slope failure (Figure 1).
3. Data and Study Methods
3.1. Landslide Data
The main parameters of landslides include disturbed area, location, time of occurrence, failure mechanism, and type. In this study, we collected landslide data from the annual inventory of the Forestry Bureau of Taiwan. The information on the disturbed area and location of each landslide was integrated into the annual landslide inventory, but the failure mechanisms and types of landslides were not investigated. To delimit landslides of different scales, the criterion of a disturbed area of 0.1 km2 was adopted in this study to separate LSLs from SSLs [20].
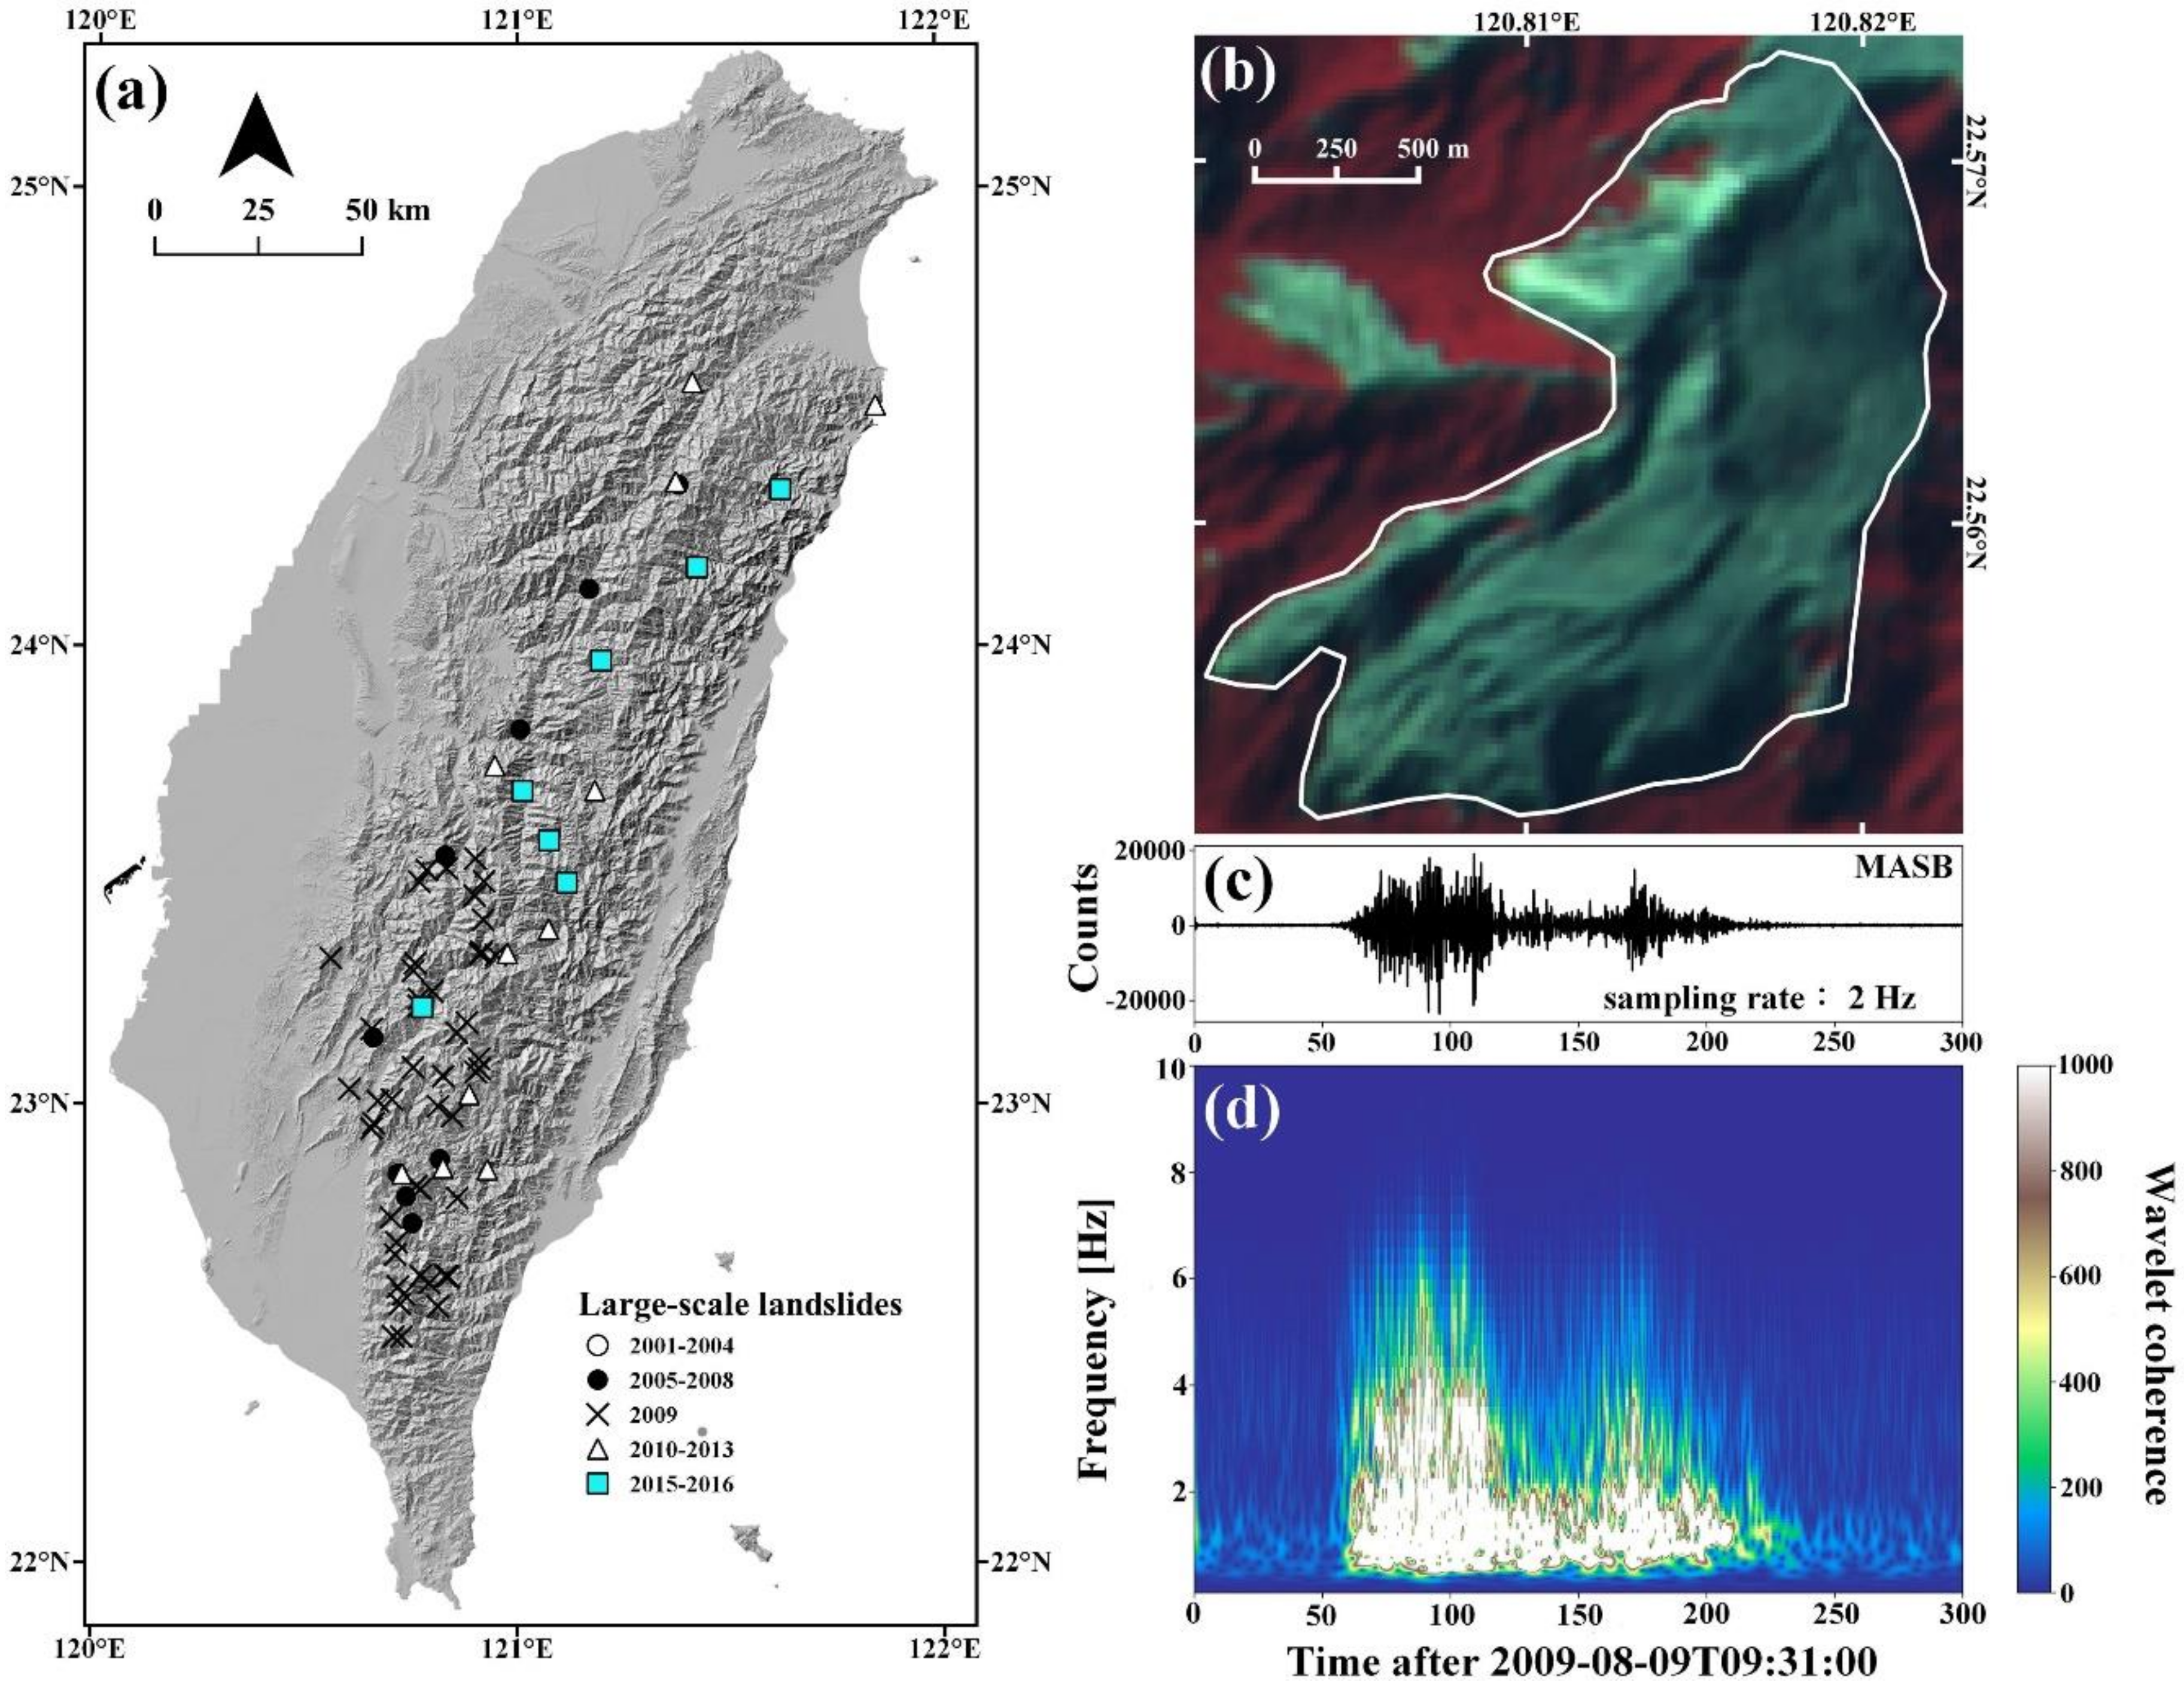
Since the mass movement of an LSL may generate ground motion, such ground motion can be recorded by nearby seismic stations [36,37]. In the frequency domain, the natural energy of landslide-induced ground-motion (called a landslide-quake) is mainly below 5 Hz, and the distribution pattern of energy in a spectrogram is triangular due to a gradual increase–decay process over time [36]. The triangular pattern in the spectrogram is the particular property that discriminates landslide-quakes from those of earthquakes and other background noise [20]. The Soil and Water Conservation Bureau (SWCB) of Taiwan extracts the occurrence times of LSLs triggered by heavy rainfall from seismic records through identifying landslide-quakes. The occurrence times of 83 LSLs triggered by rainfall over a period of 16 years (2001–2016) were observed from the landslide-induced seismic records of the SWBC and used to locate their sources using a locating approach proposed by Chen et al. [38]. Manconi, et al. [37] proposed a similar approach to detect, locate, and estimate the volumes of rockslides by analyzing waveforms acquired from broadband regional seismic networks in the eastern Italian Alps [37]. The types and failure mechanisms of the LSLs are not mentioned in the SWCB reports. However, according to some in situ investigations, the most recurrent types of LSLs in Taiwan are rock slides and debris avalanches. We collected the occurrence times and locations of LSLs from the reports of the SWCB. According to the SWCB reports, the identification error of landslide-quakes might occur due to the interference from local tremors or anthropogenic noise. A double-check conducted jointly with the analysis of remote-sensing imagery should be implemented to avoid misdetection. This study carefully compared the locations of 83 LSLs with the annual landslide inventory of the Forestry Bureau to create an LSL dataset containing the information on LSL location, disturbed area, and time (accuracy in minutes) (Figure 2 and Table 1). These 83 LSLs occurred in Taiwan during the typhoon season: 1 in June, 12 in July, 63 in August, and seven in September. This study used 75 LSLs during the period between 2001 and 2013 to analyze rainfall conditions and used 8 LSLs that occurred in 2015 and 2016 to verify the results.
The alignment of the LSLs with the geological map showed that of these 83 LSLs, 16 were located in the Western Foothills, where the lithology mainly consists of sedimentary rocks. Ten LSLs were situated in the Hsuehshan Range, where the rock formation mainly consists of alternating meta-sandstone and shale. Forty-seven LSLs occurred on the west flank of the Central Range, where the strata mainly consist of argillite and slate. Nine LSLs occurred in the eastern flank of the Central Range, where the lithology mainly comprises schist and marble. Only one LSL occurred in the Coastal Range, where the strata mainly comprise sedimentary rocks and igneous rock. The slope gradients of these LSLs were mainly distributed in the range between 20° and 40°. The LSLs primarily occurred on slopes with elevations ranging from 500 to 2000 m, but the distributions of the highest and lowest elevations of these LSLs showed that their average vertical displacement was greater than 500 m [20].
Most of the 83 LSLs occurred in metamorphic rock areas, indicating that metamorphic rock slopes were likely to be massively unstable, which could be attributed to the active tectonics in Taiwan’s mountainous area inducing intense rock deformation and displacement. In contrast, the sedimentary rock areas in Taiwan have a relatively more moderate relief than the metamorphic rock area. Although massively unstable slopes still develop on sedimentary rocks, the number of LSLs was significantly lower than that on metamorphic rocks. Although the difference in LSL numbers between sedimentary rock slopes and metamorphic rock slopes seems to indicate that the geological and topographic features would influence the evolution of a massively unstable slope, the limited number of LSLs and SSLs considered in the study should be noted.
We also collected data on 174 SSLs occurring from 2006 to 2013 from the annual reports of the SWCB. The SSLs were investigated carefully with fieldwork, particularly in the cases of events that caused damage to public utilities or private property. The reports contained detailed information on the location, disturbed area, and approximate occurrence time of each SSL. These 174 SSLs occurred during the typhoon season: 2 in May, 32 in June, 36 in July, 39 in August, 24 in September, and 41 in October. The distribution of the slope gradients of the SSLs was similar to that of the LSLs. Unlike the LSLs, a large portion of the SSLs took place on slopes with elevations ranging from 750 to 1250 m. The occurrence times were estimated based on real-time videos and interviews with residents. Unfortunately, the accuracy of the time points was not mentioned in the reports. We have carefully double-checked the landslide data to exclude any SSLs that were not triggered by rainfall.
3.2. Rainfall Data
There are 594 rain gauge stations installed by the Central Weather Bureau (CWB) around Taiwan (Figure 1). Among these, 328 rainfall gauge stations were established in mountainous areas above 100 m a.s.l. The density of rain gauges is approximately one per 73 km2. All rainfall gauges record hourly rainfall intensity. Due to the lack of rain gauge stations in the vicinity of landslide sites, we converted the records of the three nearest rain gauge stations into the representative rainfall data for each landslide site. This rainfall conversion involved conducting a deterministic interpolation using inverse distance weighting (IDW). IDW interpolation determines rainfall values on a landslide site using a weighted combination of a set of rainfall gauges. The weight is a function of the inverse distance from the landslide site to each rain gauge station. The interpolated rainfall should be a locational-dependent variable. The rainfall data of the nearest rainfall gauge stations will have the most significant influence in the interpolation. Chen and Liu [39] have proposed that a scan radius of 10–30 km would be the optimal parameter for IDW in interpolating rainfall data in Taiwan. In this study, we adopted a scan radius of 10 km from each landslide to collect rainfall data. If fewer than three rain gauge stations corresponded to this principle, we then adopted the record of the nearest rain gauge station. To determine the duration of a rainfall event, many previous studies have determined the length of a rainfall event using different non-rainfall intervals [40]. In this study, the starting-time of a rainfall event is defined as the time when the hourly rainfall exceeds 1 mm. The ending-time of the rainfall event is the time when the hourly rainfall becomes zero, but that level must be maintained for at least 24 h.
To confirm the rainfall threshold for triggering landslides, the rainfall conditions corresponding to the occurrence time of each landslide are necessary. Consequently, we counted the average rainfall intensity (I, mm/h), rainfall duration (D, h), and cumulative event rainfall (E, mm) from the starting-time of a rainfall event until the time point when the landslide occurred. If a landslide occurred after the peak hourly rainfall, the calculation of average rainfall intensity for the landslide would involve the value of the maximum hourly rainfall.
3.3. Soil Water Index
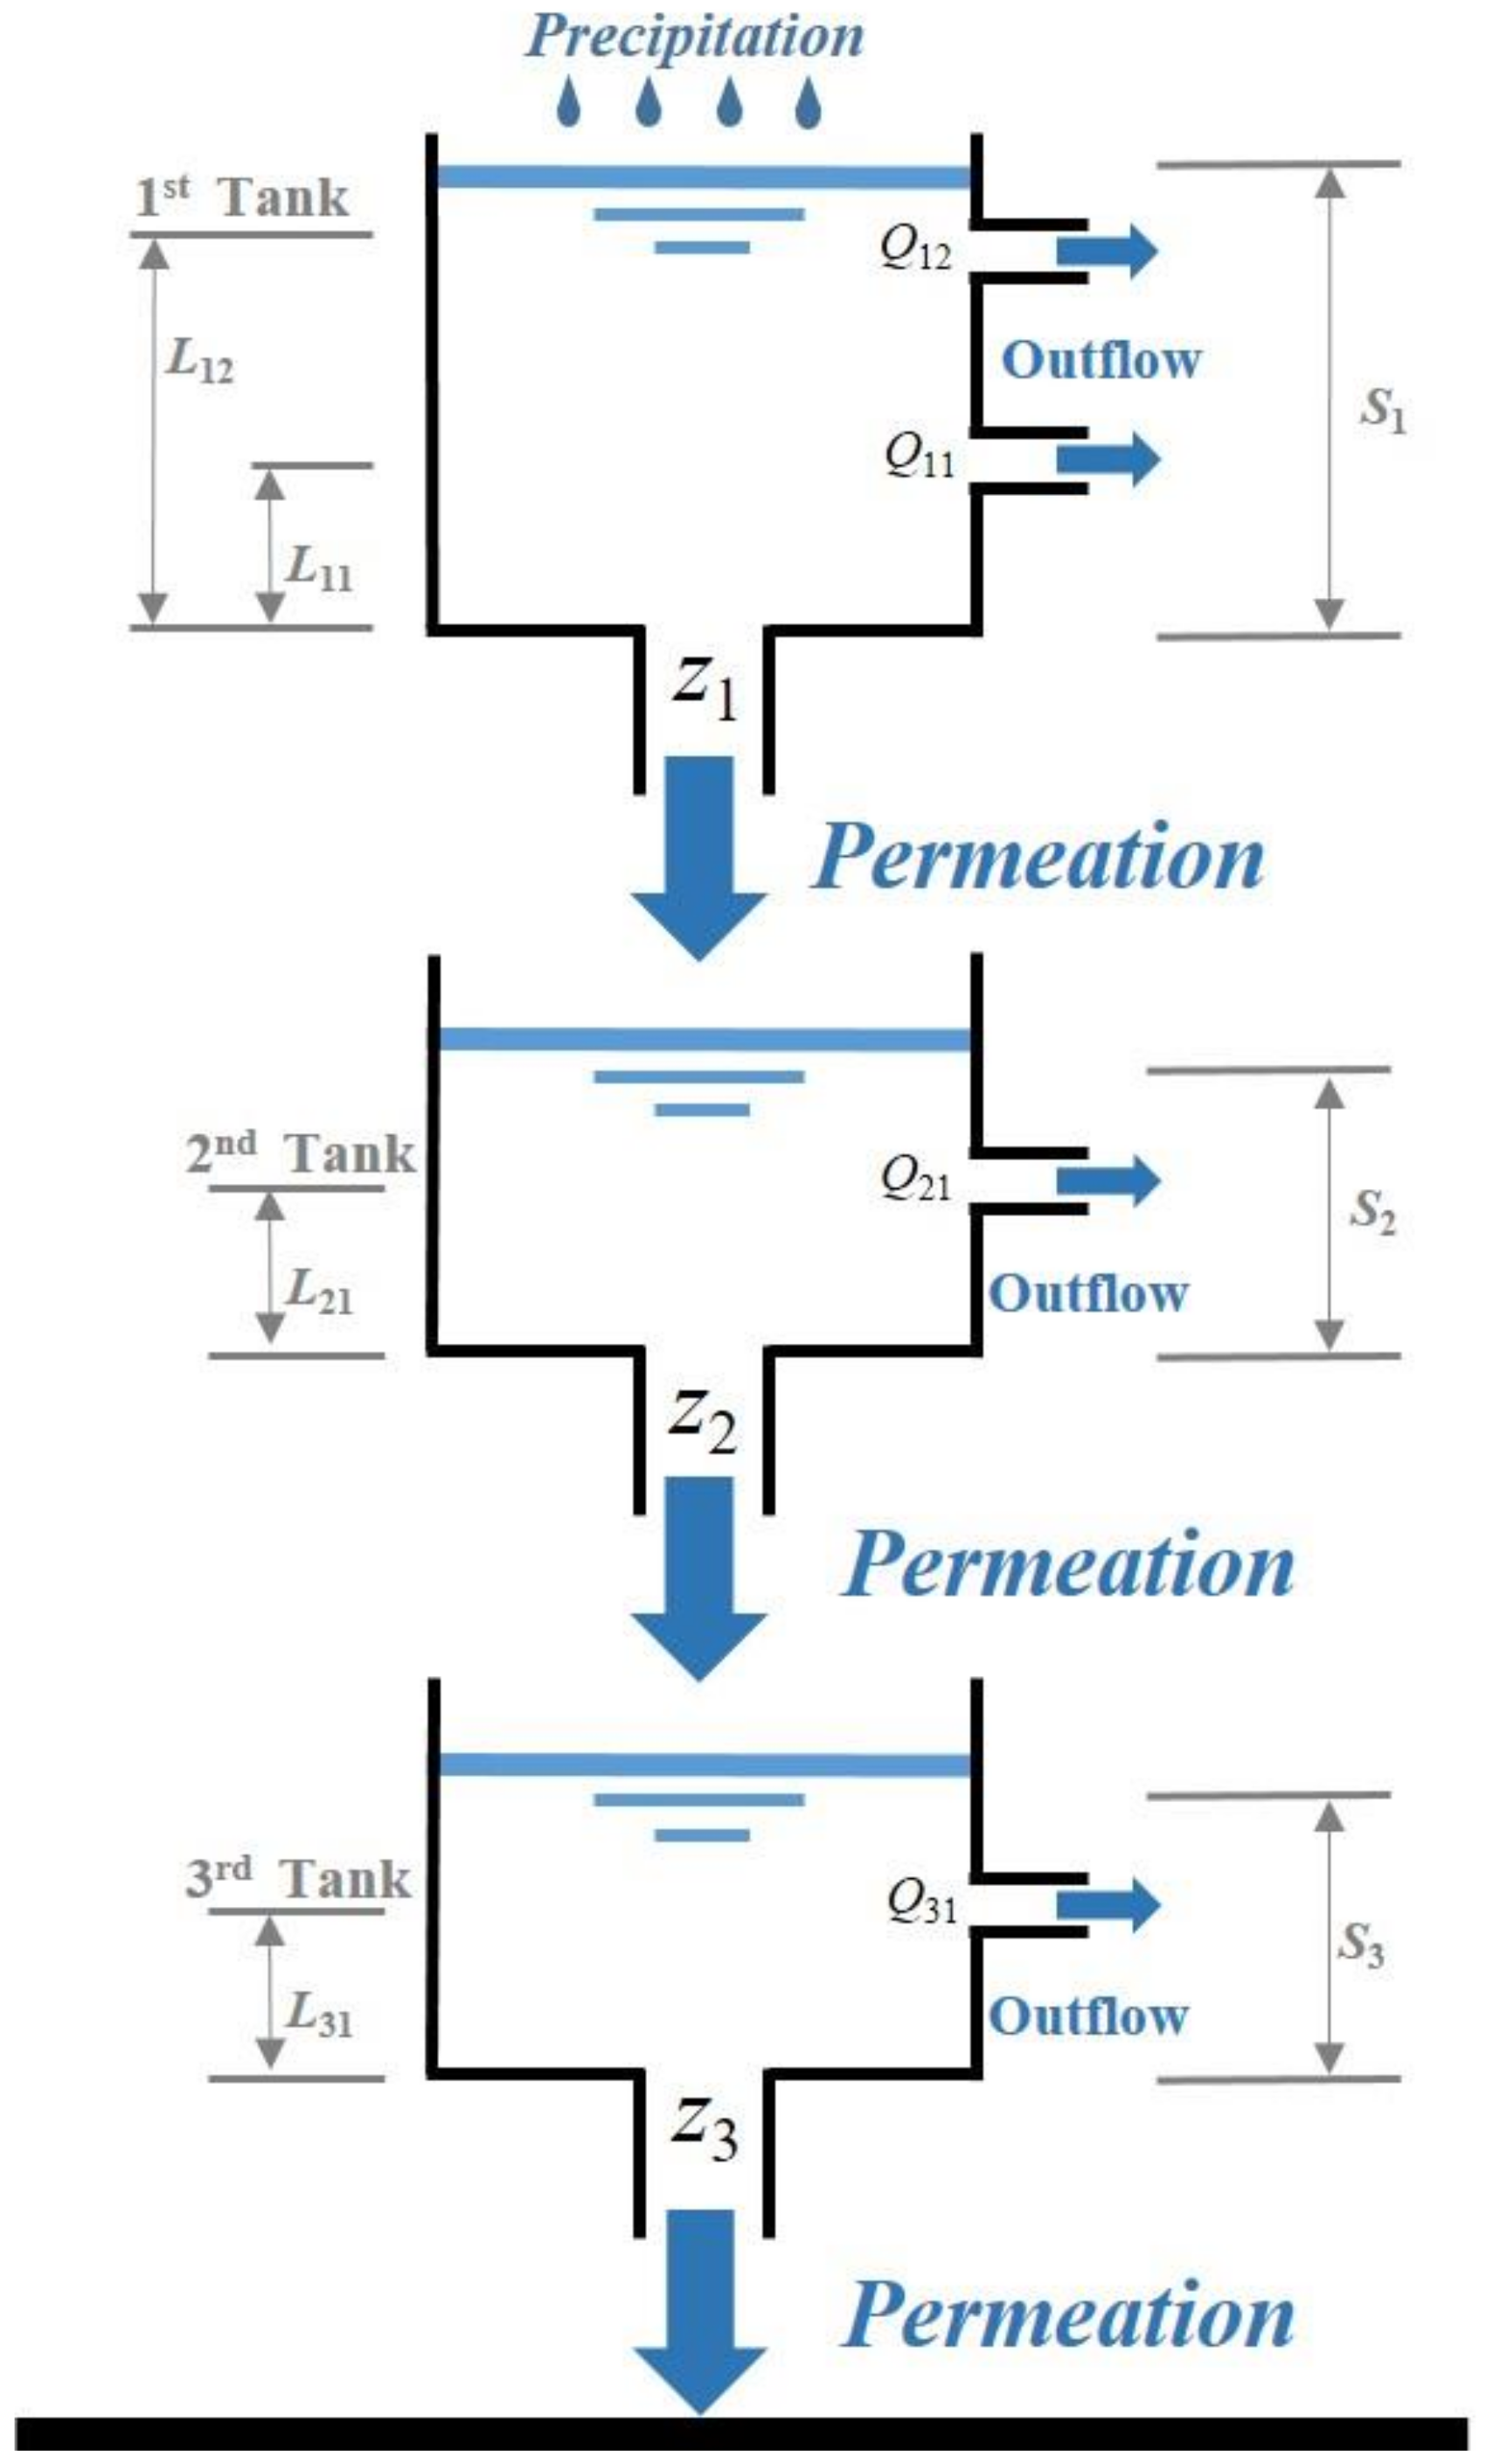
The soil water index (SWI) is a conceptual model which uses a three-layer tank model to estimate the depth of remaining water in three simulated soil layers during a rainfall event [41] (Figure 3). During a massive rainfall event, the water continues to infiltrate into the ground surface, and the moisture of the soil layers increases, which is strongly related to the potential for slope failure disasters. However, it is not an easy task to obtain the actual water contents in the soil layers if there are not enough hydrological instruments. Determining the physical or statistical relationship between rainfall, surface runoff, and groundwater is a compromise method for assessing underground water storage [42,43]. The tank model is a simple concept that uses three tanks, which represent reservoirs in a watershed. It considers rainfall as the input and generates output as the surface runoff, subsurface flow, intermediate flow, and sub-base flow. The tank model also explains the phenomena of infiltration, percolation, and water storage in the tanks. Thus, the SWI is established as a rainfall-runout model with some fixed parameters to estimate the permeation of water in the soil layers. This method was used to assess and predict potential landslides and to construct early warning systems in Japan [22].
In this model, the SWI is defined as the total storage water height Sk, which is the sum of three tanks, and the formula can be written as [22]: s
where t represents the time in hours; Δt expresses the passed time in hours; (k = 1,2,3) represents the tanks from top to bottom. Every Sk, the remaining water (mm) for each tank, is computed every hour (Δt = 1(h)) by:
where R(Δt) represents the hourly rainfall amount in mm. Qkl means the leakage height from the lth side tube of each tank (the top tank has two side tubes, and the others have one). Zk is the water that permeates from the base tube of the kth tank. Zk−1 is the water that permeates from the base tube of the (k − 1) th tank. Both Qkl and Zk vary with t and can be calculated as follows:
where akl and bk are the coefficients of seepage for the side holes and the base holes of the kth tank, respectively. Lkl represents the height (mm) of the leakage water flowing through the lth side hole of the kth tank.
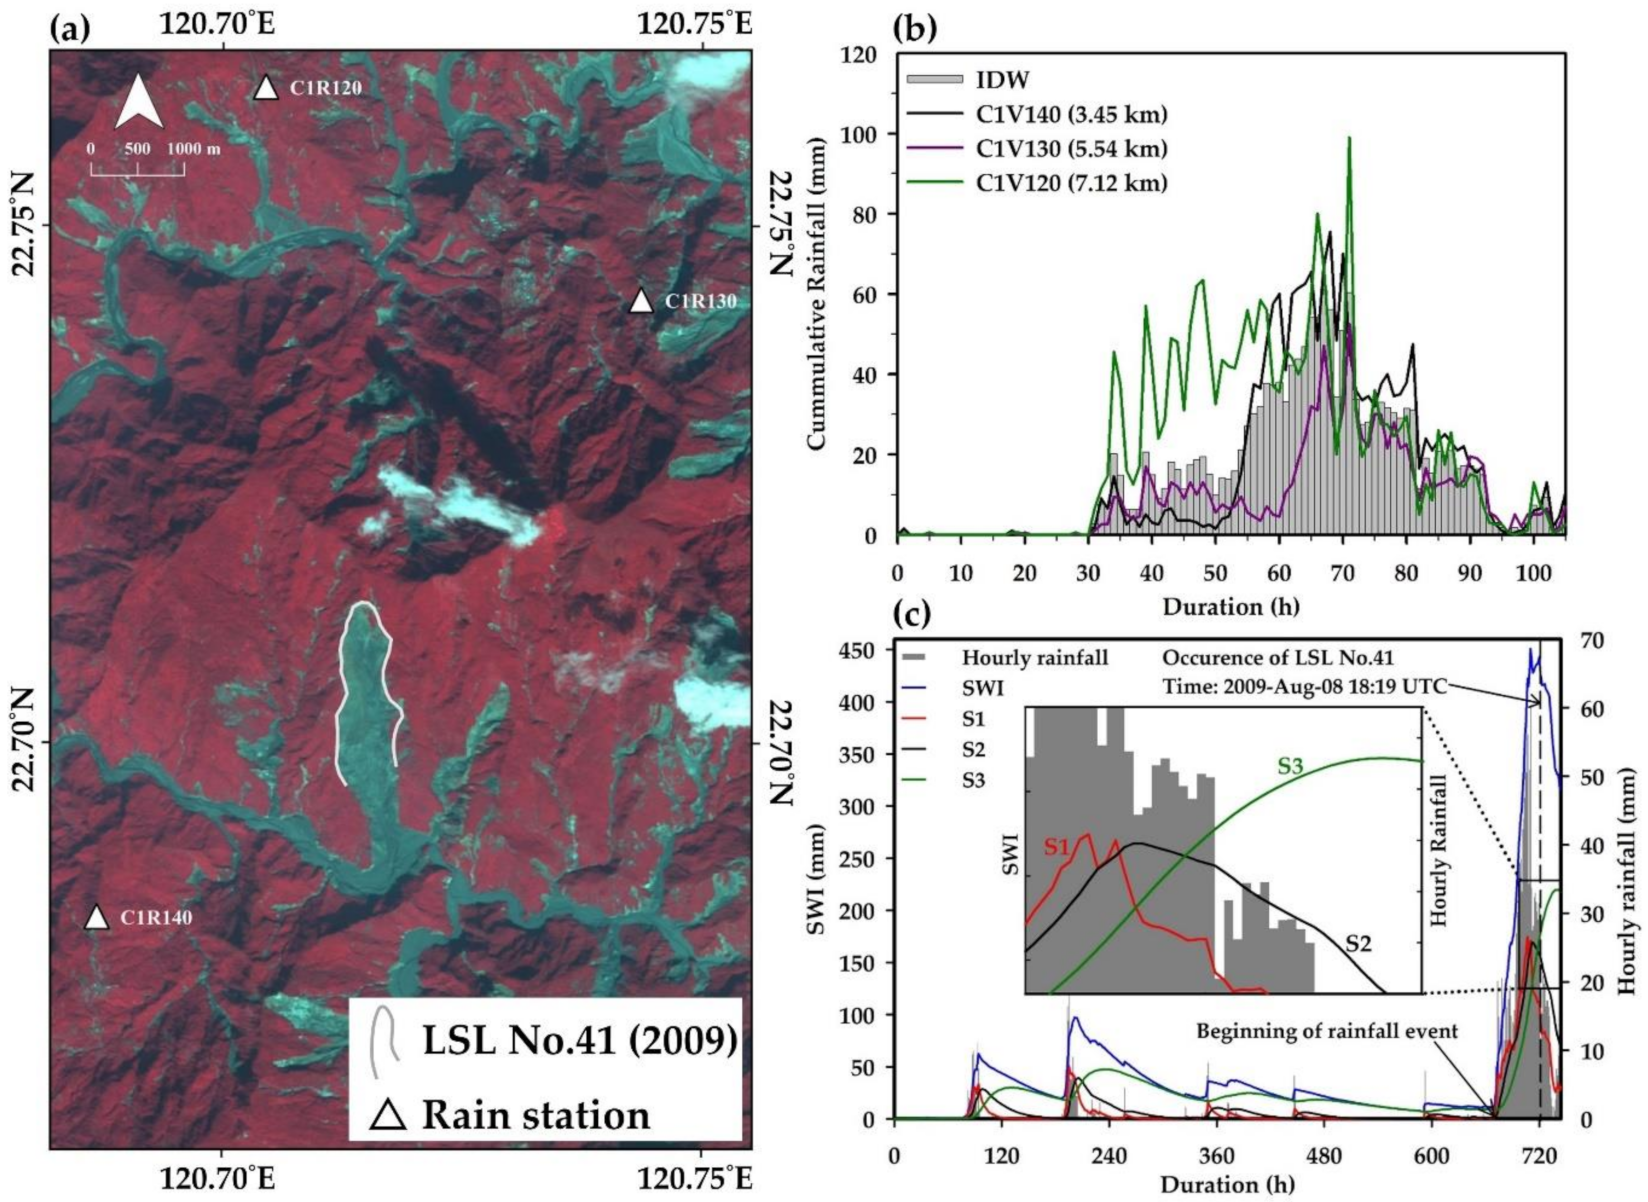
In the three-layer tank model, the sum of Q11 and Q12 represents surface runoff, Q21 represents intermediate flow, and Q31 represents baseflow, respectively. In addition, Z1 represents the infiltration amount from the first tank. Z2 and Z3 represent the percolation amounts from the second and third layers. S1, S2, and S3 denote the depths of water storage in the first, second, and third tanks. Some previous studies performed statistical analysis of the relationship between river discharge and precipitation, and the constants akl, bk, and Lkl (Table 2) were determined and used in the SWI model [22]. It may be true that the discharging rate and saturation capability would vary between distinct geological and topographic settings. However, the SWI is representative of conceptual water content. Furthermore, the variations of time series of the SWI using parameters adjusted with different areas have similar trends [41]. Thus, the Japanese government adopted the constant parameters developed by Okada, et al. [41] for the whole nation regardless of the various geological conditions [44]. Chen, et al. [27] applied the SWI model to calculate the rainfall characteristics for triggering shallow landslides in Taiwan and used the previous rainfall data over one month to inspect the effect of the antecedent rainfall. In this study, the SWI values of large-scale landslides and other rainfall factors were calculated and combined to find the hydrological conditions for triggering large-scale landslides. Figure 4 displays a paradigm for obtaining the time-varying SWI and its conditions for triggering an LSL. The hourly rainfall records of the three nearest rainfall gauge stations were used to estimate the representative hourly rainfall for the LSL (Figure 4a,b). Then the time-varying rainfall was interpolated to the landslide site using the IDW method and adopted to calculated S1, S2, and S3 (Figure 4c). The time-varying SWI could be obtained by summing S1, S2, and S3. The total remaining depths of the three tanks represent the water stored underground [45]. The concept of the tank model is easily understandable. In addition, the SWI can be used as a proxy for both meteorological trigger and hydrological cause. For the three-layer tank model, outputs through the outlets of the first tank, second tank, and third tank represent surface runoff, intermediate runoff, and baseflow [46,47]. Since most of the 83 LSLs were found to have depths of tens of meters by the SWCB, the remaining water depths in the deepest tank might be the critical hydrological causes for triggering LSLs. In this study, we calculated the time-varying values of the SWI for one month before the targeted rainfall event and in the period of the rainfall event.
4. Results and Discussion
4.1. Rainfall Conditions and SWI for Triggering Large-Scale Landslides
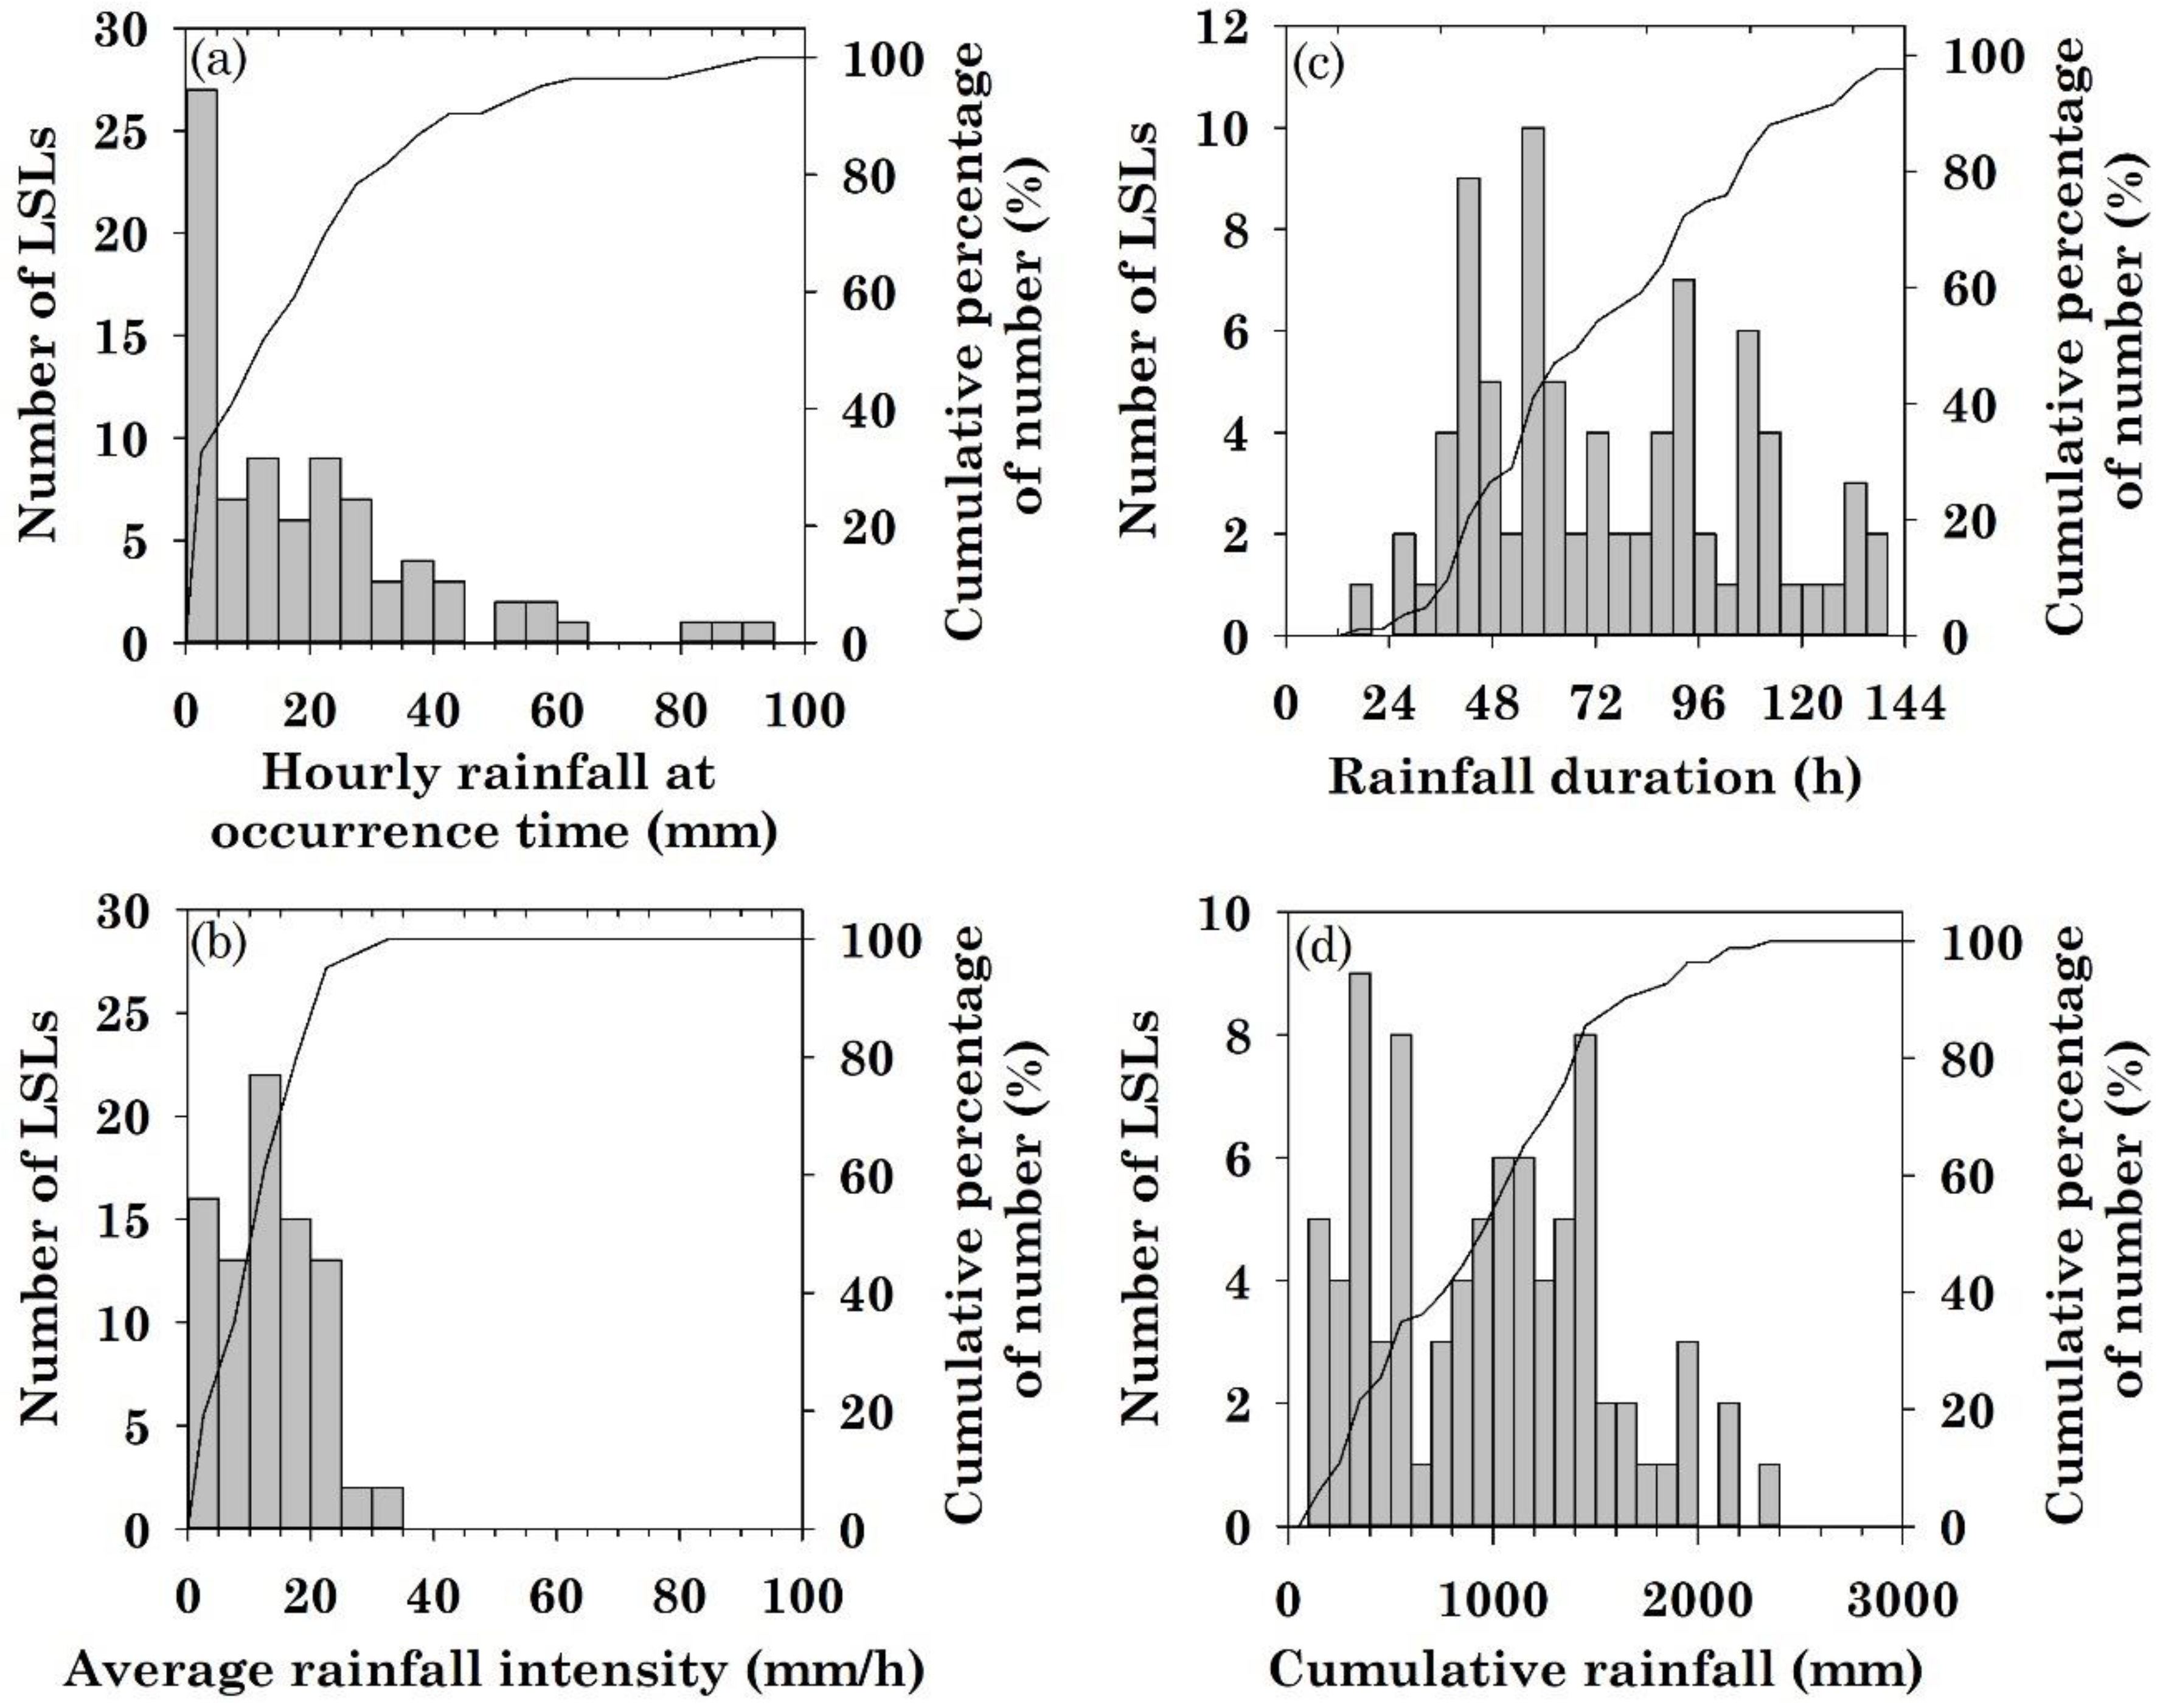
To define the rainfall threshold for landslide initiation, a detailed analysis of the rainfall conditions for the 83 landslides considered in the study was performed. Approximately half (41) of the LSLs collapsed when the cumulative event rainfall (E) exceeded 1000 mm (Figure 5). Moreover, 12 of these events happened after rainfall accumulations of more than 1500 mm in total. The amounts of hourly rainfall at the occurrence time points ranged from 0 to 91.8 mm, which included 31 events with values lower than 20 mm and 18 zero-value events (hourly rainfall was equal to zero at the occurrence time of the landslide). The duration (D) analysis showed that 63 of the LSLs occurred when the rainfall duration was longer than 48 h, and only one case had a duration time of less than 24 h. The results of the analysis of cumulative event rainfall, hourly rainfall, and duration indicated that hourly rainfall at the occurrence time was not a compelling factor in triggering large-scale landslides. Accordingly, average rainfall intensity (I) is usually adopted in the analysis of rainfall thresholds instead of hourly rainfall at the occurrence time of the landslide. On the other hand, the cumulative event rainfall and duration may have more remarkable effects on the conditions for triggering LSLs.
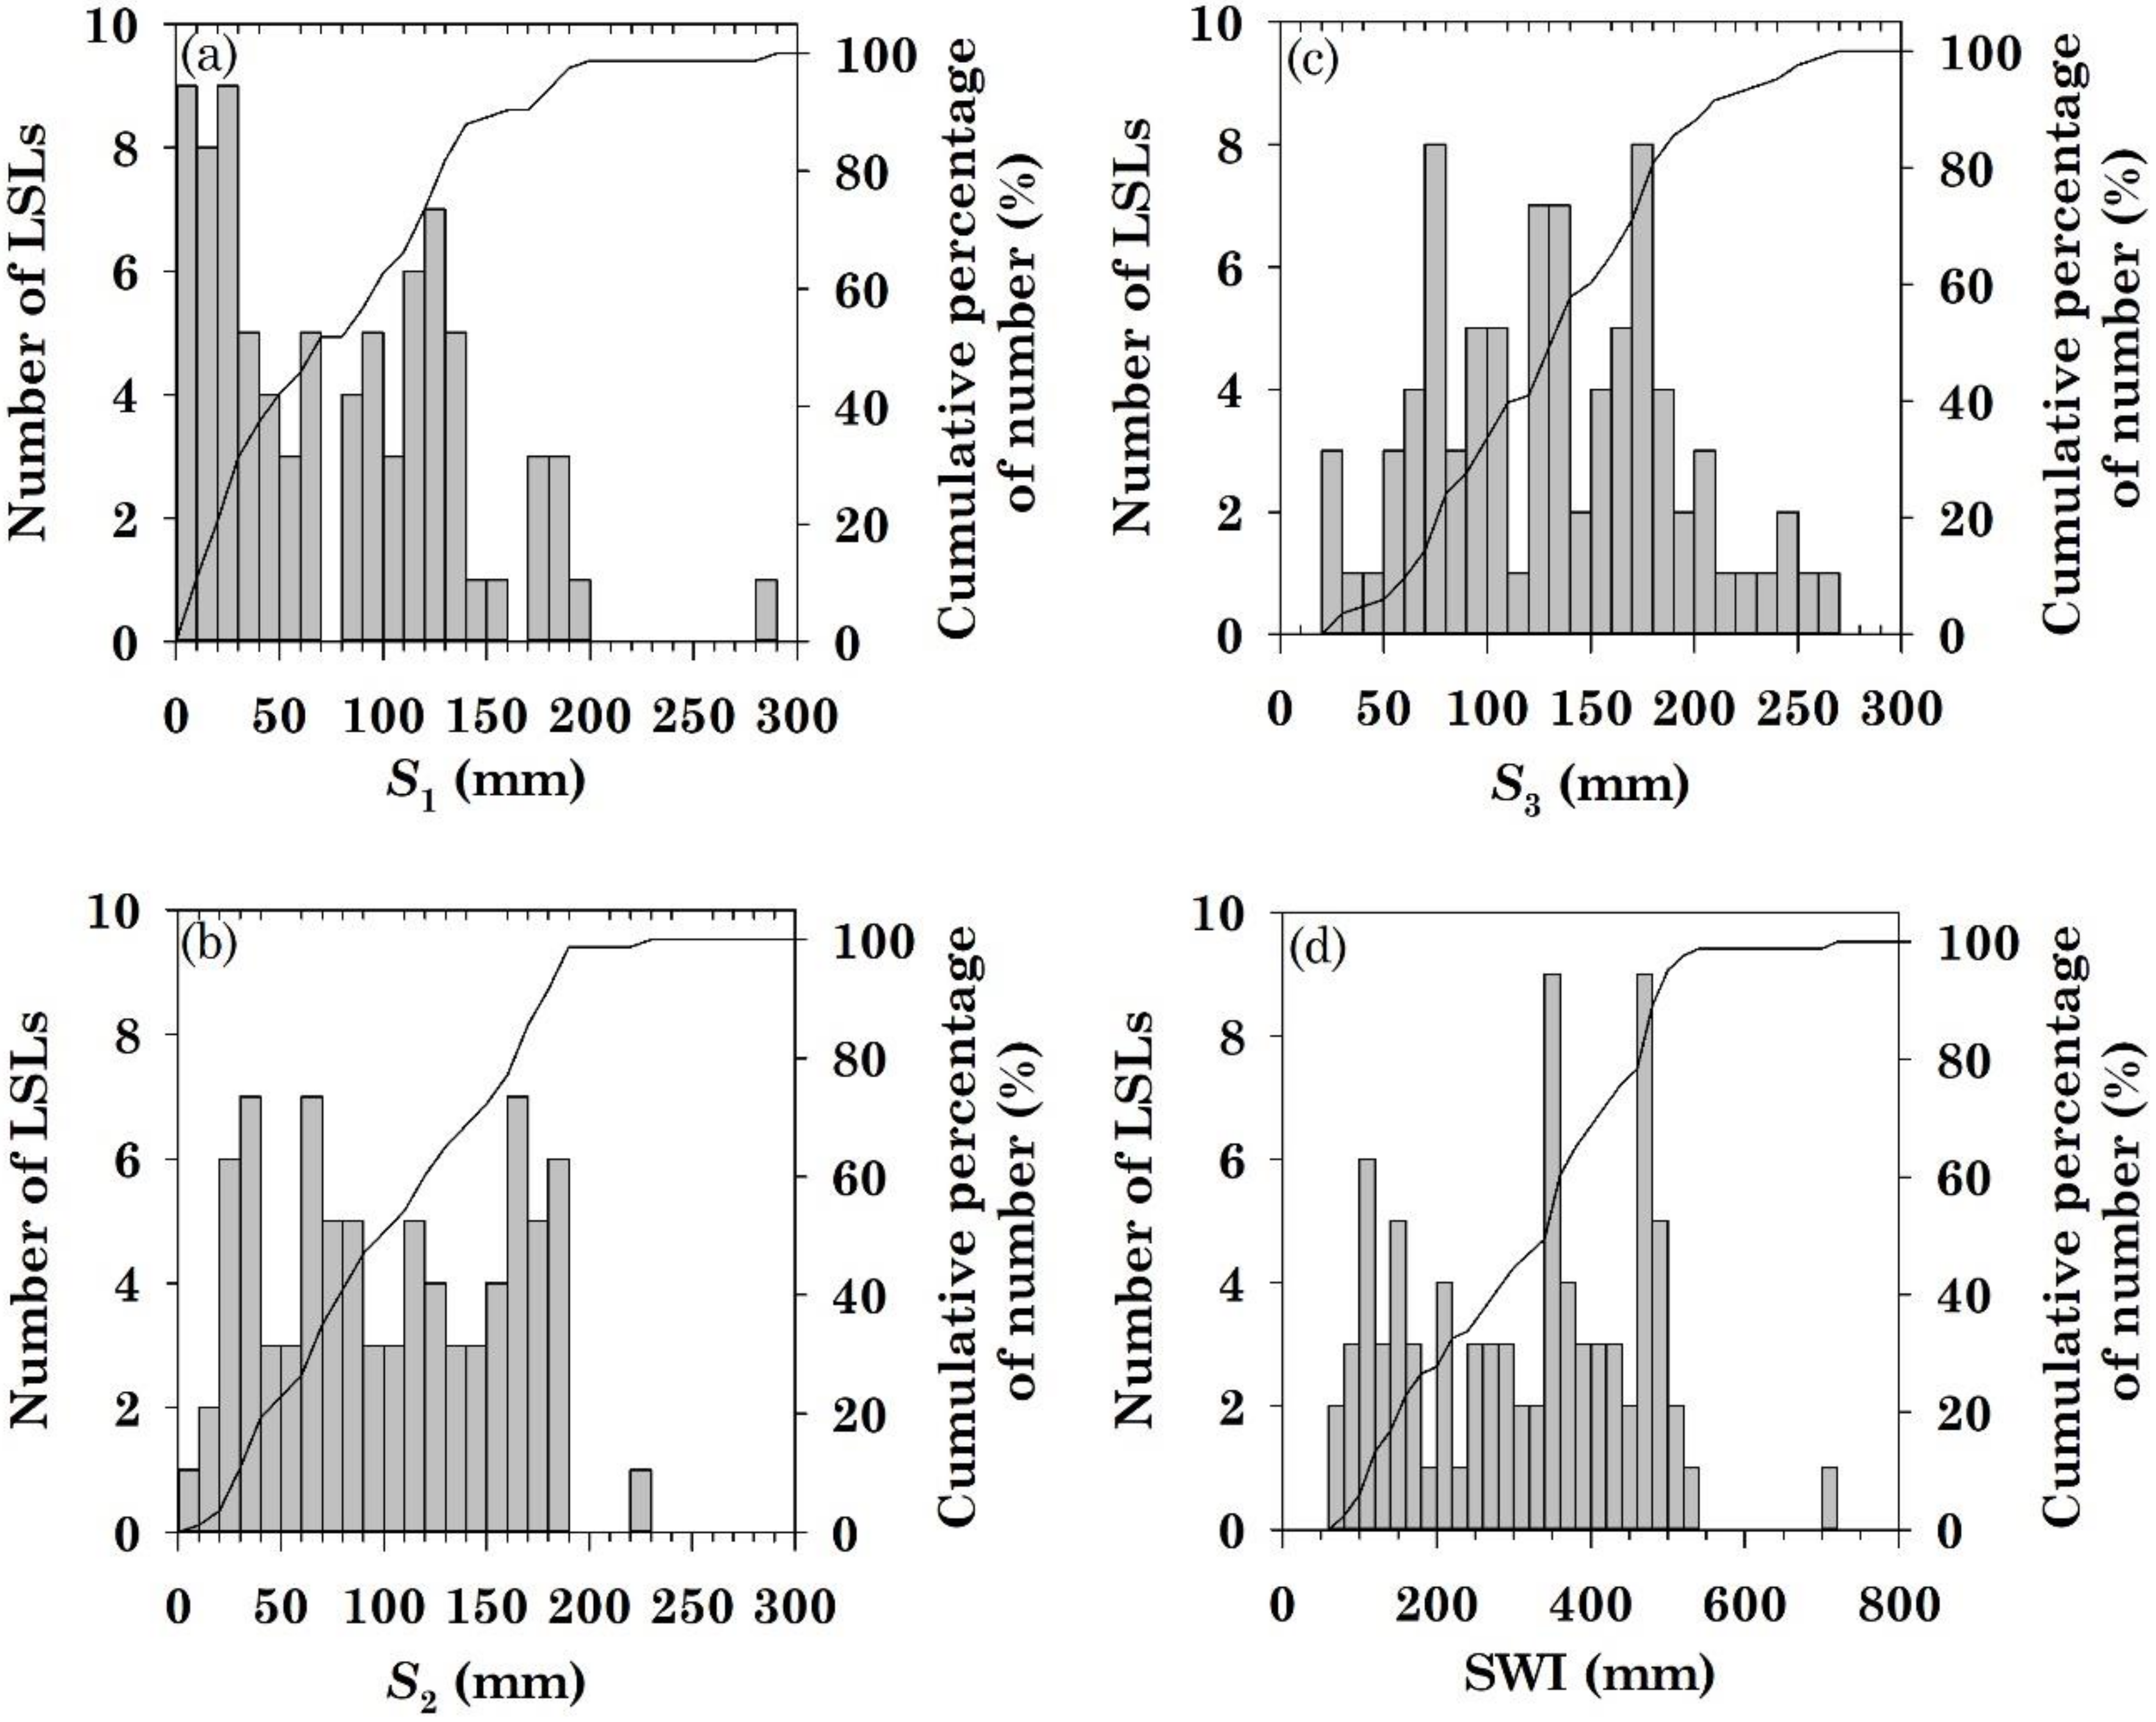
The SWI results contained the precipitation during the event as well as the antecedent precipitation of 30 days preceding the event. The average antecedent SWI was 16.3 mm, ranging from 1.2 mm to 56.2 mm. The SWI at the occurrence times of the LSLs was 311.9 mm on average, and the maximum and minimum values were 706.3 mm and 70.7 mm, respectively (Figure 6). The average S3 value was 131.7 mm, which is higher than the average S1 value of 78.1 mm. The values of S1, S2, and S3 represent the depths of water content in the three simulated layers. SWI may not directly express the real water content in the deep rock formation. However, we need to note that the cumulative rainfall or rainfall intensity used in traditional rainfall analysis does not indicate the real water content in the rock formation, either. The statistics of the above two rainfall factors even neglect hydrological factors such as infiltration and drainage. In SWI calculations, infiltration and drainage are considered, and we can infer that the water entering the deep part of the soil is more closely related to the water content inside the rock formation than the cumulative rainfall is. Therefore, this study holds that replacing the cumulative rainfall factor with the SWI (including the values of S1, S2, and S3) to construct the rainfall threshold for landslides is an enhanced approach [21,44].
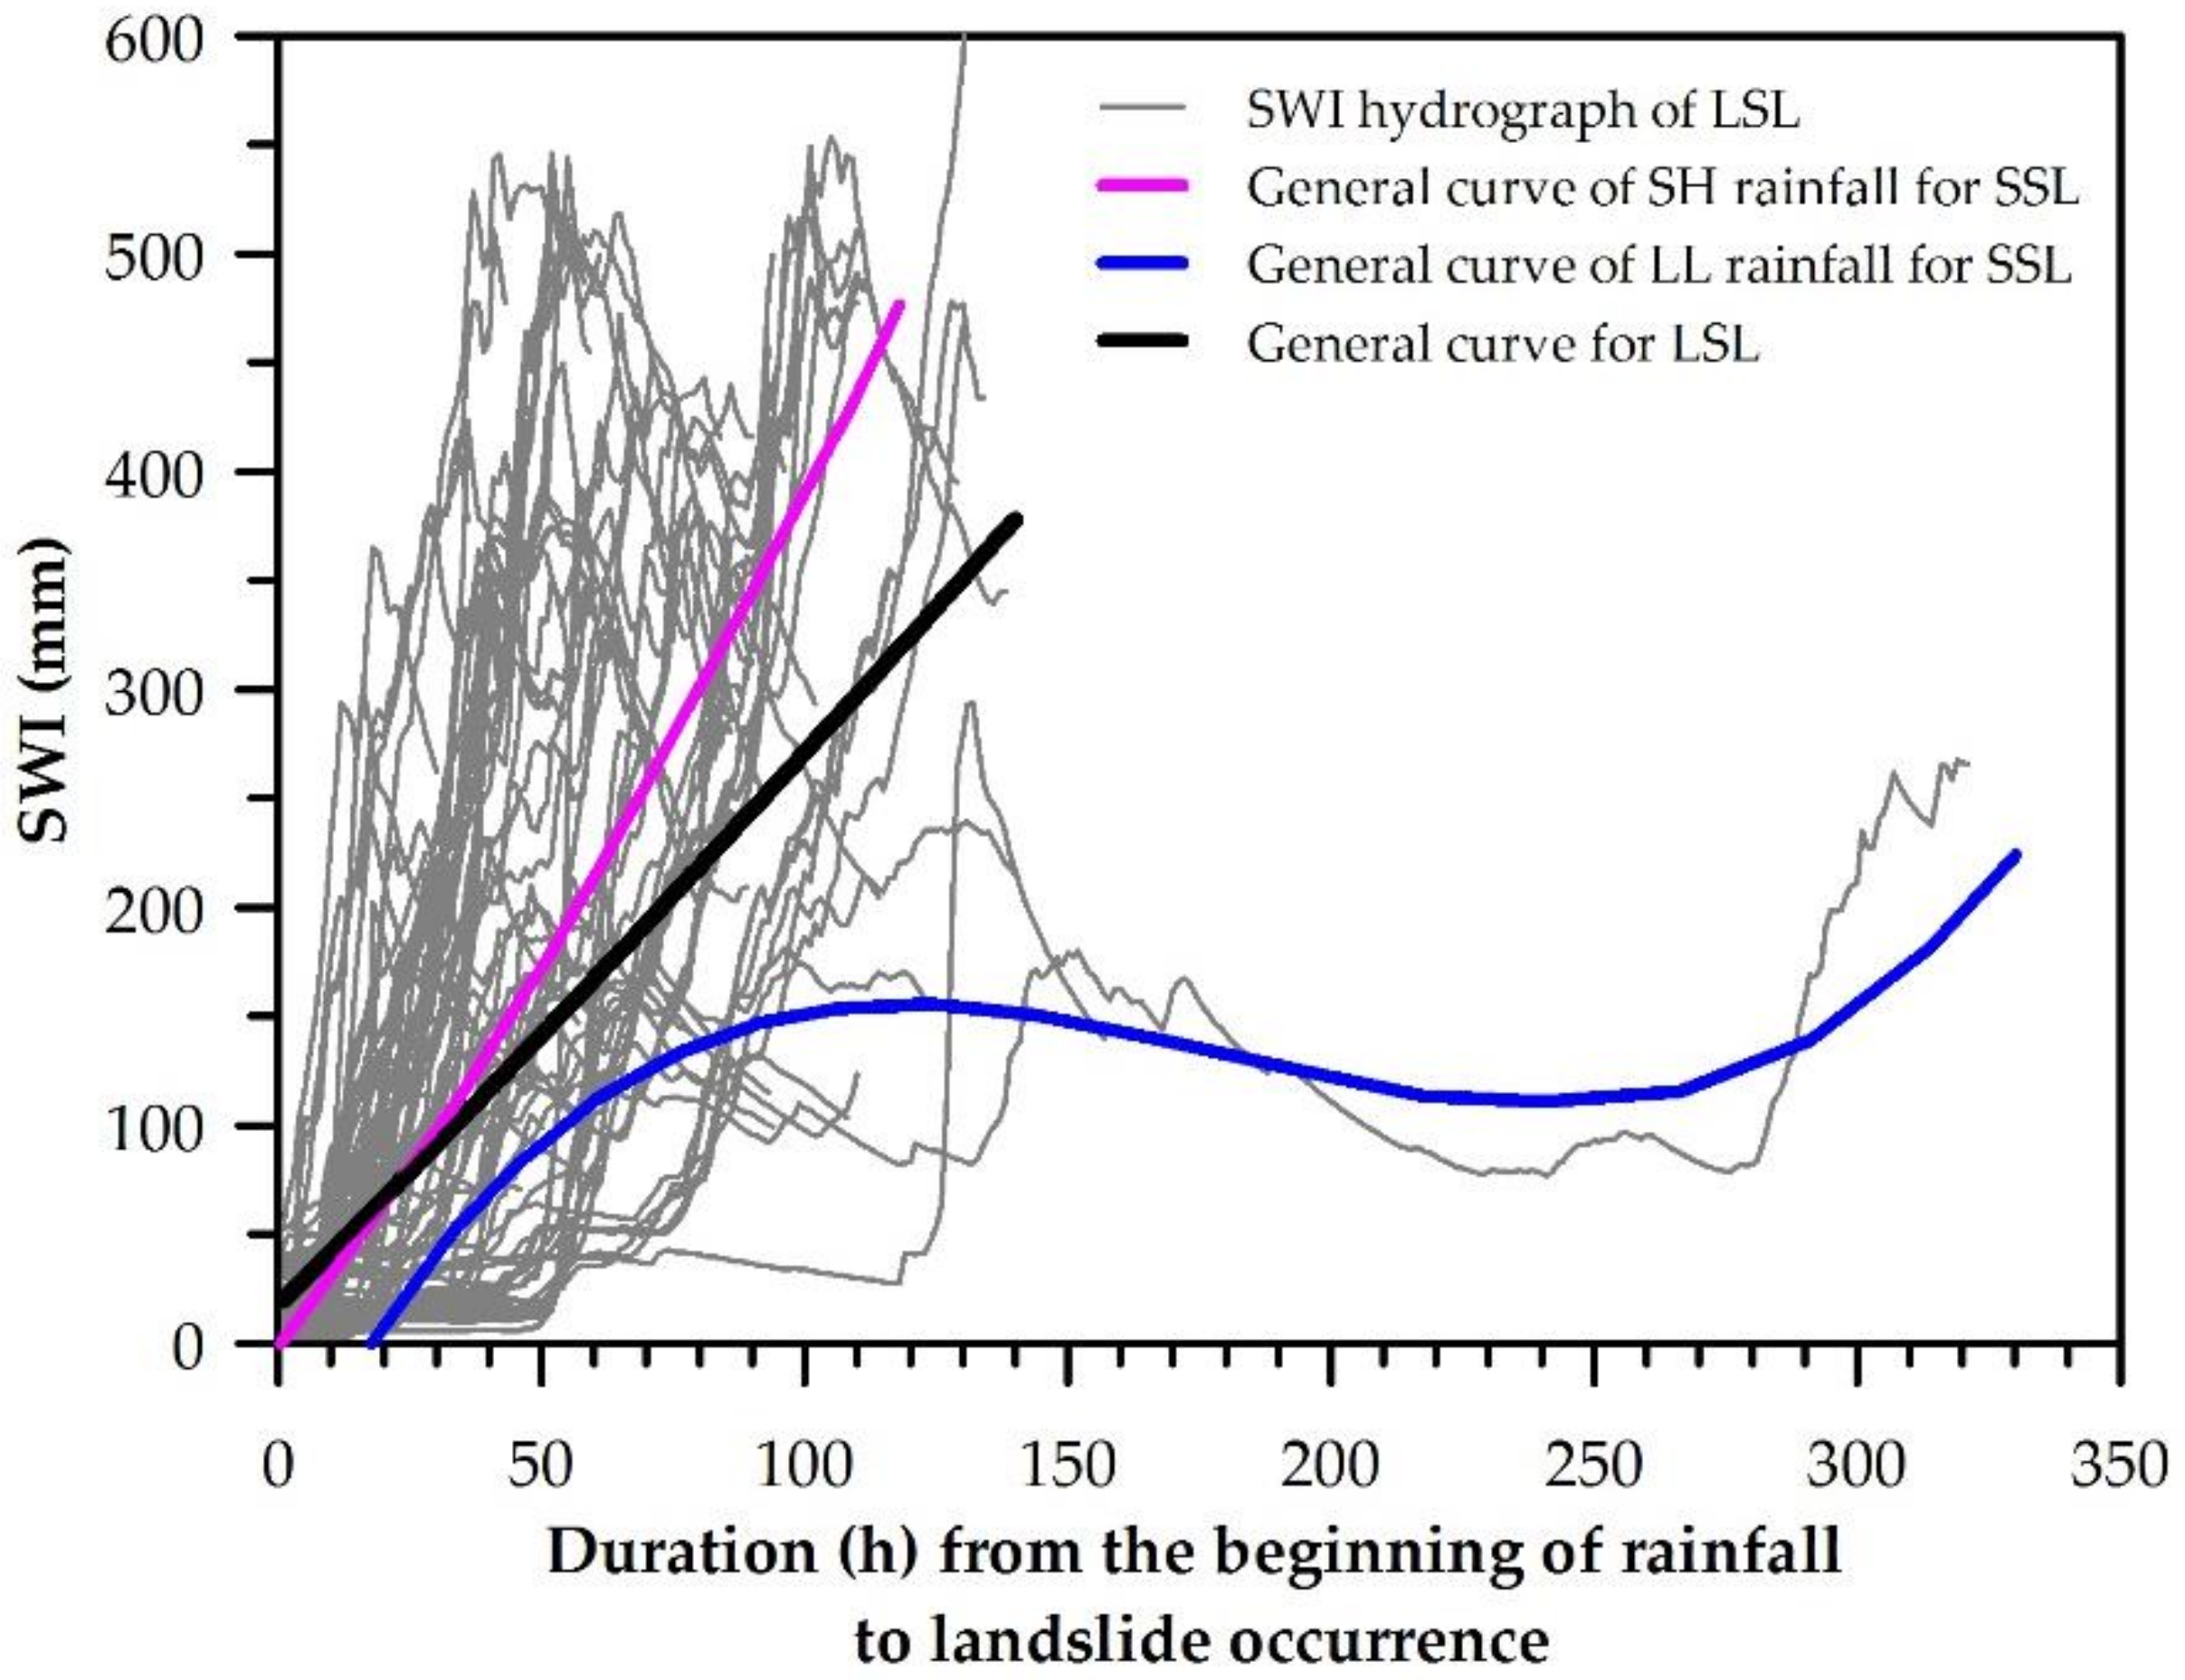
The SWI analysis also revealed that 62 LSLs had S3 values higher than the S1 values. Under the condition that SWI is high, the situation S3 > S1 means more water remaining in the deeper layer but not in the shallow layer. Also, the average value of the ratios of S3 to SWI at the occurrence times of LSLs was 0.46. In contrast, the average of the ratios of S1 to SWI at the occurrence times of LSLs was only 0.22. Because S3 represents the water content of the deeper soil layer, the results indicated that the deeper water might have a higher relationship with the occurrence of LSLs. The hydrographs of SWI demonstrated that most of the LSLs collapsed when the rising trend became smooth and even started to fall (Figure 7). According to the SWI model, the falling and smooth trend of the SWI hydrograph indicates the declination of rainfall events and the lack of recharging of the water in upper slope materials. This phenomenon responded well to the characteristic of cumulative rainfall and rainfall duration for triggering LSLs.
4.2. Soil Water Index–Rainfall Duration (SWI–D) Threshold for Large-Scale Landslides (LSLs) and Verification
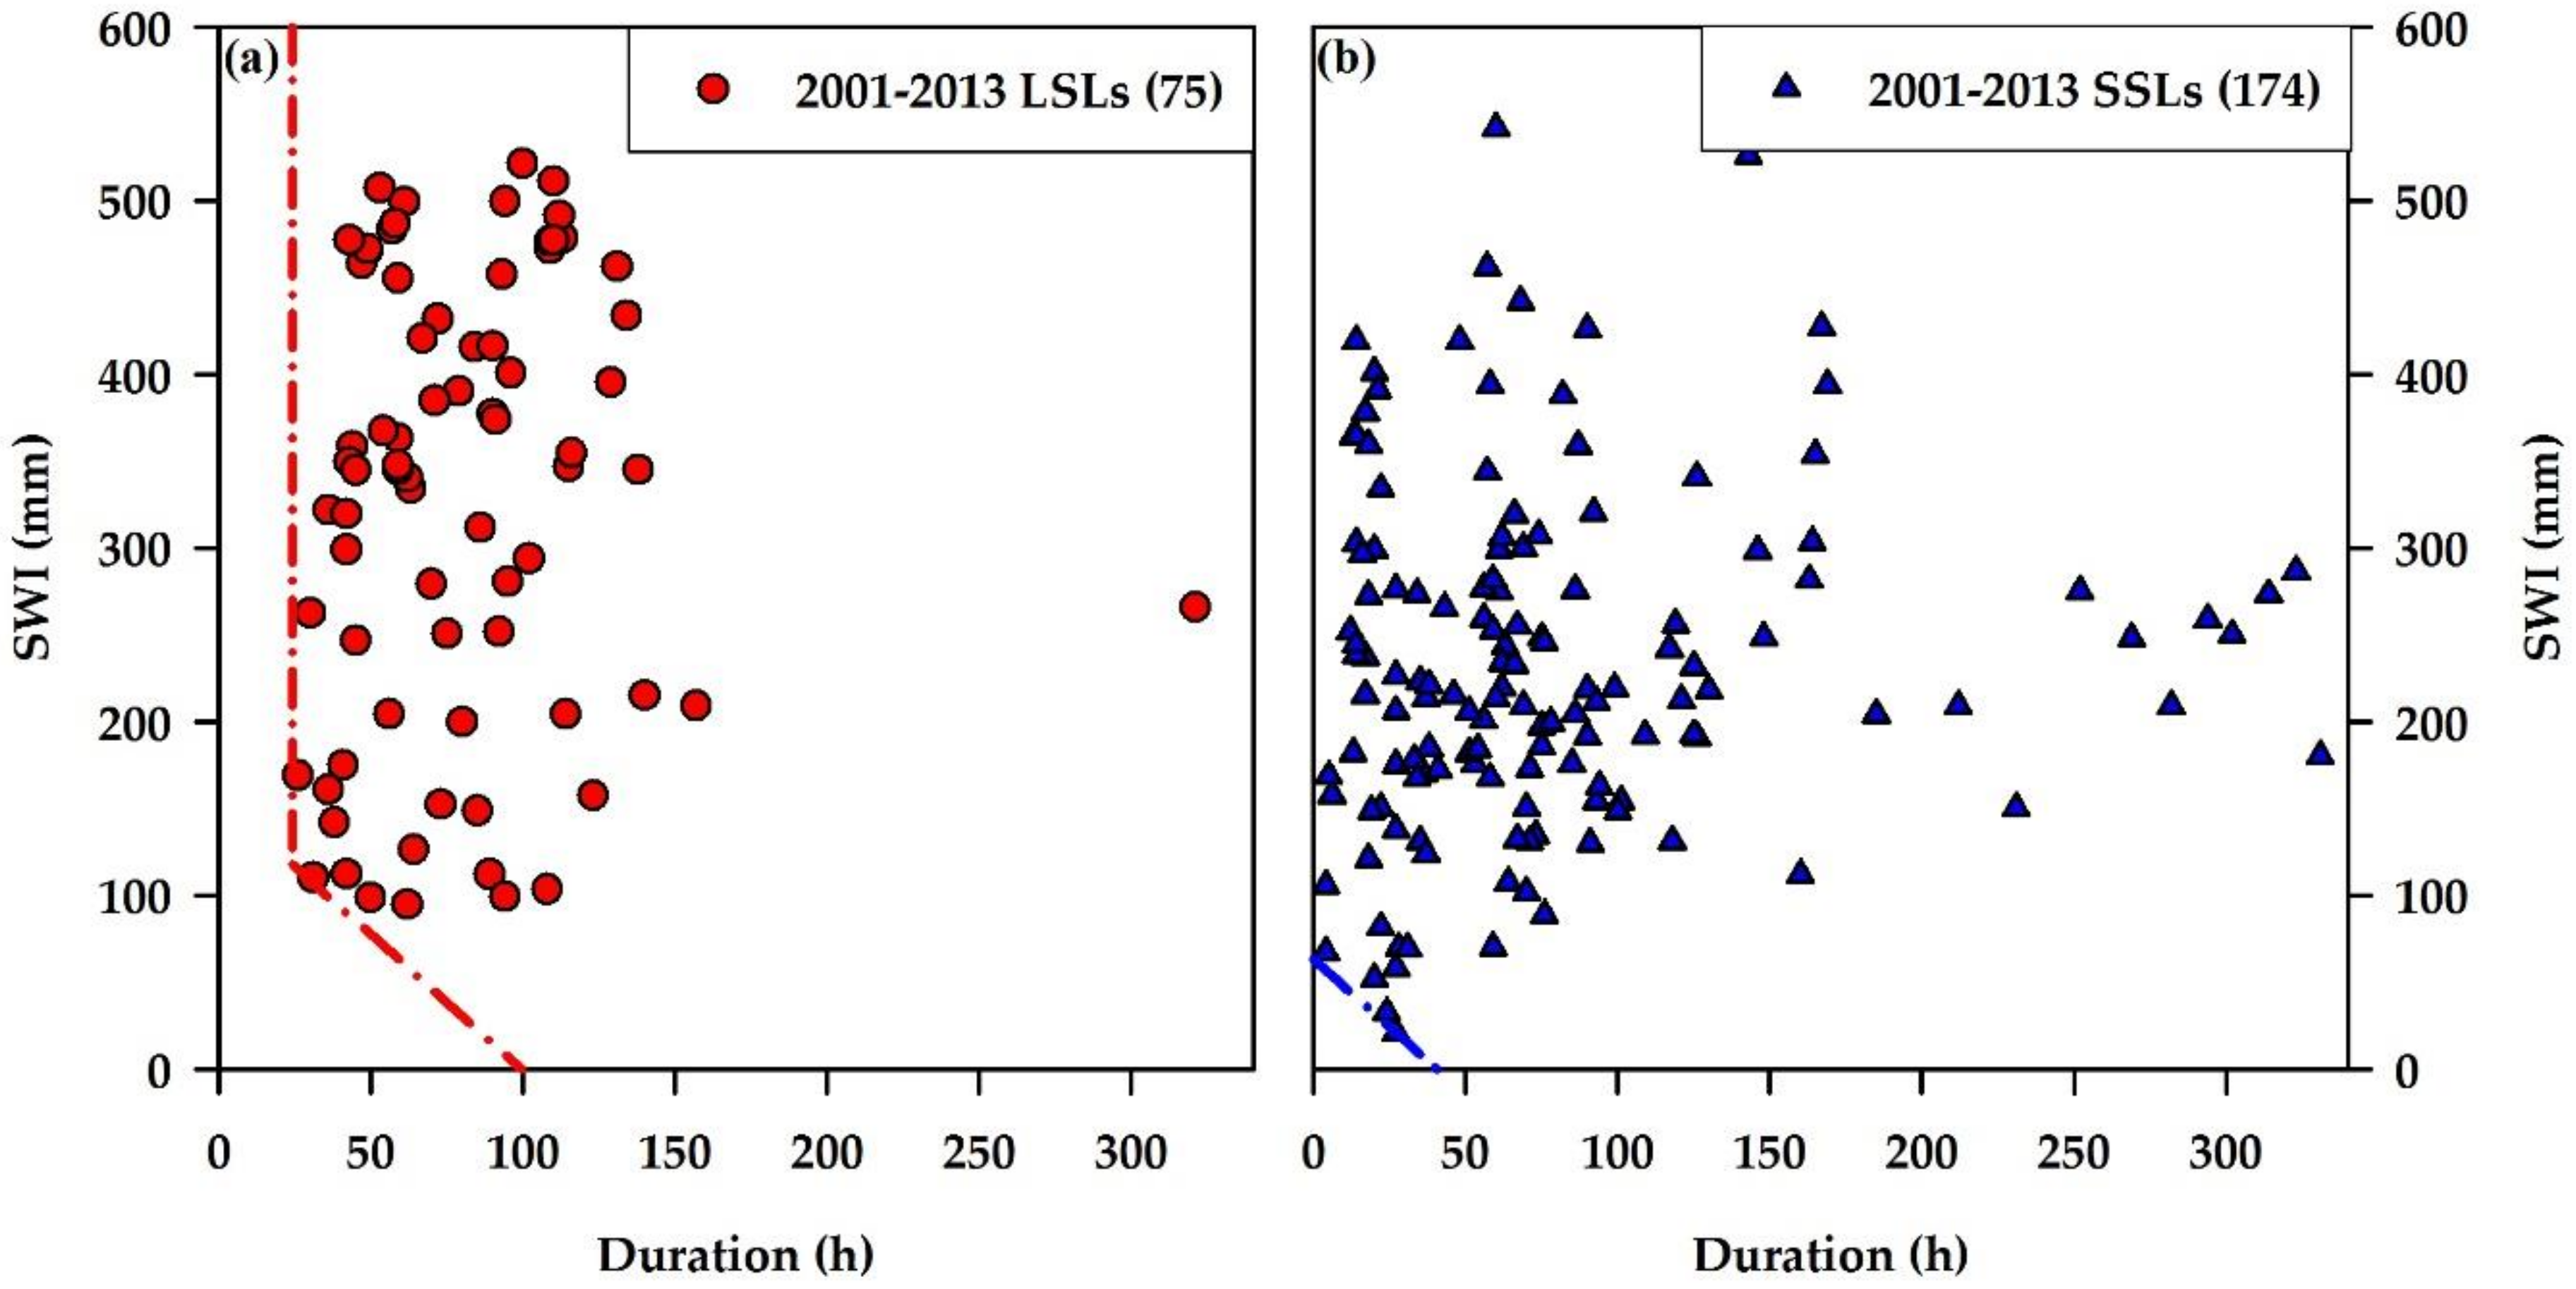
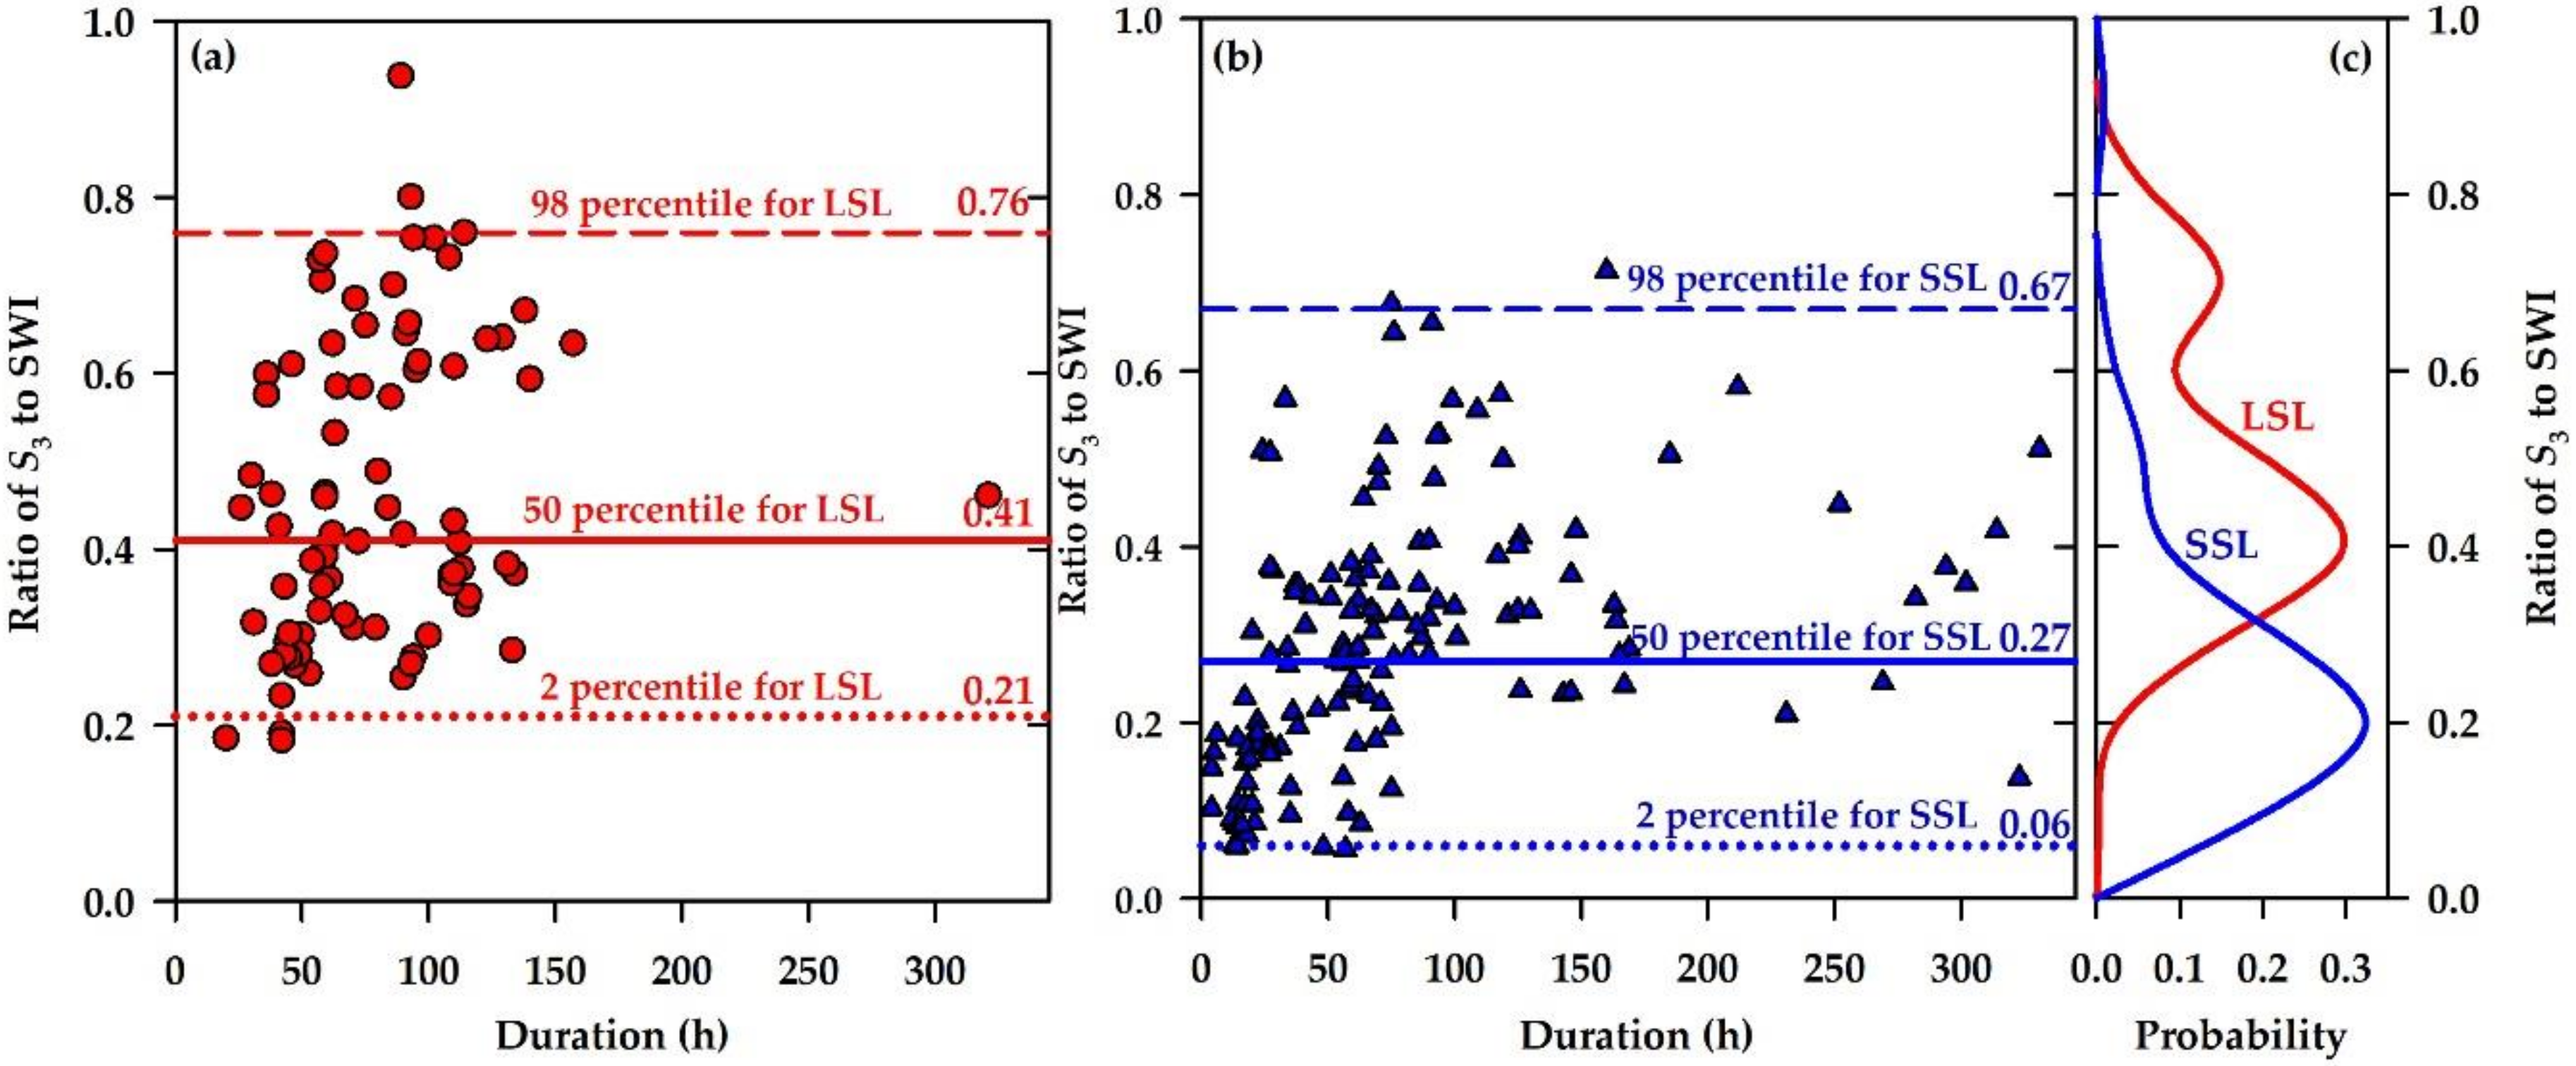
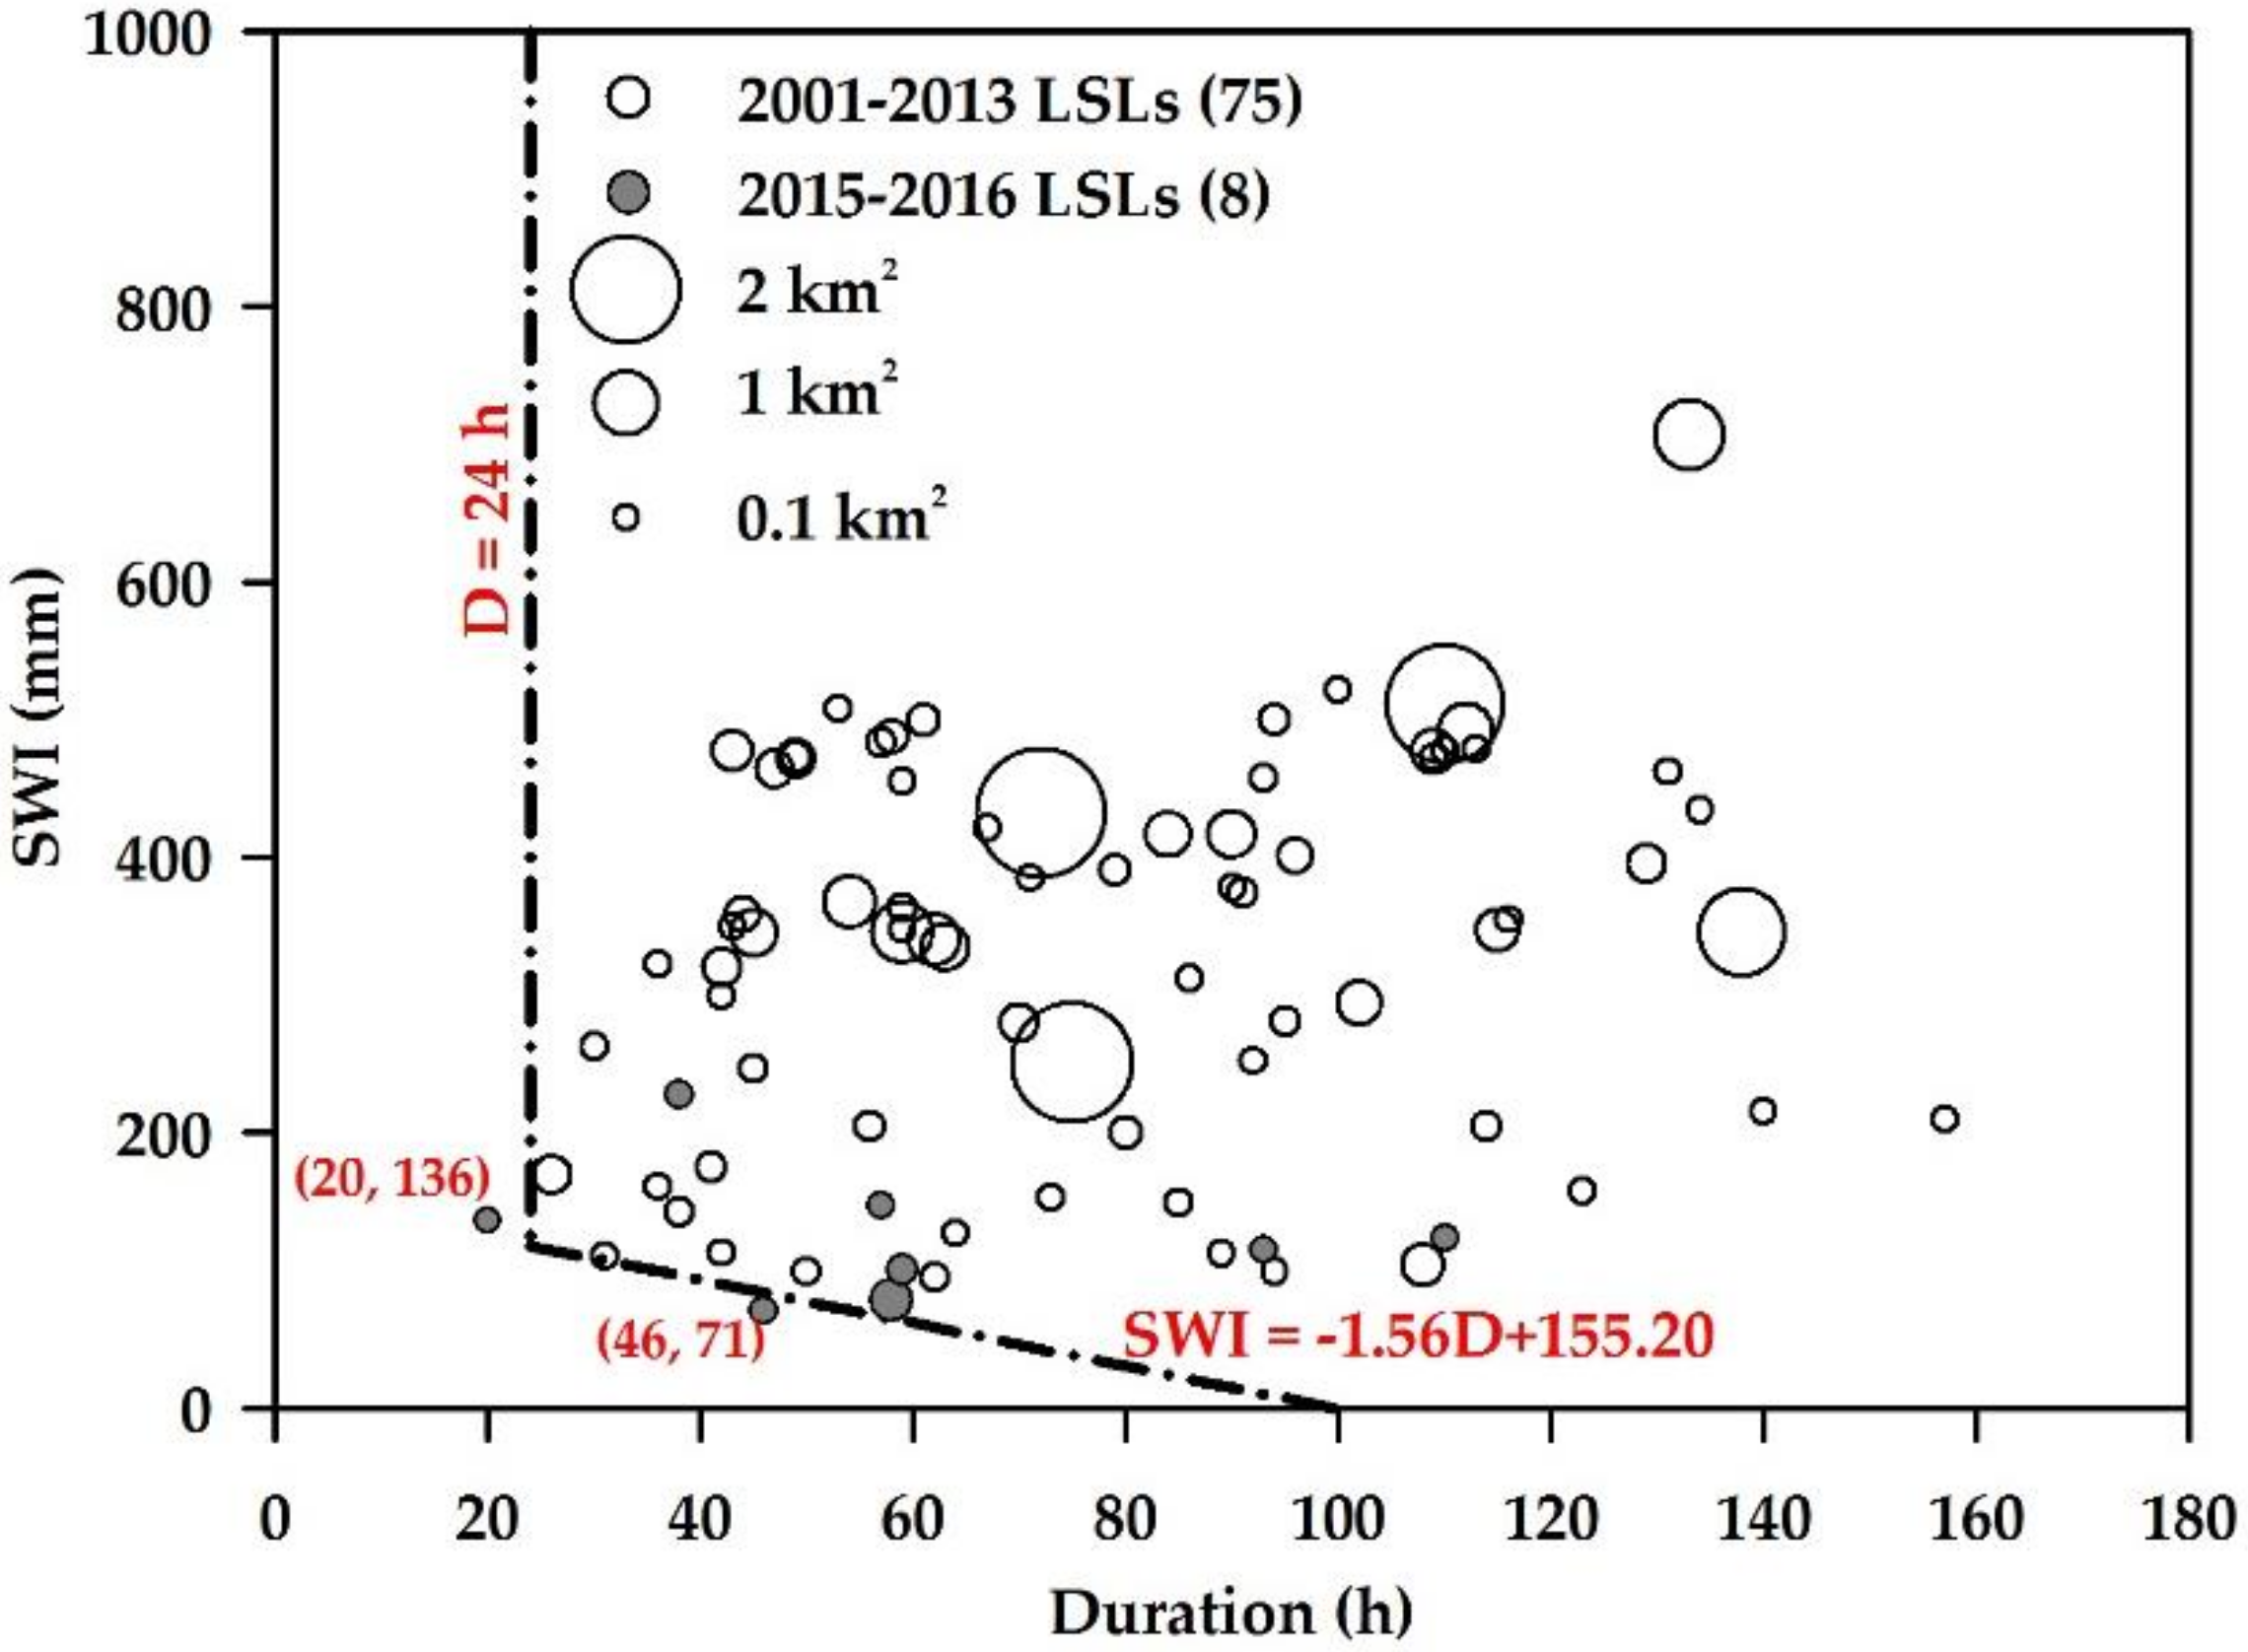
Unlike other consolidated approaches, we have defined soil water index–rainfall duration (SWI–D) thresholds, instead of the popular average rainfall intensity–rainfall duration thresholds. In this study, the SWI–D rainfall threshold curve at 5% exceedance probability was estimated by the method proposed by Brunetti et al. [48]. This threshold was expected to leave 5% of the data points below the threshold line. In general, a threshold requires verification with a certain number of cases. The verification cases are usually randomly selected from the total cases and excluded from the database used to build the threshold. Since the number of LSLs is inconsistent every year and the number of samples used to establish the threshold is limited, the random sampling method was not used to select the verification cases in this study; instead, the LSLs occurring in the last two years of the study period were selected as the threshold verification cases. Figure 8 depicts the SWI–D conditions associated with LSLs and SSLs in Taiwan and the threshold lines. The threshold for LSLs is determined as SWI = 155.20 − 1.56D and D ≥ 24 h. Figure 9 presents the ratios of water depth in the third tank (S3) to the SWIs for LSLs and SSLs. The 50th-percentile of S3/SWI is 0.41, which indicates that when S3 occupies more than 40% of the SWI, there is a higher potential of LSL initiation. This result implies the importance of the water content of the deeper layer.
The SWI–D threshold built with LSL data for 2001–2013 was validated with eight LSLs triggered by heavy rainfall in 2015 and 2016 (Figure 10). Six of them accorded with the SWI–D conditions for 2001–2013, verifying that the SWI can be treated as an indicator for triggering LSLs. However, two cases were lower than the SWI–D threshold. Even so, the two lower values were relatively close to the threshold line. The verification confirmed the advantage of using the SWI. For instance, the SWI often increases rapidly before landslide occurrence, and this phenomenon can be used for a warning system.
4.3. Comparison with Small-Scale Landslides
For comparison, we used an inventory dataset including 174 small-scale landslides (<0.1 km2) provided by the Soil and Water Conservation Bureau, Taiwan. The inventory reports occurrence times and rainfall records. One evident contrast between the rainfall conditions for SSLs and those for LSLs in Taiwan is that the LSLs primarily occur with higher cumulative rainfall. However, SSLs are more likely with shorter but intense rainfall events.
For further comparison, Figure 8 shows the SWI–D conditions for triggering SSLs and LSLs. Although the variations of the SWI–D conditions for the two types of landslide are challenging to distinguish, we note that the SWI–D threshold for LSLs is much higher than that for SSLs. The slope materials require a more substantial amount of water content to evolve into a massive landslide. Figure 9 displays the variation of the ratio of S3 to SWI for SSLs and LSLs. We also noted that each percentile of S3/SWI for LSLs was significantly higher than that for SSLs. For the 50th percentile, SSLs can potentially occur when S3 occupies 27% of the SWI; however, LSLs can potentially occur when S3 occupies 41% of the SWI. A rainfall event that raises the SWI and S3 to high values is critical for triggering LSLs. Therefore, identifying changes in the SWI is conducive to determining the lowest rainfall thresholds for landslides of different scales. Based on the data for 2001–2016, Figure 7 shows the hourly changes of the SWI from the beginning of the rainfall events to LSL occurrences. We used non-parametric median regressions to determine the general trend of the SWI for triggering these LSLs. In addition to an LSL with a duration greater than 200 h, the general SWI curve for the remaining 82 LSLs was obtained by calculating the 50th-percentile of SWIs per each 1-hour increasing interval of duration. Figure 7 also displays the general trends of SSLs in Taiwan, reported by Chen, et al. [27]. Saito, et al. [3] classified rainfall conditions for triggering SSLs into two types, shorter duration–high intensity (SH) and long duration–low intensity (LL). The general trend of the time-varying changes in the SWI for the LSLs in Taiwan is located between the SH type and the LL type. Among the 83 LSLs, only one LSL, occurring in 2006, was triggered by an LL type rainfall event. Comparing SSLs with LL types, the rainfall conditions for triggering LSLs are associated with high average intensity. Furthermore, comparing SSLs with SH types, rainfall conditions for triggering LSLs are associated with a slightly longer duration.
4.4. Effect of Antecedent SWI
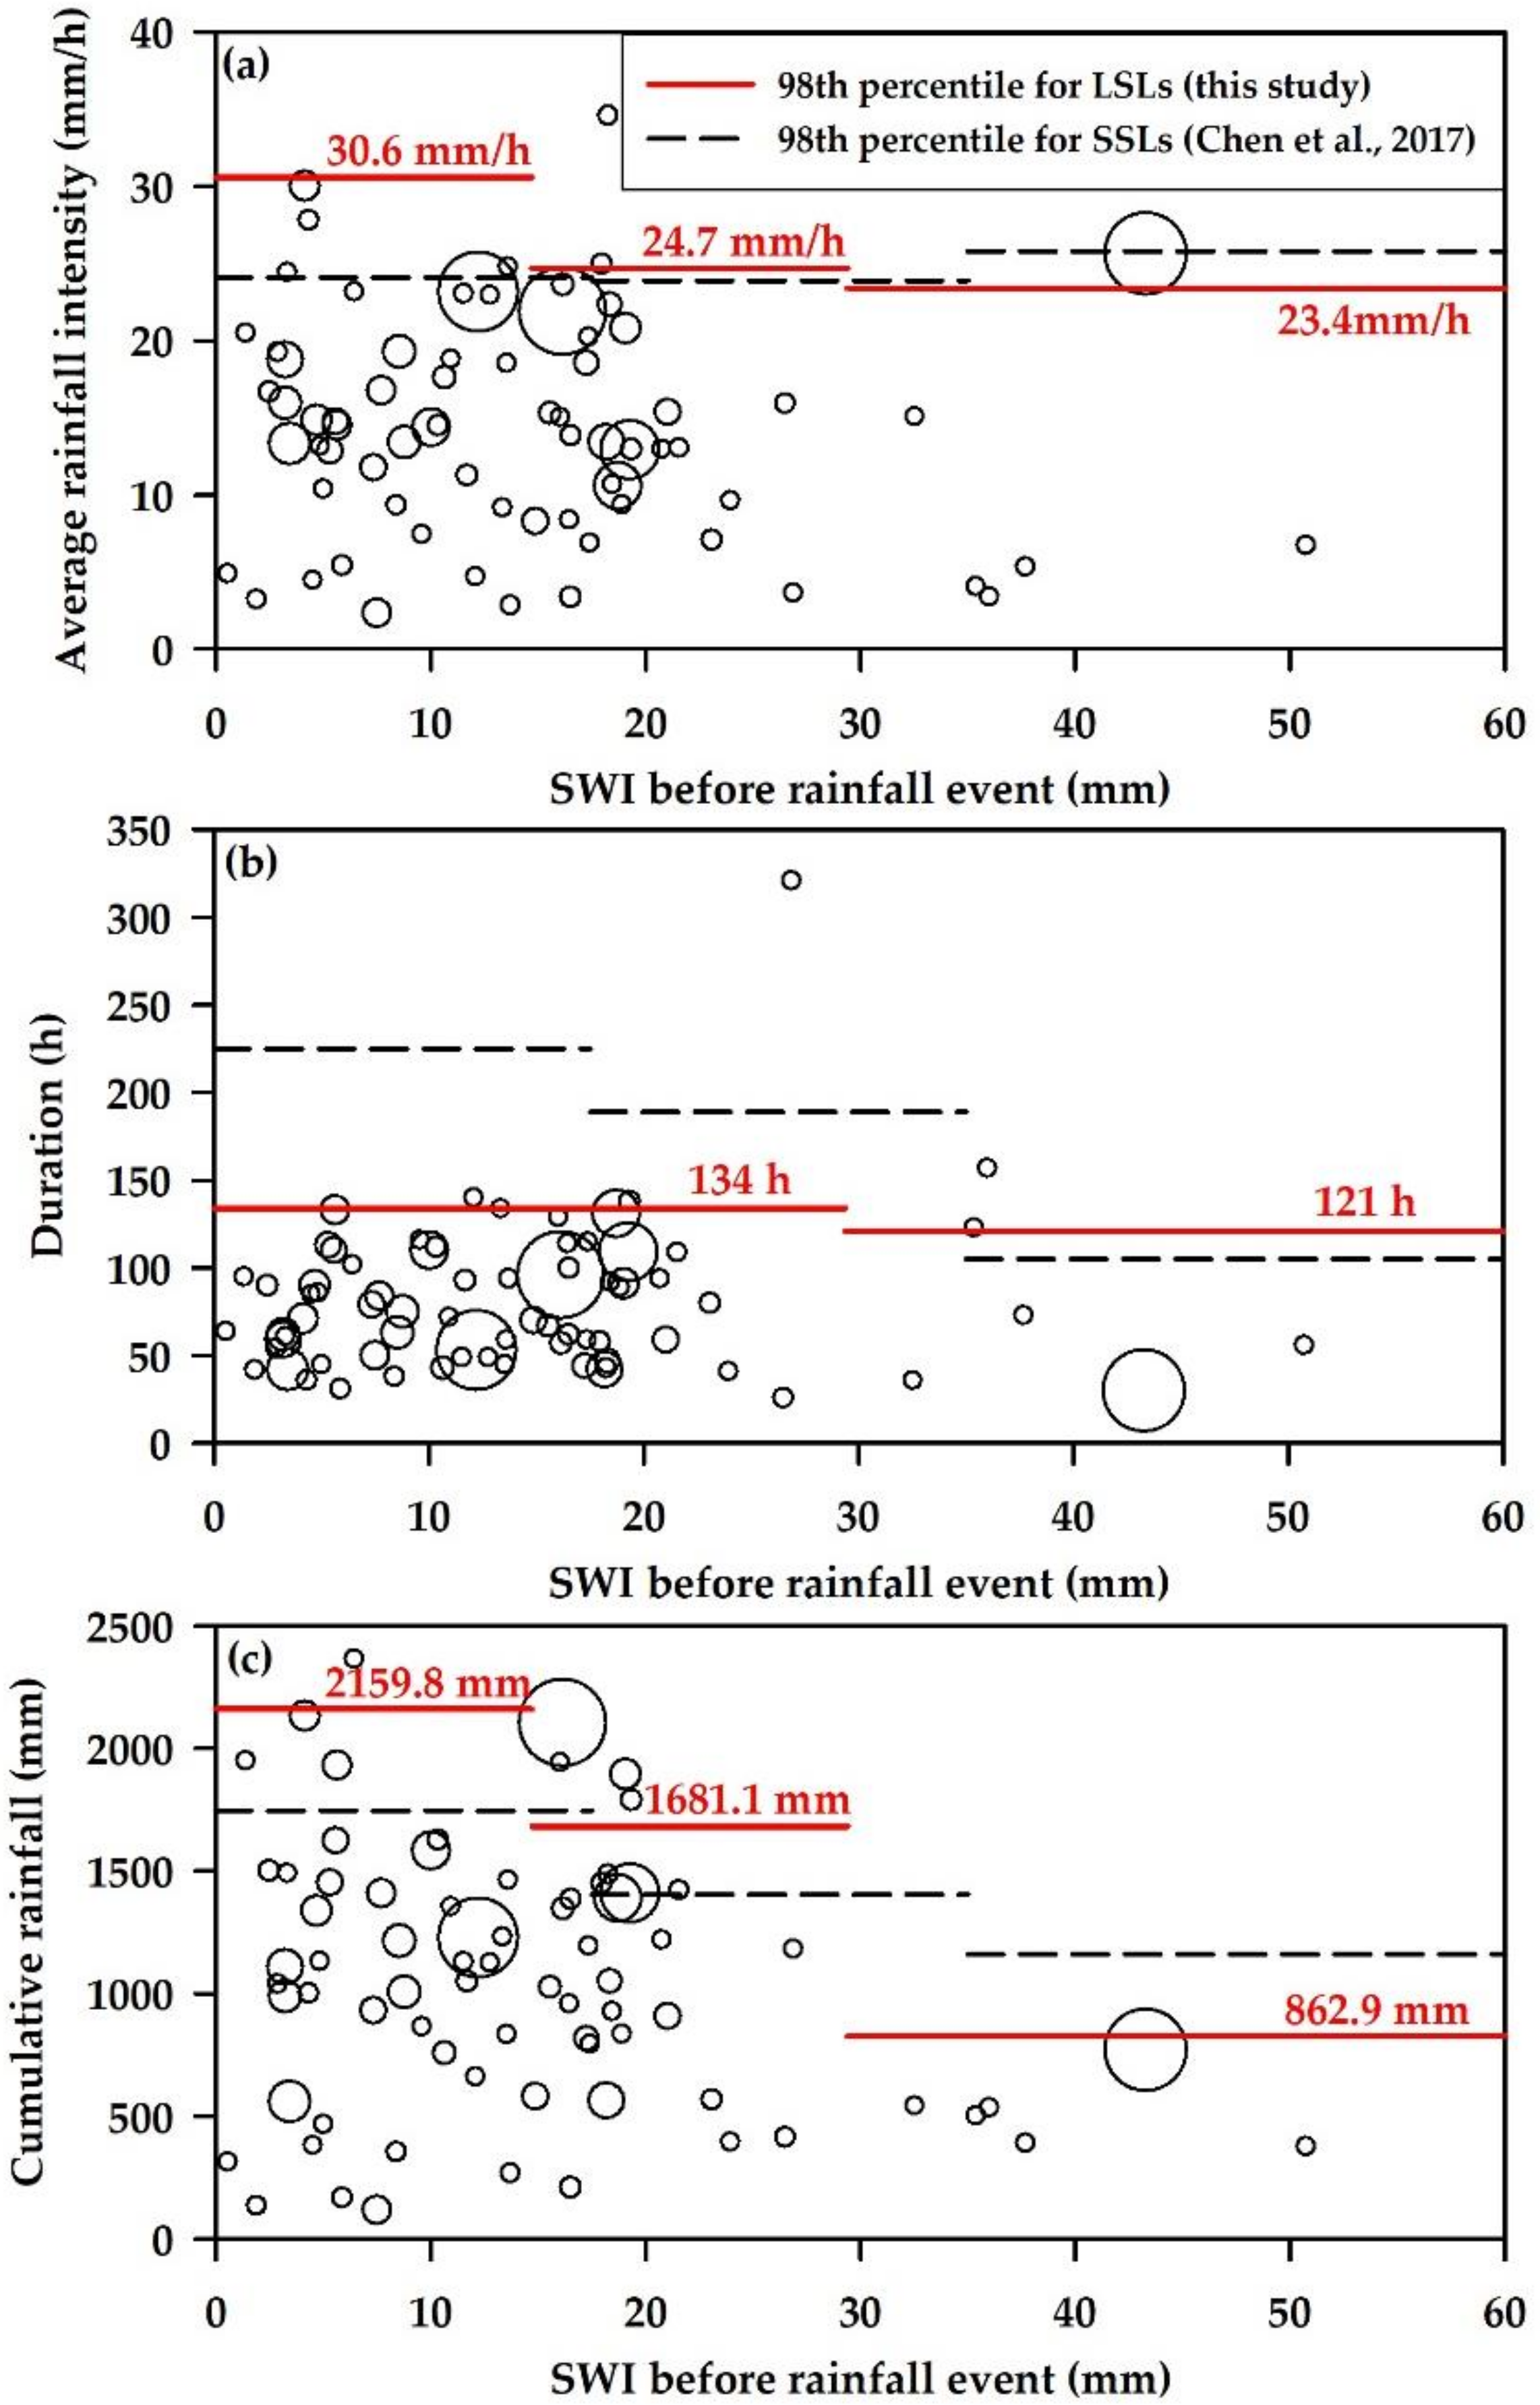
The antecedent SWI values for one month until the beginnings of rainfall events were calculated for comparison with the rainfall conditions for triggering LSLs. Based on the approaches proposed by Chen, et al. [27] for separating landslides into three categories by two values of antecedent SWI, 14.7 mm (the average value) and 29.4 mm (twofold the average value), Table 3 displays the values of the 98th percentiles of average intensity, cumulative event rainfall, and duration for these three categories. Figure 11 shows that the rainfall conditions for triggering LSLs gradually descend with increases in antecedent SWI. With increases in antecedent SWI, the decline in rainfall intensity and cumulative rainfall for triggering LSLs is more evident than that for SSLs. This finding reveals the significant effect of water content before a rainfall event on the occurrence of an LSL. Figure 11 also shows that when antecedent SWI is less than 29.4 mm, the 98th percentiles of rainfall intensity and cumulative rainfall for triggering LSLs are higher than those for SSLs. The 98th percentile of duration for LSLs exceeds 100 h, even though it is shorter than that for SSLs. When antecedent SWI is higher than 29.4 mm, the decrease in the duration for triggering LSLs is smaller than that for SSLs. This finding indicates that long-duration rainfall can be considered as one of the main conditions for triggering LSLs.
5. Conclusions
Due to the limited number of large-scale landslides (LSLs) in a specific region and the difficulty of obtaining their occurrence times, it is still not easy to establish effective rainfall thresholds for LSLs. Exact time and location information on the LSLs in Taiwan provides the opportunity to develop regional rainfall thresholds for triggering LSLs. In addition to the rainfall thresholds determined by general rainfall factors (intensity, duration, and cumulative rainfall), the conceptual water depth estimated by the three-layer tank model can be used as one of the hydro-meteorological conditions that cause landslides. This study analyzed rainfall factors and evaluated conceptual water depths, including S1, S2, S3, and the Soil Water Index (SWI), in three-layer tanks to assess hydro-meteorological thresholds for LSLs from 2001 to 2016 in Taiwan. The analysis of rainfall duration (D), cumulative event rainfall (E), and hourly rainfall (I) indicated that the hourly rainfall at the occurrence time is not a crucial factor for triggering an LSL. In fact, the cumulative event rainfall and duration may be the determining factors for triggering an LSL. The average antecedent SWI is 16.3 mm, and the average SWI when LSLs occurred is 311.9 mm. Sixty-Two events occurred when S3 was higher than S1, which indicated that the deeper water might have a higher relationship with the initiation of LSLs. The triggering rainfall for 75 LSLs from 2001 to 2013 was used to make an SWI–D threshold (SWI = 155.20 − 1.56D and D ≥ 24 h) and was tested with 8 LSLs from 2015 to 2016. A substantial amount of water content within deeper materials is required for initiation of an LSL. The result verified that the SWI can be treated as an indicator of possible LSL initiation. This study also compared the rainfall conditions for LSLs with those for small-scale landslides (SSLs) and revealed that the antecedent rainfall for triggering LSLs is higher than that for triggering SSLs. Unlike the rainfall conditions for triggering SSLs, which are associated with the shorter duration–high intensity type, the rainfall conditions for triggering LSLs are related to long duration–high intensity rainfall events. Through understanding the different hydro-meteorological conditions for LSLs and SSLs using the tank model, the results of this study provide the potential to develop an enhanced landslide early warning model considering disasters of various scales.
Author Contributions
G.-W.L. devised the research, the main conceptual ideas, and the proof outline. H.-L.K. and G.-W.L. performed the analytic calculations. G.-W.L., H.-L.K., C.-W.C., L.-W.W., and J.-M.Z. contributed to the interpretation of the results. G.-W.L. took the lead in writing the manuscript. All authors provided critical feedback and helped shape the research, analysis, and manuscript. All authors have read and agreed to the published version of the manuscript.
Funding
The authors gratefully acknowledged the financial support of the Ministry of Science and Technology of Taiwan and the Soil and Water Conservation Bureau, Council of Agriculture, Executive Yuan of Taiwan.
Acknowledgments
The source of all seismic and rainfall information included in this paper was the Institute of Earth Sciences, Academia Sinica of Taiwan, and the Seismology Center, Central Weather Bureau (CWB), Taiwan.
Conflicts of Interest
The authors declare no conflict of interest
References
- Tu, J.Y.; Chou, C. Changes in precipitation frequency and intensity in the vicinity of Taiwan: Typhoon versus non-typhoon events. Environ. Res. Lett. 2013, 8, 014023. [Google Scholar] [CrossRef]
- Westra, S.; Alexander, L.V.; Zwiers, F.W. Global Increasing Trends in Annual Maximum Daily Precipitation. J. Clim. 2013, 26, 3904–3918. [Google Scholar] [CrossRef] [Green Version]
- Saito, H.; Korup, O.; Uchida, T.; Hayashi, S.; Oguchi, T. Rainfall conditions, typhoon frequency, and contemporary landslide erosion in Japan. Geology 2014, 42, 999–1002. [Google Scholar] [CrossRef] [Green Version]
- Gariano, S.L.; Guzzetti, F. Landslides in a changing climate. Earth Sci. Rev. 2016, 162, 227–252. [Google Scholar] [CrossRef] [Green Version]
- Kelly, M.J. Trends in Extreme Weather Events since 1900—An Enduring Conundrum for Wise Policy Advice. J. Geogr. Nat. Disasters 2016, 6, 1000155. [Google Scholar]
- Froude, M.J.; Petley, D.N. Global fatal landslide occurrence from 2004 to 2016. Nat. Hazards Earth Syst. Sci. 2018, 18, 2161–2181. [Google Scholar] [CrossRef] [Green Version]
- Chigira, M.; Kiho, K. Deep-seated rockslide-avalanches preceded by mass rock creep of sedimentary rocks in the Akaishi Mountains, central Japan. Eng. Geol. 1994, 38, 221–230. [Google Scholar] [CrossRef]
- Lin, C.W.; Liu, S.H.; Lee, S.Y.; Liu, C.C. Impacts of the Chi-Chi earthquake on subsequent rainfall-induced landslides in central Taiwan. Eng. Geol. 2006, 86, 87–101. [Google Scholar] [CrossRef]
- Kirschbaum, D.; Stanley, T.; Zhou, Y. Spatial and temporal analysis of a global landslide catalog. Geomorphology 2015, 249, 4–15. [Google Scholar] [CrossRef]
- Brunetti, M.T.; Guzzetti, F.; Rossi, M. Probability distributions of landslide volumes. Nonlinear Process. Geophys. 2009, 16, 179–188. [Google Scholar] [CrossRef]
- Cruden, D.M.; Varnes, D.J. Chapter 3-Landslide types and process. In Landslides: Investigation and Mitigation; Turner, A.K., Schuster, R.L., Eds.; National Academy Press: Washington, DC, USA, 1996; pp. 36–75. [Google Scholar]
- Hung, C.; Liu, C.H.; Lin, G.W.; Leshchinsky, B. The Aso-Bridge coseismic landslide: A numerical investigation of failure and runout behavior using finite and discrete element methods. Bull. Eng. Geol. Environ. 2018, 78, 2459–2472. [Google Scholar] [CrossRef]
- Guzzetti, F.; Gariano, S.L.; Peruccacci, S.; Brunetti, M.T.; Marchesini, I.; Rossi, M.; Melillo, M. Geographical landslide early warning systems. Earth Sci. Rev. 2019, 200, 102973. [Google Scholar] [CrossRef]
- Jan, C.D.; Lee, M.H. A debris-flow rainfall-based warning model. J. Chin. Soil Water Conserv. 2004, 35, 273–283. [Google Scholar]
- Caine, N. The rainfall intensity-duration control of shallow landslides and debris flows. Geogr. Ann. Phys. Geogr. 1980, 62, 23–27. [Google Scholar]
- Guzzetti, F.; Peruccacci, S.; Rossi, M.; Stark, C.P. Rainfall thresholds for the initiation of landslides in central and southern Europe. Meteorol. Atmos. Phys. 2007, 98, 239–267. [Google Scholar] [CrossRef]
- Chen, C.W.; Saito, H.; Oguchi, T. Rainfall intensity–duration conditions for mass movements in Taiwan. Prog. Earth Planet. Sci. 2015, 2, 14. [Google Scholar] [CrossRef] [Green Version]
- Segoni, S.; Piciullo, L.; Gariano, S.L. A review of the recent literature on rainfall thresholds for landslide occurrence. Landslides 2018, 15, 1483–1501. [Google Scholar] [CrossRef]
- Gariano, S.L.; Sarkar, R.; Dikshit, A.; Dorji, K.; Brunetti, M.T.; Peruccacci, S.; Melillo, M. Automatic calculation of rainfall thresholds for landslide occurrence in Chukha Dzongkhag, Bhutan. Bull. Eng. Geol. Environ. 2019, 78, 4325–4332. [Google Scholar] [CrossRef]
- Kuo, H.L.; Lin, G.W.; Chen, C.W.; Saito, H.; Lin, C.W.; Chen, H.; Chao, W.A. Evaluating critical rainfall conditions for large-scale landslides by detecting event times from seismic records. Nat. Hazards Earth Syst. Sci. 2018, 18, 2877–2891. [Google Scholar] [CrossRef] [Green Version]
- Bogaard, T.; Greco, R. Invited perspectives: Hydrological perspectives on precipitation intensity-duration thresholds for landslide initiation: Proposing hydro-meteorological thresholds. Nat. Hazards Earth Syst. Sci. 2018, 18, 31–39. [Google Scholar] [CrossRef] [Green Version]
- Sugawara, M.E.; Ozaki, I.; Watanabe, I.; Katsuyama, Y. Tank model and its application to Bird Creek, Wollombi Brook, Bikin River, Kitsu River, Sanaga River and Nam Mune. In Research Notes of the National Research Center for Disaster Prevention; Science and Technology Agency: Tokyo, Japan, 1974; pp. 1–64. [Google Scholar]
- Segoni, S.; Rosi, A.; Lagomarsino, D.; Fanti, R.; Casagli, N. Brief communication: Using averaged soil moisture estimates to improve the performances of a regional-scale landslide early warning system. Nat. Hazards Earth Syst. Sci. 2018, 18, 807–812. [Google Scholar] [CrossRef] [Green Version]
- Oku, Y.; Yoshino, J.; Takemi, T.; Ishikawa, H. Assessment of heavy rainfall-induced disaster potential based on an ensemble simulation of Typhoon Talas (2011) with controlled track and intensity. Nat. Hazards Earth Syst. Sci. 2014, 14, 2699–2709. [Google Scholar] [CrossRef] [Green Version]
- Lin, S.E.; Chan, Y.H.; Kuo, C.Y.; Chen, R.F.; Hsu, Y.J.; Chang, K.J.; Lee, S.P.; Wu, R.Y.; Lin, C.W. The Use of a Hydrological Catchment Model to Determine the Occurrence of Temporal Creeping in Deep-seated Landslides. J. Chin. Soil Water Conserv. 2017, 48, 153–162. (In Chinese) [Google Scholar]
- Nie, W.; Krautblatter, M.; Leith, K.; Thuro, K.; Festl, J. A modified tank model including snowmelt and infiltration time lags for deep-seated landslides in alpine environments (Aggenalm, Germany). Nat. Hazards Earth Syst. Sci. 2017, 17, 1595–1610. [Google Scholar] [CrossRef] [Green Version]
- Chen, C.W.; Saito, H.; Oguchi, T. Analyzing rainfall-induced mass movements in Taiwan using the soil water index. Landslides 2017, 14, 1031–1041. [Google Scholar] [CrossRef]
- Mercogliano, P.; Segoni, S.; Rossi, G.; Sikorsky, B.; Tofani, V.; Schiano, P.; Catani, F.; Casagli, N. Brief communication “A prototype forecasting chain for rainfall induced shallow landslides”. Nat. Hazards Earth Syst. Sci. 2013, 13, 771–777. [Google Scholar] [CrossRef] [Green Version]
- Dikshit, A.; Sarkar, R.; Pradhan, B.; Acharya, S.; Dorji, K. Estimating rainfall thresholds for landslide occurrence in the Bhutan Himalayas. Water 2019, 11, 1616. [Google Scholar] [CrossRef] [Green Version]
- Willett, S.D.; Fisher, D.; Fuller, C.; Yeh, E.C.; Lu, C.Y. Erosion rates and orogenic-wedge kinematics in Taiwan inferred from fission-track thermochronometry. Geology 2003, 31, 945–948. [Google Scholar] [CrossRef] [Green Version]
- Ho, C.S. An Introduction to the geology of Taiwan: Explanatory TEXT of the geological map of Taiwan. In Central Geological Survey, 2nd ed.; Ministry of Economic Affairs: Taipei, Taiwan, 1988; p. 192. [Google Scholar]
- Li, Y.H. Denudation of Taiwan island since the Pliocene epoch. Geology 1976, 4, 105–107. [Google Scholar] [CrossRef]
- Hovius, N.; Stark, C.P.; Chu, H.T.; Lin, J.C. Supply and Removal of Sediment in a Landslide-Dominated Mountain Belt: Central Range, Taiwan. J. Geol. 2000, 108, 73–89. [Google Scholar] [CrossRef]
- Shieh, S.L.; Wang, S.T.; Cheng, M.D.; Yeh, T.C.; Chiou, T.K. User’s Guide for Typhoon Forecasting in the Taiwan Area (VII); Central Weather Bureau: Taipei, Taiwan, 1998; p. 171.
- Wu, C.C.; Kuo, Y.H. Typhoons affecting Taiwan: Current understanding and future challenges. Bull. Am. Meteorol. Soc. 1999, 80, 67–80. [Google Scholar] [CrossRef]
- Dammeier, F.; Moore, J.R.; Haslinger, F.; Loew, S. Characterization of alpine rockslides using statistical analysis of seismic signals. J. Geophys. Res. Earth Surf. 2011, 116, F04024. [Google Scholar] [CrossRef]
- Manconi, A.; Picozzi, M.; Coviello, C.; De Santis, F.; Elia, L. Real-time detection, location, and characterization of rockslides using broadband regional seismic networks. Geophys. Res. Lett. 2016, 43, 6960–6967. [Google Scholar] [CrossRef]
- Chen, C.H.; Chao, W.A.; Wu, Y.M.; Zhao, L.; Chen, Y.G.; Ho, W.Y.; Lin, T.L.; Kuo, K.H.; Chang, J.M. A seismological study of landquakes using a real-time broad-band seismic network. Geophys. J. Int. 2013, 194, 885–898. [Google Scholar] [CrossRef] [Green Version]
- Chen, F.W.; Liu, C.W. Estimation of the spatial rainfall distribution using inverse distance weighting (IDW) in the middle of Taiwan. Paddy Water Environ. 2012, 10, 209–222. [Google Scholar] [CrossRef]
- Melillo, M.; Brunetti, M.T.; Peruccacci, S.; Gariano, S.L.; Guzzetti, F. An algorithm for the objective reconstruction of rainfall events responsible for landslides. Landslides 2015, 12, 311–320. [Google Scholar] [CrossRef]
- Okada, K.; Makihara, Y.; Shimpo, A.; Nagata, K.; Kunitsugu, M.; Saito, K. Soil water index. Tenki 2001, 47, 36–41. [Google Scholar]
- Xie, Z.; Su, F.; Liang, X.; Zeng, Q.; Hao, Z.; Guo, Y. Applications of a surface runoff model with Horton and Dunne runoff for VIC. Adv. Atmos. Sci. 2003, 20, 165–172. [Google Scholar]
- Kirchner, J.W. Catchments as simple dynamical systems: Catchment characterization, rainfall-runoff modeling, and doing hydrology backward. Water Resour. Res. 2009, 45, W02429. [Google Scholar] [CrossRef] [Green Version]
- Osanai, N.; Shimizu, T.; Kuramoto, K.; Kojima, S.; Noro, T. Japanese early-warning for debris flows and slope failures using rainfall indices with Radial Basis Function Network. Landslides 2010, 7, 325–338. [Google Scholar] [CrossRef]
- Song, J.H.; Her, Y.; Park, J.; Lee, K.D.; Kang, M.S. Simulink Implementation of a Hydrologic Model: A Tank Model Case Study. Water 2017, 9, 639. [Google Scholar] [CrossRef] [Green Version]
- Paik, K.; Kim, J.H.; Kim, H.S.; Lee, D.R. A conceptual rainfall-runoff model considering seasonal variation. Hydrol. Process. 2005, 19, 3837–3850. [Google Scholar] [CrossRef]
- Jang, T.; Kim, H.; Kim, S.; Seong, C.; Park, S. Assessing irrigation water capacity of land use change in a data-scarce watershed of Korea. J. Irrig. Drain. Eng. 2011, 138, 445–454. [Google Scholar] [CrossRef]
- Brunetti, M.T.; Peruccacci, S.; Rossi, M.; Luciani, S.; Valigi, D.; Guzzetti, F. Rainfall thresholds for the possible occurrence of landslides in Italy. Nat. Hazards Earth Syst. Sci. 2010, 10, 447–458. [Google Scholar] [CrossRef]
Figure 1.
Distribution of rain gauges around Taiwan and geological map.

Figure 2.
(a) Distribution of the 83 large-scale landslides (LSLs) that occurred between 2001 and 2016. (b) Example of satellite image of an LSL occurring in 2009 with a disturbed area of 2.3 km2. (c) Original seismic waveform induced by the LSL. (d) Spectrogram of the vertical component of the seismic waveform induced by the LSL.

Figure 3.
Schematic layout of the soil water index (SWI) tank model. The SWI represents the summation of water depth in the three tanks.
Figure 3.
Schematic layout of the soil water index (SWI) tank model. The SWI represents the summation of water depth in the three tanks.

Figure 4.
Example of three selected rain gauge stations and an LSL site. (a) Distribution of three rain gauges and the LSL No.41. (b) Rainfall records at the three stations and the estimated hourly rainfall using the inverse distance weighting (IDW) method. (c) Example of change in the SWI for the LSL.

Figure 5.
Statistics of triggered LSL number for each rainfall factor.

Figure 6.
Statistics of triggered LSL number with S1, S2, S3, and SWI.

Figure 7.
Hourly changes in the SWI from the beginning of rainfall to landslide occurrence. The two general curves for small-scale landslides (SSL) were adopted from Chen, et al. [27].
Figure 7.
Hourly changes in the SWI from the beginning of rainfall to landslide occurrence. The two general curves for small-scale landslides (SSL) were adopted from Chen, et al. [27].

Figure 8.
Soil water index–rainfall duration (SWI–D) thresholds for (a) LSLs and (b) SSLs.

Figure 9.
(a) Data distribution of the ratios of S3 to SWI for (a) LSLs and (b) SSLs. (c) Probability distribution of the ratios of S3 to SWI for LSLs and SSLs. Duration was calculated from the beginning of rainfall to landslide occurrence.
Figure 9.
(a) Data distribution of the ratios of S3 to SWI for (a) LSLs and (b) SSLs. (c) Probability distribution of the ratios of S3 to SWI for LSLs and SSLs. Duration was calculated from the beginning of rainfall to landslide occurrence.

Figure 10.
Validation of the SWI–D threshold using the data for six LSLs occurring during 2015–2016. Dashed line represents the SWI–D threshold.
Figure 10.
Validation of the SWI–D threshold using the data for six LSLs occurring during 2015–2016. Dashed line represents the SWI–D threshold.

Figure 11.
Variations of (a) average rainfall intensity, (b) duration, and (c) cumulative rainfall for triggering LSLs during 2001–2016 with the antecedent SWI. Red lines represent the 98th percentile of rainfall parameters for triggering LSLs in different categories of antecedent SWI. Dashed lines represent the 98th percentile of rainfall parameters for triggering SSLs in different categories of antecedent SWI reported by Chen, et al. [27].


Table 1.
Landslide data of the 83 LSLs.
| ID | Date/Time (UTC) | Longitude (°E) | Latitude (°N) | Area (km2) | ID | Date/Time (UTC) | Longitude (°E) | Latitude (°N) | Area (km2) |
|---|---|---|---|---|---|---|---|---|---|
| 1 | 31 Jul 2001/17:36 | 121.344 | 23.627 | 0.49 | 43 | 08 Aug 2009/13:56 | 120.661 | 22.960 | 0.11 |
| 2 | 18 Sep 2001/16:24 | 121.203 | 23.379 | 0.16 | 44 | 08 Aug2009/18:28 | 120.656 | 22.948 | 0.12 |
| 3 | 04 Aug 2003/11:57 | 120.738 | 22.391 | 0.18 | 45 | 10 Aug 2009/18:42 | 120.762 | 22.823 | 0.55 |
| 4 | 04 Aug 2003/04:18 | 120.966 | 23.429 | 0.13 | 46 | 09 Aug 2009/11;00 | 120.772 | 22.816 | 0.13 |
| 5 | 02 Jul 2004/19:03 | 121.491 | 24.241 | 0.1 | 47 | 08 Aug 2009/10:40 | 120.858 | 22.797 | 0.16 |
| 6 | 01 Jul 2004/19:36 | 121.248 | 23.596 | 0.15 | 48 | 08 Aug 2009/07:35 | 120.703 | 22.754 | 0.49 |
| 7 | 30 Jun 2004/23:51 | 121.333 | 23.174 | 0.11 | 49 | 08 Aug 2009/18:19 | 120.716 | 22.700 | 0.56 |
| 8 | 24 Aug 2004/14:54 | 120.763 | 23.566 | 0.22 | 50 | 08Aug 2009/19:19 | 120.712 | 22.673 | 0.64 |
| 9 | 20 Jul 2005/21:55 | 120.817 | 22.881 | 0.12 | 51 | 09 Aug 2009/03:55 | 120.719 | 22.603 | 0.63 |
| 10 | 21 Jul 2005/06:33 | 120.718 | 22.850 | 0.18 | 52 | 08 Aug 2009/20:15 | 120.733 | 22.586 | 0.73 |
| 11 | 18 Jul 2005/19:42 | 120.737 | 22.800 | 0.13 | 53 | 08 Aug 2009/00:04 | 120.724 | 22.565 | 0.39 |
| 12 | 20 Jul 2005/18:15 | 120.752 | 22.742 | 0.13 | 54 | 08 Aug 2009/17:05 | 120.708 | 22.494 | 0.94 |
| 13 | 09 Jun 2006/16:53 | 121.171 | 24.125 | 0.12 | 55 | 08 Aug 2009/00:35 | 120.727 | 22.494 | 0.12 |
| 14 | 15 Sep 2008/02:45 | 121.383 | 24.353 | 0.14 | 56 | 08 Aug 2009/21:42 | 120.909 | 23.100 | 0.25 |
| 15 | 18 Jul 2008/21:30 | 121.006 | 23.819 | 0.1 | 57 | 08 Aug 2009/17:53 | 120.911 | 23.079 | 0.19 |
| 16 | 18 Jul 2008/15:29 | 120.829 | 23.544 | 0.11 | 58 | 08 Aug 2009/17:21 | 120.902 | 23.072 | 0.28 |
| 17 | 18 Jul 2008/23:55 | 120.660 | 23.147 | 0.12 | 59 | 08 Aug 2009/02:20 | 120.847 | 22.975 | 0.11 |
| 18 | 08 Aug 2009/22:52 | 120.901 | 23.537 | 0.12 | 60 | 08 Aug 2009/23:15 | 120.772 | 22.627 | 0.15 |
| 19 | 08 Aug 2009/05:35 | 120.832 | 23.516 | 0.5 | 61 | 08 Aug 2009/18:16 | 120.831 | 22.626 | 0.72 |
| 20 | 08 Aug 2009/18:11 | 120.786 | 23.512 | 1.12 | 62 | 08 Aug 2009/23:41 | 120.837 | 22.625 | 0.12 |
| 21 | 08 Aug 2009/21:30 | 120.921 | 23.488 | 0.12 | 63 | 08 Aug 2009/09:00 | 120.793 | 22.611 | 0.62 |
| 22 | 08 Aug 2009/01:20 | 120.768 | 23.487 | 0.14 | 64 | 09 Aug 2009/09:31 | 120.813 | 22.560 | 2.31 |
| 23 | 09 Aug 2009/19:36 | 120.559 | 23.320 | 0.39 | 65 | 19 Sep 2010/23:24 | 120.728 | 22.850 | 0.15 |
| 24 | 08 Aug 2009/21:11 | 120.899 | 23.456 | 0.15 | 66 | 30 Aug 2011/09:13 | 121.183 | 23.685 | 0.11 |
| 25 | 08 Aug 2009/20:27 | 120.919 | 23.404 | 0.12 | 67 | 31 Aug 2011/09:37 | 120.976 | 23.331 | 0.11 |
| 26 | 08 Aug 2009/08:00 | 120.915 | 23.334 | 0.41 | 68 | 30 Aug 2011/07:10 | 120.929 | 22.859 | 0.12 |
| 27 | 08 Aug 2009/03:27 | 120.912 | 23.329 | 0.4 | 69 | 03 Aug 2012/01:00 | 121.377 | 24.359 | 0.19 |
| 28 | 08 Aug 2009/11:35 | 120.949 | 23.327 | 0.22 | 70 | 02 Aug 2012/19:00 | 120.946 | 23.740 | 0.25 |
| 29 | 10 Aug 2009/04:22 | 120.759 | 23.309 | 1.52 | 71 | 01 Aug 2012/18:39 | 121.417 | 24.576 | 0.12 |
| 30 | 08 Aug 2009/23:14 | 120.754 | 23.293 | 0.56 | 72 | 02 Aug 2012/10:00 | 121.853 | 24.525 | 0.12 |
| 31 | 10 Aug 2009/03:54 | 120.799 | 23.247 | 0.2 | 73 | 29 Aug 2013/19:48 | 120.825 | 22.862 | 0.21 |
| 32 | 09 Aug 2009/02:52 | 120.767 | 23.231 | 0.81 | 74 | 22 Aug 2013/19:05 | 121.073 | 23.383 | 0.18 |
| 33 | 09 Aug2009/00:34 | 120.767 | 23.215 | 2.24 | 75 | 13 Jul 2013/14:27 | 120.886 | 23.023 | 0.4 |
| 34 | 08 Aug 2009/16:15 | 120.881 | 23.180 | 0.14 | 76 | 09 Aug 2015/14:45 | 121.012 | 23.685 | 0.11 |
| 35 | 08 Aug 2009/22:16 | 120.656 | 23.166 | 2.5 | 77 | 09 Aug 2015/02:00 | 121.199 | 23.969 | 0.06 |
| 36 | 10 Aug 2009/11:06 | 120.857 | 23.157 | 0.34 | 78 | 08 Aug 2015/19:00 | 120.776 | 23.213 | 0.21 |
| 37 | 08 Aug 2009/03:55 | 120.754 | 23.082 | 0.33 | 79 | 16 Sep 2016/23:06 | 121.075 | 23.577 | 0.18 |
| 38 | 08 Aug 2009/06:25 | 120.825 | 23.062 | 0.39 | 80 | 08 Jul 2106/07:48 | 121.427 | 24.172 | 0.04 |
| 39 | 08 Aug 2009/23:02 | 120.604 | 23.034 | 0.13 | 81 | 16 Sep 2016/02:33 | 121.626 | 24.342 | 0.04 |
| 40 | 08 Aug 2009/07:15 | 120.704 | 23.012 | 0.23 | 82 | 28 Sep 2016/20:45 | 121.427 | 24.173 | 0.02 |
| 41 | 08 Aug 2009/06:28 | 120.671 | 23.008 | 0.15 | 83 | 29 Sep 2016/01:45 | 121.117 | 23.485 | 0.01 |
| 42 | 08 Aug 2009/08:10 | 120.813 | 22.997 | 0.19 |
Table 2.
Parameters for calculating SWI.
| Tank | First | Second | Third |
|---|---|---|---|
| Outflow height (mm) | L11 = 15 | L21 = 15 | L31 = 15 |
| L12 = 60 | |||
| Outflow coefficient (1/h) | a11 = 0.1 | a21 = 0.05 | a31 = 0.01 |
| a12 = 0.15 | |||
| Coefficient of permeability (1/h) | b1 = 0.12 | b1 = 0.05 | b1 = 0.01 |
Table 3.
The 98th percentile of duration, cumulative amount, average intensity of rainfall triggering LSLs in different categories of antecedent SWI.
Table 3.
The 98th percentile of duration, cumulative amount, average intensity of rainfall triggering LSLs in different categories of antecedent SWI.
| Rainfall Conditions | SWI ≤ 14.7 | 14.7 < SWI < 29.4 | SWI ≥ 29.4 |
|---|---|---|---|
| Duration (h) | 134 | 134 | 121 |
| Cumulative rainfall (mm) | 2159.8 | 1681.1 | 826.9 |
| Average rainfall intensity (mm/h) | 30.6 | 24.7 | 23.4 |
© 2020 by the authors. Licensee MDPI, Basel, Switzerland. This article is an open access article distributed under the terms and conditions of the Creative Commons Attribution (CC BY) license (http://creativecommons.org/licenses/by/4.0/).
Share and Cite
MDPI and ACS Style
Lin, G.-W.; Kuo, H.-L.; Chen, C.-W.; Wei, L.-W.; Zhang, J.-M. Using a Tank Model to Determine Hydro-Meteorological Thresholds for Large-Scale Landslides in Taiwan. Water 2020, 12, 253. https://doi.org/10.3390/w12010253
AMA Style
Lin G-W, Kuo H-L, Chen C-W, Wei L-W, Zhang J-M. Using a Tank Model to Determine Hydro-Meteorological Thresholds for Large-Scale Landslides in Taiwan. Water. 2020; 12(1):253. https://doi.org/10.3390/w12010253
Chicago/Turabian StyleLin, Guan-Wei, Hsien-Li Kuo, Chi-Wen Chen, Lun-Wei Wei, and Jia-Ming Zhang. 2020. "Using a Tank Model to Determine Hydro-Meteorological Thresholds for Large-Scale Landslides in Taiwan" Water 12, no. 1: 253. https://doi.org/10.3390/w12010253
Note that from the first issue of 2016, this journal uses article numbers instead of page numbers. See further details here.