Experimental Investigation of Substrate Shock and Environmental Ammonium Concentration on the Stability of Ammonia-Oxidizing Bacteria (AOB)


1
Department of Civil and Environment Engineering, Hanyang University, Seoul 04763, Korea
2
Department of Civil and Environment Engineering, Hanyang University, Ansan Gyeonggi-do 155 88, Korea
*
Author to whom correspondence should be addressed.
Water 2020, 12(1), 223; https://doi.org/10.3390/w12010223
Submission received: 20 November 2019
/
Revised: 8 January 2020
/
Accepted: 9 January 2020
/
Published: 13 January 2020
(This article belongs to the Special Issue Design, Operation and Economics of Wastewater Treatment Plant)
Abstract
:A wastewater treatment plant (WWTP) frequently encounters fluctuation in ammonium concentration or flow rate (Q), which may affect the stability of ammonium oxidizing bacteria (AOB). In this study, two continuous stirred tank reactors (CSTRs) were operated for 588 days and ammonium concentration was varied at various steady-state conditions. There was no inhibition observed in CSTR operation and AOB acclimated once at a certain ammonium concentration. Cells at an acclimated steady-state concentration (200 mgTAN/L from R(A) and 1000 mgTAN/L from R(B)) were extracted to perform a batch test at operating conditions, and self-inhibition behavior was observed in the batch reaction. In CSTR operation, the environmental ammonium concentration was varied and the specific oxygen uptake rate (SOUR) value was estimated from daily profile data and compared with batch reaction. In the CSTR operation as a substitute for self-inhibition, the SOUR was shifted towards the maximum specific oxygen uptake rate (SOURmax) and no self-inhibition was observed. For further justification of the CSTR’s stability, several total ammonium nitrogen (TAN) concentrations (range from ~−106 to ~+2550 mgTAN/L) were directly added to interrupt the stability of the process. As a substitute for any effect on the SOUR, the CSTRs were recovered back to the original stable steady-state conditions without varying the operational conditions.
1. Introduction
Ammonium oxidizing bacteria (AOB) is the most common species that relies on the ionic ammonium (AOB activate its ammonium transport mechanism) or free ammonia (passive diffusion), which depends on the choice and accessibility of the substrate [1,2,3]. ‘Inhibition’ is a degradation of a substrate that is slowed down by the substrate itself when environmental substrate concentration surpasses the maximum specific substrate utilization rate [4]. However, [5] applied the critical substrate concentration to decide the stability of AOB. If substrate concentration changes from the critical substrate concentration rate then AOB slows down its substrate degradation rate (self-inhibition) [6]. Incidental variations in the environmental substrate concentration affects specific substrate utilization rate (q) and the reactor regains the previous steady-state conditions [5,7]. Due to the self-inhibition behavior of AOB, several researchers [7,8,9,10] operated reactors at steady-state conditions utilizing various control tactics (substrate feedback control and dissolved oxygen (DO) control [10].
The useful factor in self-inhibition is the concentration of inhibitory substrate (KI) [11]. A common type of inhibition for chlorinated solvents and aromatic hydrocarbons is self-inhibition, which is also called Andrews or Haldane kinetics. The kinetics and stochiometric parameters are controlled by the inhibitory substrate concentration [11]. However, many researchers believed the batch parameters are the deciding factors for reactor operate in stable or unstable operation [5,8,9,10,12]. It is a fact that self-inhibition behavior is common in cell culture but it may not be true in the continuous operation of a continuous stirred tank reactor (CSTR) because the stoichiometric parameters may not persist in the same way at different feed concentration and this might be the reason that the critical substrate concentration (Sc) may be altered with the change in influent and effluent concentration in the CSTR [11].
In previous studies [5,8,9,10] the stability of AOB was analyzed by obtaining the Sc value from batch reaction and environmental feed concentration was altered and compared with the Sc value; when the concentration of substrate exceeds the Sc then reactors were entered unstable conditions and some control strategies were used in continuous operation to control the reactor in stable conditions. By keeping the practical application in mind, the ammonium concentration does not persist in the same amount in a wastewater treatment plant (WWTP). In this study, the stability of the reactors was analyzed by comparing the specific oxygen uptake rate (SOUR) obtained from a batch reaction and SOUR estimated from a continuous operation and no control strategies were applied in a continuous operation. Once AOB acclimated at certain ammonium concentration there should be no inhibition by the alteration of environmental substrate concentrations. For investigating the effect of substrate shock and environmental ammonium concentration, the ammonium concentration in various steady-state phases and also feed concentration were altered to elevate the environmental ammonium concentration higher than the Sc value, and also the SOUR was estimated from the continuous operation (daily profile data) and compared with the batch curve.
2. Material and Methods
2.1. Ammonium Oxidizing Bacteria (AOB) Cell Culture and Mineral Medium
2.2. Stable and Long-Term Operation of Continuous Stirred Tank Reactor (CSTR)
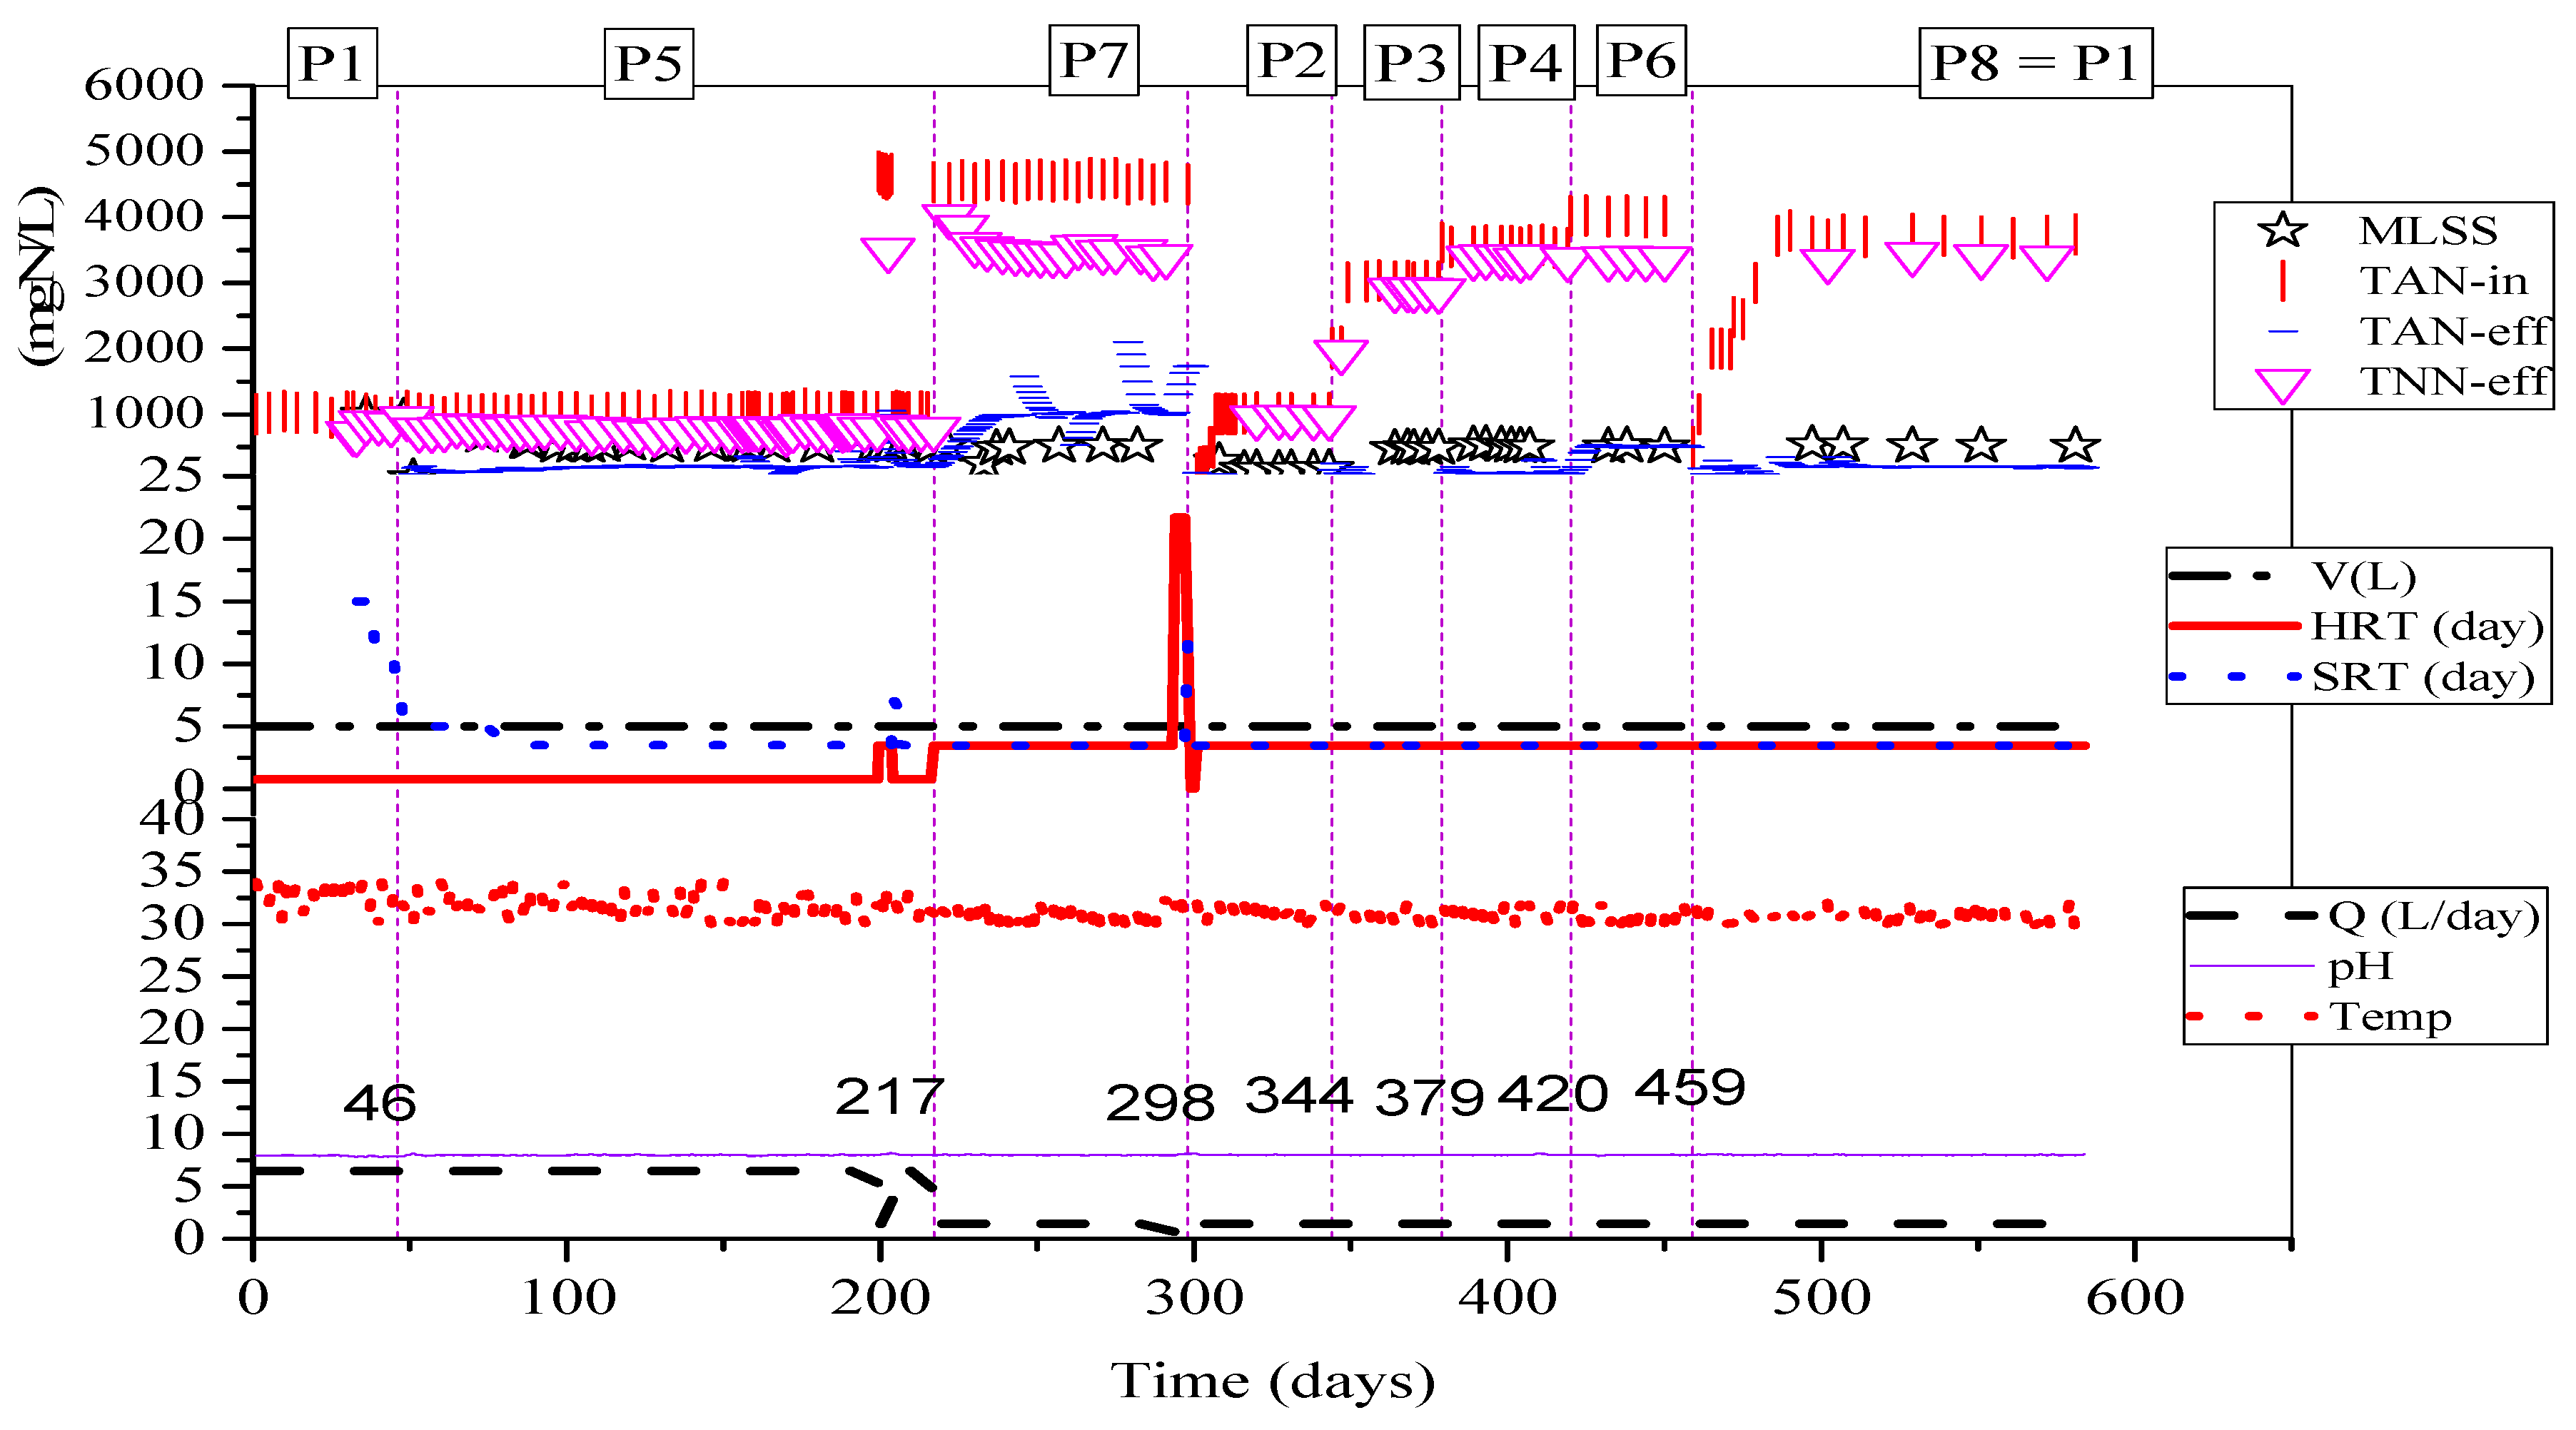
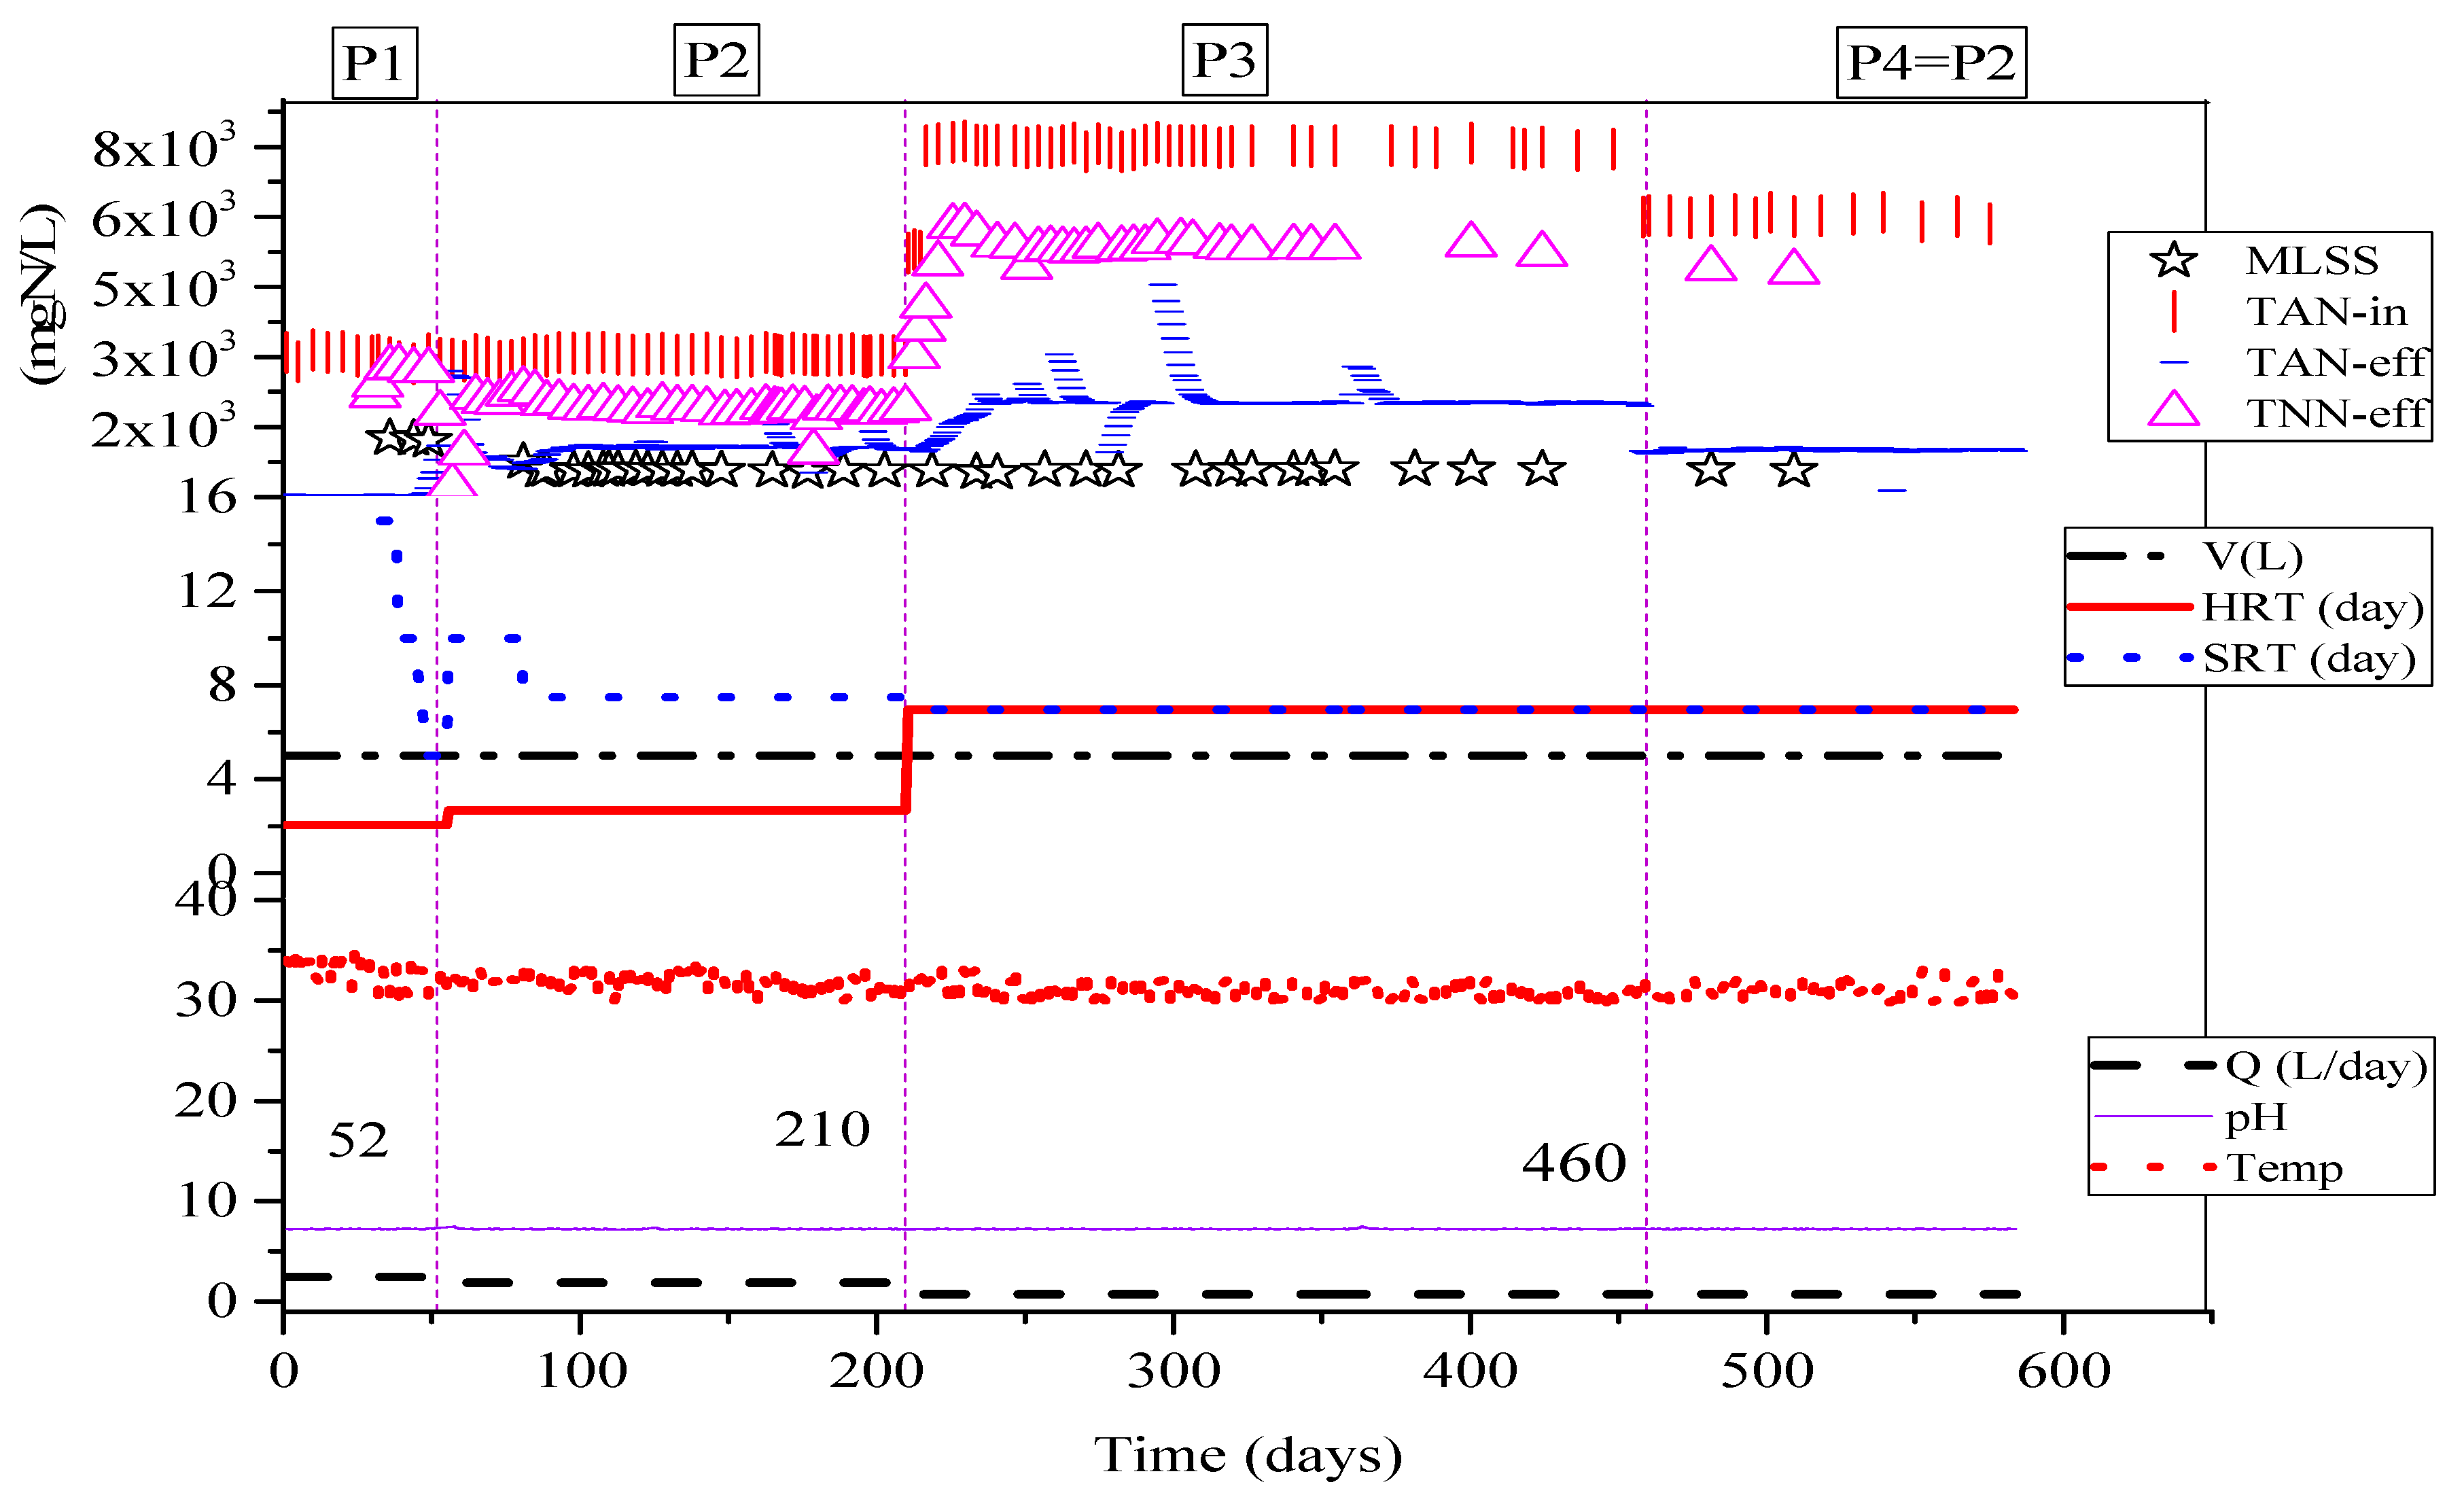
Two CSTRs with 5-liter volume were operated for 588 days by limiting the DO value to achieve nitrification [14]. The DO concentration for R(A) was ~1 mg/L and R(B) was ~1.5 mg/L. Other parameters such as temperature and pH were kept constant throughout the process. R(A) was operated in 8 phases while R(B) in 4 phases and ammonium removal efficiency was different in each phase as shown in Table 1 and Table 2. In preliminary days, reactors were run as cells recycled and directly turned into the chemostat, and they were kept in stable conditions for a long time as depicted in Figure 1 and Figure 2.
2.3. Substrate Shock for Interruption of Stability
For verifying the stability of CSTRs in various phases, a certain concentration of ammonium was added and removed from CSTRs with the same operating conditions (shown in Table 3). The precise quantity of ammonium bicarbonate (NH4HCO3) (in powder form) was injected to see the inhibition of AOB at many substrate shock concentrations. The aeration and stirring of CSTRs were stopped for 15 min to remove the supernatant from the CSTRs and the same amount of non-ammonical water with the mineral medium was added to decrease the concentration of CSTR. In this way, the self-inhibition and stability of the reactor were investigated at decreased ammonium concentrations (Table 3).
2.4. Batch Experiment at the Adapted Ammonium Concentration
The stock solution of total ammonium nitrogen (TAN) and the mineral medium was ready, and cells were collected during phase 5 from R(A) and phase 2 from R(B), respectively. Cells were re-suspended in a 300 mL Biological Oxygen Demand (BOD) bottle with the self-stirring probe, and oxygen uptake rate (OUR) was measured within 30 s interval. The batch test was replicated in the same way to measure the initial TAN oxidation rate. The oxygen uptake rate was almost proportional to the TAN removal rate, of which the ratio taken from four sample measurements was ~3.9. This value was a little higher than the theoretical value (3.4), indicating that some experimental error had occurred [14]. DO consumption by endogenous respiration was also taking place, accounting for approximately 3% of the total.
2.5. MLSS Quantification
We took 50 mL of cell suspension from the steady-state operating reactor and filter in the glass microfiber filter. The weight of the filter was measured before the filtration and after drying out in the oven for 2 h at 120 °C. The difference in weight was measured in mg/L [15].
2.6. Sampling and Analysis
The TAN influent and effluent concentration, nitrate, and nitrite concentration were measured by the standard method [16]. The SOUR, free ammonia nitrogen (FAN), and free nitrous acid (FNA) concentration were assessed using the following Equations [4].
MLSS data was determined from CSTR operation.
2.7. Kinetic Study
Many researchers have discussed the self-inhibition of cell growth [4,17,18,19,20]. In this study the Andrews model was used to fit in a batch reaction and the Monod model was fitted in CSTR’s operation (Figure 3 and Figure 4) and is discussed in the results and discussion section.
Or
In a continuously operated reactor if there is no inhibition then Equation (8) can be written as:
3. Results and Discussion
3.1. AOB Response in a Batch Reaction
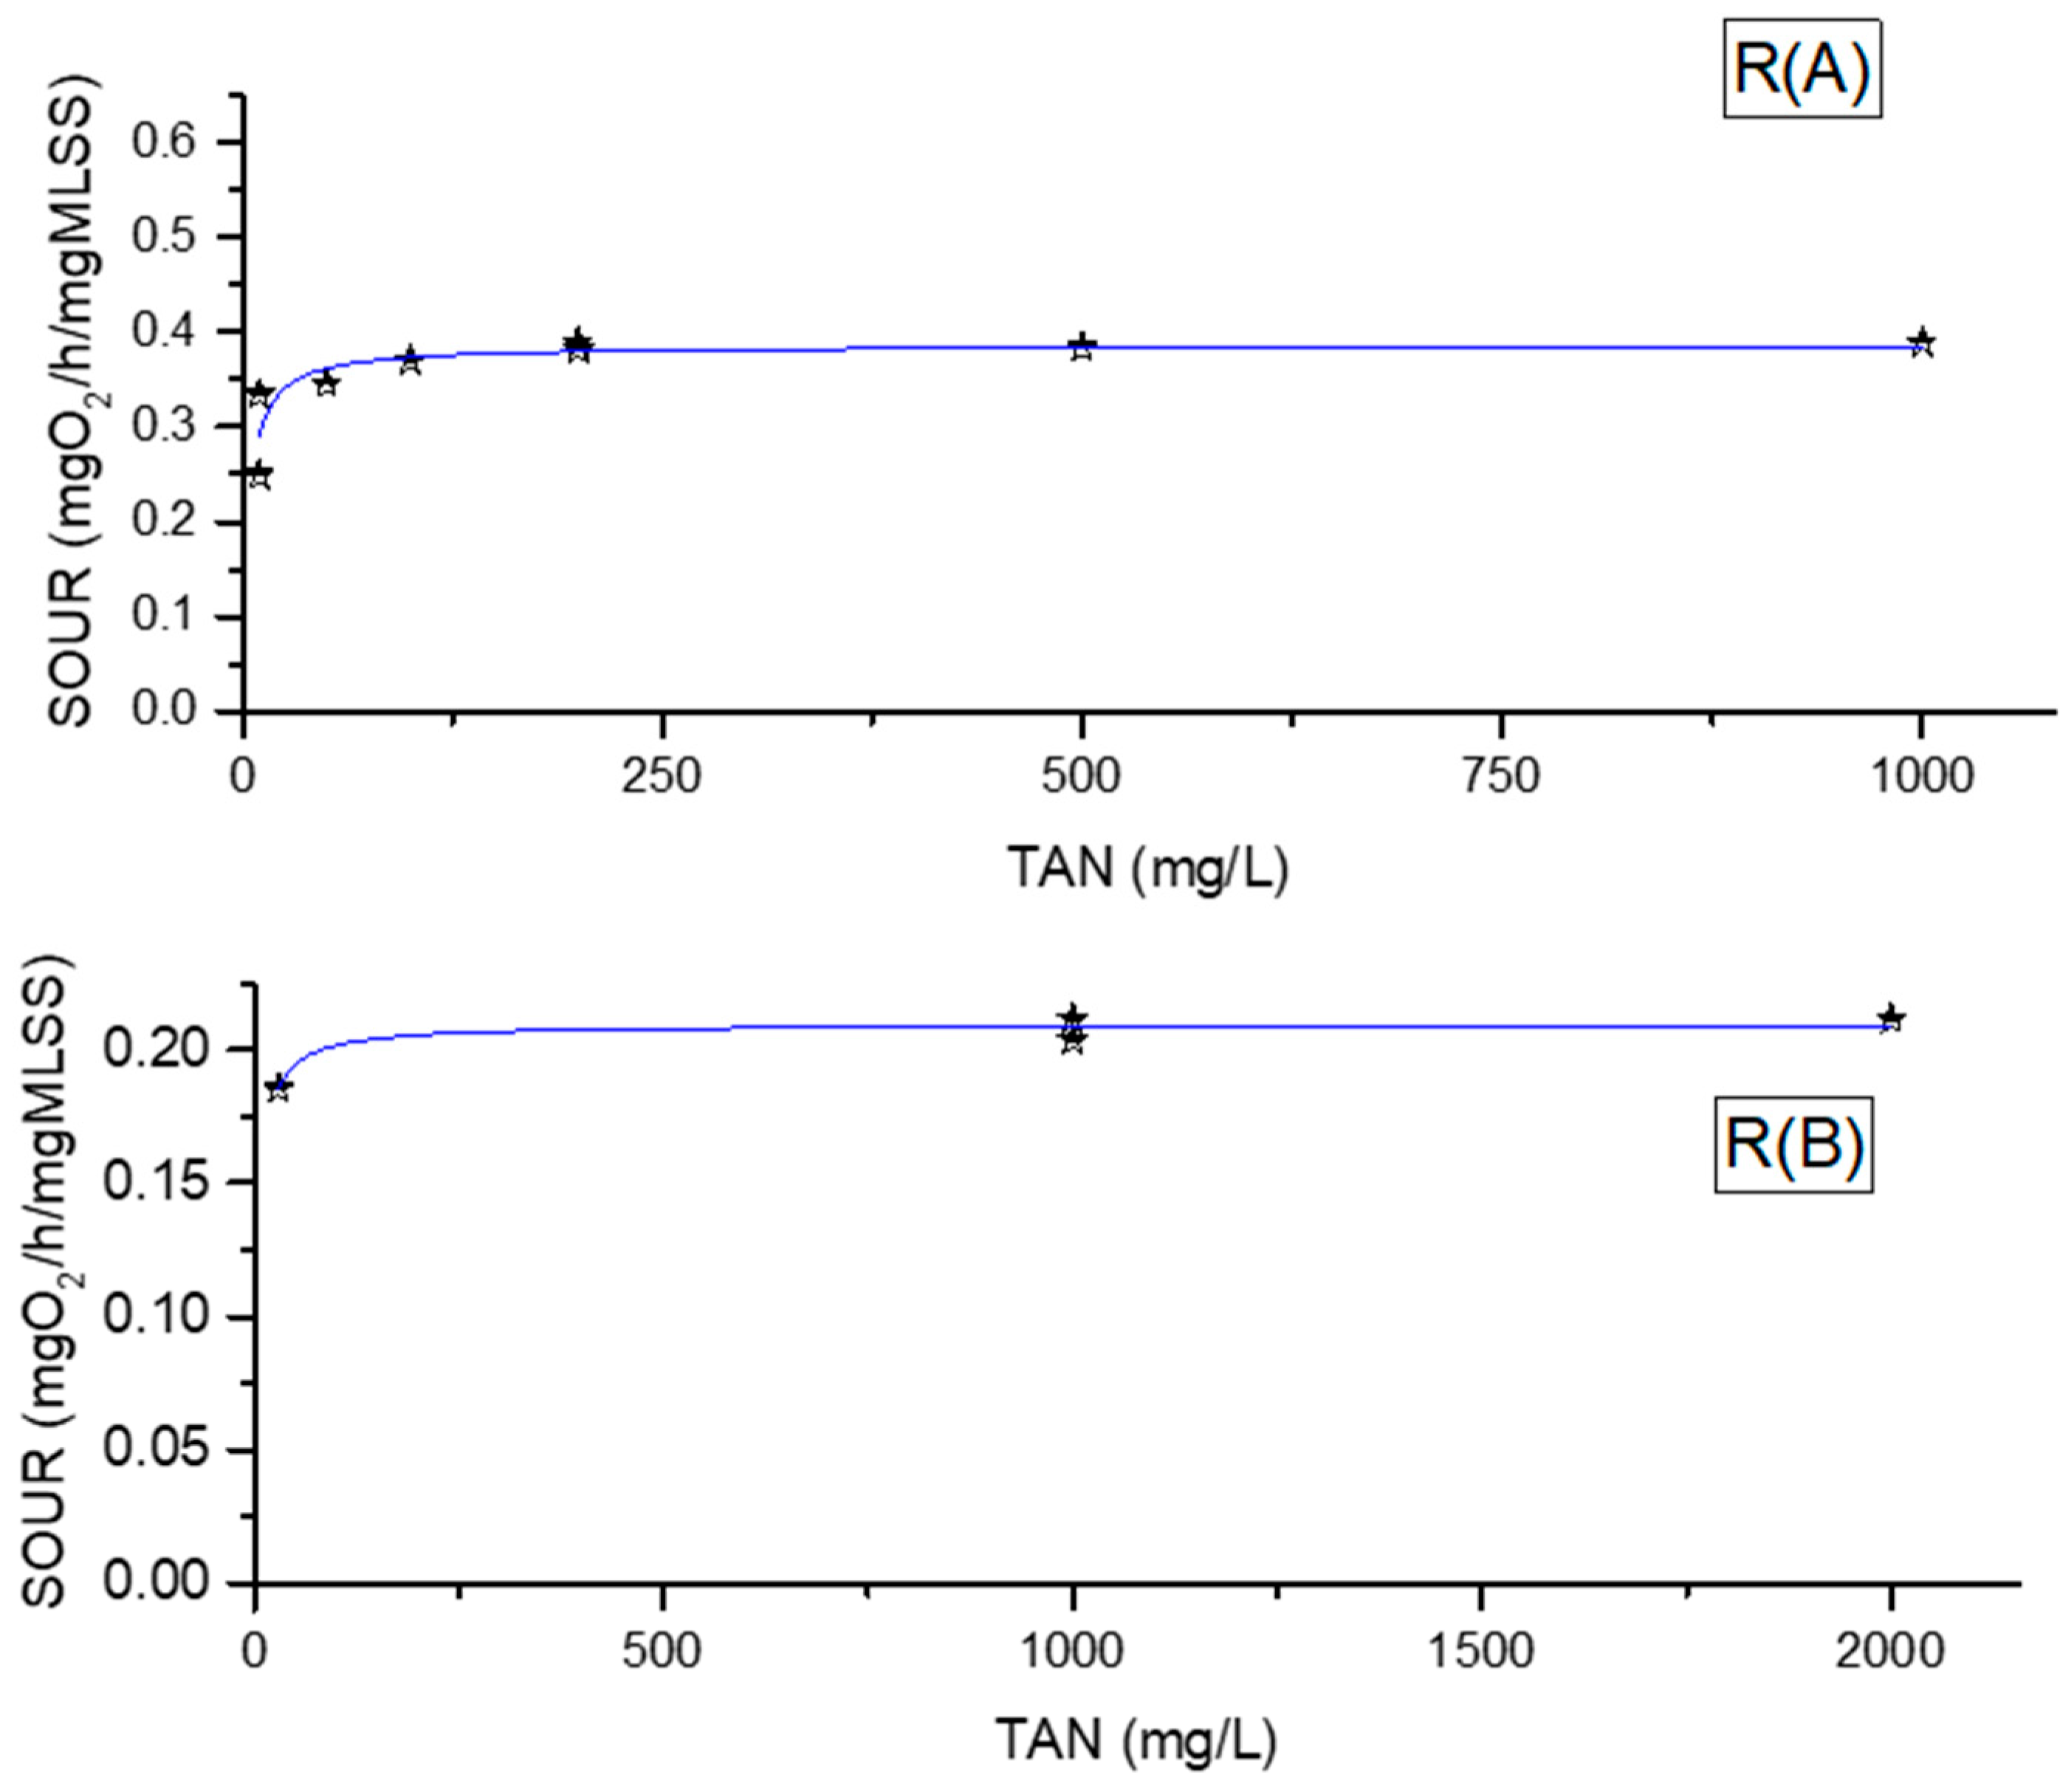
The mixed culture of AOB cells was extracted from the two CSTRs; the reactors were operated at ~200 mgTAN/L and ~1000 mgTAN/L of environmental concentration in steady-state. The SOURmax value was observed to be less than the operating environmental concentrations, i.e., ~0.6 (mgDO/h/mgMLSS) and ~0.2 (mgDO/h/mgMLSS) for R(B). The value of R(B) was 33.3% of R(A) value, because of operational pH disparity between R(A) and R(B) (Figure 3). Ks values were very different from each other; at higher pH value Ks decreases and AOB performs more efficiently [5,6,21,22]; at pH 8 in the operated reactor the Ks value was 7.28 mgTAN/L and it was 165.4 mgTAN/L of pH 7.2 operating reactors. It is obvious that the AOB took up substrate faster at elevated pH [22]. As in other papers [6,22,23], inhibition (KI) was detected in the cells extracted from both reactors (Figure 3).
3.2. AOB Response in CSTR Operation
While the CSTR is in stable steady-state conditions, the environmental substrate concentration acts as an important element to control the reactor. To ensure the self-inhibition performance in continuous operation, we shifted the influent and effluent (mgTAN/L) concentration of the reactor (Table 2). R(A)-adapted concentration was 200 mgTAN/L and environmental concentration was changed 8 times (~20.5, 14.9, 54.7, 109, 202, 508, 1015 and 205 mgTAN/L) (Table 3, Figure 1) and concentration of R(B) was altered from 1000 mgTAN/L to several concentrations (~35, 1089, 2078 and 1005.8 mgTAN/L) (Table 2 and Figure 2). At elevated concentration as an alternative of self-inhibition, AOB change their steady-state from state A to state B; due to some experimental error the observed was disturbed. Our experimental results show that AOB adapts at higher concentrations and the kinetics of AOB follow the Monod reaction in CSTR (Figure 4). In [24,25] the performance of SBR was reduced from 87.5% to 29.1%, and environmental TAN concentration has been boosted from 25 mgTAN/L to 200 mgTAN/L (TAN values were projected from graphs), even though the TAN concentration was altered by the elevation of the chemical oxygen demand (COD) value. But SBR was stable at around 20 days. Assuming that at 25 mgTAN/L environmental concentration Ks are equal to or less than 25 mgTAN/L and reactors are in operation, then q values always shifts to the values. In [26] SBR was operated, the influent ammonium concentration was raised stepwise from 150 to 750 mgTAN/L and effluent concentration was raised from 1 to 170 mgTAN (values were estimated from graphs). In the first step, the environmental concentration of SBR was 1 mgTAN/L and it was retained for around 75 days. In the second step, the feed concentration in this study was enhanced by about 50% from the original concentration, but the SBR was in stable and steady-state operation. Also, the environmental concentration was increased up to 175 mgTAN/L in step 8, the MLSS concentration from day 56 to 150 was similar even though influent concentration and effluent concentrations were different, but ∆S was almost similar. If we consider the Ks values less than or equal to influent concentration, then reactors should inhibit the substrate utilization rate and affect the MLSS concentration, but instead of AOB inhibition the reactor adapted to a new steady state.
3.3. AOB Response to Substrate Shocks
The steady-state operation of CSTRs was perturbed by inserting the ammonium concertation immediately into the CSTRs (Table 3). On day 158 of the operation, 165 mgTAN/L of ammonium was combined in R(A) to disrupt the stability of CSTR without shifting HRT, SRT, temperature, pH, and influent TAN concentration (Figure 1). HRT of the reactor was 0.7716 days. On 158 days of operation, by inserting the extra ammonium concentration the reactor concentration was extended to 365 mgTAN/L. According to the batch-test results, q value should be less than value and CSTRs have to enter into self-inhibition conditions (Figure 3), which previously has been stated [9,10,12,27]. As a substitute for AOB self-inhibition the CSTR recovered back to the original environmental conditions within the range of three days with no modification in any operating conditions (Figure 1). On day 169, the agitator and aeration of the CSTR were stopped for 15 min to settle the cells in the base of CSTR, then 2.5 L supernatant from the reactor was removed and 2.5 L volume of non-ammonical water was supplemented to reduce the environmental concentration up to 50% of the original concentration (Table 3). The aeration and stirring were re-started to look at the performance of AOB with a 50% lower concentration, as a substitute for modification of specific substrate utilization, and AOB attained the same substrate utilization position. Furthermore, on 189th day 460 mgTAN/L of TAN was inserted in the CSTR and the concentration was 2.5 times higher than the environmental concentration but AOB recovered back to its original position. The same results were acquired by [5].
On the 199th day, raid R(A) was transformed into batch feed operation. The HRT was shifted from 0.7716 days to 3.47 days and the ammonium loading rate (ALR) was controlled by adjusting the influent concentration. The influent concentration was shifted from 1000 mgTAN/L to 4500 mgTAN/L. However, in the feed batch control strategy, stability of the reactor has not existed, and the environmental concentration has risen from 200 mgTAN/L to 1050 mgTAN/L within 4 days of operation [9,10]. The outcomes indicate that the stable steady-state of CSTRs was disturbed in batch reaction because the environmental ammonium concentration was accumulated as a substitute of enters into the effluent. For the revival in steady-state operation, the reactor was converted into the same operating situation and this was regained within 10 days of operation.
On day 217 of operation, R(A) transformed into a chemostat state condition without modifying the ALR. The influent feed concentration was changed from 1000 to 4500 mgTAN/L. A few days later the reactors attained new steady-state conditions that were equivalent to the 1000 mgTAN/L and AOB was steady. On the day of 246 operation 500 mgTAN. On day 279 operation 1000 mgTAN/L and on day 409, 199 mgTAN/L was added and R(B) recovered back to its original steady state without intruding the operational parameters and also R(B) operated in 8 phases by shifting the influent and effluent concentrations and specific substrate utilization rate was calculated and compared with the batch reaction (Figure 3 and Figure 4)
On the other hand, R(B) operated at 1000 mgTAN/L environmental concentration; 50% (563 mgTAN/L) of that concentration was added on day 167 of the operation to interrupt the stability of the system, and as a substitute for AOB self-inhibition the reactor recovered back to its original position within 8 days of operation and reactor operational parameters were kept same as in the stable steady-state operation. On day 189 of stable operation 50% of environmental concentration was lowered and the reactor regained within 9 days the same stable concentration (Figure 2). On day 211, the influent flow of R(B) was shifted from 1.3 to 0.5 mL/min, influent feed concentration was altered from 3000 mgTAN/L to 5300 mgTAN/L, and ALR stayed constant. On day 217 the influent feed concentration was shifted from 5300 to 7500 mgTAN/L, and due to the change of influent feed CSTR attained new steady-state which was equal to 2000 mgTAN/L. On day 297, 2500 mgTAN/L of TAN was added, and the rector regained its original position (Figure 3); in this way TAN concentrations were added many times in both reactors which are represented in Table 3. However, [27] supports this part of our study. Reference [27] reported that the inhibition of biological reaction due to substrate shocks was fully reversible and performance indicators reverted to steady-state conditions soon after the end of shocks.
3.4. Assessment of Self-Inhibition in Batch and CSTR Operation
The values of the kinetic parameters (, Ks, KI, and q) were assessed with a batch reaction at several initial TAN concentrations and the reactor’s environmental concentrations were 200 mgTAN/L and 1000 mgTAN/L. Previously, in [8,9,10,12,28,29] when the substrate surpasses the critical substrate concentration AOB inhibits the substrate uptake. But in this experimental research once the stable steady-state was attained then there was no substrate inhibition in continuous operation. The self-inhibition was seen in a batch reaction. In CSTR operation when the concentration surpasses Sc, the q value goes in the direction of a new environmental concentration, which is called steady-state B.
3.5. Influence of Free Nitrous Acid (FNA) Concentration on Yield Coefficient (Y)
For operation of the reactor in steady-state, the stoichiometric factors perform an important role in the batch process; the stoichiometric parameters stay the same. Yield coefficient (Y) was evaluated from daily profile data (when the CSTR was in chemostat mode operation), shown in Table 3. FNA concentration was estimated using Equation (2). FNA concentration in phase-2 was 279 mgFNA/L and Yobs was 0.169 in phase 3, the FNA concentration rose to 834 mgFNA/L and Yobs value was reduced to 0.162. In phases 4, 6, 7, and 8 ∆S was nearly similar in R(A) and FNA concentration was nearly similar throughout (967, 985, 993, and 984 mgFNA/L). Several researchers have reported that NOB is more sensitive to FNA or FA than AOB [25,30,31]. Phase 1 Yobs value was 4% greater than phase 3 and 13% greater than the other four phases. As in [32], the FNA-based sludge reduction does not change the performance of the nitrification process. In this study, the sludge was not treated with FNA but the sludge concentration was raised at higher FNA concentration because ∆S was higher in phases 4, 6, 7, and 8. For preventing this variation, we estimated Yobs value and it drops with rising FNA concentration from phases 2 and 3 to phases 4, 6, 7 and 8. The performance of the reactor was not altered in phases 4, 6, 7 and 8 at higher FNA. Moreover, the impact of FNA, TAN on true yield (Ytrue) coefficient the decay coefficient (b) and Ytrue should be determined experimentally in each phase. Even though in R(B), the ∆S was comparable in phases 3 and 4, Yobs was not altered and was similar in both phases (Table 2). The bacterial community was analyzed for the two CSTRs on day 275 of the operation. RA comprises 58% of AOB and RB comprises 49.2% of AOB. The 42% in RA and 50.8% in RB were heterotrophs, that were grown on the soluble microbial products (SMP) extracted from organisms and nitrifiers [11,33,34]. RA contains 15.2% higher AOB than RB, the reason may be that RB has lower SRT it may contain higher SMP. The second reason is RA has 30% higher Yobs (Table 2) and it should contain a higher percent of AOB.
3.6. Reserves of Ammonium, Self-Inhibition, Ammonium Shocks, and Stability
The intracellular ammonium concentration of Nitrosomonas europaea and a few other ammonia oxidizers in growth was very high, ~1 M (~14,000 mgTAN/L-cytoplasm) [34]. This concentration was much higher than commonly believed, and the intracellular ammonium concentrations in our sludges were also very high, nearly ~0.45 µM (~6300 mgTAN/L). If we count AOB only (as other organisms do not seem to accumulate such a large amount of ammonium), this basal concentration is comparable to that of [34], in which cells were likewise grown under a copious environment at 10 mM of ammonium chloride (NH4Cl). Recall that we mentioned in the introduction that AOB store much higher concentrations inside the cells (14,000 mgTAN/L) than the substrate inhibition concentration, and the inhibitor concentration should be higher than 14,000 mgTAN/L or less than 14,000 mgTAN/L because in both cases AOB inhibits or back diffusion of ammonium. In the view of substrate fluctuation in real application, the stability of PN-Anamamox was analyzed in a lab-scale internal-loop airlift bioparticles (ILAB) reactor, the substrate concentration shock has been elevated at 439.9 mgTAN/L, 489.49 mgTAN/L, 619.09 mgTAN/L, and 629 mgTAN/L, the study has demonstrated that shock was totally reversible and performance indicators returned to steady-state level soon after the end of the shocks. However, the author suggests that the concentration of shocks affects the performance of the reactors [27]. Reference [27] supported our findings from the substrate shocks point of view. In this study various shock concentrations were added in CSTR to test the AOB stability (Table 3), instead of any inhibition reactor recovering to its original steady-state (Figure 1 and Figure 2). Also, the environmental ammonium concentration was altered by altering the influent feed concentration; AOB was not inhibited once the maximum specific substrate utilization rate achieved only steady-state, and the value was shifted (Figure 4). However, the number of the cells or cell synthesis and decay coefficient may be affected in continuous operation [11] but the performance cannot be affected [30].
4. Conclusions
The stability of two continuous stirred tank reactors (CSTRs) was analyzed experimentally. Total ammonium nitrogen (TAN) concentrations were directly added (in powder form) in the course of the steady-state and stable operation for the disruption of the stability of the CSTRs; the CSTR stability was not interrupted and it recovered its previous steady-state concentration within a few days of operation. Environmental ammonium concentration was changed 8 times in R(A) and 4 times in R(B), and the operational conditions were the same during all phases. The specific oxygen uptake rate (SOUR) was estimated using daily profile data and the batch test was performed at an acclimated concentration (~200 mgTAN/L for R(A) and ~1000 mgTAN/L for R(B)). The self-inhibition model was fitted in batch test data and the Monod model was fitted in the SOUR estimated from daily profile data. It was observed that once AOB acclimated at any concentration then SOUR shifts towards the maximum specific oxygen uptake rate (SOURmax) in continuous operation. The self-inhibition model was fitted in the batch experiment and self-inhibition behavior was observed in the batch test because in the batch test the stoichiometric parameters remained constant. However, in continuous operation the stoichiometric parameters changed with the change of environmental substrate concentration.
Author Contributions
H.A.K. and W.B. designed the experiment, carried out the experiment, analyzed the data, wrote the main manuscript test, and reviewed the manuscript. All authors have read and agree to the published version of the manuscript.
Funding
This research received no external funding.
Acknowledgments
This research was supported by Basic Science Research Program through the National Research Foundation of South Korea (NRF) funded by the Ministry of Education (NRF-2019R1D1A1A02046973). Hareef Ahmed Keerio is grateful to the Higher Education Commission (HEC) of Pakistan for granting Ph.D. Scholarship.
Conflicts of Interest
The authors declare no conflict of interest.
Abbreviations
| q = SOUR | The specific oxygen uptake rate |
| = SOURmax | The maximum specific oxygen uptake rate |
| TANin = TANeff | The influent and effluent concentration of total ammonium nitrogen (TAN) |
| ARR | Ammonium removal rate |
| SARR | The specific ammonium removal rate |
| DO | Dissolved oxygen |
| Ks | half-saturation coefficient |
| KI | Inhibition coefficient |
| AOB | Ammonium oxidizing bacteria |
| NOB | Nitrite oxidizing bacteria |
| Sc | Critical substrate concentration |
| FA | Free ammonia |
| FNA | Free nitrous acid |
| HRT | Hydraulic retention time |
| SRT | Sludge retention time |
| S | Substrate concentration |
| Yobs | Observed yield coefficient |
| Q | Flow rate |
| TNN | Total nitrite nitrogen |
| WWTP | Wastewater treatment plant |
| R(A) | Reactor A |
| R(B) | Reactor B |
| CSTR | Continuous stirred tank reactor |
| MLSS | Mixed liquor suspended solids |
| SBR | Sequencing batch reactor |
| P1 to P8 | Phases |
| mg/L | milli grams/liter |
| ILAB | Internal-loop airlift bioparticles |
References
- Jiménez, E.; Giménez, J.; Seco, A.; Ferrer, J.; Serralta, J. Effect of pH, substrate and free nitrous acid concentrations on ammonium oxidation rate. Bioresour. Technol. 2012, 124, 478–484. [Google Scholar] [CrossRef] [PubMed]
- Kleiner, D. Bacterial ammonium transport. FEMS Microbiol. Lett. 1985, 32, 87–100. [Google Scholar] [CrossRef]
- Andrade, S.L.; Einsle, O. The Amt/Mep/Rh family of ammonium transport proteins. Mol. Membr. Biol. 2007, 24, 357–365. [Google Scholar] [CrossRef]
- Briggs, G.E.; Haldane, J.B.S. A note on the kinetics of enzyme action. Biochem. J. 1925, 19, 338. [Google Scholar] [CrossRef] [PubMed] [Green Version]
- Khan, H.; Bae, W. Optimized operational strategies based on maximum nitritation, stability, and nitrite accumulation potential in a continuous partial nitritation reactor. Process Biochem. 2016, 51, 1058–1068. [Google Scholar] [CrossRef]
- Park, S.; Bae, W. Modeling kinetics of ammonium oxidation and nitrite oxidation under simultaneous inhibition by free ammonia and free nitrous acid. Process Biochem. 2009, 44, 631–640. [Google Scholar] [CrossRef]
- Andrews, J.F. A mathematical model for the continuous culture of microorganisms utilizing inhibitory substrates. Biotechnol. Bioeng. 1968, 10, 707–723. [Google Scholar] [CrossRef]
- Chi, C.; Howell, J.; Pawlowsky, U. The regions of multiple stable steady states of a biological reactor with wall growth, utilising inhibitory substrates. Chem. Eng. Sci. 1974, 29, 207–211. [Google Scholar] [CrossRef]
- DiBiasio, D.; Lim, H.; Weigand, W. An experimental investigation of stability and multiplicity of steady states in a biological reactor. AIChE J. 1981, 27, 284–292. [Google Scholar] [CrossRef]
- Olivieri, G.; Russo, M.E.; Di Donato, A.; Marzocchella, A.; Salatino, P. Unstable steady state operations of substrate inhibited cultures by dissolved oxygen control. J. Biotechnol. 2011, 156, 302–308. [Google Scholar] [CrossRef]
- Rittmann, B.E.; McCarty, P.L. Environmental Biotechnology: Principles and Applications; Tata McGraw-Hill Education: New York, NY, USA, 2012. [Google Scholar]
- Sheintuch, M.; Tartakovsky, B.; Narkis, N.; Rebhun, M. Substrate inhibition and multiple states in a continuous nitrification process. Water Res. 1995, 29, 953–963. [Google Scholar] [CrossRef]
- Bock, E.; Schmidt, I.; Stüven, R.; Zart, D. Nitrogen loss caused by denitrifying Nitrosomonas cells using ammonium or hydrogen as electron donors and nitrite as electron acceptor. Arch. Microbiol. 1995, 163, 16–20. [Google Scholar] [CrossRef]
- Keerio, H.A.; Bae, W.; Park, J.; Kim, M. Substrate uptake, loss, and reserve in ammonia-oxidizing bacteria (AOB) under different substrate availabilities. Process Biochem. 2019. [Google Scholar] [CrossRef]
- Eaton, A.; Clesceri, L.; Greenberg, A.; Federation, W. Standard Methods for the Examination of Water and Waste; Ignatius Press: San Francisco, CA, USA, 1995. [Google Scholar]
- Federation, W.E.; American Public Health Association. Standard Methods for the Examination of Water and Wastewater; American Public Health Association (APHA): Washington, DC, USA, 2005. [Google Scholar]
- Anthonisen, A.; Loehr, R.; Prakasam, T.; Srinath, E. Inhibition of nitrification by ammonia and nitrous acid. J. Water Pollut. Control Fed. 1976, 48, 835–852. [Google Scholar]
- Yano, T.; Koga, S. Dynamic behavior of the chemostat subject to substrate inhibition. Biotechnol. Bioeng. 1969, 11, 139–153. [Google Scholar] [CrossRef]
- Luong, J. Generalization of Monod kinetics for analysis of growth data with substrate inhibition. Biotechnol. Bioeng. 1987, 29, 242–248. [Google Scholar] [CrossRef]
- Suzuki, I.; Dular, U.; Kwok, S. Ammonia or ammonium ion as substrate for oxidation by Nitrosomonas europaea cells and extracts. J. Bacteriol. 1974, 120, 556–558. [Google Scholar] [CrossRef] [Green Version]
- Van Hulle, S.W.; Volcke, E.I.; Teruel, J.L.; Donckels, B.; van Loosdrecht, M.C.; Vanrolleghem, P.A. Influence of temperature and pH on the kinetics of the Sharon nitritation process. J. Chem. Technol. Biotechnol. Int. Res. Process Environ. Clean Technol. 2007, 82, 471–480. [Google Scholar] [CrossRef]
- Park, S.; Bae, W.; Chung, J.; Baek, S.-C. Empirical model of the pH dependence of the maximum specific nitrification rate. Process Biochem. 2007, 42, 1671–1676. [Google Scholar] [CrossRef]
- Park, S.; Bae, W.; Rittmann, B.E. Operational boundaries for nitrite accumulation in nitrification based on minimum/maximum substrate concentrations that include effects of oxygen limitation, pH, and free ammonia and free nitrous acid inhibition. Environ. Sci. Technol. 2009, 44, 335–342. [Google Scholar] [CrossRef]
- Wei, D.; Du, B.; Xue, X.; Dai, P.; Zhang, J. Analysis of factors affecting the performance of partial nitrification in a sequencing batch reactor. Appl. Microbiol. Biotechnol. 2014, 98, 1863–1870. [Google Scholar] [CrossRef] [PubMed]
- Wei, D.; Xue, X.; Yan, L.; Sun, M.; Zhang, G.; Shi, L.; Du, B. Effect of influent ammonium concentration on the shift of full nitritation to partial nitrification in a sequencing batch reactor at ambient temperature. Chem. Eng. J. 2014, 235, 19–26. [Google Scholar] [CrossRef]
- Xiu, Z.L.; Zeng, A.P.; Deckwer, W.D. Multiplicity and stability analysis of microorganisms in continuous culture: Effects of metabolic overflow and growth inhibition. Biotechnol. Bioeng. 1998, 57, 251–261. [Google Scholar] [CrossRef]
- Abbas, G.; Zhang, M.; Li, W.; Zhang, J.; Zheng, P. Performance stability of a lab-scale internal-loop airlift bio-particle reactor under substrate concentration shocks for simultaneous partial nitrification and anaerobic ammonia oxidation. Sep. Purif. Technol. 2015, 141, 322–330. [Google Scholar] [CrossRef]
- Lwoff, A.; Ullmann, A. Selected Papers in Molecular Biology by Jacques Monod; Academic Press: New York, NY, USA, 1978. [Google Scholar]
- Yang, L.; Alleman, J.E. Investigation of Batchwise Nitrite Build-Up by an Enriched Nitrification Culture. Water Sci. Technol. 1992, 26, 997–1005. [Google Scholar] [CrossRef]
- Wang, Q.; Ye, L.; Jiang, G.; Yuan, Z. A free nitrous acid (FNA)-based technology for reducing sludge production. Water Res. 2013, 47, 3663–3672. [Google Scholar] [CrossRef]
- Wang, Q.; Ye, L.; Jiang, G.; Hu, S.; Yuan, Z. Side-stream sludge treatment using free nitrous acid selectively eliminates nitrite oxidizing bacteria and achieves the nitrite pathway. Water Res. 2014, 55, 245–255. [Google Scholar] [CrossRef]
- Manem, J.; Rittmann, B. Scaling prodedure for biofilm processes. Water Sci. Technol. 1990, 22, 329–346. [Google Scholar] [CrossRef]
- Rittmann, B.; Bae, W.; Namkung, E.; Lu, C.-J. A critical evaluation of microbial product formation in biological processes. Water Sci. Technol. 1987, 19, 517–528. [Google Scholar] [CrossRef]
- Schmidt, I.; Look, C.; Bock, E.; Jetten, M.S. Ammonium and hydroxylamine uptake and accumulation in Nitrosomonas. Microbiology 2004, 150, 1405–1412. [Google Scholar] [CrossRef] [Green Version]
Figure 1.
Daily performance of continuous stirred tank reactor (CSTR) (A) from phase 1 to phase 8.

Figure 2.
Daily performance of CSTR (B) from phase 1 to phase 4.

Figure 3.
R(A)-1 and R(B)-1 inhibition model [7] was fitted in the batch experiment and R(A) and R(B).
Figure 3.
R(A)-1 and R(B)-1 inhibition model [7] was fitted in the batch experiment and R(A) and R(B).

Figure 4.
Specific oxygen uptake rate (SOUR) estimated from CSTR daily profile data and Monod model Equation (9) was fitted.
Figure 4.
Specific oxygen uptake rate (SOUR) estimated from CSTR daily profile data and Monod model Equation (9) was fitted.


Table 1.
Mineral medium concentration in each phase.
| Phases | MgSO4·7H2O (g) | FeSO4·7H2O (g) | CaCl2 (g) | KCl (g) | MnSO4·H2O (g) | KH2PO4 (g) |
|---|---|---|---|---|---|---|
| 1-R(A) | 51 | 2 | 4.5 | 6.7 | 4.9 | 75 |
| 2 | 51 | 2 | 4.5 | 6.7 | 4.9 | 75 |
| 3 | 153 | 6 | 13.5 | 20.1 | 14.7 | 225 |
| 4 | 175 | 7 | 15.8 | 22.8 | 17.5 | 262 |
| 5 | 51 | 2 | 4.5 | 6.7 | 4.9 | 75 |
| 6 | 204 | 8 | 18 | 26.8 | 29.4 | 300 |
| 7 | 229 | 9 | 20.3 | 30.2 | 22.1 | 338 |
| 8 | 175 | 7 | 15.8 | 22.8 | 17.5 | 262 |
| 1-R(B) | 153 | 6 | 13.5 | 20.1 | 14.7 | 225 |
| 2 | 153 | 6 | 13.5 | 20.1 | 14.7 | 225 |
| 3 | 382 | 15 | 33.7 | 50.2 | 36.8 | 563 |
| 4 | 305 | 12 | 27 | 40.2 | 29.4 | 450 |
Table 2.
Total ammonium nitrogen (TAN) influent and effluent, ∆S, HRT, SRT, MLSS, SOUR, and ARR efficiency in each phase. Yobs estimated from daily profile data when the reactor was in Chemostat mode.
Table 2.
Total ammonium nitrogen (TAN) influent and effluent, ∆S, HRT, SRT, MLSS, SOUR, and ARR efficiency in each phase. Yobs estimated from daily profile data when the reactor was in Chemostat mode.
| Phases | Reactor Type (CSTR) | TAN-in (mg-TAN/L) | TAN-eff (mg-TAN/L) | HRT (day) | SRT (day) | ∆S (mg-TAN/L) | MLSS (mg/L) | SARR | ARR (%) | Yobs |
|---|---|---|---|---|---|---|---|---|---|---|
| 1-A | Recycle | 1011.6 ± 36.3 | 20.50 ± 10.26 | 0.77 | 15–10 | 991.100 | 976.5 ± 33.2 | 1.29 | 98 | 0.169 |
| 2 | Chemostat | 1010.4 ± 9.00 | 14.90 ± 11.60 | 3.47 | 3.47 | 995.500 | 168.46 ± 6.0 | 1.75 | 99 | 0.162 |
| 3 | Chemostat | 3020 ± 11.00 | 54.74 ± 36.30 | 3.47 | 3.47 | 2965.26 | 482.2 ± 4.00 | 1.77 | 98 | 0.162 |
| 4 | Chemostat | 3559.8 ± 11.3 | 109.20 ± 21.8 | 3.47 | 3.47 | 3450.60 | 522.2 ± 15.0 | 1.85 | 97 | 0.151 |
| 5 | Recycle | 1022.7 ± 24.7 | 202.0 ± 8.700 | 0.77 | 3.50 | 820.700 | 526 ± 9.300 | 2.10 | 80 | |
| 6 | Chemostat | 4018 ± 13.00 | 508.30 ± 15.6 | 3.47 | 3.47 | 3509.70 | 512 ± 7.000 | 1.97 | 87 | 0.146 |
| 7 | Chemostat | 4557 ± 43.00 | 1015.0 ± 15.8 | 3.47 | 3.47 | 3542.00 | 517.5 ± 3.50 | 2.00 | 78 | 0.146 |
| 8 | Chemostat | 3713 ± 26.70 | 205.50 ± 20.6 | 3.47 | 3.47 | 3508.00 | 523 ± 10.90 | 1.97 | 94 | 0.149 |
| 1-B | Recycle | 3017 ± 99.00 | 34.70 ± 9.000 | 2.04 | 15–10 | 2982.30 | 1236 ± 25.2 | 1.10 | 99 | |
| 2 | Recycle | 3056 ± 33.70 | 1089.2 ± 71.8 | 2.67 | 7.50 | 1967.00 | 573.8 ± 14.0 | 1.30 | 64 | |
| 3 | Chemostat | 7503.7 ± 48.1 | 2078.1 ± 700 | 6.94 | 6.94 | 5425.00 | 579.2 ± 50.5 | 1.30 | 72 | 0.110 |
| 4 | Chemostat | 6303 ± 135.0 | 1005.8 ± 26.7 | 6.94 | 6.94 | 5297.20 | 565 ± 11.50 | 1.28 | 84 | 0.110 |
Table 3.
Substrate shocks and recovery at various steady-state concentrations.
| Reactor | Operation Mode | Substrate Shock (day) | Concentration of Shock (mg/L) | Steady-State Concentration (mg/L) |
|---|---|---|---|---|
| R(A) | Cell Recycle | 158 | ~+165.0 | ~200.0 |
| R(A) | Cell Recycle | 169 | ~−106.0 | ~200.0 |
| R(A) | Cell Recycle | 189 | ~+460.0 | ~200.0 |
| R(A) | Chemostat | 246 | ~+580.0 | ~1000 |
| R(A) | Chemostat | 262 | ~−470.0 | ~1000 |
| R(A) | Chemostat | 279 | ~+1000 | ~1000 |
| R(A) | Chemostat | 409 | ~+199.0 | ~100.0 |
| R(B) | Cell Recycle | 167 | ~+563.0 | ~1000 |
| R(B) | Cell Recycle | 189 | ~−478.0 | ~1000 |
| R(B) | Cell recycle | 197 | ~+1037 | ~1000 |
| R(B) | Chemostat | 251 | ~+420.0 | ~2000 |
| R(B) | Chemostat | 262 | ~+1058 | ~2000 |
| R(B) | Chemostat | 289 | ~−1040 | ~2000 |
| R(B) | Chemostat | 297 | ~+2550 | ~2000 |
(~−) = Substrate lowered from the steady-state concentration. (~+) = Substrate increased from the steady-state concentration.
© 2020 by the authors. Licensee MDPI, Basel, Switzerland. This article is an open access article distributed under the terms and conditions of the Creative Commons Attribution (CC BY) license (http://creativecommons.org/licenses/by/4.0/).
Share and Cite
MDPI and ACS Style
Keerio, H.A.; Bae, W. Experimental Investigation of Substrate Shock and Environmental Ammonium Concentration on the Stability of Ammonia-Oxidizing Bacteria (AOB). Water 2020, 12, 223. https://doi.org/10.3390/w12010223
AMA Style
Keerio HA, Bae W. Experimental Investigation of Substrate Shock and Environmental Ammonium Concentration on the Stability of Ammonia-Oxidizing Bacteria (AOB). Water. 2020; 12(1):223. https://doi.org/10.3390/w12010223
Chicago/Turabian StyleKeerio, Hareef Ahmed, and Wookeun Bae. 2020. "Experimental Investigation of Substrate Shock and Environmental Ammonium Concentration on the Stability of Ammonia-Oxidizing Bacteria (AOB)" Water 12, no. 1: 223. https://doi.org/10.3390/w12010223
Note that from the first issue of 2016, this journal uses article numbers instead of page numbers. See further details here.