3D Numerical Investigation of Forces and Flow Field around the Semi-Submersible Platform in An Internal Solitary Wave


State Key Laboratory of Coastal and Offshore Engineering, Dalian University of Technology, Dalian 116024, China
*
Author to whom correspondence should be addressed.
Water 2020, 12(1), 208; https://doi.org/10.3390/w12010208
Submission received: 12 December 2019
/
Revised: 7 January 2020
/
Accepted: 8 January 2020
/
Published: 11 January 2020
(This article belongs to the Section Hydraulics and Hydrodynamics)
Abstract
:Characteristics of hydrodynamic forces and flow fields around the semi-submersible platform induced by the internal solitary wave (ISW) propagation were investigated in a 3D numerical wave tank. Good agreements between numerical results and experimental data of forces and torque on the platform were achieved. The hydrodynamic loads increased and decreased with the increases in the ISW amplitude and fluid depth ratio, respectively. The pressure mainly contributed to the force on the platform. The horizontal forces on bracings were negligible. Almost all the vertical forces on the platform were derived from those on pontoons. The horizontal force and torque on the platform increased with the increases in the angle between the platform symmetrical axis and the ISW propagation direction. The platform subjected the maximum vertical force when the angle was 0°. There were obvious velocity reductions around the platform during the ISW propagation, as visible vortexes shedding around the platform could be observed. Complexities of the distributions of flow fields around the platforms located at the 30°- and 60°-direction were greater than those around the platforms located at the 0°- and 90°-direction. Flow fields around the same kind components of each platform located at different angles were similar.
1. Introduction
Internal waves can penetrate almost the entire ocean depth and generate large wave forces that can cause a marine engineering structure to move or twist as a whole [1]. According to the statistics of Roberts [2], the maximum vertical amplitude is 180 m. Internal solitary waves (ISWs) are typical representatives of internal waves because of their frequent activities. The balance between nonlinearity and frequency dispersion is responsible for the propagation of ISWs with a constant waveform and propagation velocity in oceans. As described in Song [3], the force order magnitude of the ISW acting on the submerged structure in the finite depth two-layer fluid is the same as that of the surface wave, and the ISW-induced maximum total horizontal force is roughly 1/3 of the surface wave force. Up to now, there have been many reports about the damage of marine platforms caused by the ISW propagation [4,5]. Consequently, the hydrodynamic loads induced by ISWs are assignable threats to the safe operation of a marine engineering structure [6]. The investigation on the interaction between the ISW and a marine engineering structure has important implication to the actual marine engineering operation.
The semi-submersible platform is often used to develop abundant deep-sea resources due to its excellent performance. As the semi-submersible platform is usually permanently moored to a particular sea area for operation, it is difficult to avoid navigation in the event of bad sea conditions. Therefore, it is necessary to investigate its hydrodynamic performance under various marine environmental conditions. Faltinsen [7] and Kvittem [8] have conducted studies of experiments and numerical simulations on the semi-submersible floating structure under wind, current and wave. The descriptions of the wave-structure interactions revealed by loads and flow fields are more common in the studies of surface waves [9,10,11,12]. However, the investigation of hydrodynamic loads and flow fields around the marine platform in the ISW condition is scarce.
In previous studies, most researchers have focused on calculating the forces on cylindrical structures induced by the ISW [13,14,15,16,17,18]. The practical marine engineering structures are generally composed of complex cylindrical structures. Methods such as the Morison empirical formula for calculating forces on a cylinder caused by the ISW, can no longer meet the demand of calculating the hydrodynamic loads on a marine platform. Chen [19,20] experimentally studied the hydrodynamic loads on a multi-column floating platform in ISW. Based on the experimental data, they obtained the empirical formulas about Cm and Cd for calculating the forces on the platform components. Wang [21] used a numerical simulation and experiment to study the ISW load acting on the semi-submersible platform. They found that the forces acting on a semi-submersible platform induced by the ISW propagation are mainly composed of the pressure, viscous force, and negligible frictional force.
Generally, the long-term existence of vortices will induce fatigue and fracture damage to the platform. The investigation of the characteristics of flow fields including velocity and vorticity fields around the platform that are induced by the ISW propagation, is quite rare. Based on the practical significance of the problem and the discussions mentioned above, the hydrodynamic issues include hydrodynamic forces and flow fields around a semi-submersible platform in the ISW condition, which need to be further investigated.
In this manuscript, the numerical model is briefly introduced in Section 2. In Section 3, the investigation on characteristics of the hydrodynamic loads and flow field around the semi-submersible platform under different ISW amplitudes and fluid depth ratios are conducted. Considering the complexity of the ISW field around the platform in the actual marine environment, the hydrodynamic forces and flow field around the platform located at different angles are investigated in detail in Section 4. Finally, conclusions are given in Section 5.
2. Numerical Model
2.1. Governing Equations
The ISW flow field is governed by the mass continuity equation and the Reynolds Average Navier-Stokes (RANS) equation. These equations can be written as follows:
where is the time; is the velocity
vector in Cartesian coordinate; is the kinetic viscosity; is the nonlinear Reynolds stress tensor; is the density; is the excess pressure; is the gravitational vector; and are the Cartesian coordinates.
In naturally stratified oceans and lakes, fluids with different densities are miscible. In this study, it is considered that the change in fluid density is caused by the advection-diffusion process. The corresponding equation is as follows:
where is the molecular diffusion coefficient; is the turbulent Schmidt number, where is the eddy viscosity, and is the eddy diffusivity.
In order to close the system of mean flow equation, a nonlinear model is employed [22]. The advection diffusion equation for is given as:
takes the following form:
where
The closure coefficients in the expressions take the following values = 0.9, = 1.25. The is proposed by Brown [23], where , is the mean rate rotation. The proposed by Yakhot [24] is used in this paper, where , is the strain rate tensor.
The production terms , and in nonlinear system are:
The empirical constants read = 1.44, = 1.92, = 0.2, = 4.38, = 0.015, = 1, and = 0.77.
2.2. ISW Generation
A modified Korteweg-de Vries (mKdV) equation derived by Michallet [25] is adopted to initialize the ISW profile propagation in a horizontal direction. The interface displacement of the ISW can be written as follows:
where denotes the ISW wave profile; is the wave amplitude; is the mKdV theory phase velocity.
and are coefficients of stratified fluid thicknesses defined as follows:
with intermediate variables.
where
Where is the total fluid depth, is the upper fluid depth, is the lower fluid depth, is the upper fluid density and is the lower fluid density. More details of the mKdV theory can be found in Tyvand [26].
Based on the ISW profile equation, the horizontal velocity in the upper- and lower-layer can be expressed as:
where i = 1, 2 denotes the upper- and lower-layer.
The vertical velocities in the upper- and lower-layer can be derived from the mass conservation Equation (1).
During the numerical simulation, the forces and torque on the platform are defined as follow:
where, are the horizontal and vertical forces, is the wetted surface are of the platform, , , are the outward unit normal vector of the platform surface, and is the vertical distance between each wetted cell of the platform and the torque center.
2.3. Numerical Method
The numerical model developed for this investigation is based on the OpenFOAM library. Time advancement is performed by the implicit Euler method [27]. The Finite Volume Method (FVM) is used to discretize the spatial term on a structured grid. The velocity gradient on the left-hand side of Equation (1) is obtained by the Gaussian linear interpolation [28]. The second-order Total Variation Diminishing (TVD) limited linear scheme is employed to discretize the convection term in Equation (2) [29]. The linearized source terms on the right-hand side of Equation (2) are integrated over a control volume. The SuperBee scheme is used to discretize the second term on the left-hand side of Equation (3) [30]. The pressure-velocity coupling term is solved by using the PIMPLE algorithm, which is a combination of the PISO algorithm and the SIMPLE algorithm. PIMPLE inherits the main structure of the original PISO and allows for equations under relaxation to ensure that all equations at each time step can converge. Details of the PIMPLE algorithm can be found in Jasak [28].
The bottom boundary is specified as a no-slip condition. The rigid-lid approximation is employed to the free surface, which can eliminate the effects of the surface wave [31]. A narrow relaxation zone is set on the right side of the numerical wave tank to absorb the reflected wave. The details of the relaxation zone can be found in [32].
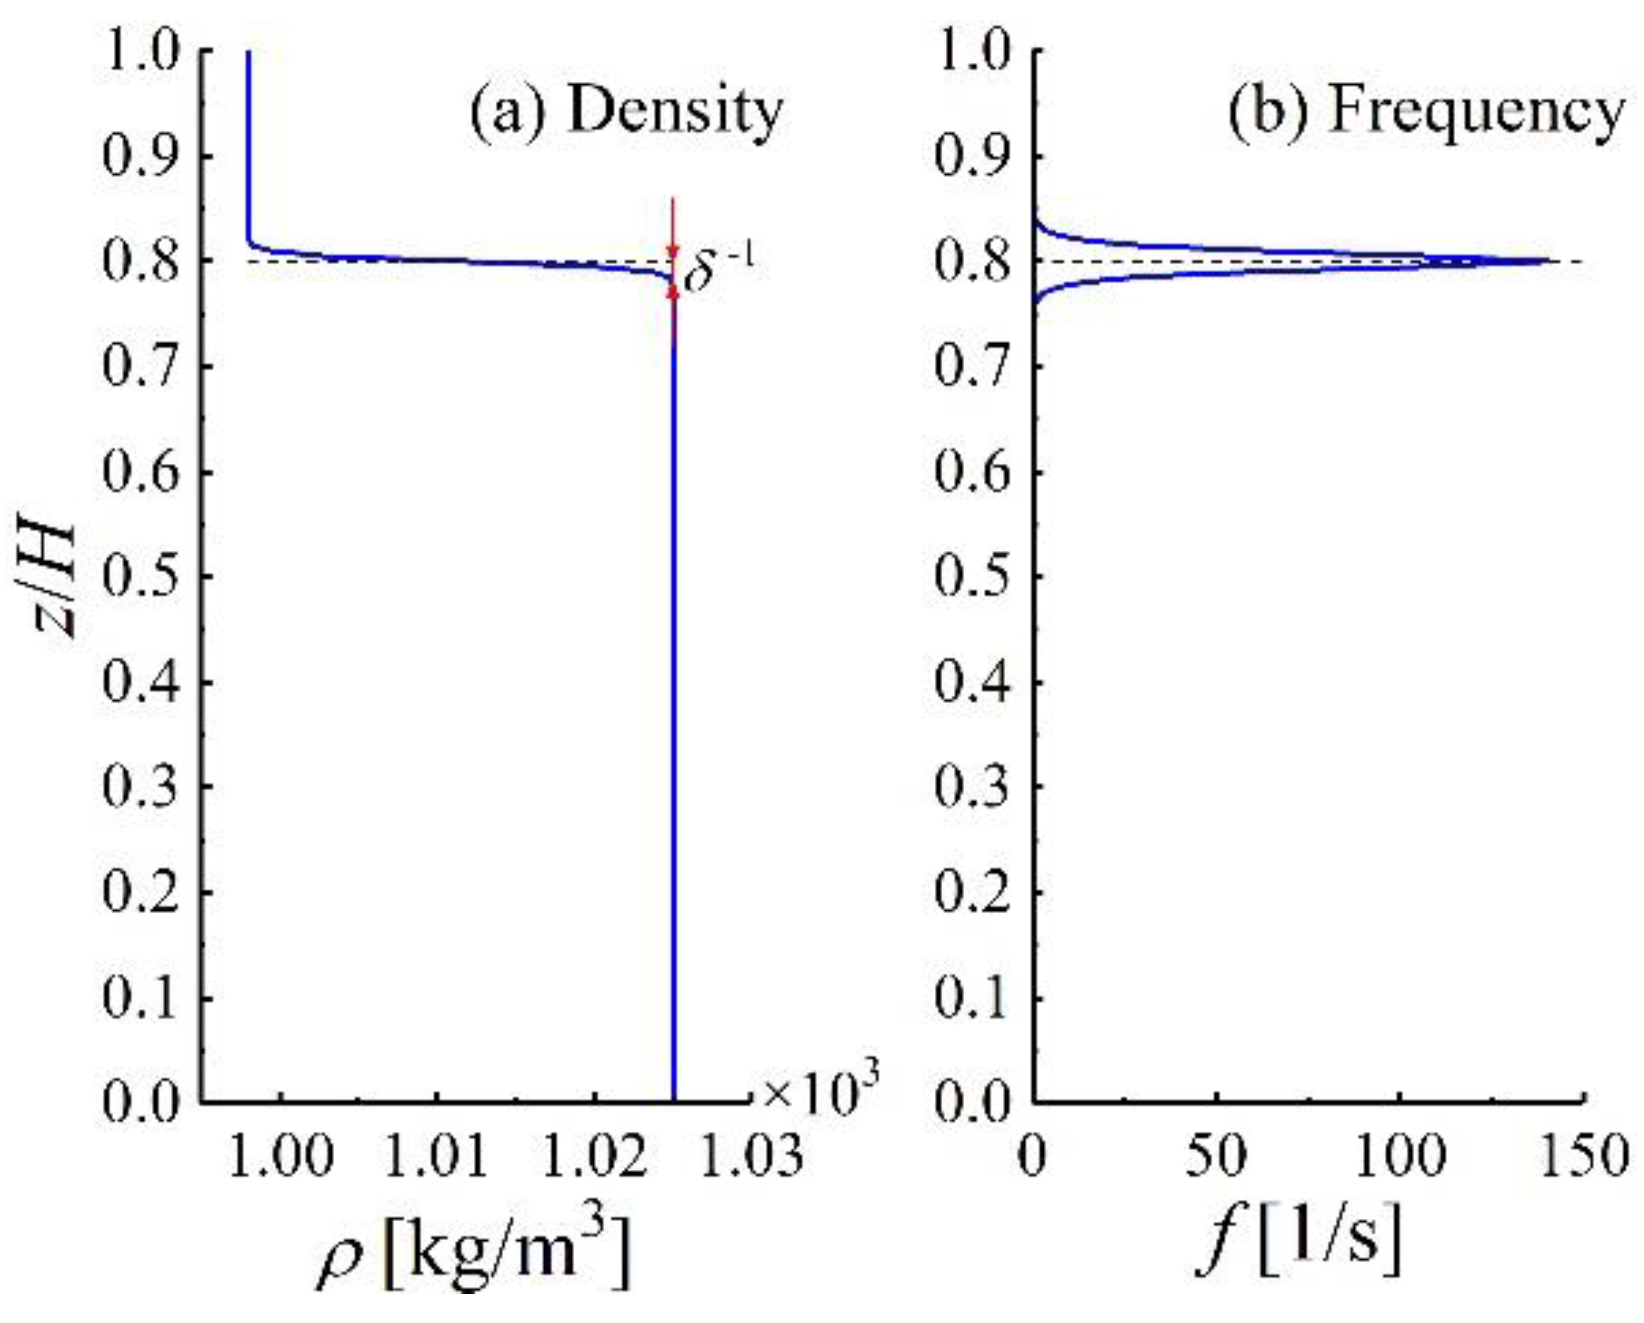
The initial density distribution with a 4 cm pycnocline, as shown in Figure 1, can be expressed by the following equation [33]:
where is the vertical coordinate; is the location of mid-pycnocline, or interface, level; is the reciprocal of the half-depth in the lower layer defined from the interface level; and and are the densities in the upper- and lower-layer fluid. The Brunt-Bäisälä frequency in Figure 1 refers to the frequency of free oscillation in the vertical direction after the disturbance of the micro seawater cluster in the ocean with stable density stratification. It depends on the vertical gradient of seawater density and is defined as . The in Figure 1 is the total fluid depth.
3. Flow around the Semi-Submersible Platform Induced by the ISW Propagation
A series of numerical simulation of the flow around the semi-submersible platform induced by the ISW propagation is conducted. Different ISW amplitudes and fluid depth ratios are considered. Characteristics of the hydrodynamic loads and the flow field around the platform are revealed. All the numerical simulations are run on the Ubuntu 16.04 with the Genuine Intel (R) CPU @ 2.20GHz 64 bits based 48 processors and 96 GB of RAM.
3.1. Computational Setup
The referential experiment was conducted at Shanghai Jiao Tong University [21]. In total, 15 cases were conducted during experimental investigations of the interaction between the ISW and semi-submersible platform. The densities of two-layer fluids were 998 kg/m3 and 1025 kg/m3. Three kinds of fluid depth ratios including 20:80, 25:75, and 30:70 were used. The linear scale ratio between the platform model in the experiment and the actual marine engineering was 1:300. At the experimental stage, ISWs were generated using a double-plate wave maker [34]. The ISWs were measured and analyzed using the ISW dynamic measurement system.
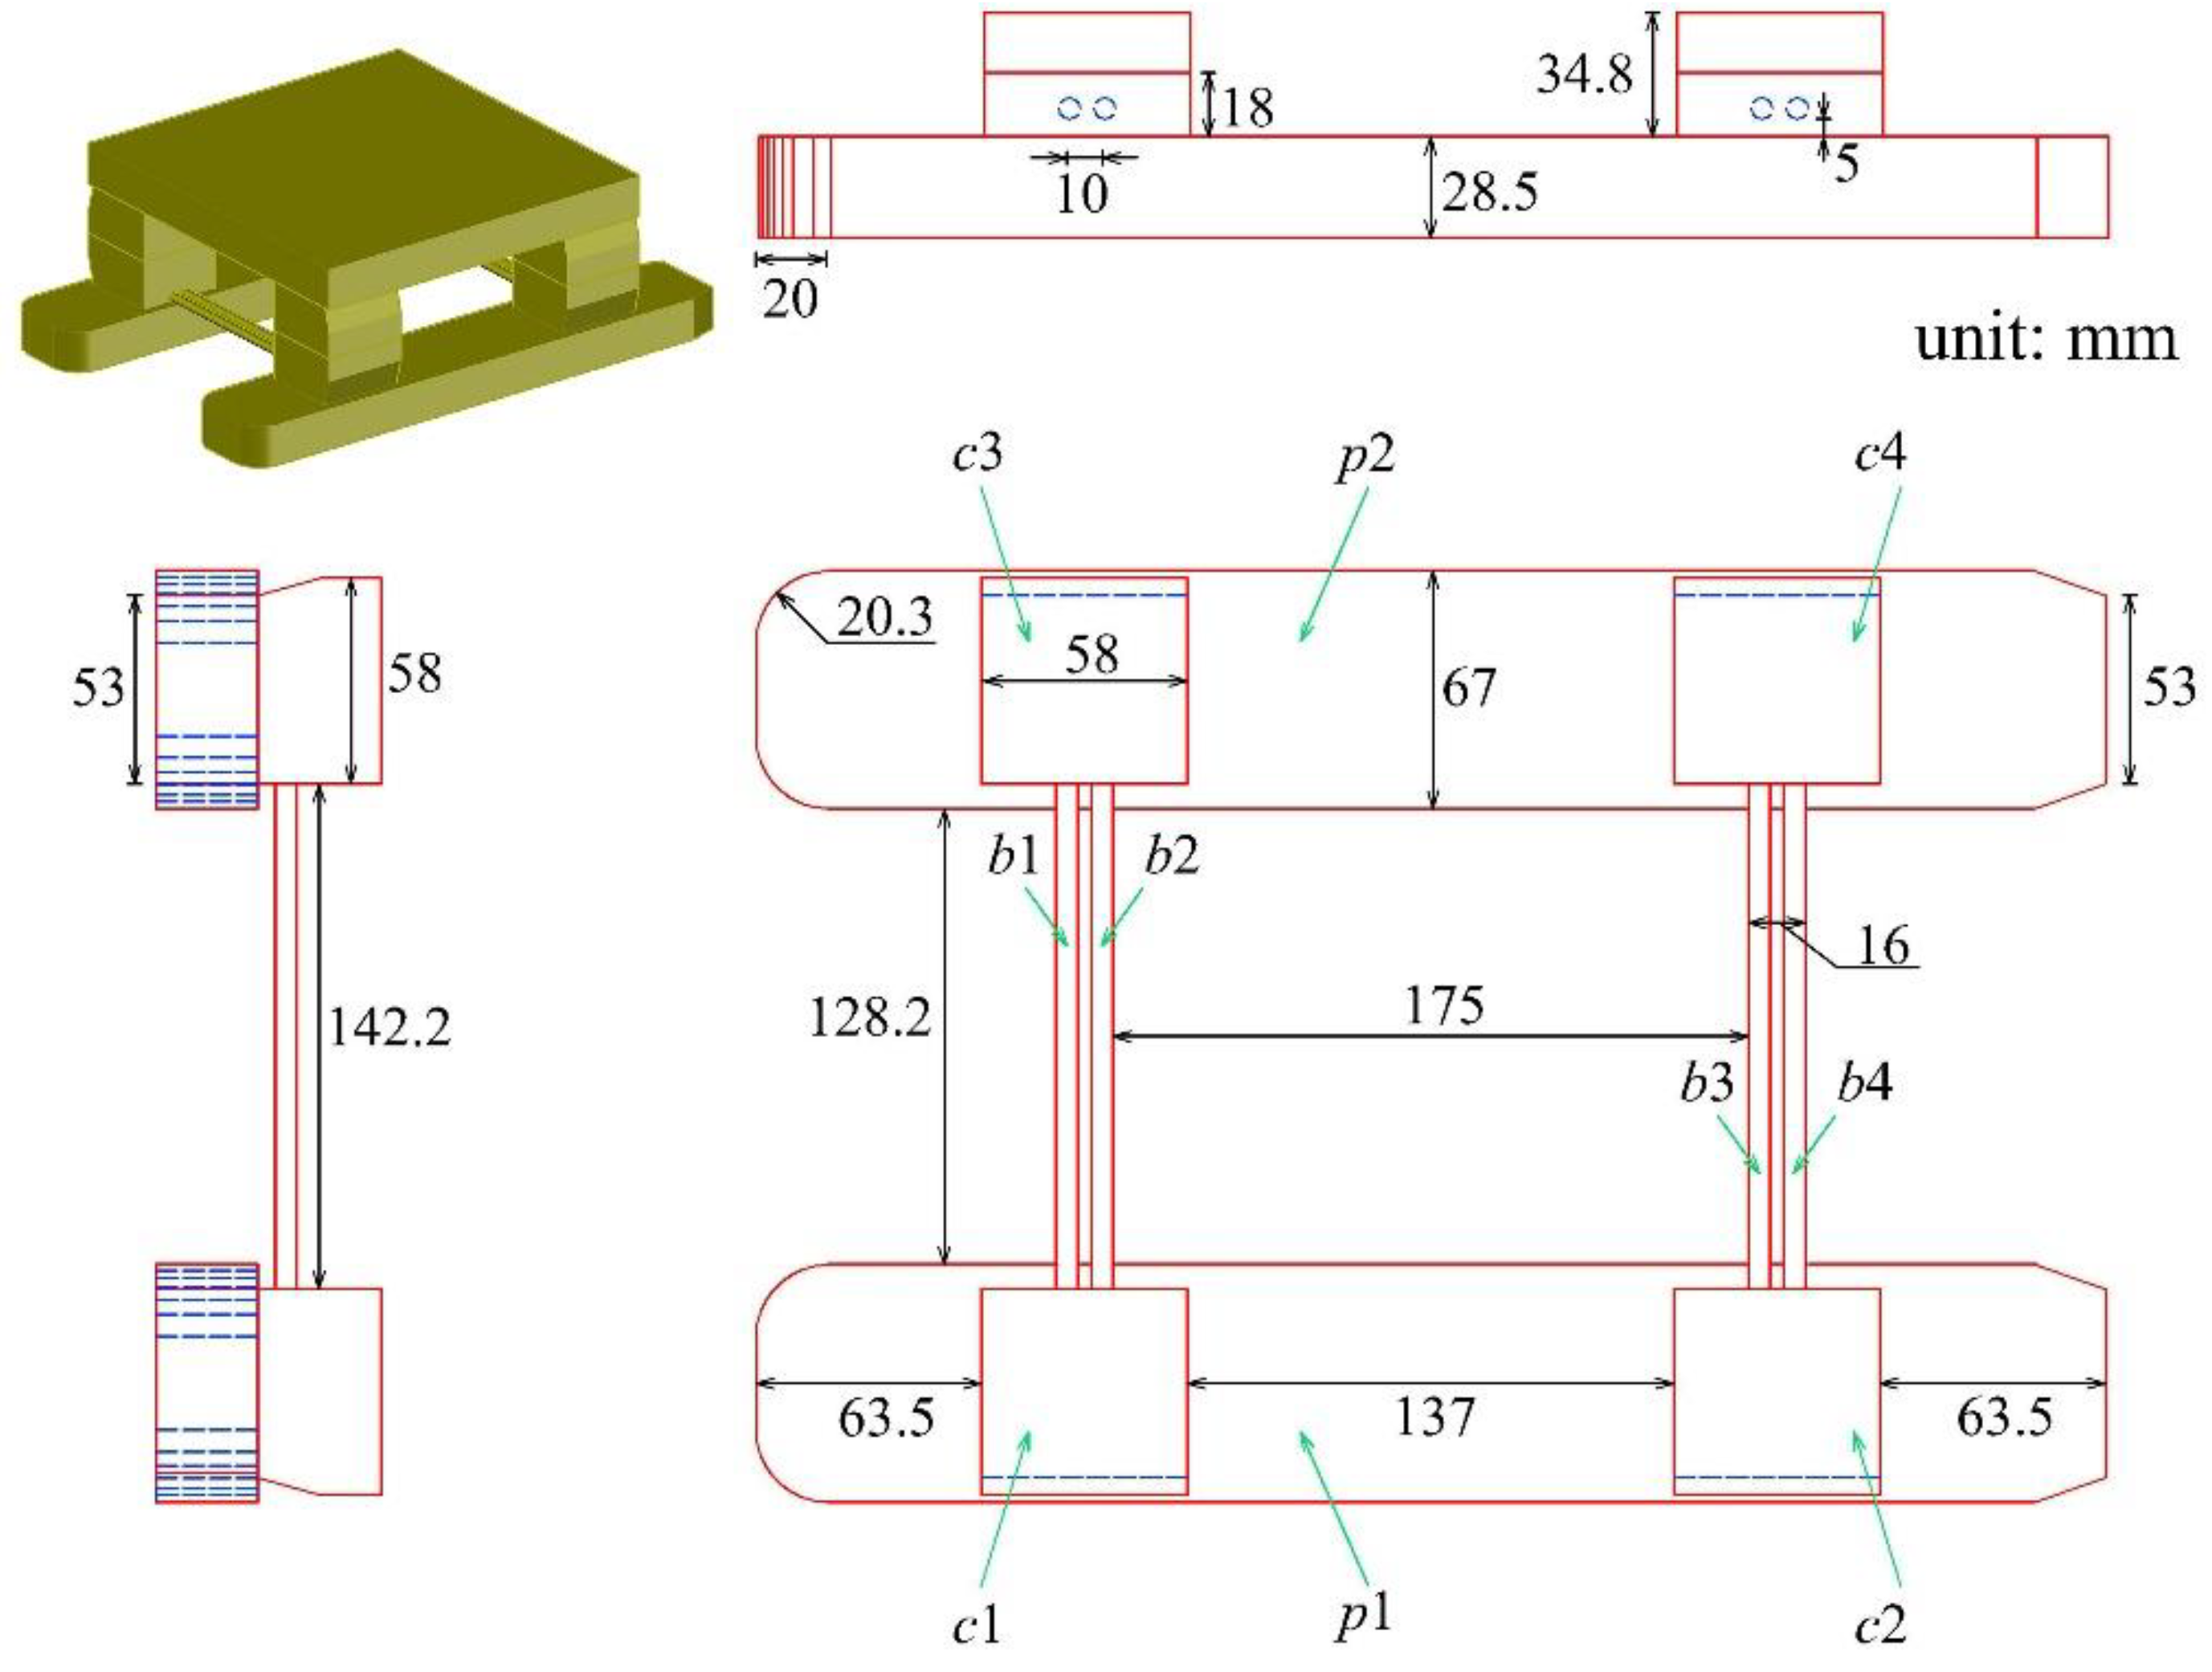
A three-dimensional numerical wave tank was established to simulate the flow field around the semi-submersible platform induced by the depression-type ISW propagation. According to the experiment conducted by Wang [21], the basic sizes of the wave tank, which was filled with two layers of fluids, were 30 m long () in the stream-wise direction, 0.6 m wide () in the span-wise direction and 1 m height () in the vertical direction. As shown in Figure 2, the red dashed line represents the interface of two layers. To be consistent with the conditions in the experiment, the densities in the upper- and lower-layer fluids were = 998 kg/m3 and = 1025 kg/m3, respectively. The relative density difference between and was 0.027. In the ISW propagation region, the thicknesses of the upper- and lower-layer were and , respectively. The fluid depth ratio is . The linear scale ratio between the platform used in the numerical simulation and Hai Yang Shi You 981 deep-water semi-submersible drilling platform was 1:300. The detailed dimensions of the semi-submersible platform are described in Figure 3. The draft and the immersion volume of the platform were 0.0633 m and 1.9072 × 10⁻³ m3, respectively. The top center coordinate of the submerged part of the platform was 12, 0.3, and 0 m. The buoyancy on the platform was 18.67 N. As illustrated in Figure 3, the platform consisted of two pontoons (p1 and p2), four columns (c1 to c4) and four bracings (b1 to b4). During the numerical simulation, the time step was taken as = 0.001 s.
3.2. Analysis of Forces on the Platform
To verify the accuracy of the numerical model in this paper, forces and torques on the semi-submersible platform under different fluid depth ratios and ISW amplitudes were compared with the laboratory experiment data obtained by Wang [21]. The ISW amplitude and the fluid depth ratio used in numerical simulations are listed in Table 1. In total, 15 cases were considered in this verification process. The force and torque coefficients are defined as and , where and are forces and torque acting on the platform, respectively. The comparisons between numerical simulation results and experimental data of the maximum forces coefficients and the maximum torque coefficients are illustrated in Figure 4. It is noted that the numerical results are in good agreement with the experimental data. The forces and torques on the semi-submersible platform due to the ISW propagation increased with the increases in the ISW amplitude. By comparing the force and torque coefficients for Cases A2, B3, and C4 under similar ISW amplitudes, it can be inferred that the force and torque on the platform decreased with the increase in the fluid depth ratio h1:h2 when the ISW amplitude is unchanged, as shown in Figure 4. According to the analysis of the experimental data, the apparent difference between the numerical simulation result and the experimental data of Case B2 in Figure 4b was induced by too large experimental data.
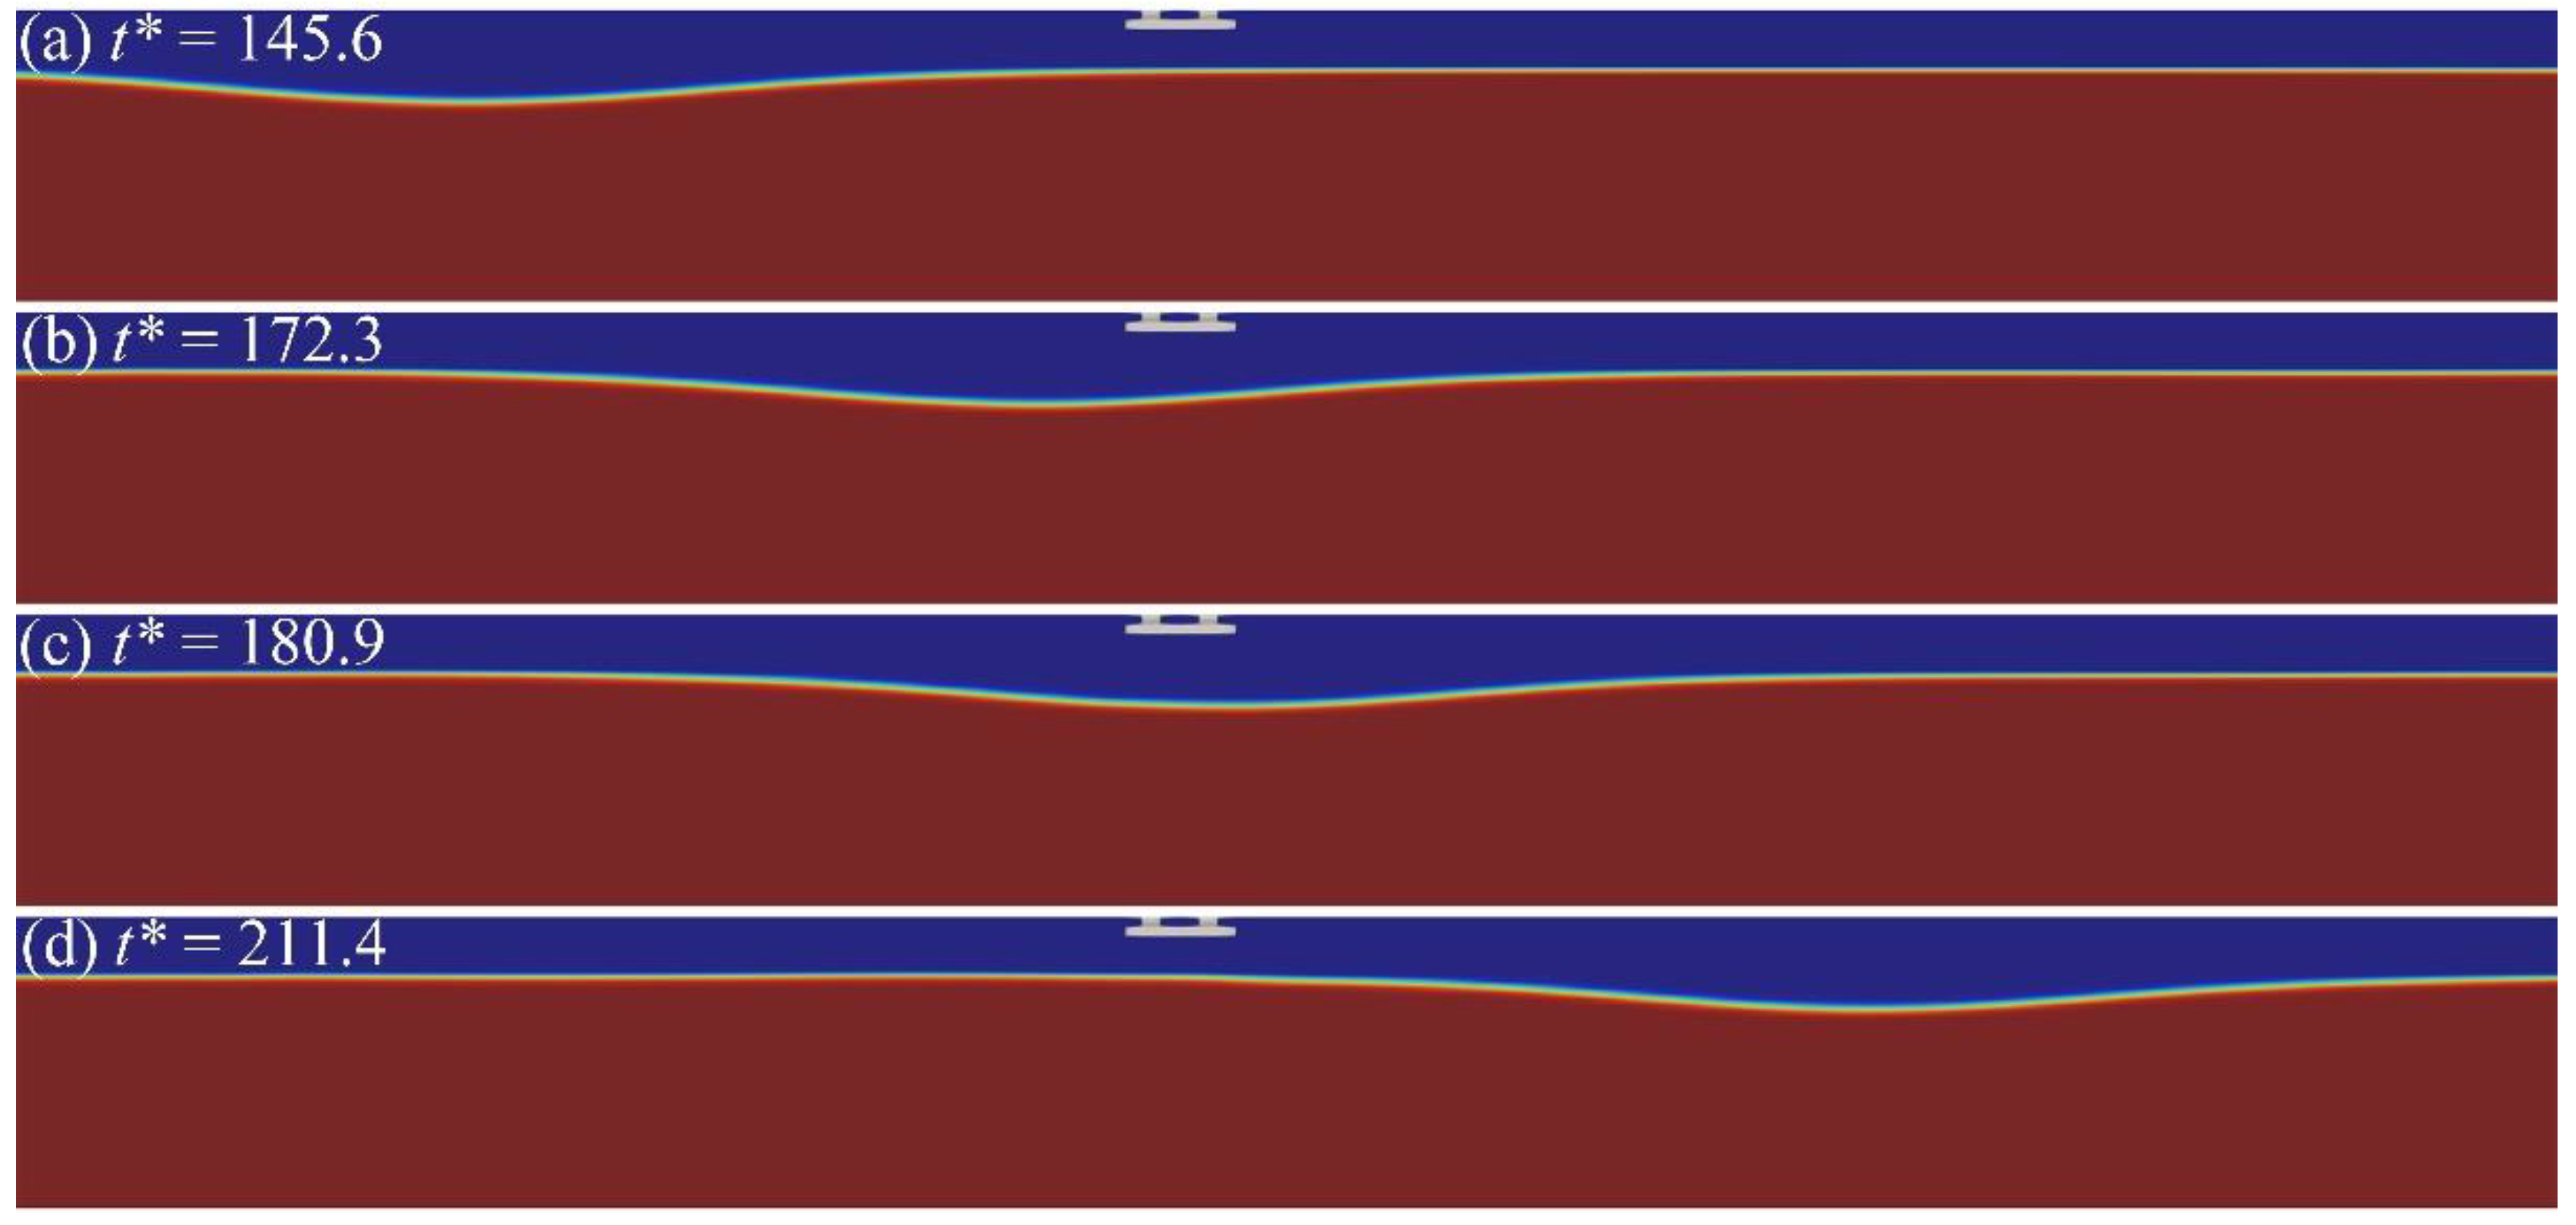
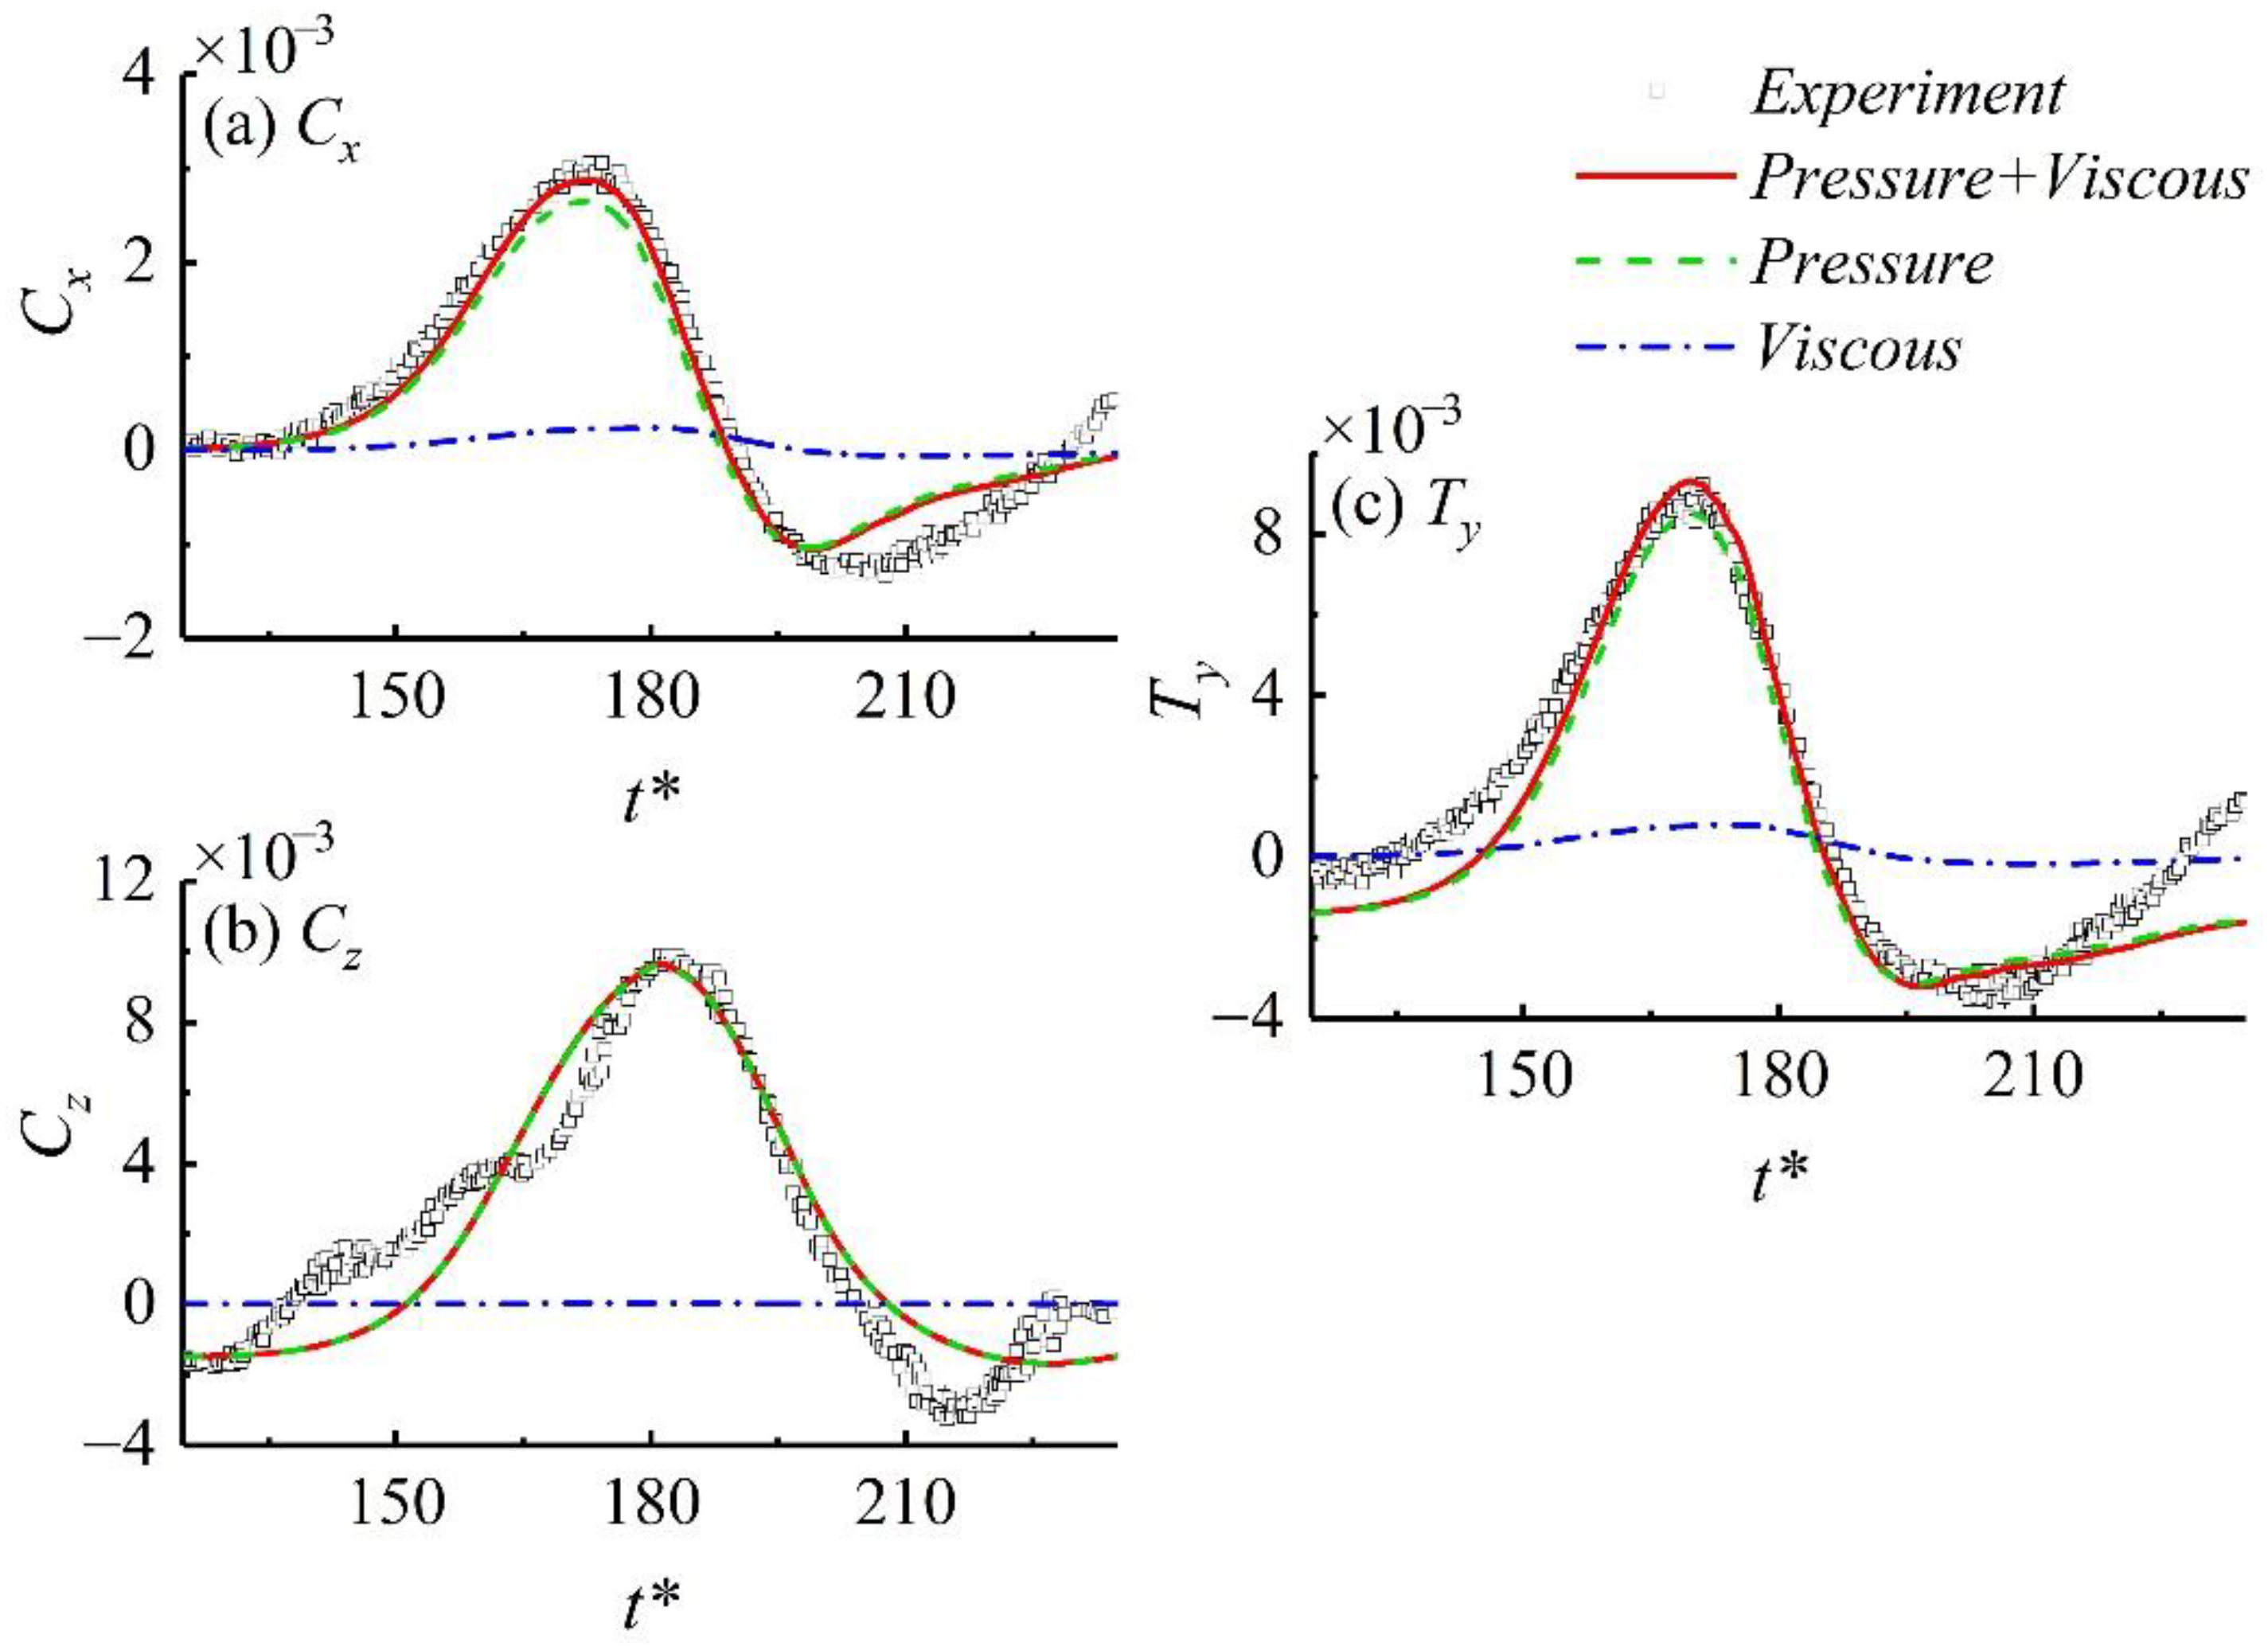
Figure 5 and Figure 6 describe the ISW propagation and hydrodynamic loads on the semi-submersible platform of Case A2, respectively. The dimensionless time is used to represent the evolution of time. Figure 5 indicates that the existence of the platform has no visible effect on the ISW evolution under the condition of Case A2. To validate the numerical model, Figure 6 describes the comparison of forces on the platform between the numerical results and experimental data. Contributions of the pressure and viscous force on the platform are also revealed in the Figure 6. The forces of numerical simulations were obtained by the integration of the pressure and viscous force on the platform. As illustrated in Figure 6, the force exerted by the ISW on the platform is mainly contributed by the pressure. For the horizontal force, the peak values of the dimensionless pressure and viscous force were 2.65 × 10⁻³ and 0.24 × 10⁻³, respectively, which indicates that the effect of the horizontal viscous force cannot be ignored. The vertical absolute maximum dimensionless pressure and viscous force were 9.62 × 10⁻³ and 2.5 × 10⁻⁵, respectively, which means that the vertical viscous force is negligible.
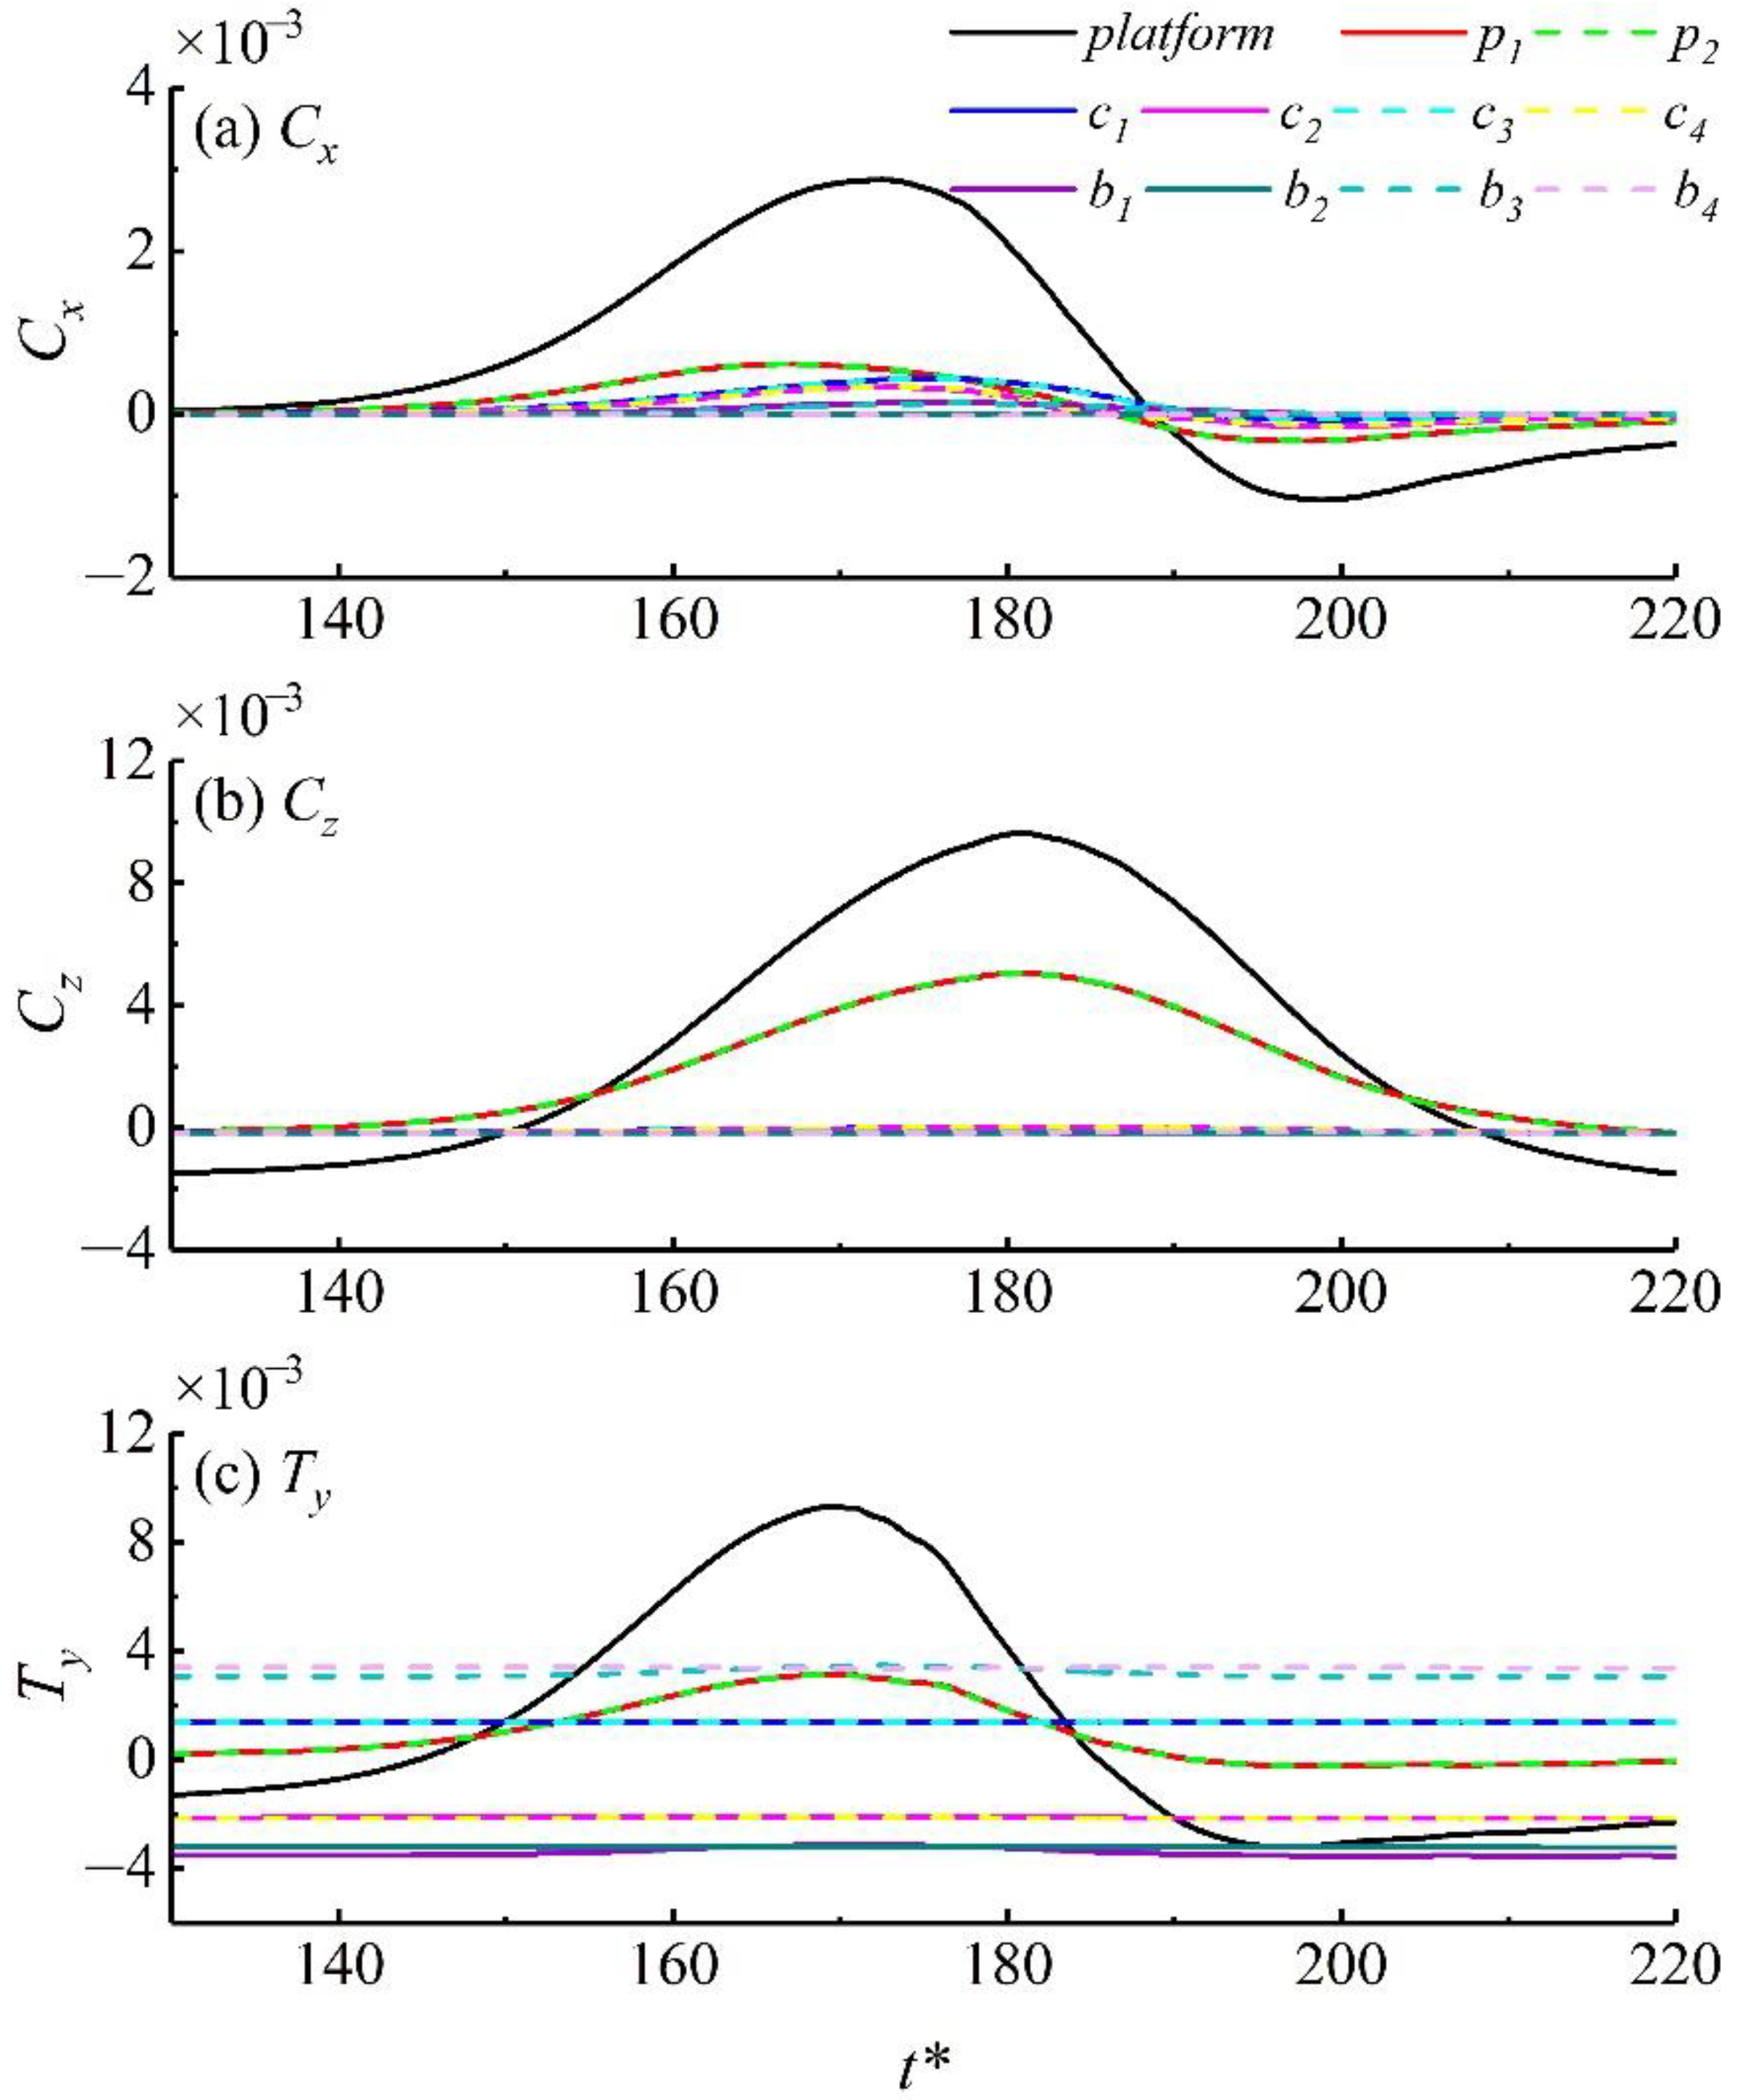
For a clearer understanding of the forces on the semi-submersible platform induced by the ISW propagation, Figure 7 describes the forces on each component of the platform under the condition of Case A2. As illustrated in Figure 7a, the magnitudes of the horizontal forces acting on the pontoons, columns and bracings are the same orders. The horizontal forces acting on the pontoons and columns account for 54.0% and 42.7%, respectively, of the horizontal force on the platform. Figure 7a indicates that the horizontal forces on the front column and bracing were larger than those on the column and bracing in the rear, respectively. From Figure 7b, it can be found that the vertical forces on the columns and bracings were negligible. Almost all of the vertical forces on the semi-submersible platform are derived from those on pontoons. Figure 7c illustrates that the torque on each column was much larger than that on other types of components of the platform.
3.3. Dynamic Pressure and Flow Field around the Platform
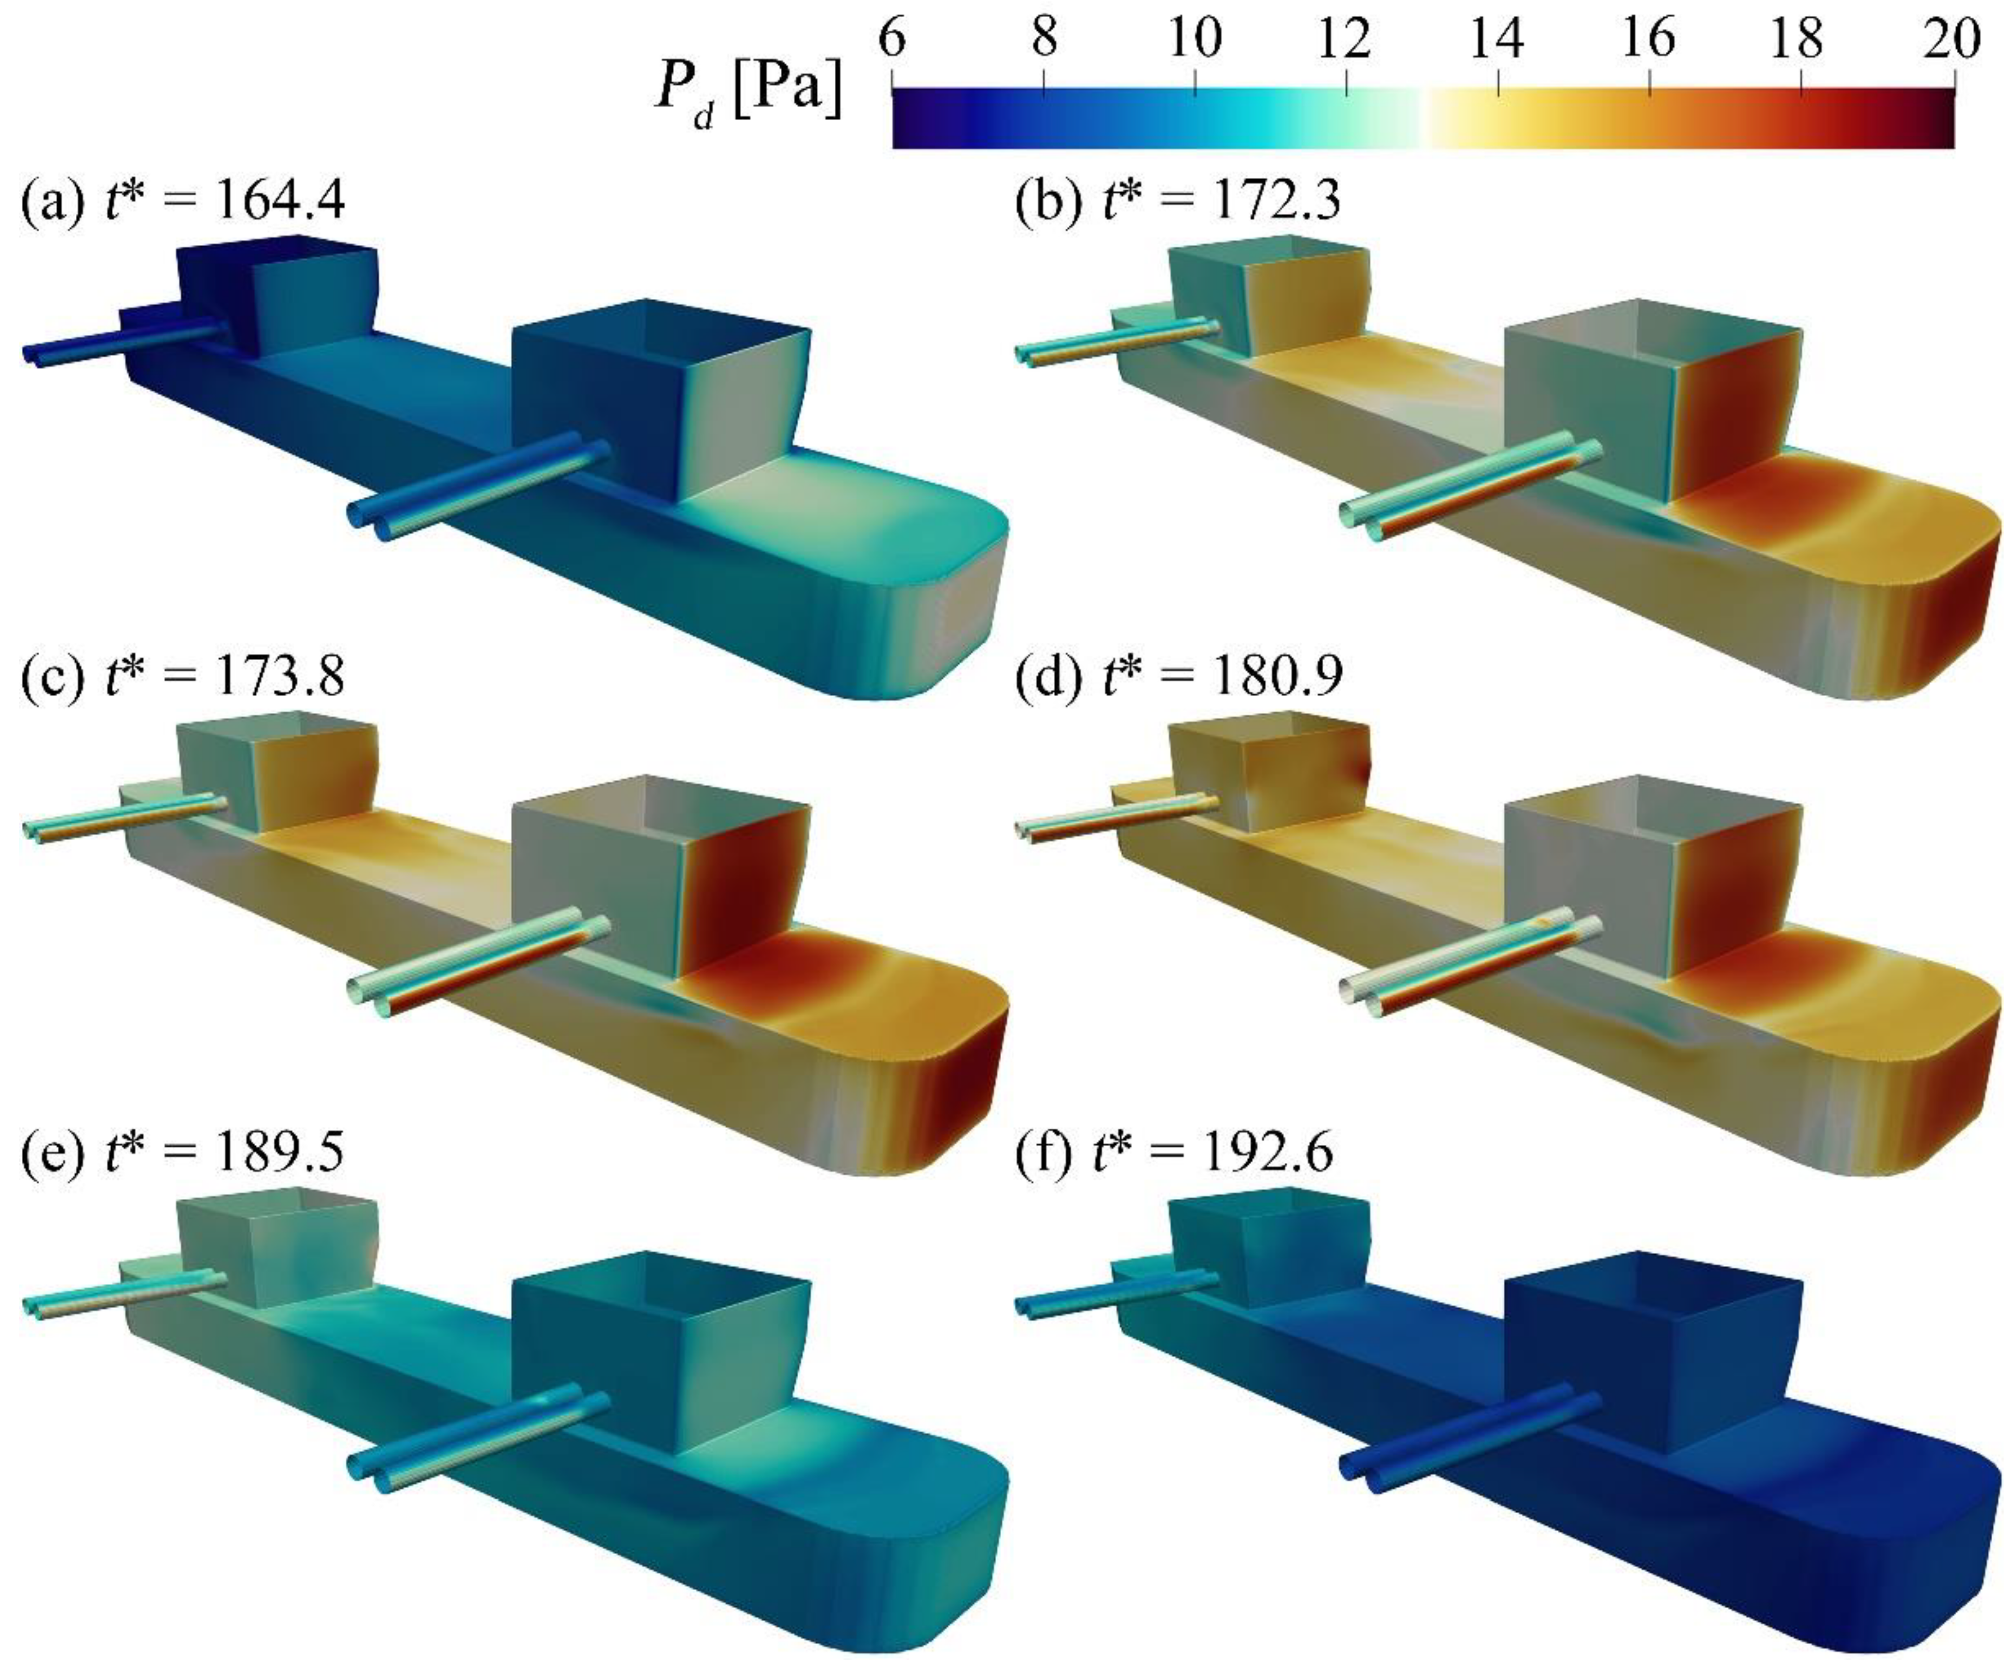
To analyze the interaction between the ISW and the semi-submersible platform, the dynamic pressure around the platform during the ISW propagation is described in Figure 8. Figure 8 illustrates only half of the platform, as the distribution of the around the platform was symmetrical along the section in = 0.3 m. The around the platform changes from increasing to decreasing during the ISW propagation. Figure 8a–c indicates that around the front column and bracings were larger than those around the rear column and bracings during the ISW arriving at the platform. Compared with other positions of the pontoon, the leading edge of the pontoon withstood a greater during this process. Figure 8d–f describes that the around the rear of the platform gradually became greater than that around the front of the platform during the ISW spreading away from the platform. The around the connection between the bracing and column was smaller than that around other positions of the bracing (Figure 8).
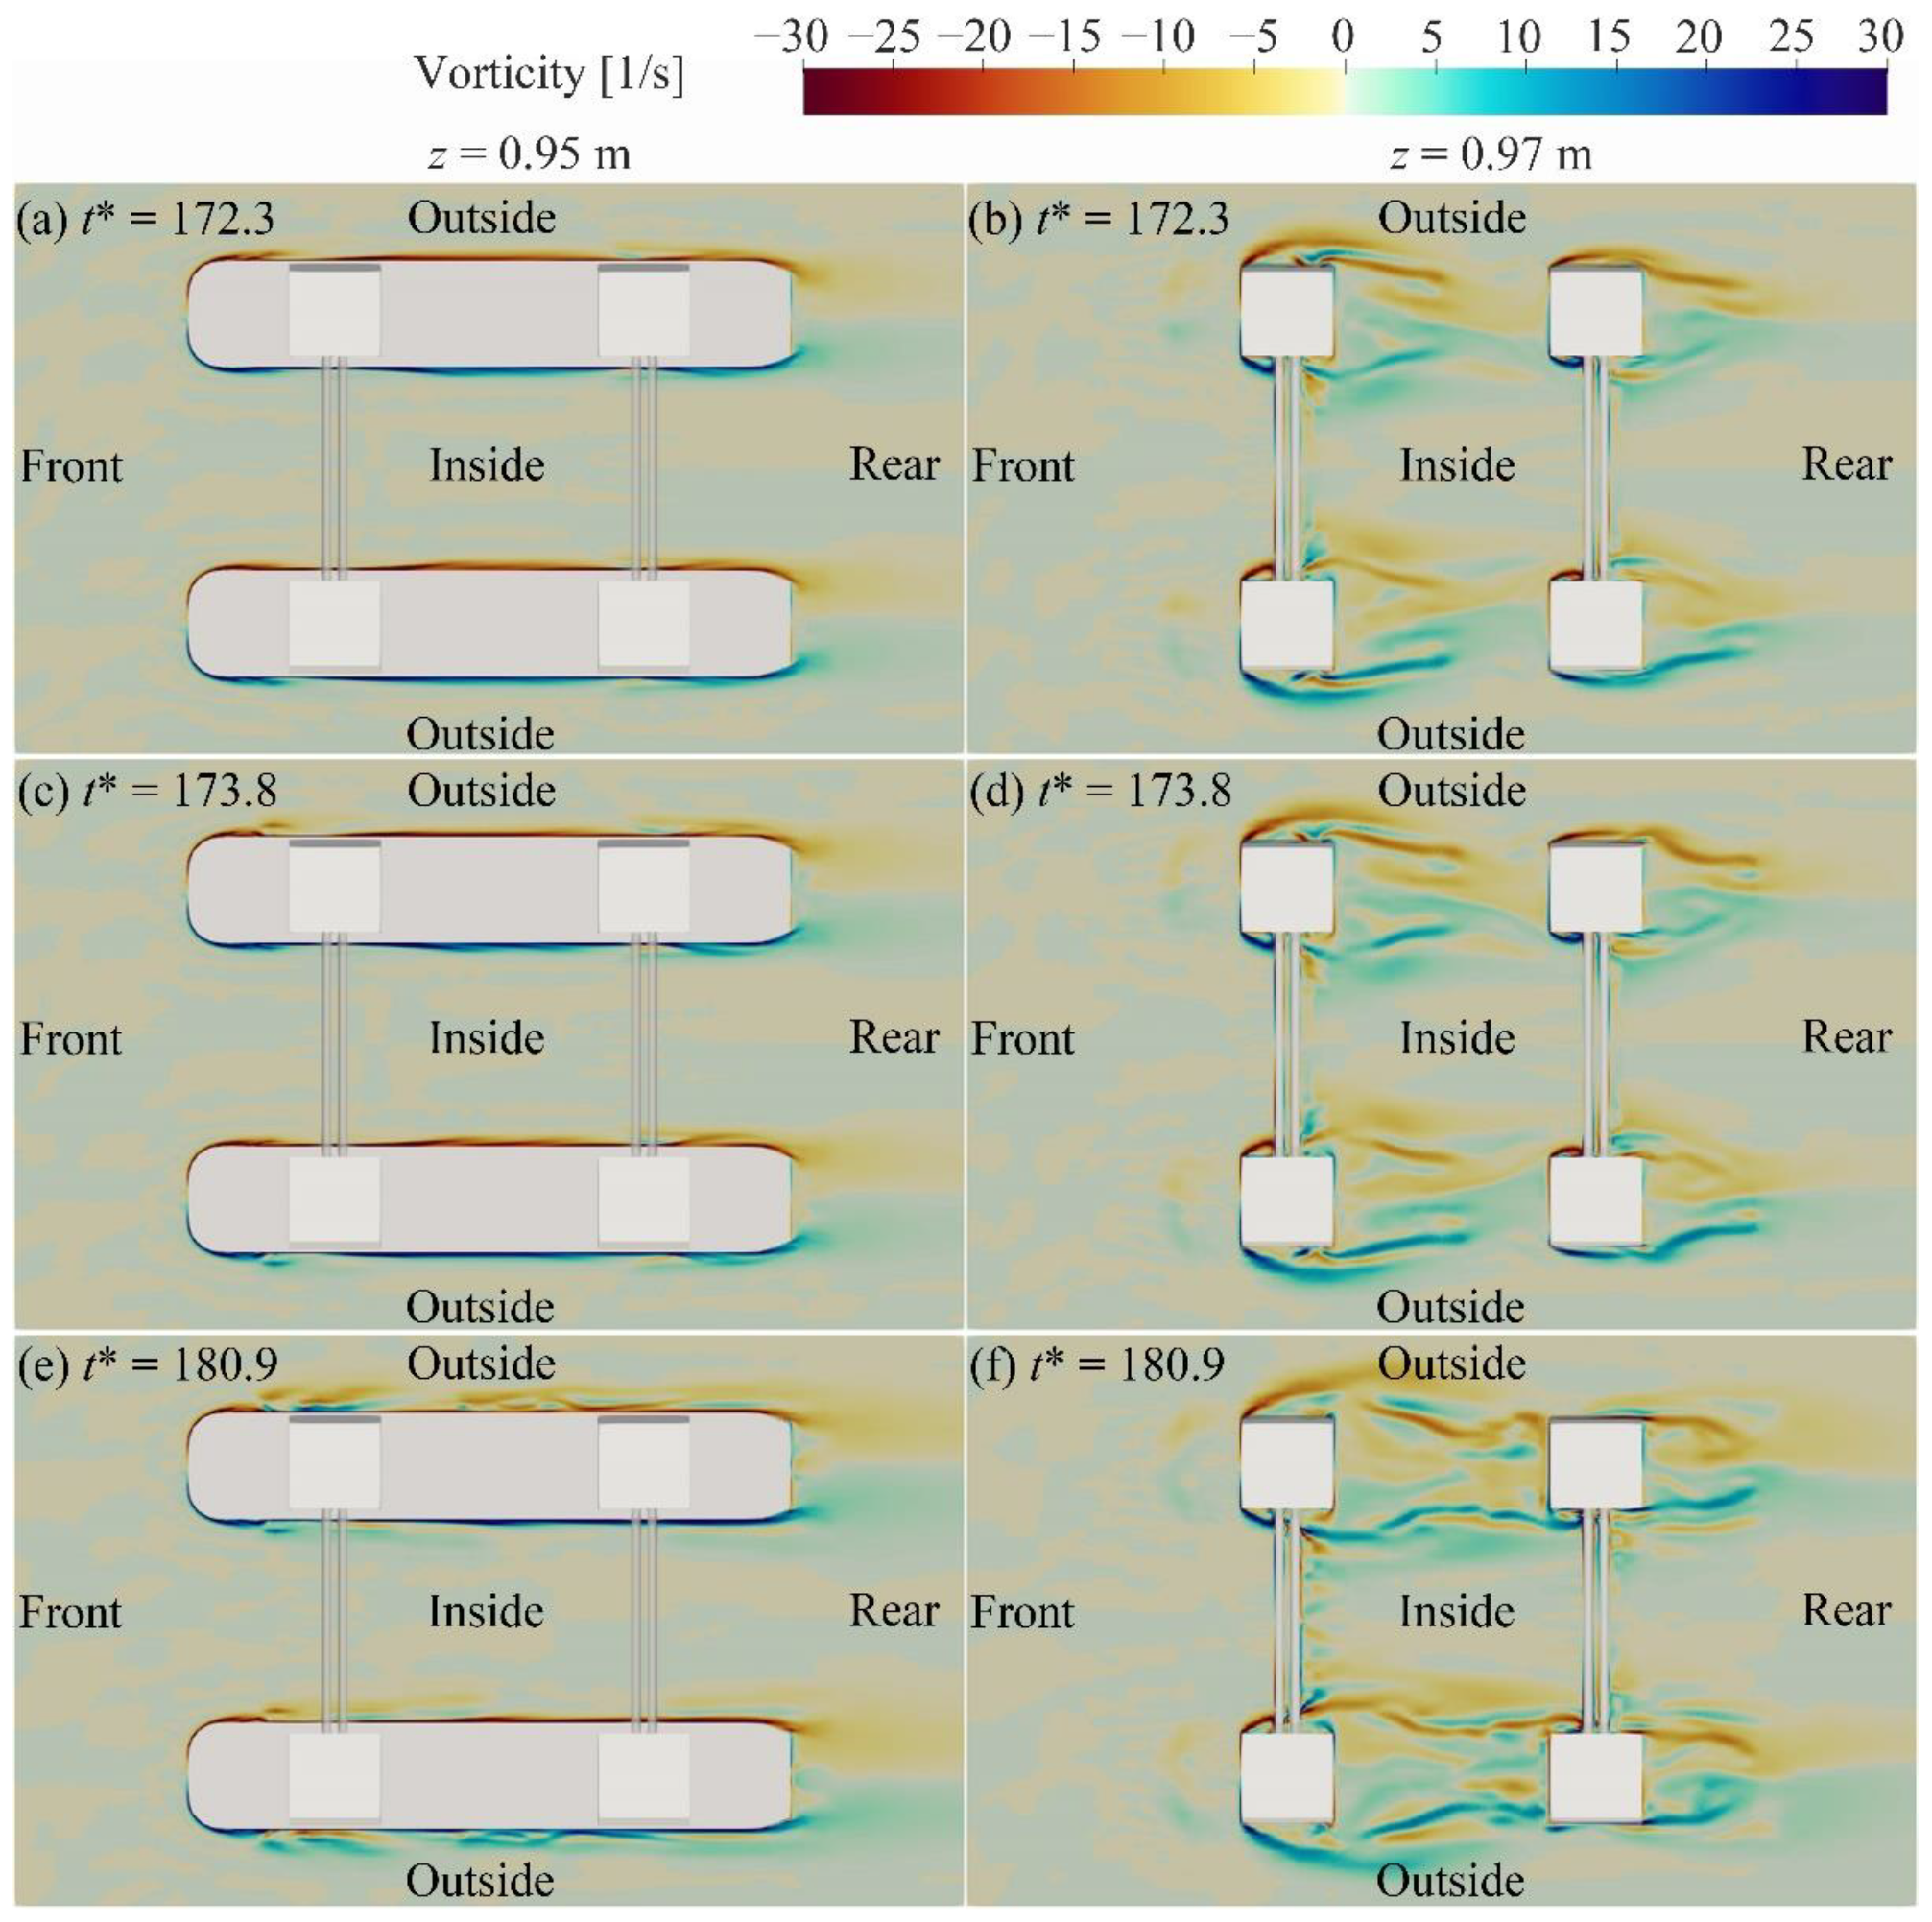
As a helpful instrument for presenting numerical simulation results, the flow fields including vorticity and velocity fields around the platform are illustrated in Figure 9, Figure 10 and Figure 11 and Appendix A. The distribution of vorticity fields around the platform can reveal characteristics of the interaction between the ISW and platform. = 172.3, 173.8, and 180.9 are the times of the peak of forces and torque acting on the platform, respectively. The ISW propagation induces the phenomenon of the upper fluid flow around the platform. From Figure 9 it can be seen that distributions of the vorticity field around the platform were approximately symmetrical along the section in = 0.3 m. = 0.95 m and = 0.97 m are the average positions in the vertical direction of the pontoon and bracing, respectively. With the ISW propagation, vortexes shedding around the platform can be significantly observed in Figure 9. As described in Figure 9c,e, vortices outside the pontoons were easier to shed than those insides. The right panels of Figure 9 indicate that the vorticity field around columns and bracings was more complicated than that around pontoons. The right panel of Figure 9 illustrates that the range of vortexes shedding around the front columns was larger than that around the rear columns due to the group columns effect. The range and strength of interactions between the positive and negative vortices behind the front bracings were greater than those behind the rear bracings. Interactions of vortices around the connection between the bracing and column are more visible than those around other parts of the bracing.
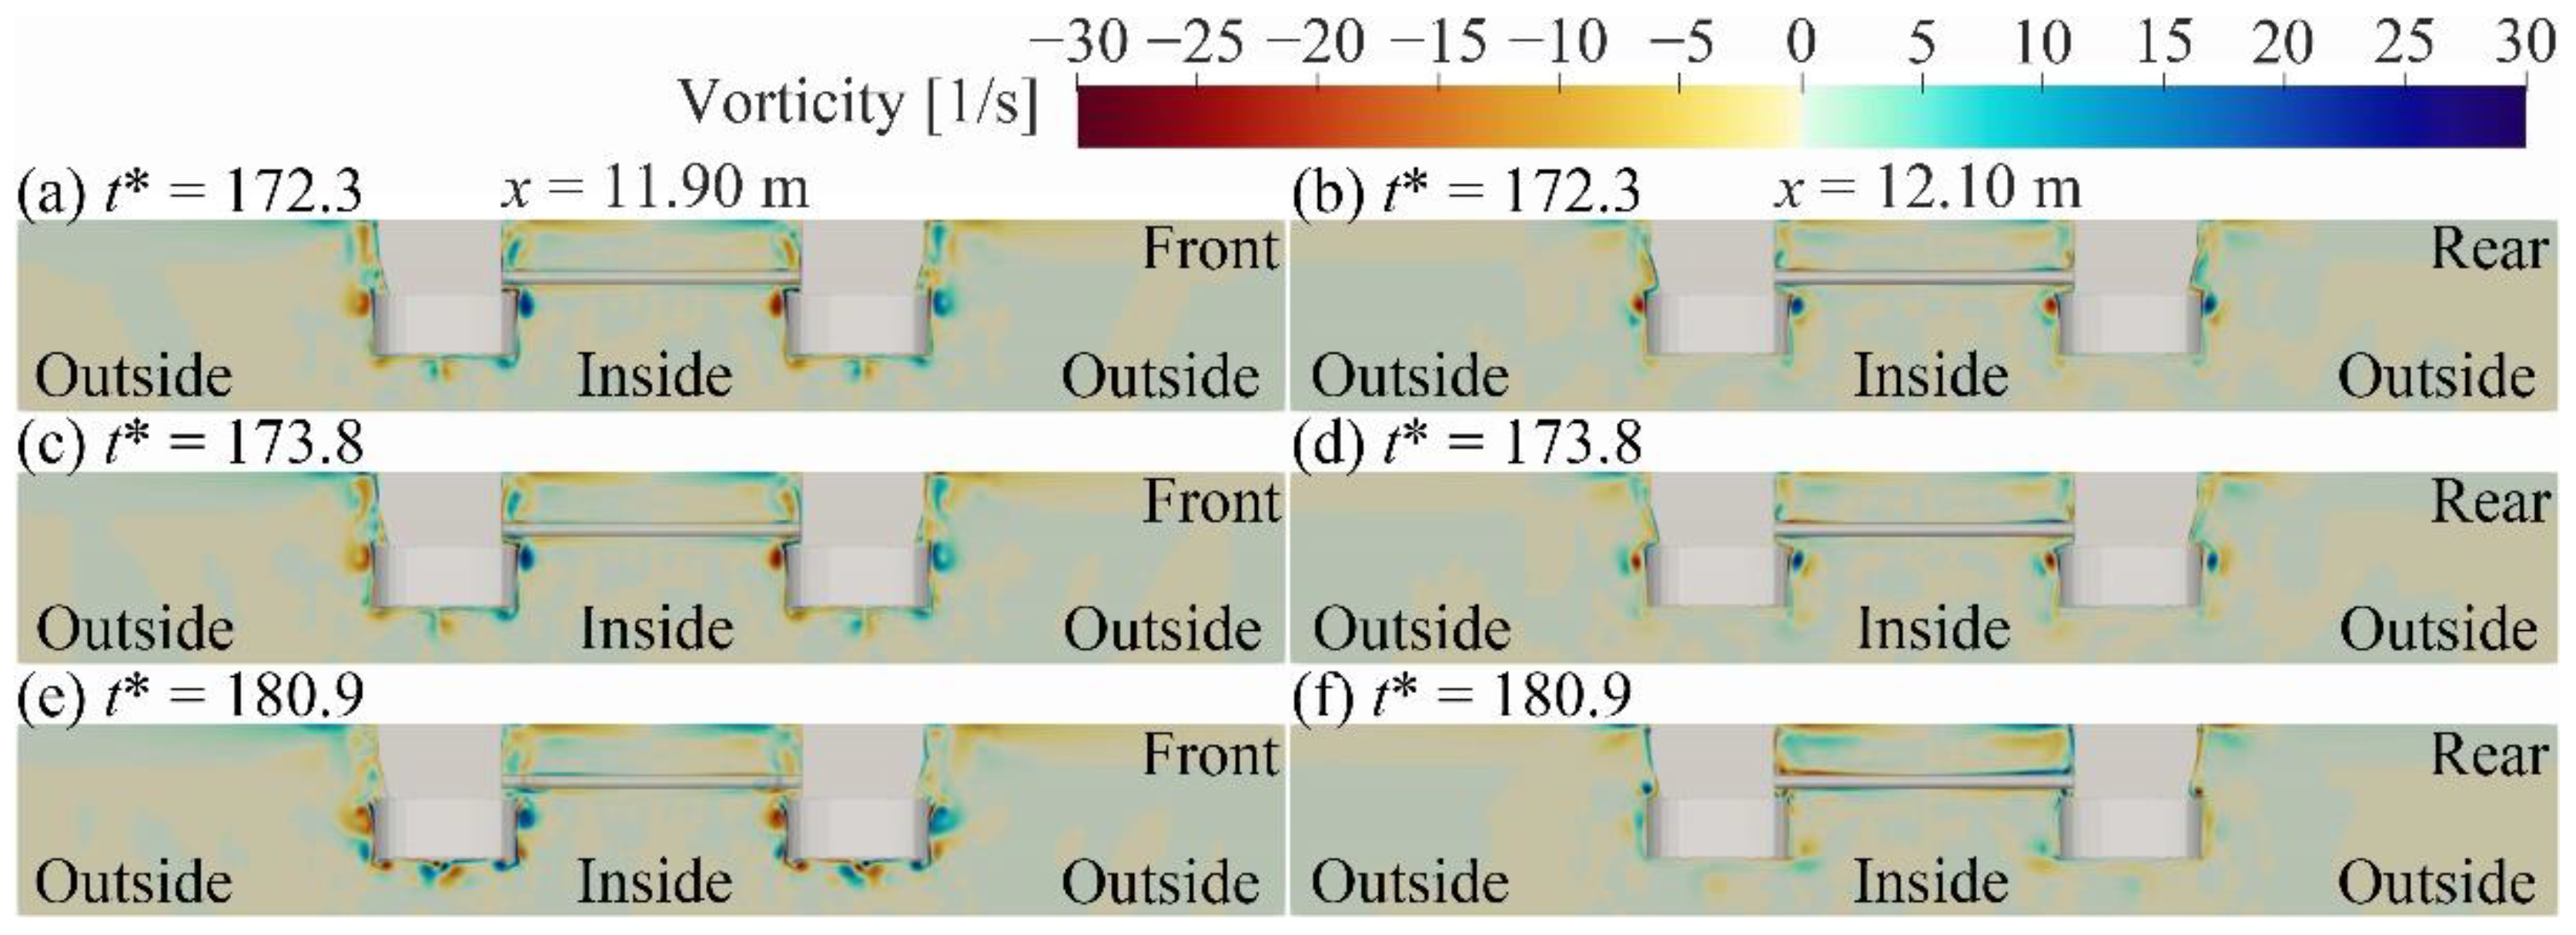
Figure 10 describes the vorticity field around the semi-submersible platform at the sections in = 11.90 m and = 12.10 m. During the interaction between the upper layer fluid and the platform, visible vortices formed around the platform (Figure 10). The range of vortexes shedding around the front of the platform was larger than that around the rear of the platform. Vortices near the connection of each platform component gradually dissipated with the interactions between the positive and negative vortices. The range and strength of vortices under the front of the pontoon were greater than those under the rear of the pontoon. With the ISW propagation, the strength of interactions between the positive and negative vortices under the front and the rear of the pontoon increased and decreased, respectively.
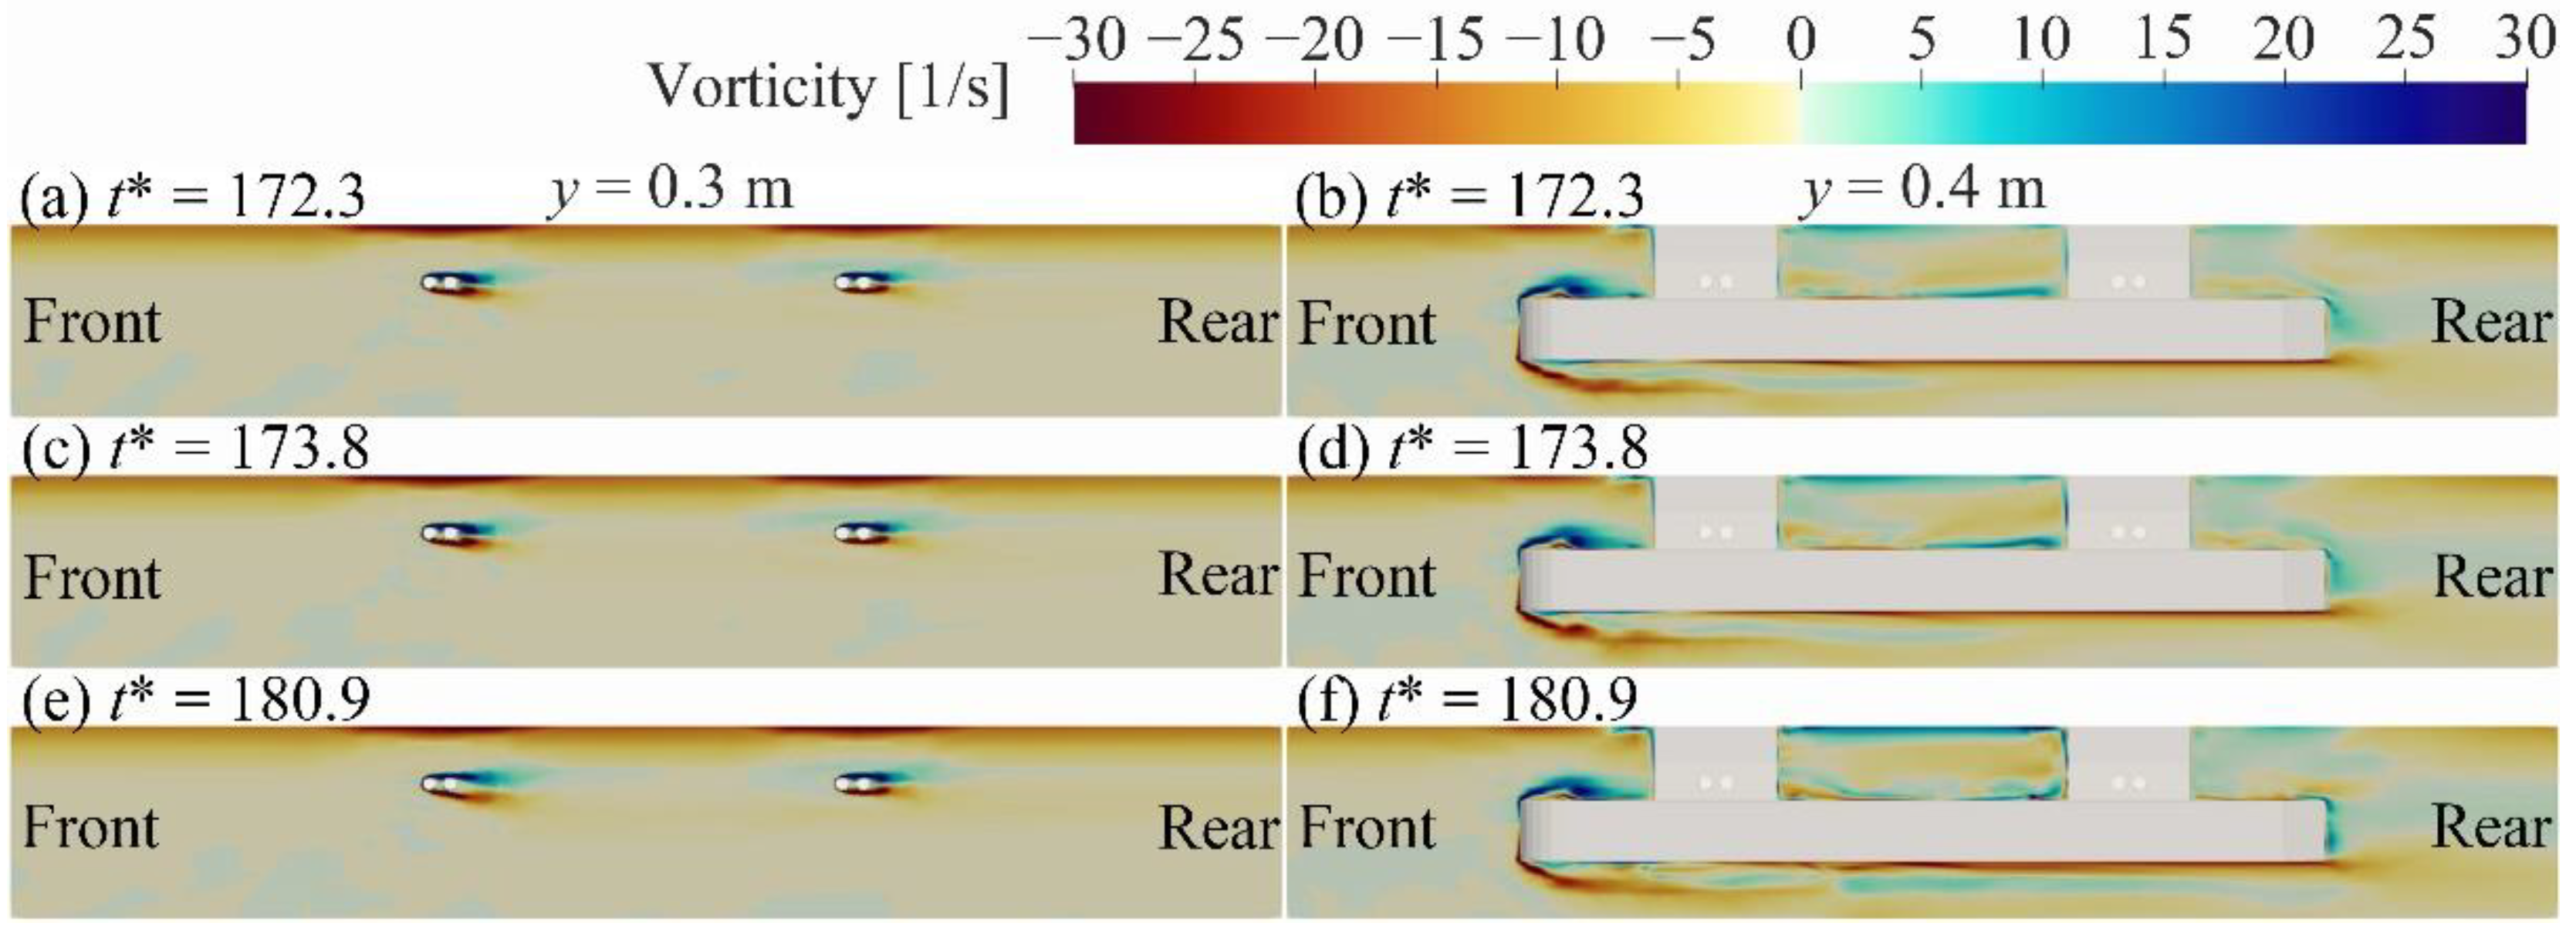
Figure 11 describes the vorticity field around the platform at the sections in = 0.3 m and = 0.4 m due to the symmetrical distribution of flow field around the platform along the section in = 0.3 m. The left panel of Figure 11 indicates that the upper layer fluid formed the flow around the bracings. The positive and negative vortices were generated at the lower and upper sides of bracings, respectively. The range of vortices around the front bracings was larger than that around the rear bracings. The interaction between the positive and negative vortices around the upper and lower sides of the pontoon, respectively, can be observed in the right panel of Figure 11. The order of vortices on the upper side of the pontoon leading edge from the inside to outside was positive, negative and positive vorticity. The positive and negative vortices located at the lower side of the pontoon leading edge were surrounded by the negative vorticity.
Based on the above analyses, it can be found that the propagation of the ISW will cause a complex flow field around the semi-submersible platform. A large number of vortices were generated around the platform. The long-term existence of vortices will induce fatigue and fracture damage to the platform.
4. ISW Propagation over the Semi-Submersible Platform Located at Different Angles
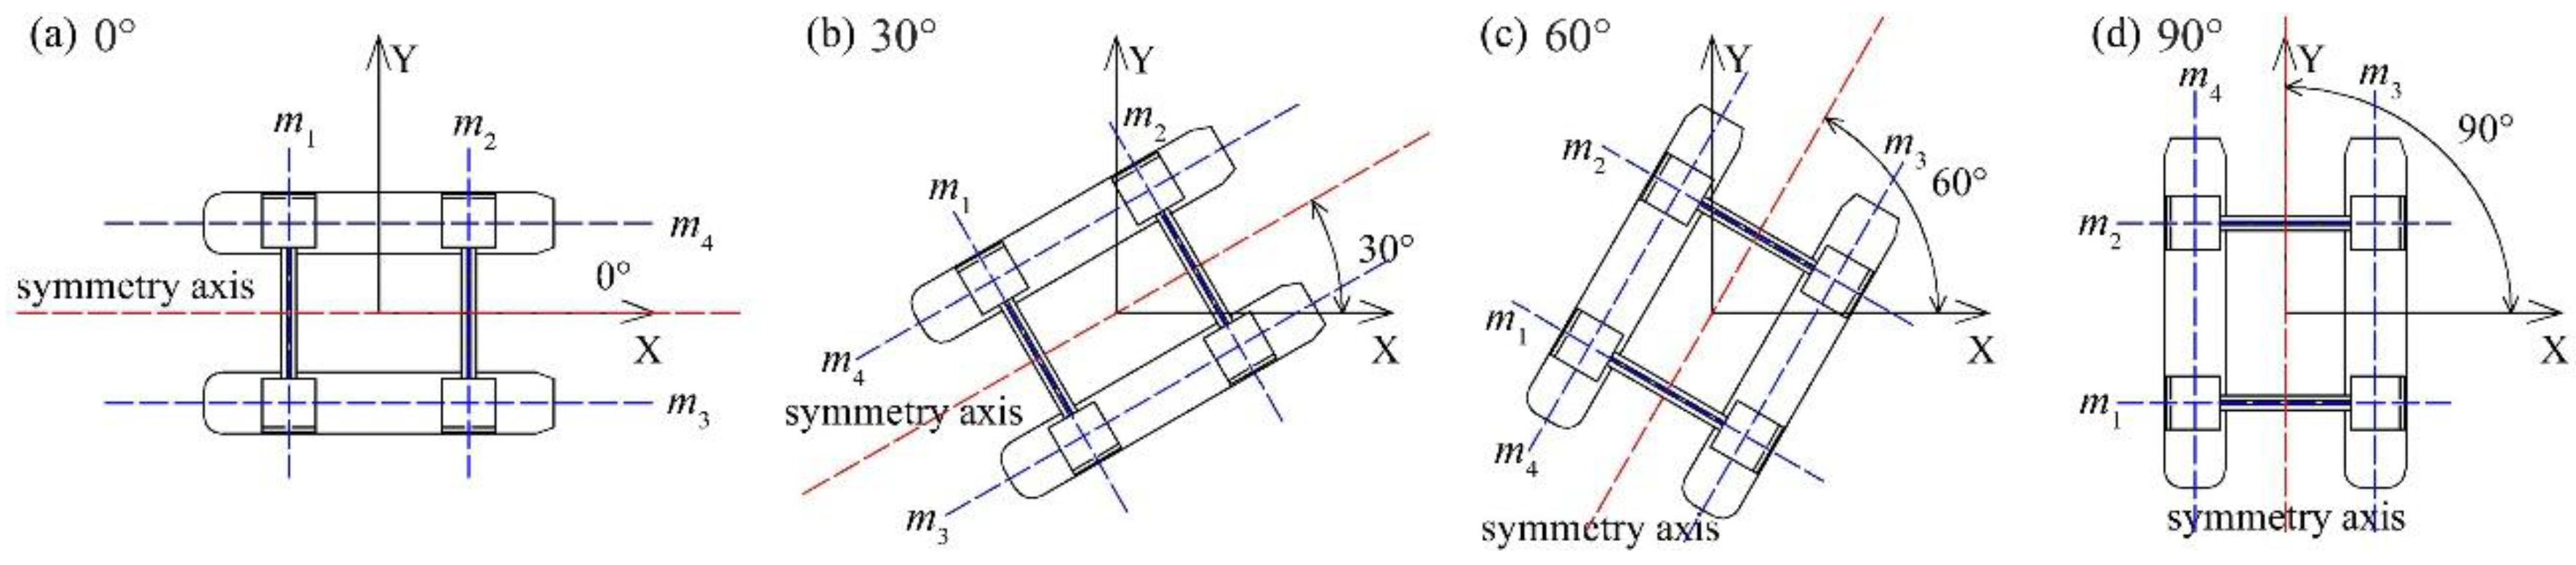
In the actual marine environment, the angle between the propagation direction of the ISW and the symmetrical axis of the semi-submersible platform is random. The differences of lead to the differences in the forces and the flow field around the platform. In this section, different angles including 0°, 30°, 60° and 90° between the ISW propagation direction and the symmetrical axis of the platform are considered. Figure 12 provides a detailed description of the arrangement of the platform. The size and draft of the platform remain unchanged. Four observation sections including , , , and were set up to facilitate the analysis of the flow field around the platform. The size of the wave tank, parameters of the stratified fluid and the ISW amplitude used in this Section are the same as the Case A2 in Section 3.
4.1. Analysis of Forces on the Platform Located at Different Angles
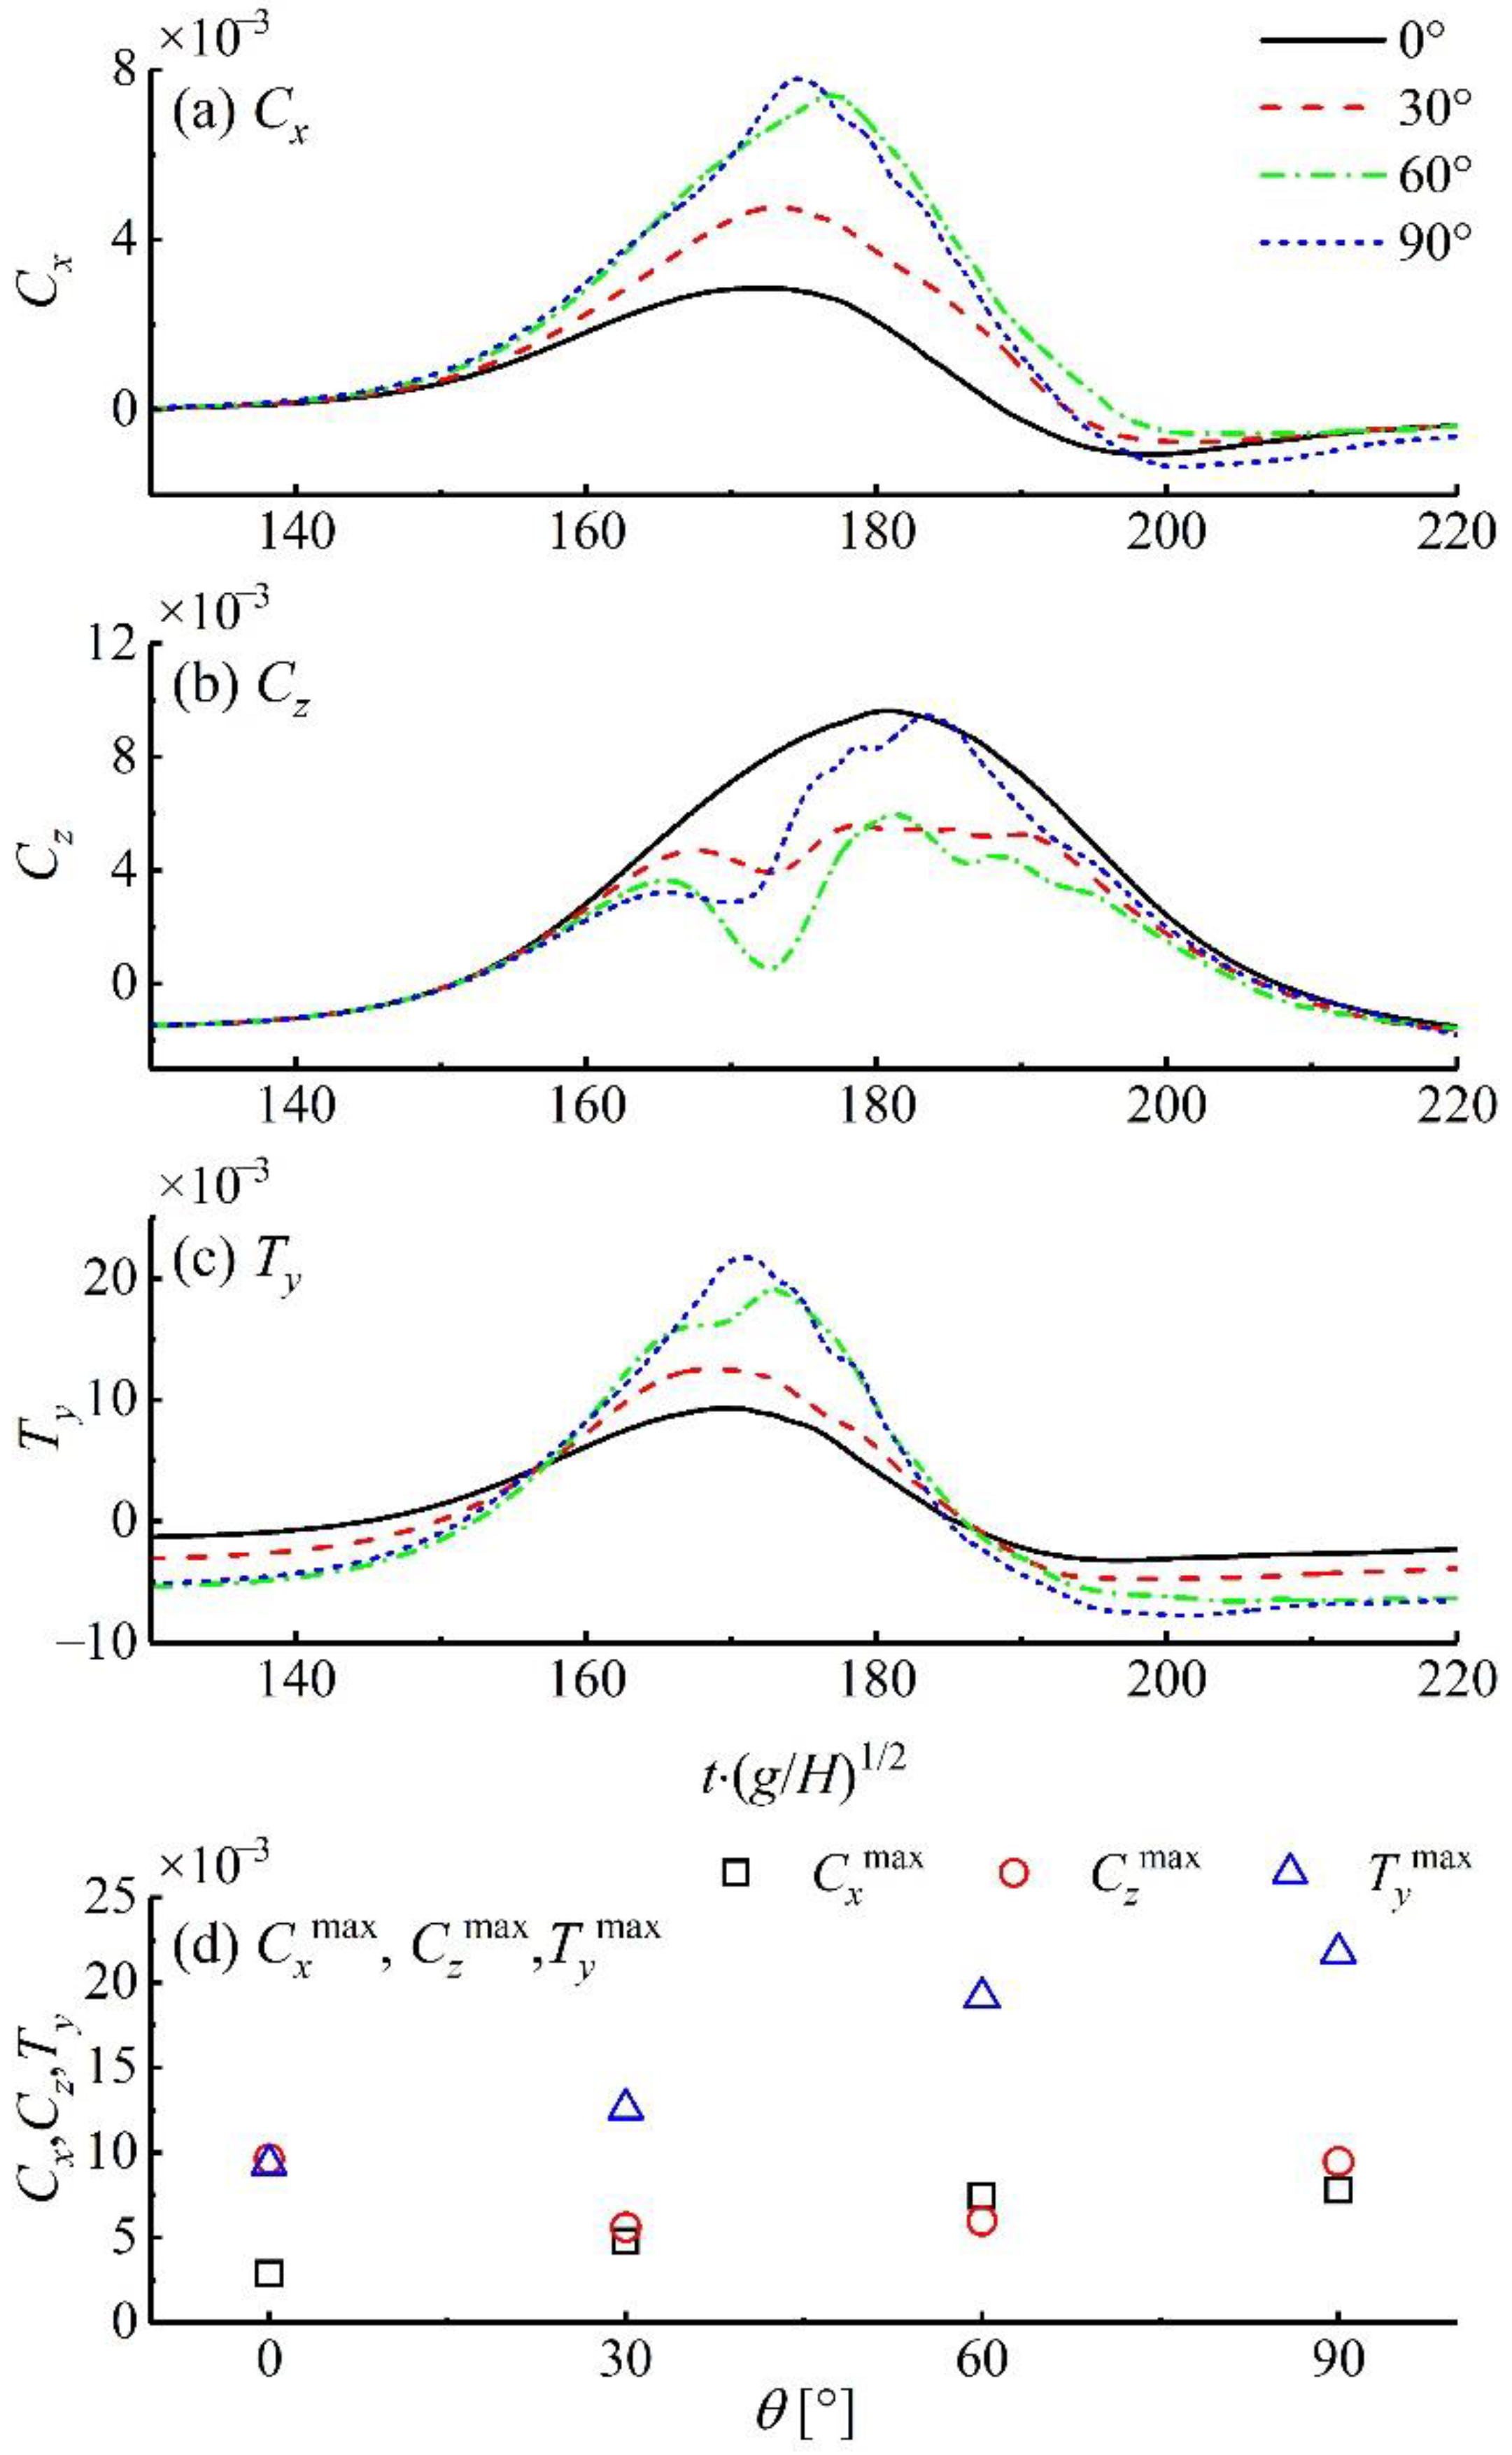
To compare the hydrodynamic loads on the semi-submersible platform located at different angles , Figure 13 describes the forces and torques on the platform. Figure 13a illustrates that the on the platform increased with the increases in the . The law of the change can be revealed by the changes of the projection area of the platform on the y-axis. For vertical forces, as described in Figure 13b, the platforms located at 0°- and 90°-direction are higher than those on the platforms located at 30°- and 60°-direction. on the platforms located at the 30°-, 60°- and 90°-direction showed significant oscillations during the ISW propagation. Figure 13c indicates that the on the platform increased with the increases in the . From Figure 13d it can be seen that the and on the platform induced by the ISW propagation are maximum when is 90° and 0°, respectively. The platform subjects the maximum when the reaches 90°.
4.2. Flow Field around the Platform Located at Different Angles
To further analyze the flow field around the semi-submersible platform located at different angles induced by the ISW propagation, the vorticity and velocity fields around the platform are described in Figure 14, Figure 15 and Figure 16 and Appendix B. = 173.8 is the moment when the platform located at the 0°-direction subjects the maximum vertical force.
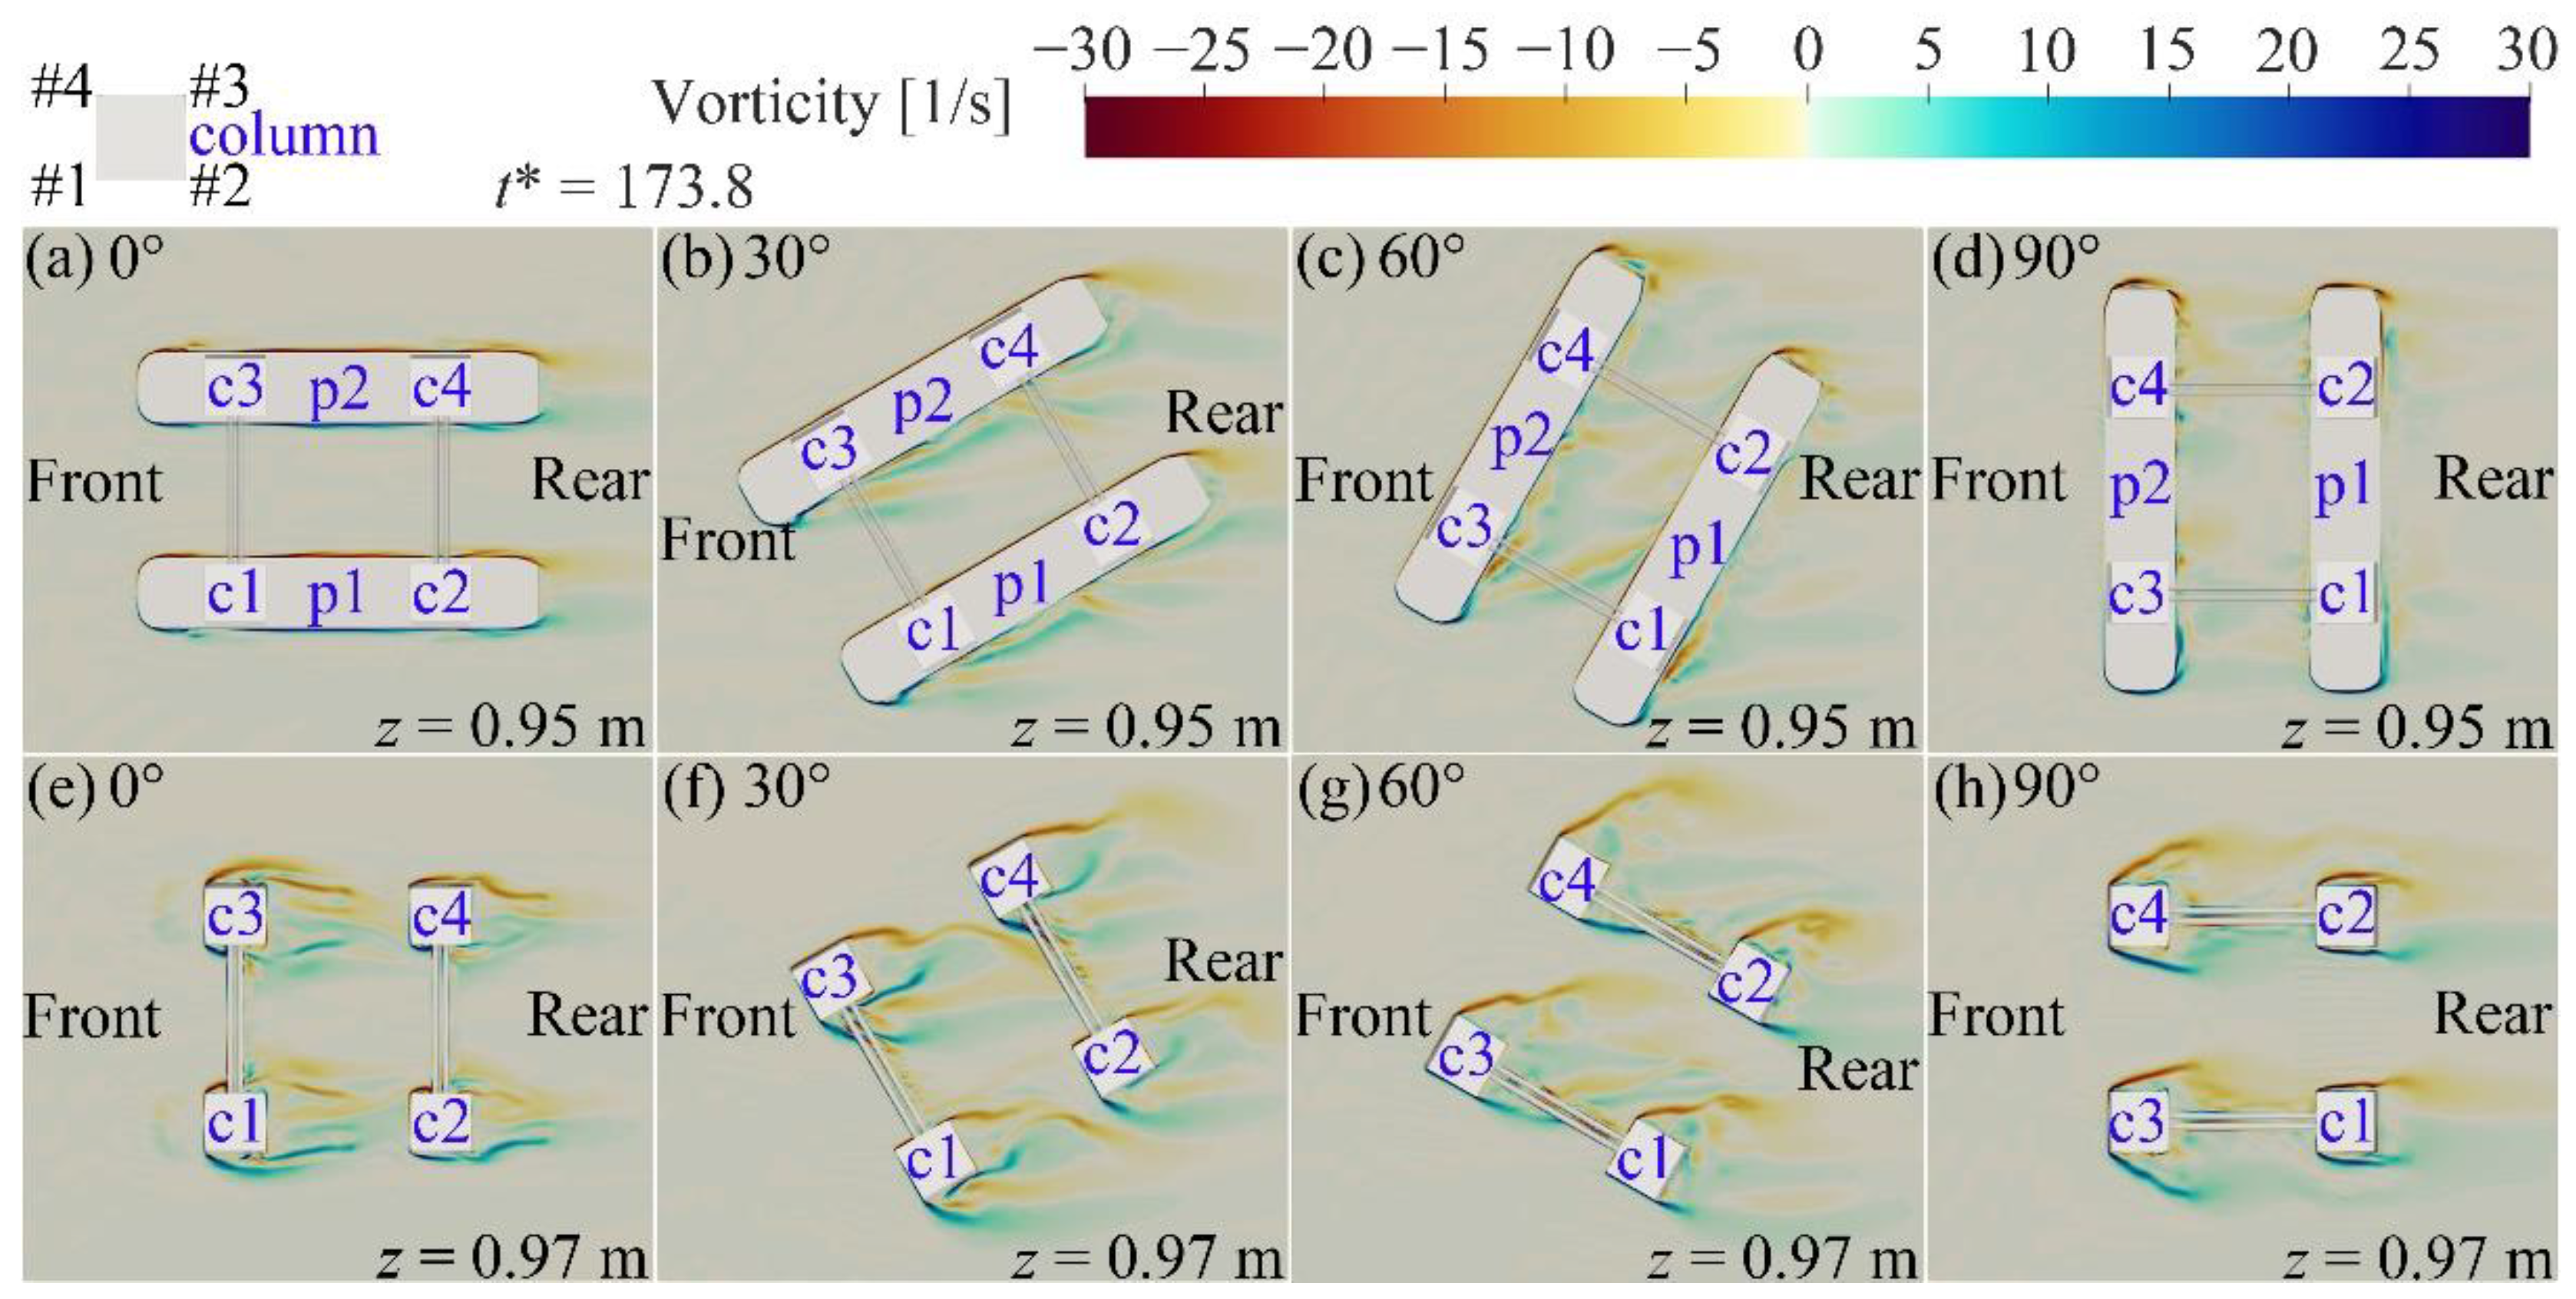
Figure 14 illustrates the vorticity fields around the platform at = 0.95 m and = 0.97 m. The four corners of the column are marked with #1–#4 in the counterclockwise order, as shown in Figure 14. Distributions of the vorticity field around the platform located at different angles are significantly different. The vorticity fields around the same kind components of each platform are similar. Figure 14a,d,e,h indicates that the distributions of vorticity fields around the platforms located at 0°- and 90°-direction are symmetrical along the section in = 0.3 m. For platforms located at the 30°- and 60°-direction, as described in Figure 14b,c,f,g, distributions of the vorticity field are complicated. Figure 14 indicates that vortexes shedding around the platform located at different can be observed. Figure 14a–d illustrate that the phenomena of vortexes shedding around the platforms located at the 30°- and 60°-direction are more visible than those around the platforms located at the 0°- and 90°-direction. The range of vortex shedding around the front columns is greater than that of the rear columns (Figure 14e–h). The vortexes shedding can be observed near each corner of the column, as shown in Figure 14e,h. There is no noticeable vortex shedding near the #4 corner of each column (Figure 14f). For the platform located at the 60°-direction, vortexes shedding occurred near the #1 and #3 corners of each column (Figure 14g). Figure 14e–h indicates that the strength of the interactions between positive and negative vortices near the connection between the bracing and column decreases with the increases in the .
Figure 15 describes vorticity fields around the platform at sections and . The complexities of vorticity fields around the platforms located at the 30°- and 60°-direction are higher than those around the platforms located at the 0°- and 90°-direction. The vorticity field around the platform is symmetrically distributed along the section in = 0.3 m only when the is 0°. Distributions of the vorticity field at sections and around the platform located at 90°-direction are almost the same. From Figure 15, it can be seen that the strength and range of interactions between positive and negative vortices around the platforms located at the 30°- and 60°-direction are greater than those around the platforms located at the 0°- and 90°-direction. The range of positive and negative vortices near the pontoon lower side increased with the increases in the . The strength of the interactions between positive and negative vortices near the connection of the column and bracing of the platforms located at the 0°- and 30°-direction is higher than that near the connection of the column and bracing of the platforms located at the 60°- and 90°-direction.
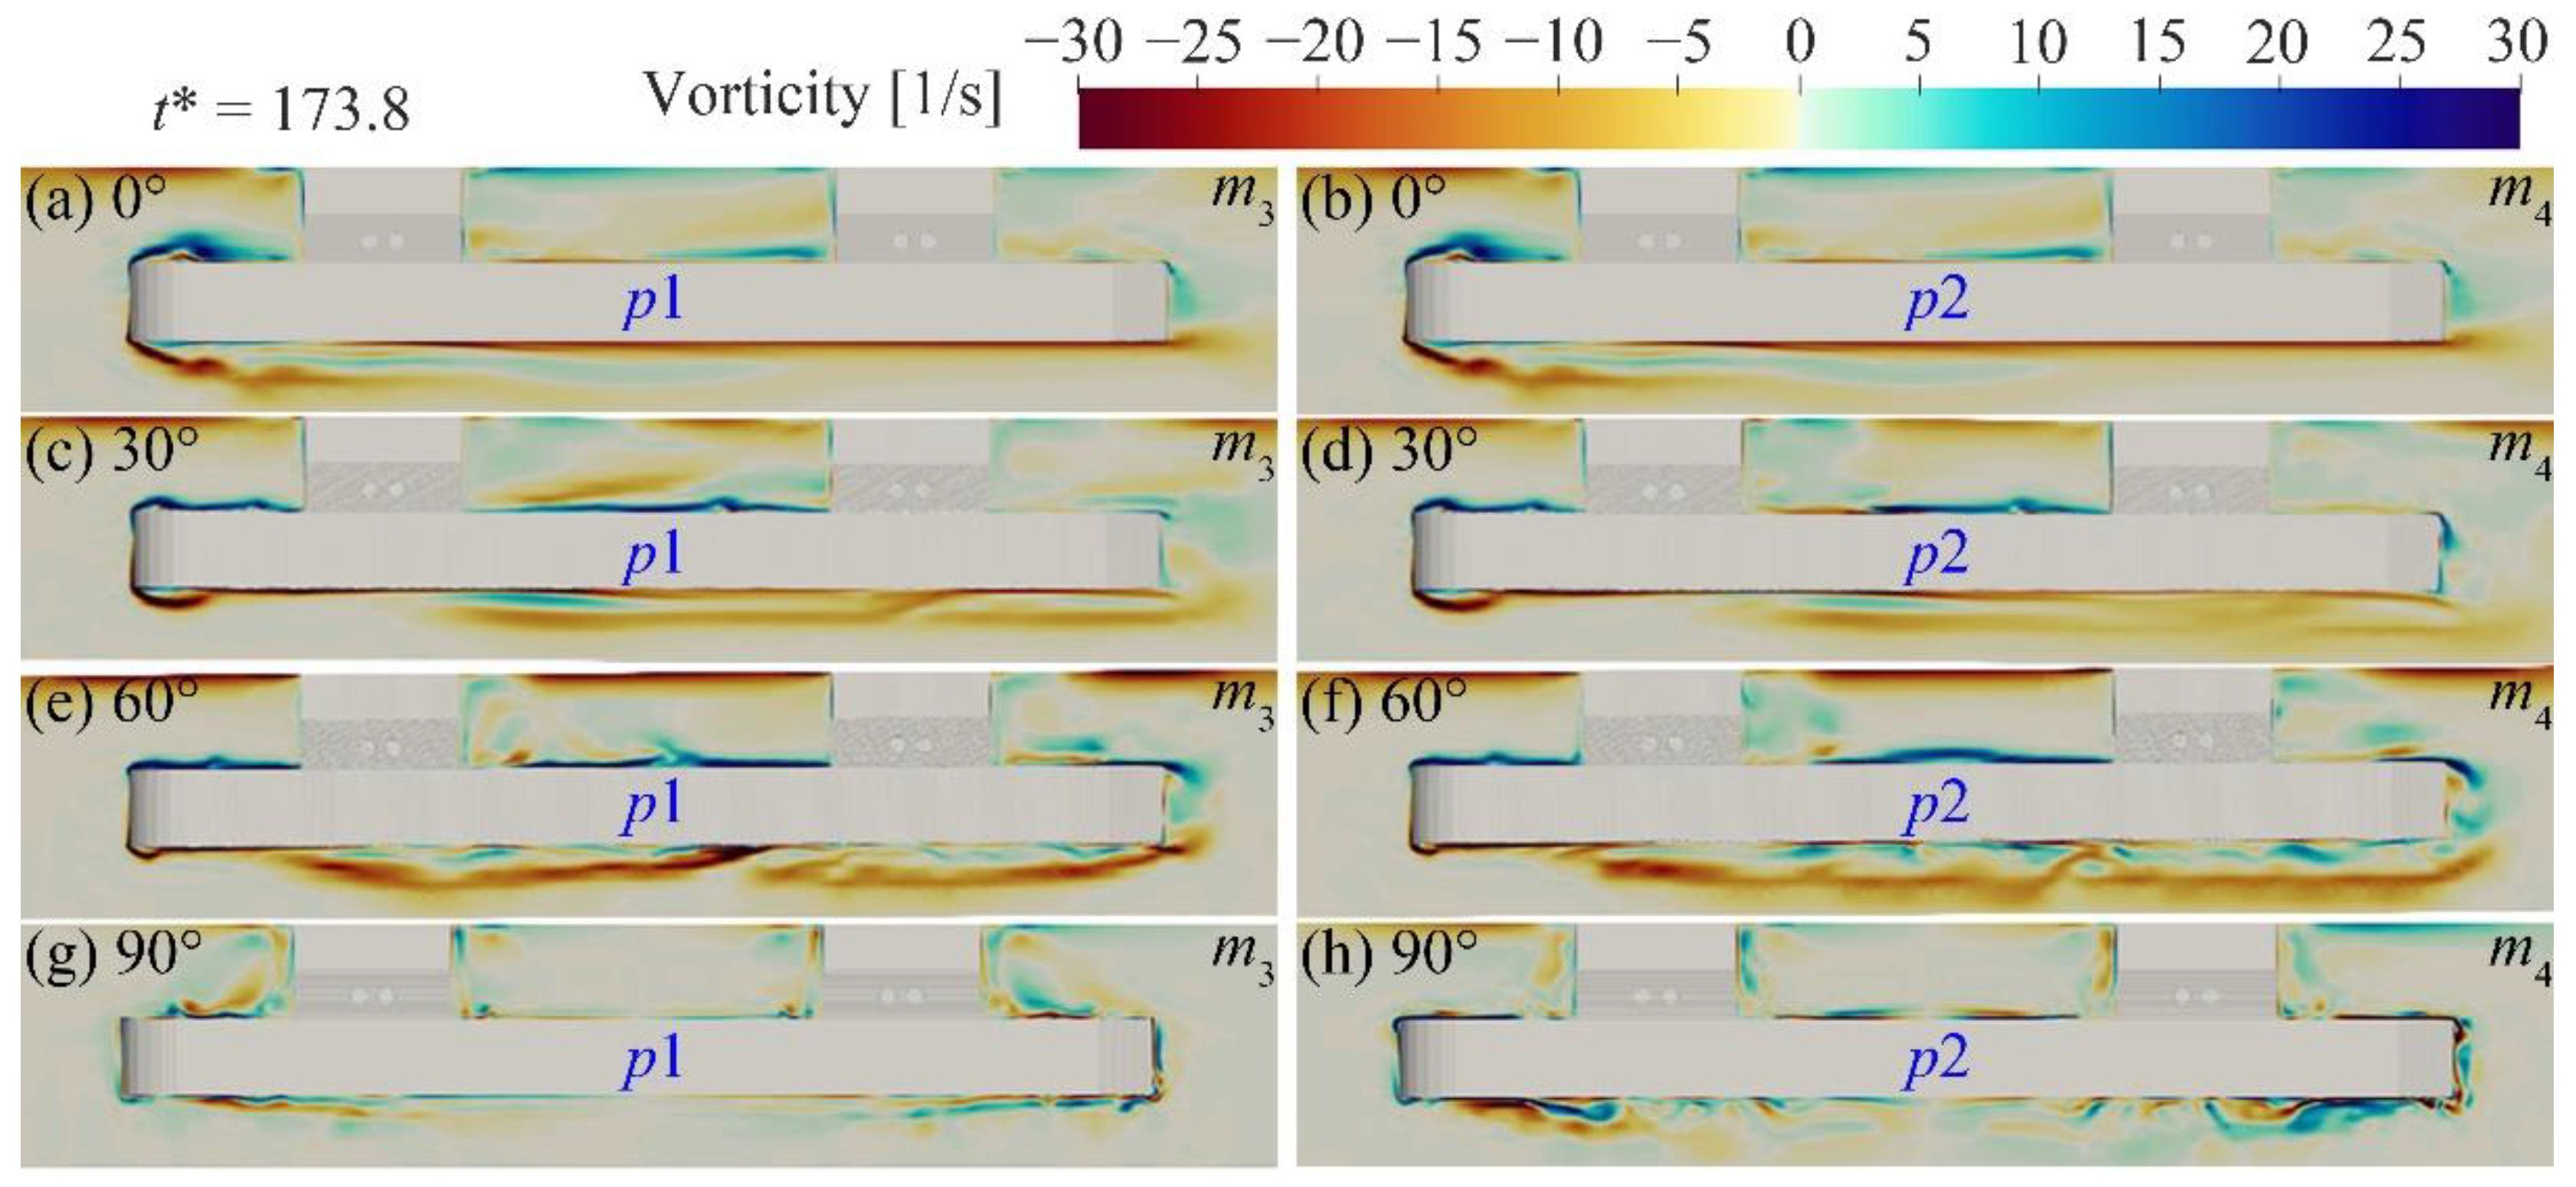
Figure 16 describes vorticity fields around the platform at sections and . Distributions of vorticity fields at sections and around the platform located at the 0°-direction are almost the same. Figure 16 indicates that ranges of positive and negative vortices near the front and rear edge of the pontoon decreased and increased, respectively, with the increases in the . Ranges of positive and negative vortices near the lower side of the pontoon of the platform located at 60°-direction are larger than those near the pontoons at the lower sides of the platforms located at other angles. The value and range of vortices between columns near upper sides of the pontoons of platforms located at the 30°- and 60°-direction are greater than those between columns near the upper sides of the pontoons of the platforms located at the 0°- and 90°-direction.
Analyses of Figure 14, Figure 15 and Figure 16 denote that, under the same ISW system, the vorticity field around the platform becomes more complicated when the symmetry axis of the platform is not parallel to the ISW propagation direction. The complexity of interactions between positive and negative vortices around the platform increased with the occurrence of the angle between the ISW propagation direction and the symmetry axis of the platform. Compared with the laboratory scale, the flow field around the platform induced by the ISW propagation in the actual ocean scale is more complicated. The fatigue and fracture of the platform caused by the long-term vortices around the platform induced by the ISW propagation in the actual marine engineering structure deserves additional attentions.
5. Conclusions
A 3D numerical wave tank based upon the Navier-Stokes equations is established to simulate the interactions between an ISW and the semi-submersible platform. The ISW is generated by using the mKdV theory. The hydrodynamic forces and the flow field around the platform were revealed. The main conclusions are summarized as follows:
1. The hydrodynamic forces on the platform increase with the increases in the ISW amplitude. Forces and torque acting on the platform decrease with the increases in the fluid depth ratio. For the case of h1:h2 = 20:80, when the ISW amplitude increases approximately 4.25 times, the horizontal force, vertical force and torque increase approximately 255.6%, 146.3%, and 266.9%, respectively. The pressure mainly contributes to the force exerted by the ISW propagation on the platform. The components of viscous force in the horizontal and the vertical directions are apparent and negligible, respectively. The horizontal forces on bracings are negligible. Almost all the vertical forces on the platform are derived from those on pontoons.
2. Both the horizontal forces and torque on the platform increase with the increases in the angle between the ISW propagation direction and the symmetrical axis of the platform under the same ISW condition. When is 90°, the maximum horizontal force and torque increase approximately 2.7 and 2.3 times, respectively, compared with the case of is 0°. The platform subjects the maximum vertical force when the is 0°. The distribution of dynamic pressures around the platform located at the 0°-direction is symmetrical along the section in = 0.3 m.
3. Visible vortexes shedding around the platform can be observed. Interactions between positive and negative vortices around the connection between the bracing and column are obvious. The significant reduction in magnitudes of velocities occurs around the platform.
4. Under the same ISW condition, the flow field around the platform becomes more complicated when the symmetry axis of the platform is not parallel to the ISW propagation direction. Flow fields around the same kind components of each platform are similar. Distributions of velocity and vorticity fields around the platforms located at the 0° and 90°-direction are approximate symmetrical along the section in = 0.3 m. The range and complexity of interactions between positive and negative vortices around platforms located at the 30°- and 60°-directions are greater than those around platforms located at the 0°- and 90°-directions.
The flow field around the platform is rather complex in the actual internal wave environment. Although this paper only investigates the hydrodynamic loads and the flow field around the semi-submersible platform induced by the ISW propagation in the laboratory scale, the research results have possible implications for the platform operation in the actual internal wave environment. In addition to the hydrodynamic loads acting on the platform, the long-term existence of vortices induces fatigue and fracture damage to the platform.
Author Contributions
Conceptualization, W.D. and C.A.; validation, W.D. and J.L.; formal analysis, W.D.; investigation, W.D.; writing—original draft preparation, W.D.; writing—review and editing, W.D., C.A. and S.J. All authors have contributed substantially to the work reported. All authors have read and agreed to the published version of the manuscript.
Funding
This research was funded by the National Natural Science Foundation of China, grant number 51739011; and Fundamental Research Funds for the Central Universities, grant number DUT18ZD401.
Conflicts of Interest
The authors declare no conflict of interest.
Appendix A. The Velocity Field around the Platform Located at 0°
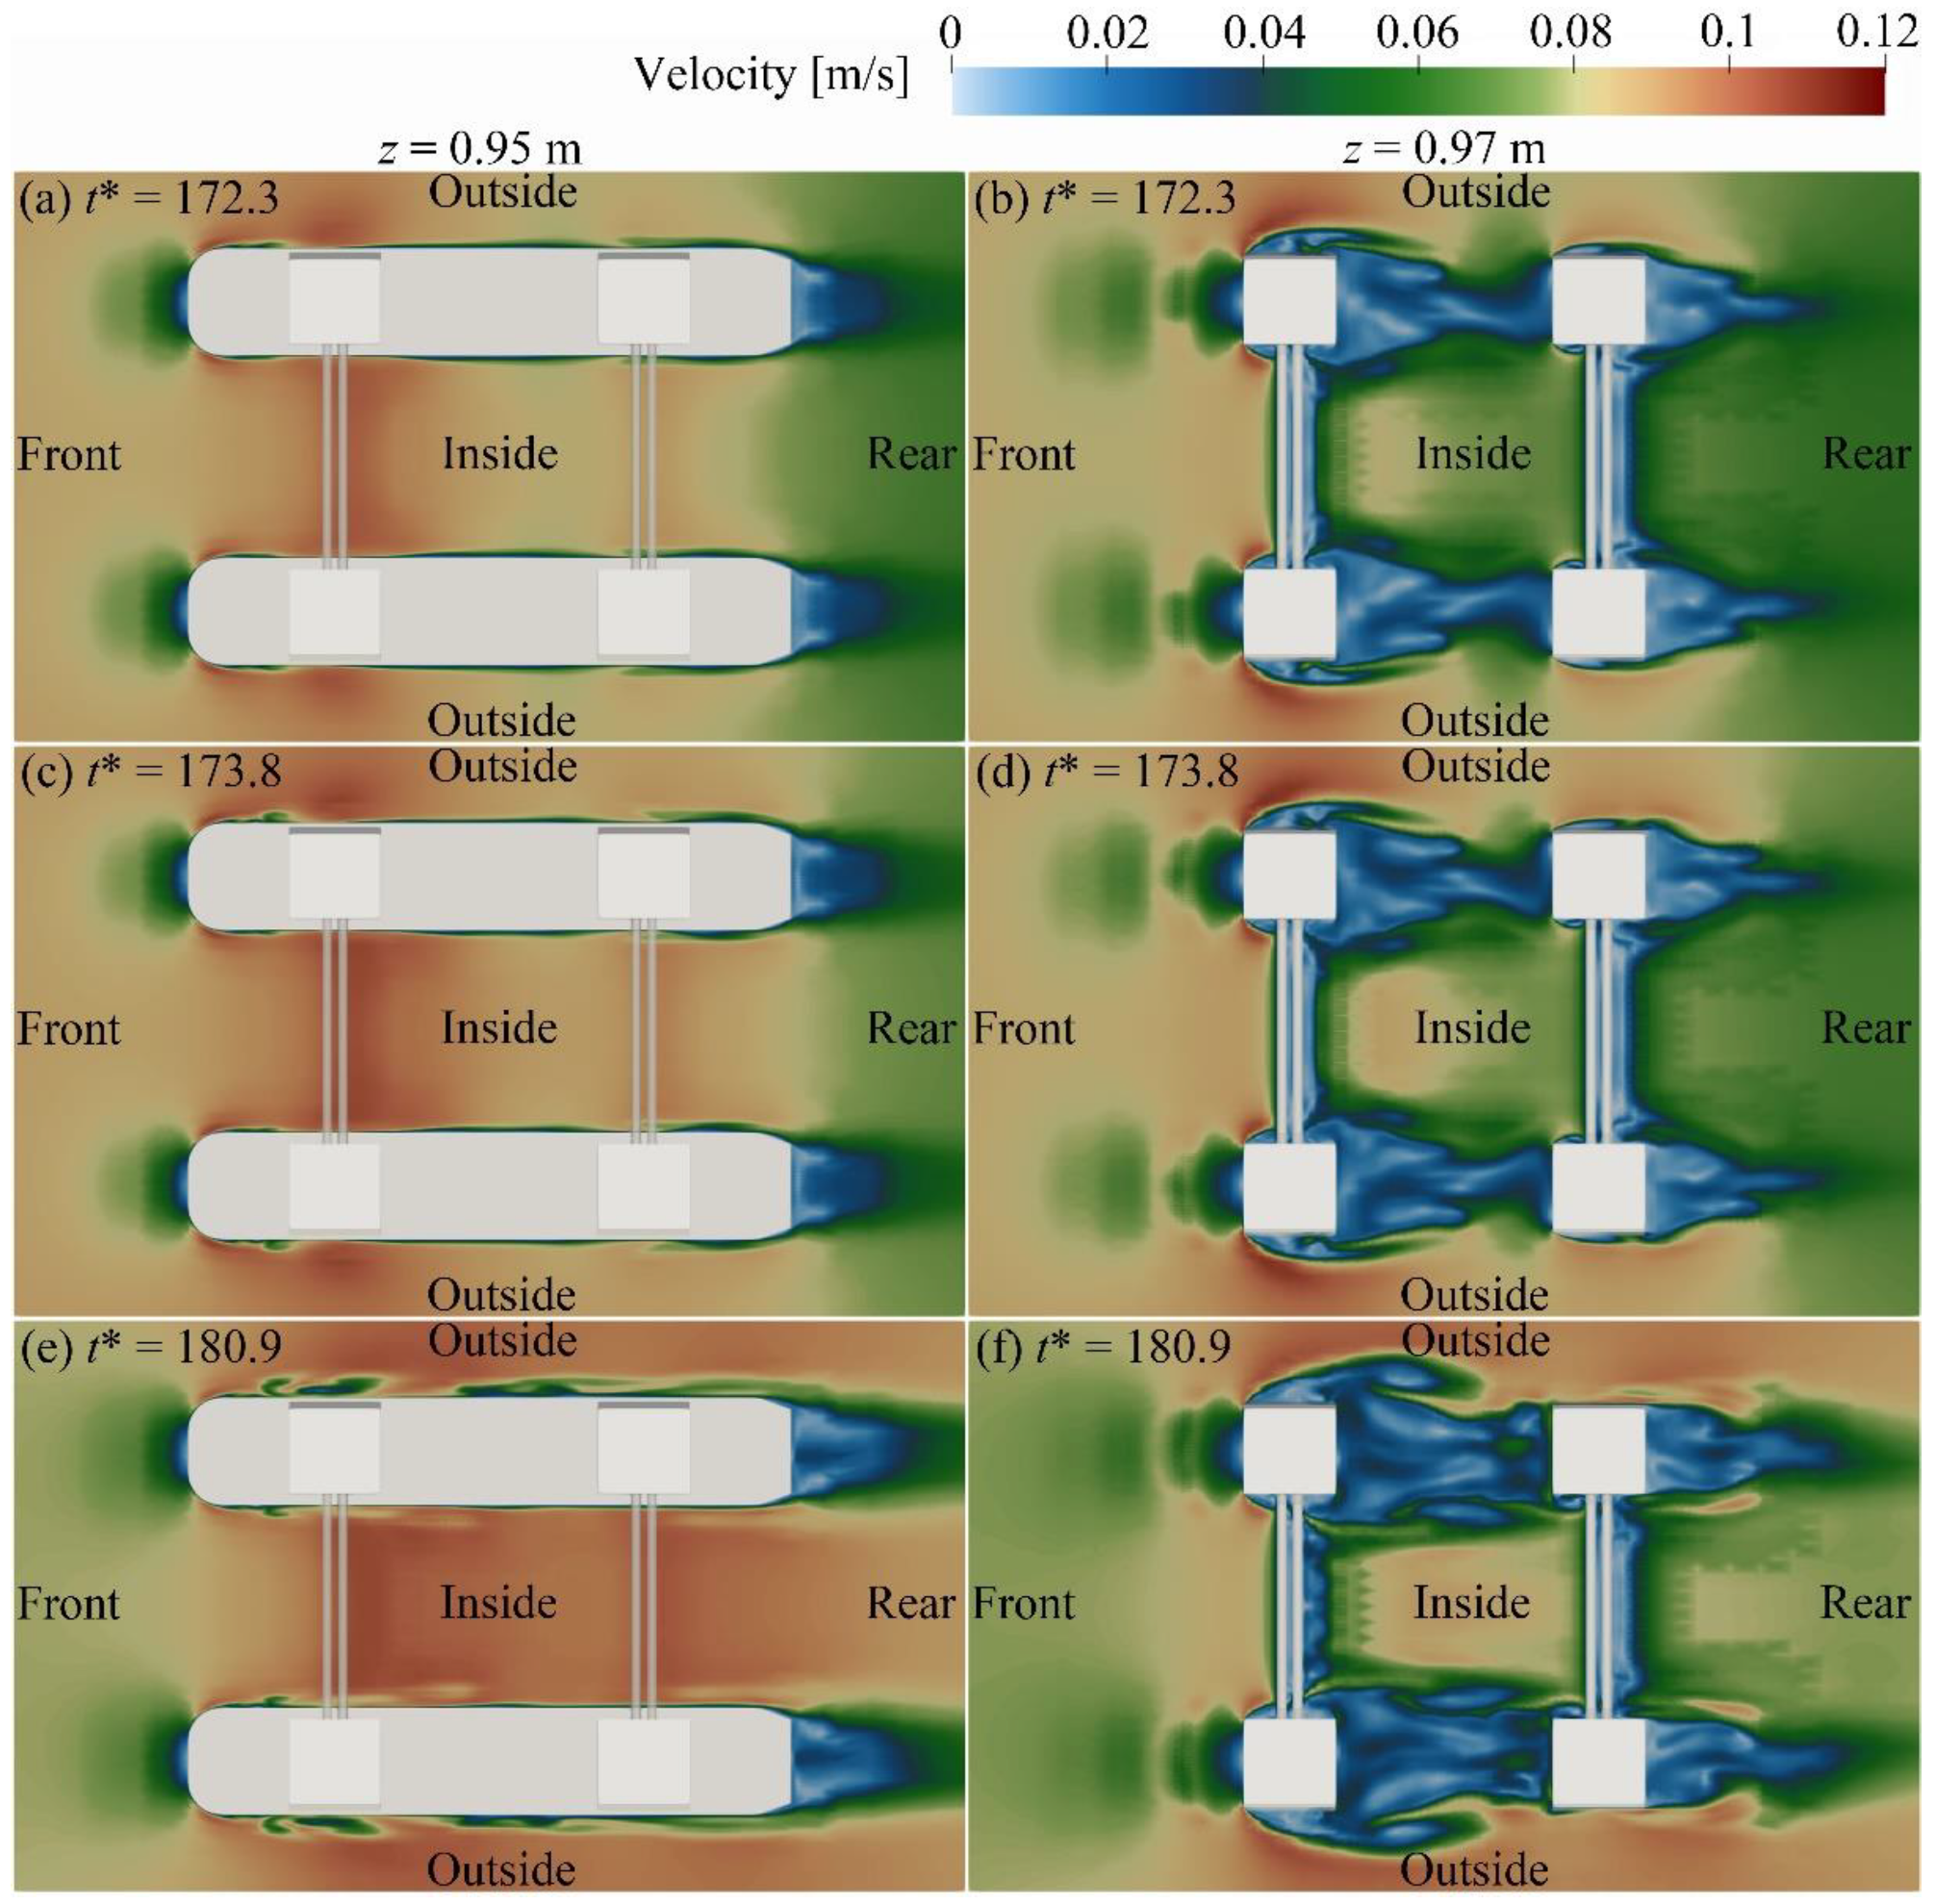
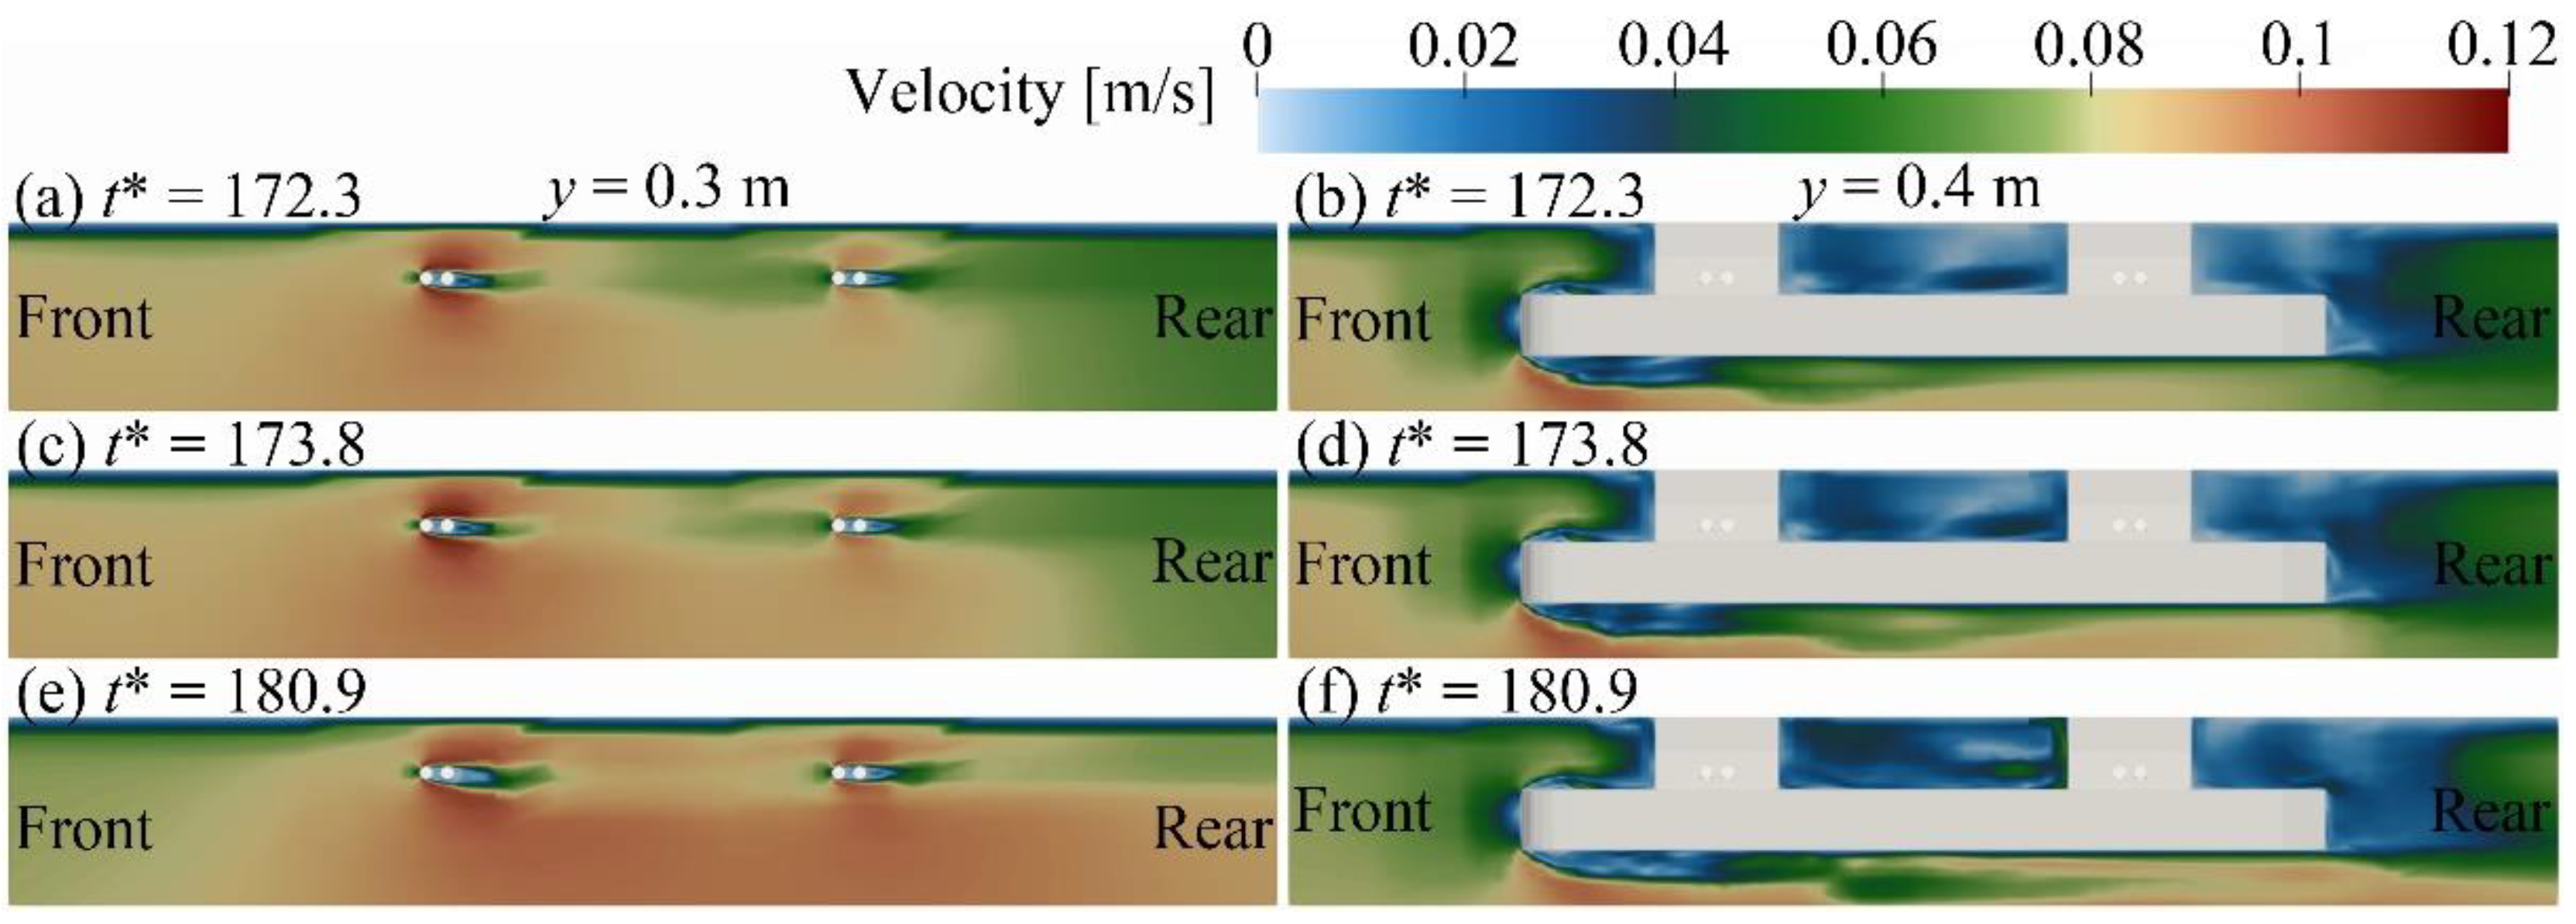
This appendix presents the velocity field around the semi-submersible platform induced by the ISW propagation at = 172.27, 173.83, and 180.88. The display of the velocity field around the platform makes the investigation on the flow field more abundant. Figure A1 illustrates the velocity field around the platform at the sections in = 0.95 m and = 0.97 m. From Figure A1 it can be seen that distributions of the velocity field around the platform are approximate symmetrical along the section in = 0.3 m. With the ISW propagation, there are significant reductions in magnitudes of velocities around the front and the rear edges of the platform (Figure A1 left panel). From the right panel of Figure A1 it can be seen that the range of velocities reduction between the front and the rear columns gradually increases with the ISW propagation. Figure A2 describes the velocity field around the semi-submersible platform at the sections in = 11.90 m and = 12.10 m. The range of the velocities reduction around the front and the rear edges of the platform gradually increases and decreases, respectively, with the ISW propagation. The range of the velocities reduction outside the platform is larger than that inside the platform. Figure A3 shows the velocity field around the platform at the sections in = 0.3 m and = 0.4 m. The range of the velocity reduction behind bracings decreases with the ISW propagation. The right panel of Figure A3 indicates that apparent velocities reduction can be observed below the leading edge of the pontoon.
Figure A1.
Velocity around the platform at z = 0.97 m and z = 0.95 m for Case A2.

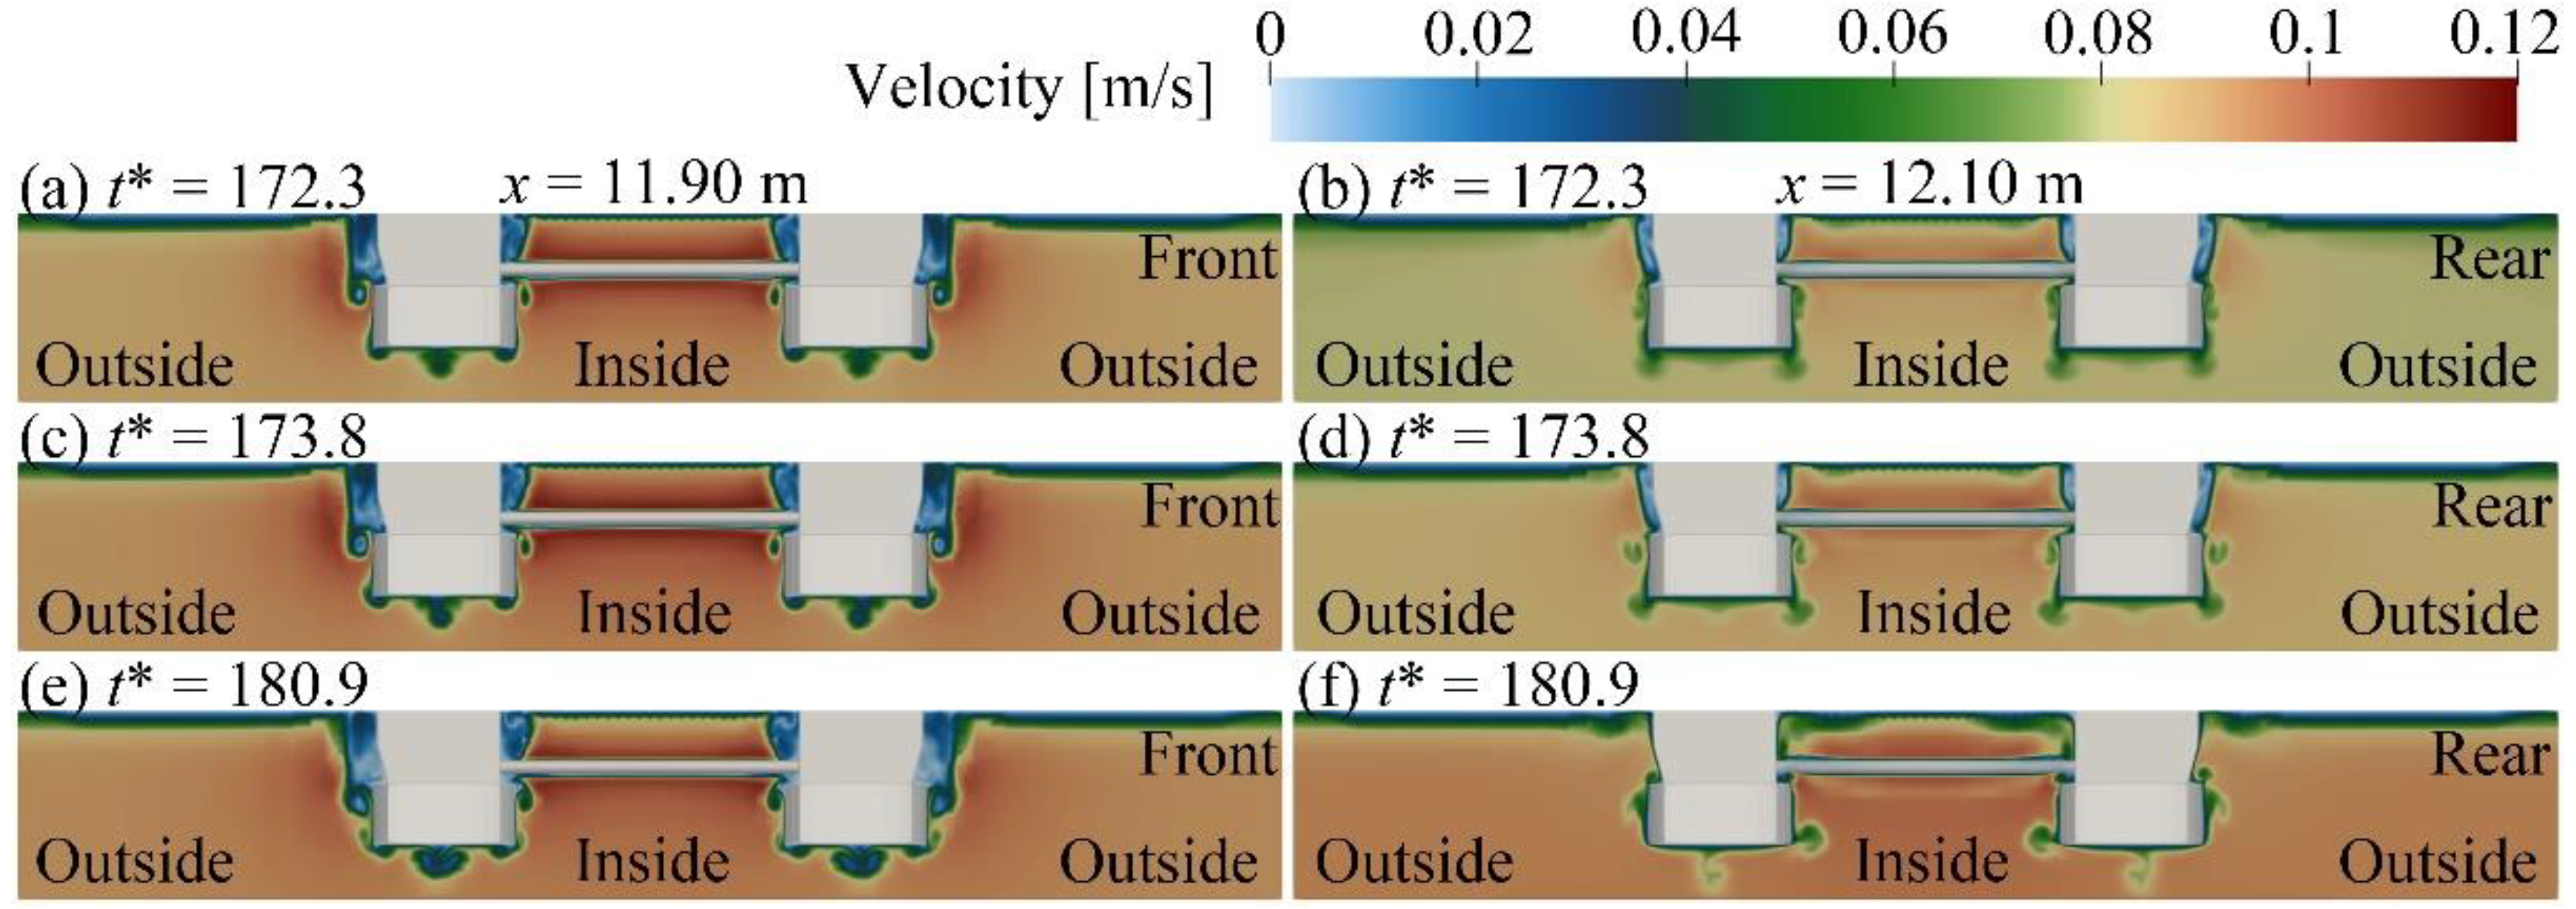
Figure A2.
Velocity around the platform at x = 11.90 m and x = 12.10 m for Case A2.

Figure A3.
Velocity around the platform at y = 0.3 m and y = 0.4 m for Case A2.

Appendix B. The Velocity Field around the Platform Located at Different Angles
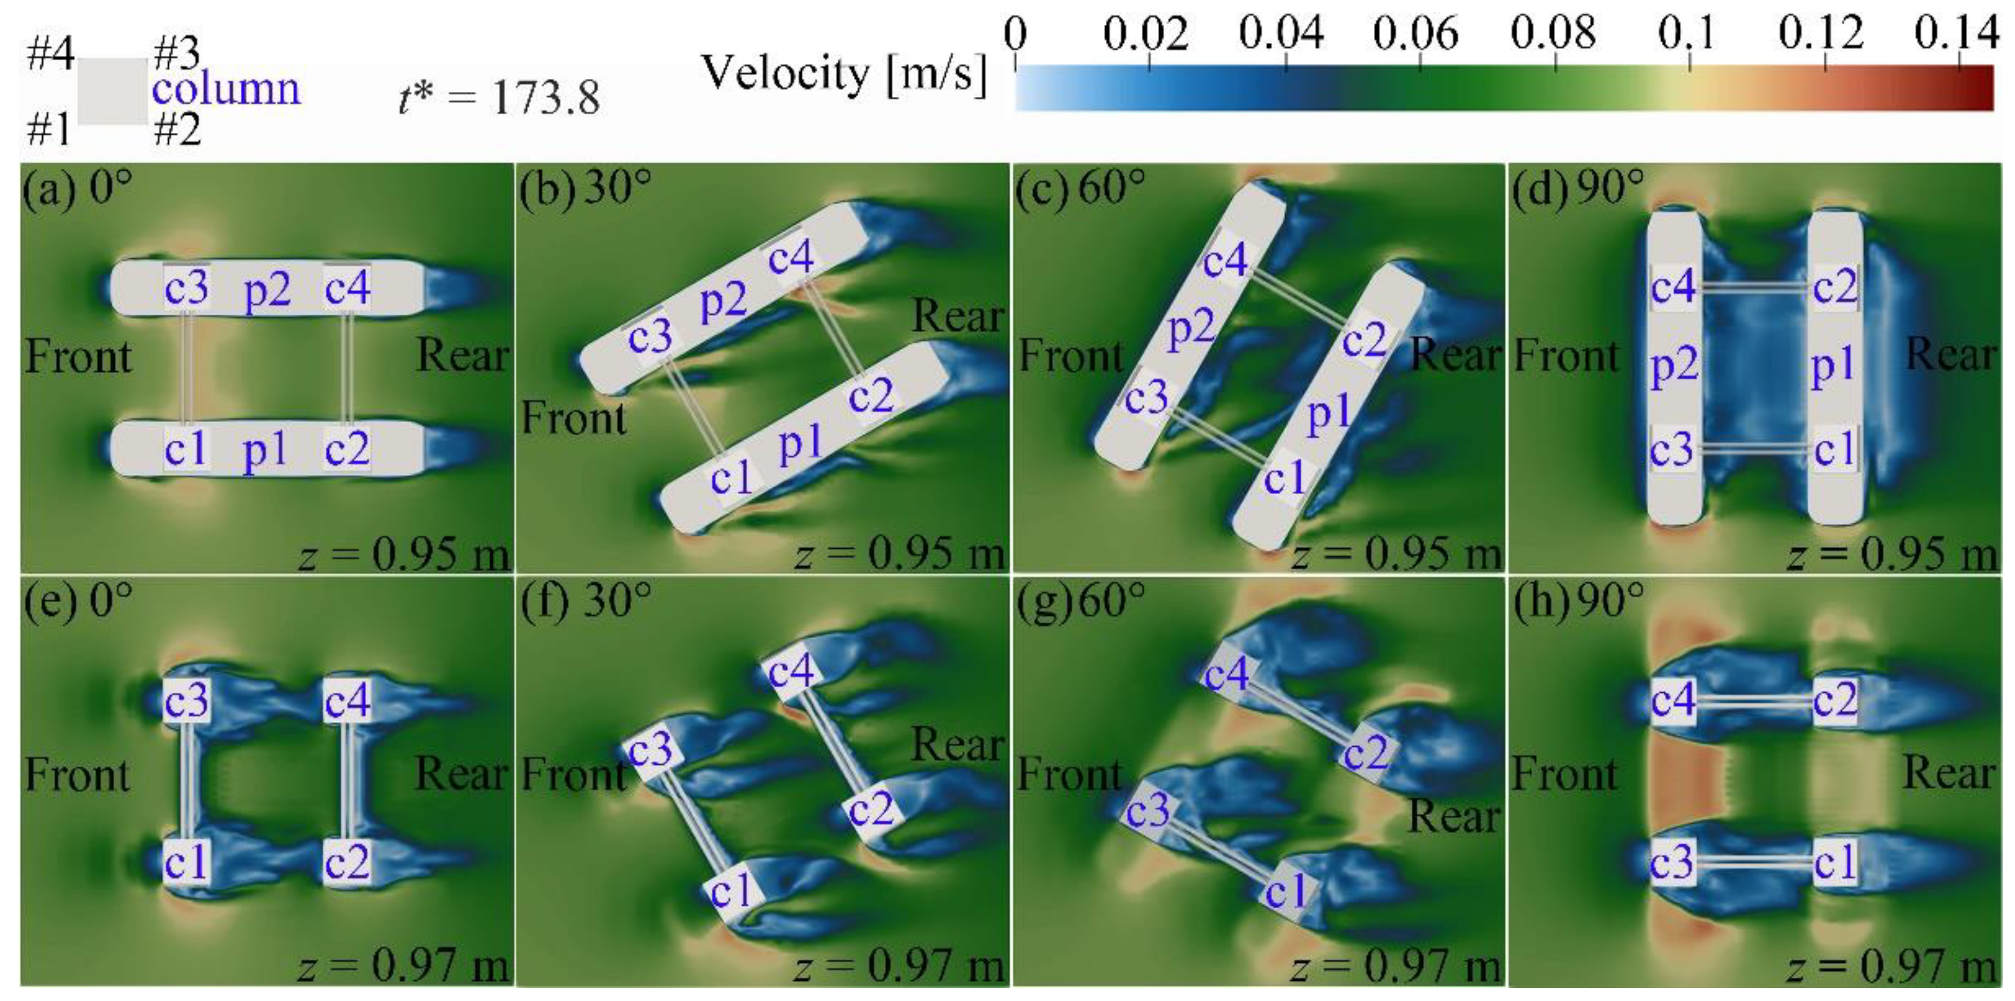
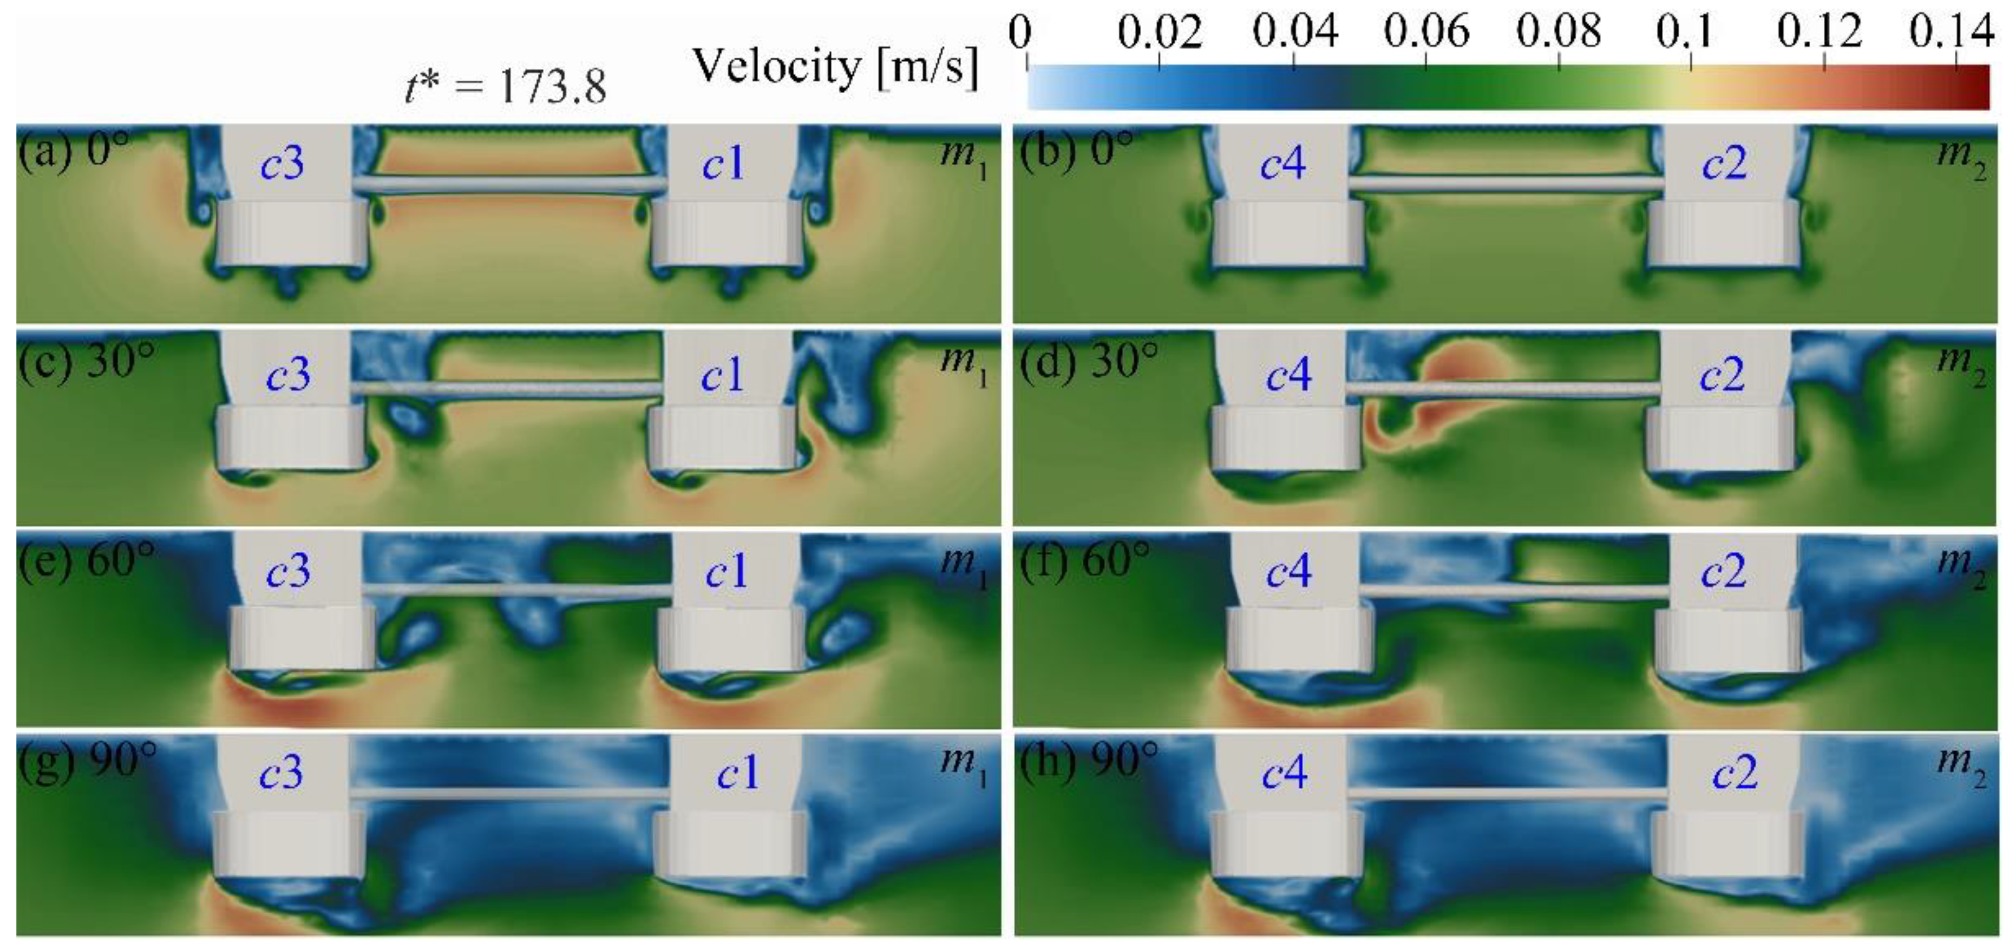
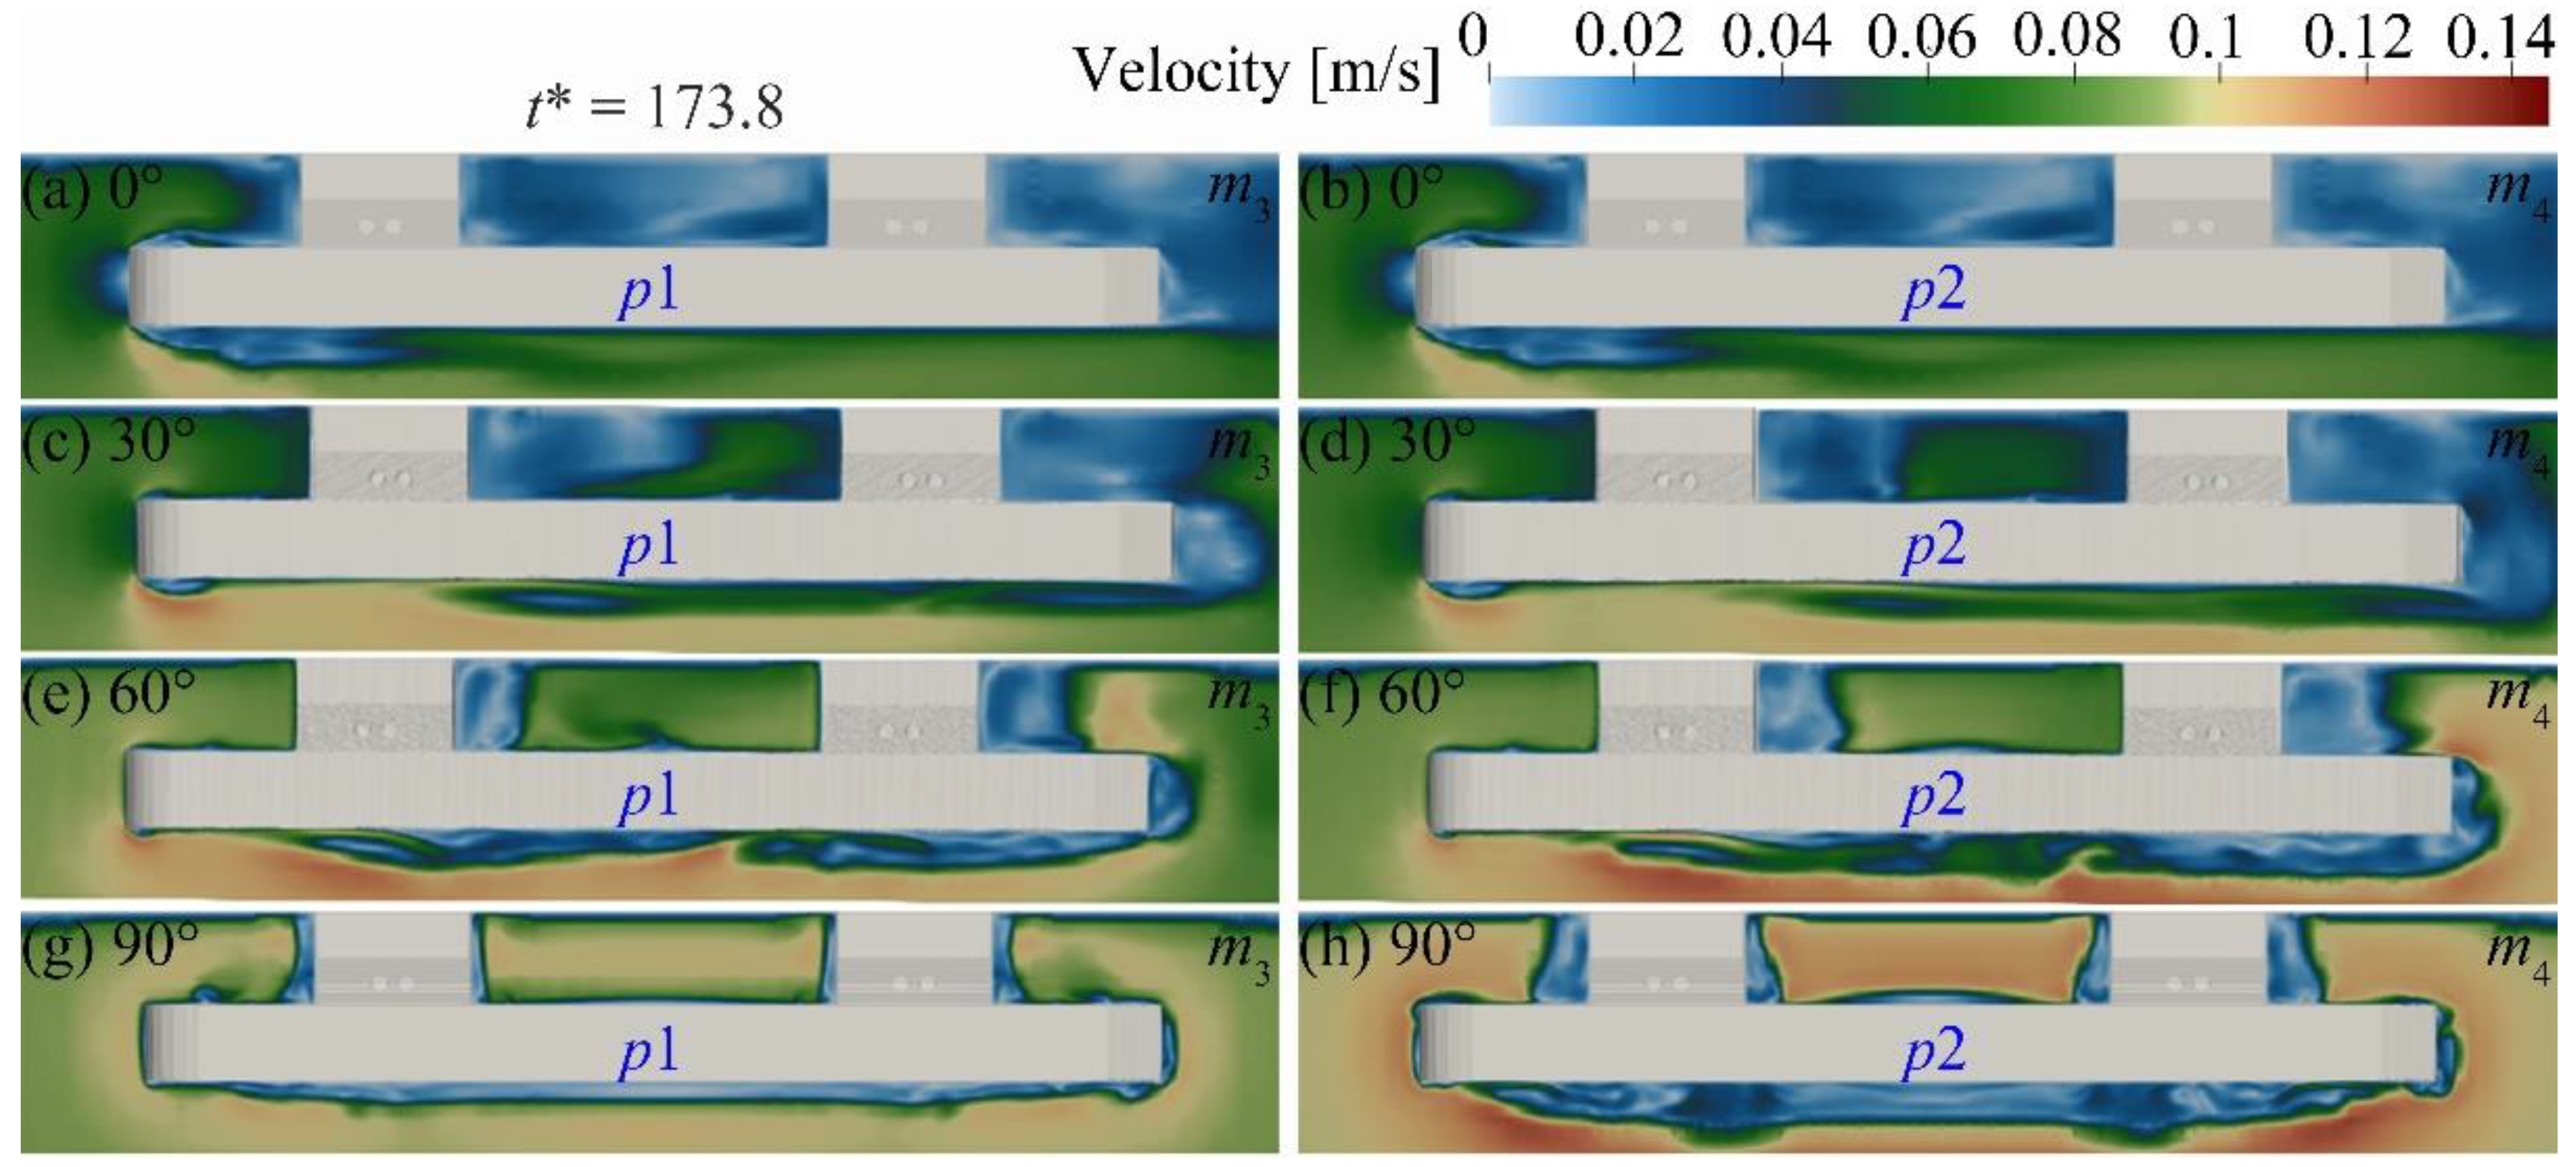
This appendix presents the velocity field around the semi-submersible platform located at different angles induced by the ISW propagation at = 173.83. Figure A4 illustrates the velocity field around the platform at the sections in = 0.95 m and = 0.97 m. The velocity fields around the same kind components of each platform are similar. The distributions of the velocity fields around the platform located at the 30°- and 60°-direction are more complicated than those around the platform located at the 0°- and 90°-direction. Figure A4a–d indicates that the range of the velocity reduction around the platform increases with the increases in the . Figure A5 shows the velocity field around the platform at sections and . The range of the velocity reduction around the platform increases with the increases in the . For the platforms located at the 0°−60° directions, the complexities of the velocity reduction around the platform as section are greater than those around the platform as section . Distributions of the velocity field at sections and around the platform located at 90°-direction are almost the same. Figure A6 illustrates the velocity fields around the platform at sections and . The range of the velocity reduction around the platform decreases with the increases in the .
Figure A4.
Comparison of the velocity field around the semi-submersible platform at different angles at z = 0.95 m; z = 0.97 m.
Figure A4.
Comparison of the velocity field around the semi-submersible platform at different angles at z = 0.95 m; z = 0.97 m.

Figure A5.
Comparison of the velocity field around the semi-submersible platform at different directions at profile m1 and m2.
Figure A5.
Comparison of the velocity field around the semi-submersible platform at different directions at profile m1 and m2.

Figure A6.
Comparison of the velocity field around the semi-submersible platform at different angles at profile m3 and m4.
Figure A6.
Comparison of the velocity field around the semi-submersible platform at different angles at profile m3 and m4.

References
- Bole, J.; Ebbesmeyer, C.; Romea, R. Soliton currents in the South China Sea: Measurements and theoretical modeling. In Proceedings of the Offshore Techn ology Conference: Offshore Technology Conference, Houston, TX, USA, 2–5 May 1994. [Google Scholar]
- Roberts, J. Internal Gravity Waves in the Ocean; Alaska Univ College Inst Of Marine Science: Fairbanks, AK, USA, 1975. [Google Scholar]
- Song, Z.; Teng, B.; Gou, Y.; Lu, L.; Shi, Z.; Xiao, Y.; Qu, Y. Comparisons of internal solitary wave and surface wave actions on marine structures and their responses. Appl. Ocean. Res. 2011, 33, 120–129. [Google Scholar] [CrossRef]
- Osborne, A.R.; Burch, T.L. Internal Solitons in the Andaman Sea. Science 1980, 208, 451–460. [Google Scholar] [CrossRef] [PubMed]
- Ebbesmeyer, C.; Coomes, C.A.; Hamilton, R.; Kurrus, K.A.; Sullivan, T.C.; Salem, B.L.; Romea, R.D.; Bauer, R.J. New observations on internal waves (solitons) in the South China Sea using an acoustic Doppler current profiler. Mar. Technol. Soc. 91 Proc 1991, 11, 165–175. [Google Scholar]
- Zhang, H.; Li, J. Wave loading on floating platforms by internal solitary waves. In New Trends in Fluid Mechanics Research; Springer: Berlin, Germany, 2007; pp. 304–307. [Google Scholar]
- Faltinsen, O. Sea Loads on Ships and Offshore Structures; Cambridge University Press: Cambridge, UK, 1993. [Google Scholar]
- Kvittem, M.I.; Bachynski, E.E.; Moan, T. Effects of hydrodynamic modelling in fully coupled simulations of a semi-submersible wind turbine. Energy Procedia 2012, 24, 351–362. [Google Scholar] [CrossRef] [Green Version]
- Li, Y.; Dong, G.; Liu, H.; Sun, D. The reflection of oblique incident waves by breakwaters with double-layered perforated wall. Coast. Eng. 2003, 50, 47–60. [Google Scholar] [CrossRef]
- Faraci, C.; Cammaroto, B.; Cavallaro, L.; Foti, E. Wave reflection generated by caissons with internal rubble mound of variable slope. Coast. Eng. Proc. 2012, 1, 51. [Google Scholar] [CrossRef] [Green Version]
- Liu, Y.; Faraci, C. Analysis of orthogonal wave reflection by a caisson with open front chamber filled with sloping rubble mound. Coast. Eng. 2014, 91, 151–163. [Google Scholar] [CrossRef]
- Faraci, C.; Scandura, P.; Foti, E. Reflection of sea waves by combined caissons. J. Waterw. Port Coast. Ocean Eng. 2014, 141, 04014036. [Google Scholar] [CrossRef]
- Cai, S.; Long, X.; Gan, Z. A method to estimate the forces exerted by internal solitons on cylindrical piles. Ocean Eng. 2003, 30, 673–689. [Google Scholar] [CrossRef]
- Cai, S.; Long, X.; Wang, S. Forces and torques exerted by internal solitons in shear flows on cylindrical piles. Appl. Ocean Res. 2008, 30, 72–77. [Google Scholar] [CrossRef]
- Cai, S.; Wang, S.; Long, X. A simple estimation of the force exerted by internal solitons on cylindrical piles. Ocean Eng. 2006, 33, 974–980. [Google Scholar] [CrossRef]
- Xie, J.; Jian, Y.; Yang, L. Strongly nonlinear internal soliton load on a small vertical circular cylinder in two-layer fluids. Appl. Math. Model. 2010, 34, 2089–2101. [Google Scholar] [CrossRef] [Green Version]
- Si, Z.; Zhang, Y.; Fan, Z. A numerical simulation of shear forces and torques exerted by large-amplitude internal solitary waves on a rigid pile in South China Sea. Appl. Ocean Res. 2012, 37, 127–132. [Google Scholar] [CrossRef]
- Xu, Z.; Yin, B.; Yang, H.; Qi, J. Depression and elevation internal solitary waves in a two-layer fluid and their forces on cylindrical piles. Chin. J. Oceanol. Limnol. 2012, 30, 703–712. [Google Scholar] [CrossRef]
- Chen, M.; Chen, K.; You, Y.-X. Experimental investigation of internal solitary wave forces on a semi-submersible. Ocean Eng. 2017, 141, 205–214. [Google Scholar] [CrossRef]
- Chen, M.; Chen, K.; You, Y.-X.; Yu, H.-T. Experimental study of forces on a multi-column floating platform in internal solitary waves. Appl. Ocean Res. 2018, 7, 192–200. [Google Scholar] [CrossRef]
- Wang, X.; Zhou, J.-F.; Wang, Z.; You, Y.-X. A numerical and experimental study of internal solitary wave loads on semi-submersible platforms. Ocean Eng. 2018, 150, 298–308. [Google Scholar] [CrossRef]
- Shih, T.-H.; Zhu, J.; Lumley, J.L. A realizable Reynolds stress algebraic equation model. In Proceedings of the A Realizable Reynolds Stress Algebraic Equation Model, Koyoto, Japan, 10–18 August 1993. [Google Scholar]
- Brown, S.A.; Magar, V.; Greaves, D.M.; Conley, D.C. An evaluation of rans turbulence clousure models for spilling breakers. Coast. Eng. Proc. 2014, 1, 5. [Google Scholar] [CrossRef] [Green Version]
- Yakhot, V.; Orszag, S.; Thangam, S.; Gatski, T.; Speziale, C. Development of turbulence models for shear flows by a double expansion technique. Phys. Fluids A Fluid Dyn. 1992, 4, 1510–1520. [Google Scholar] [CrossRef] [Green Version]
- Michallet, H.; Barthelemy, E. Experimental study of interfacial solitary waves. J. Fluid Mech. 1998, 366, 159–177. [Google Scholar] [CrossRef]
- Tyvand, J.D. Computational Fluid Dynamics Simulations of Gravity Wave Flows; University of Oslo: Oslo, Norway, 2017. [Google Scholar]
- Meng, Q.; Zhang, C. A third-order KdV solution for internal solitary waves and its application in the numerical wave tank. J. Ocean Eng. Sci. 2016, 1, 93–108. [Google Scholar] [CrossRef] [Green Version]
- Jasak, H. Error Analysis and Estimation for the Finite Volume Method with Applications to Fluid Flows; Imperial College London: London, UK, 1996. [Google Scholar]
- Harten, A. High resolution schemes for hyperbolic conservation laws. J. Comput. Phys. 1983, 49, 357–393. [Google Scholar] [CrossRef] [Green Version]
- Ai, C.; Ding, W. A 3D unstructured non-hydrostatic ocean model for internal waves. Ocean Dyn. 2016, 66, 1253–1270. [Google Scholar] [CrossRef]
- Koop, C.G.; Butler, G. An investigation of internal solitary waves in a two-fluid system. J. Fluid Mech. 1981, 112, 225–251. [Google Scholar] [CrossRef]
- Jacobsen, N.G.; Fuhrman, D.R.; Fredsøe, J. A wave generation toolbox for the open-source CFD library: OpenFoam®. Int. J. Numer. Methods Fluids. 2012, 70, 1073–1088. [Google Scholar] [CrossRef]
- Chen, C.-Y.; Hsu, J.R.-C.; Cheng, M.-H.; Chen, H.-H.; Kuo, C.-F. An investigation on internal solitary waves in a two-layer fluid: Propagation and reflection from steep slopes. Ocean Eng. 2007, 34, 171–184. [Google Scholar] [CrossRef]
- Wessels, F.; Hutter, K. Interaction of internal waves with a topographic sill in a two-layered fluid. J. Phys. Oceanogr. 1996, 26, 5–20. [Google Scholar] [CrossRef] [Green Version]
Figure 1.
Density and Brunt-Bäisälä frequency distribution, the fluid depth ratio is h1:h2 = 20:80. is the vertical coordinate, is the total fluid depth, is the density.
Figure 1.
Density and Brunt-Bäisälä frequency distribution, the fluid depth ratio is h1:h2 = 20:80. is the vertical coordinate, is the total fluid depth, is the density.

Figure 2.
Schematic illustration of Internal Solitary Wave (ISW) propagation over a submerged platform. is the upper fluid depth, is the lower fluid depth, is the upper fluid density and is the lower fluid density.
Figure 2.
Schematic illustration of Internal Solitary Wave (ISW) propagation over a submerged platform. is the upper fluid depth, is the lower fluid depth, is the upper fluid density and is the lower fluid density.

Figure 3.
The dimensions of the semi-submersible platform.

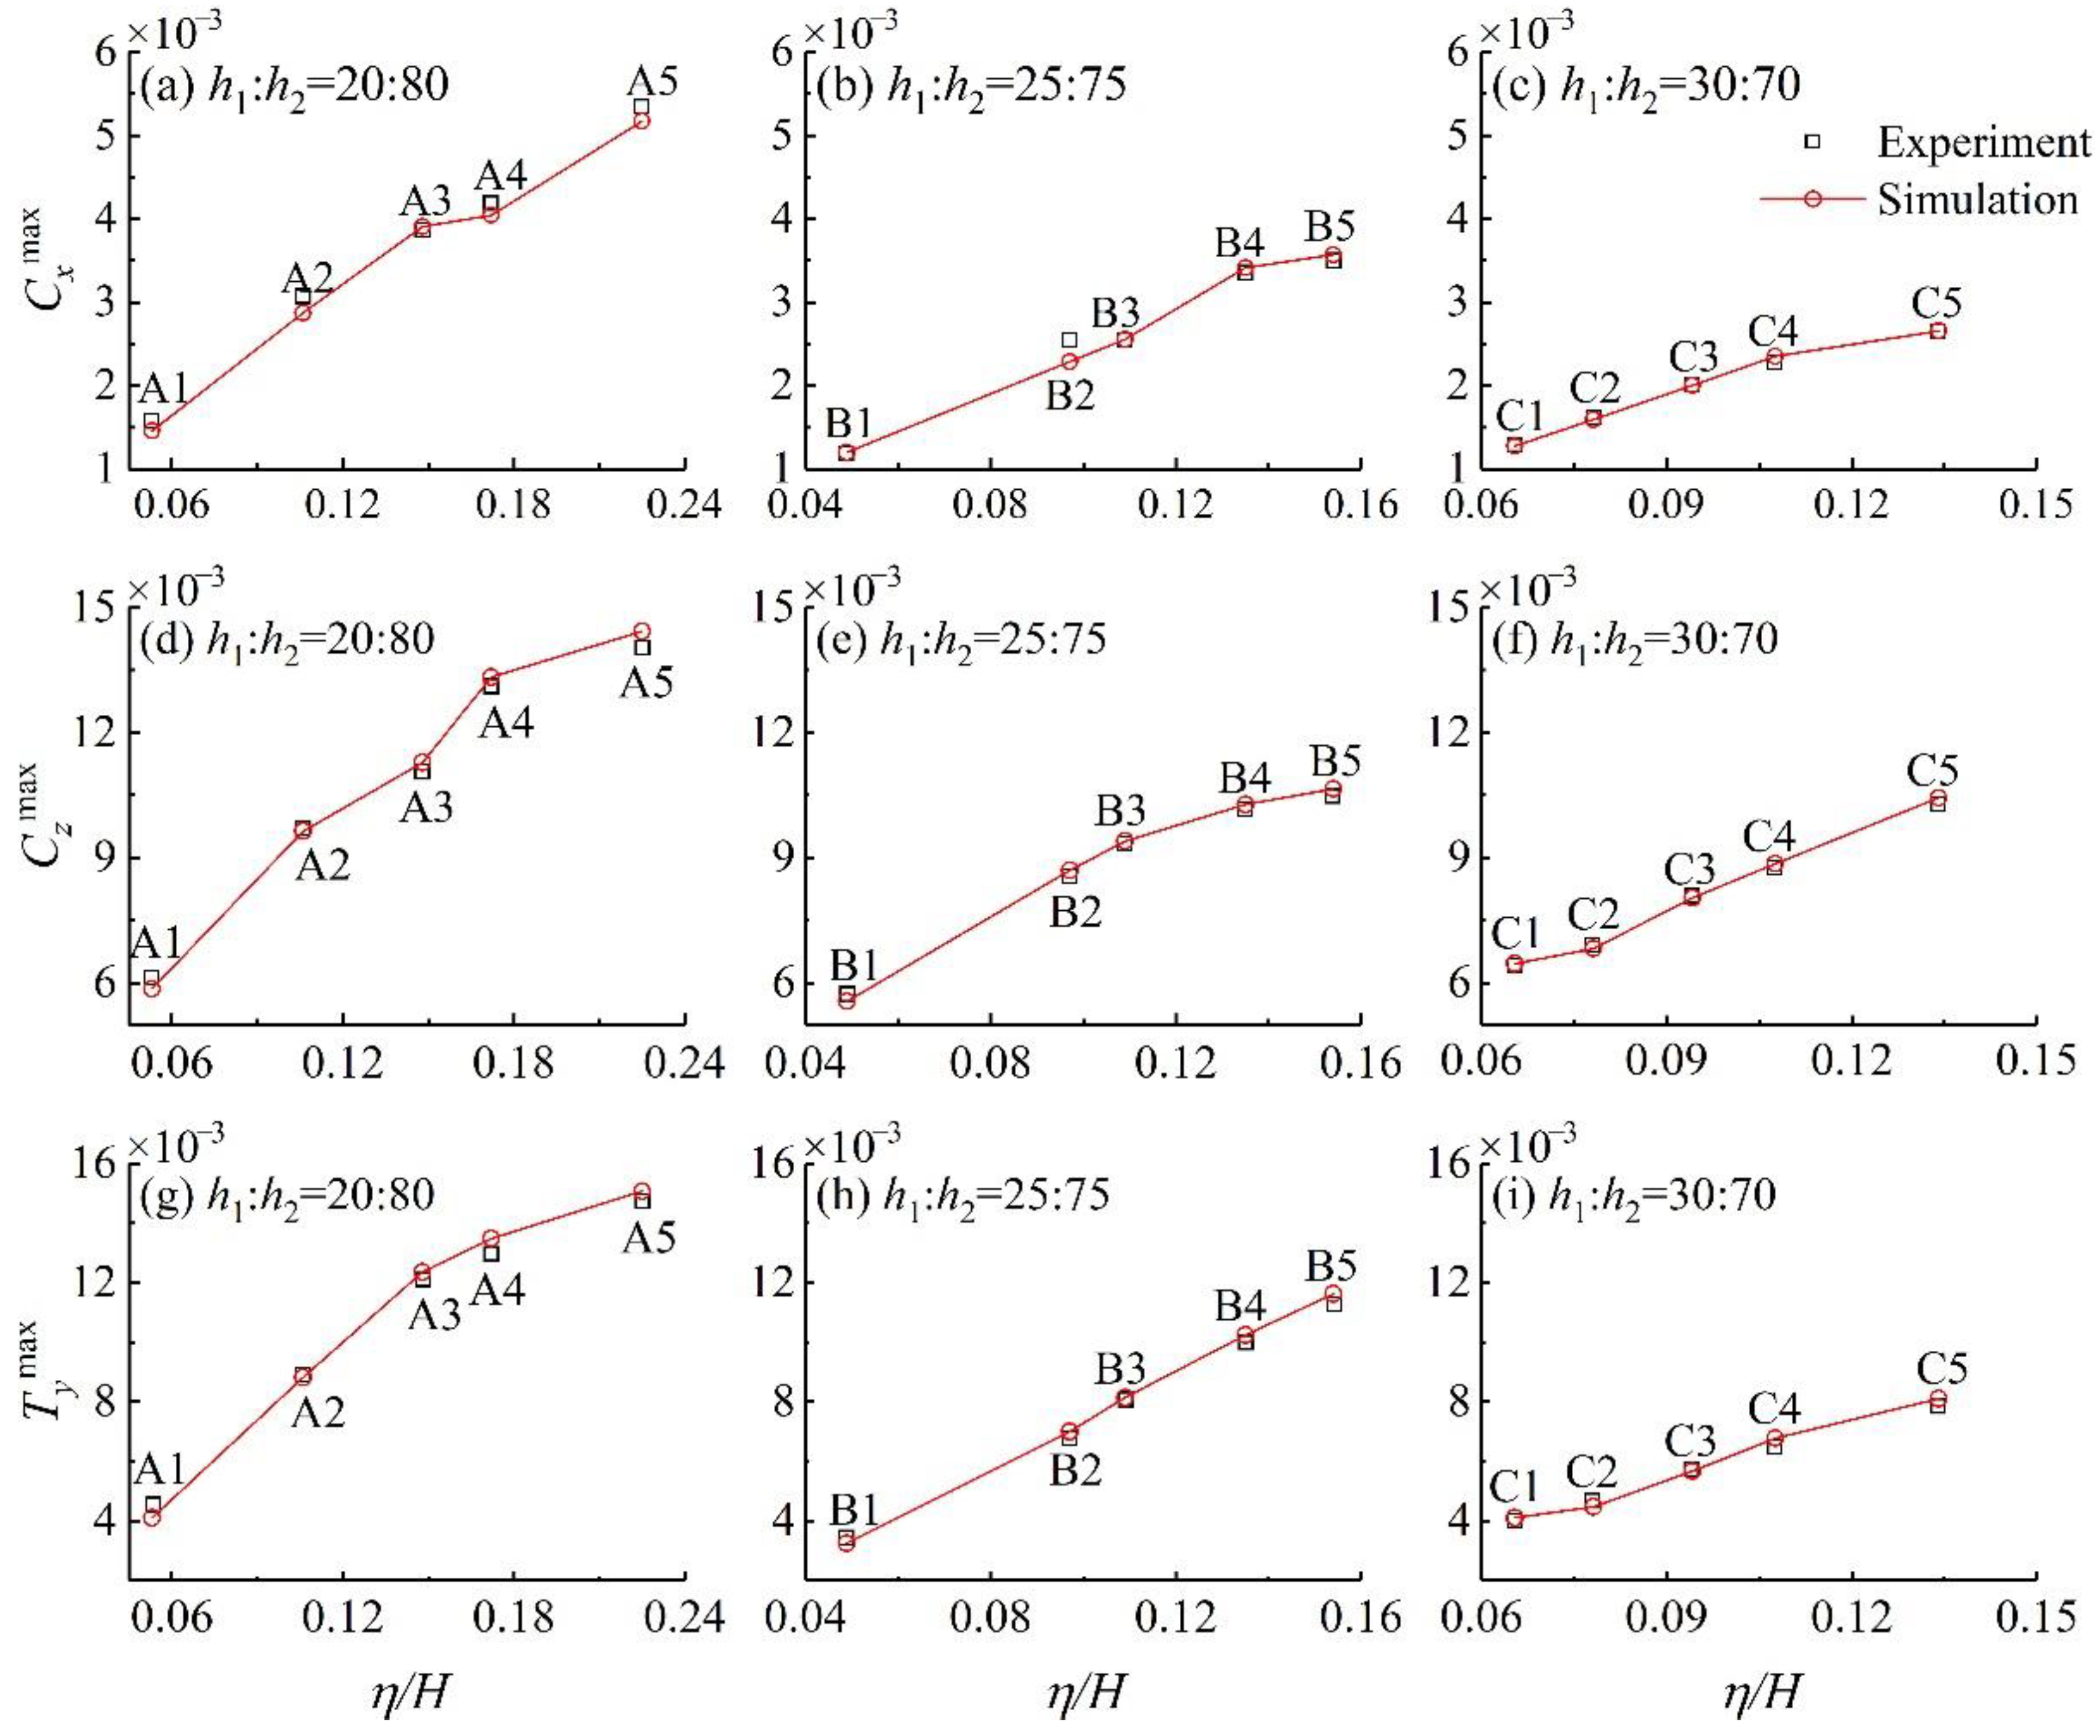
Figure 4.
The comparison of forces and torques coefficients on the semi-submersible platform between experiment data and numerical simulation results. is the wave amplitude.
Figure 4.
The comparison of forces and torques coefficients on the semi-submersible platform between experiment data and numerical simulation results. is the wave amplitude.

Figure 5.
The evolution of the ISW profile for Case A2. is the dimensionless time.

Figure 6.
Forces and torques coefficients on the semi-submersible platform versus dimensionless time for Case A2.
Figure 6.
Forces and torques coefficients on the semi-submersible platform versus dimensionless time for Case A2.

Figure 7.
Forces and torques coefficients on each part of the platform versus time for Case A2. In order to be illustrated in the same figure as the pontoons and bracings, the torques on columns have been artificially reduced by 0.01 times.
Figure 7.
Forces and torques coefficients on each part of the platform versus time for Case A2. In order to be illustrated in the same figure as the pontoons and bracings, the torques on columns have been artificially reduced by 0.01 times.

Figure 8.
Dynamic pressure distribution around the platform versus dimensionless time for Case A2. is the dynamic pressure.
Figure 8.
Dynamic pressure distribution around the platform versus dimensionless time for Case A2. is the dynamic pressure.

Figure 9.
Vorticity around the platform at z = 0.97 m and z = 0.95 m for Case A2.

Figure 10.
Vorticity around the platform at x = 11.90 m and x = 12.10 m for Case A2.

Figure 11.
Vorticity around the platform at y = 0.3 m and y = 0.4 m for Case A2.

Figure 12.
Schematic illustration of ISW propagation over the extended cylinder.

Figure 13.
Forces and torques coefficients on the semi-submersible platform at different angles under the condition of Case A2.
Figure 13.
Forces and torques coefficients on the semi-submersible platform at different angles under the condition of Case A2.

Figure 14.
Comparison of the vorticity field around the semi-submersible platform at different angles at z = 0.95 m; z = 0.97 m.
Figure 14.
Comparison of the vorticity field around the semi-submersible platform at different angles at z = 0.95 m; z = 0.97 m.

Figure 15.
Comparison of the vorticity field around the semi-submersible platform at different directions at profile m1 and m2.
Figure 15.
Comparison of the vorticity field around the semi-submersible platform at different directions at profile m1 and m2.

Figure 16.
Comparison of the vorticity field around the semi-submersible platform at different angles at profile m3 and m4.
Figure 16.
Comparison of the vorticity field around the semi-submersible platform at different angles at profile m3 and m4.


Table 1.
Amplitude and fluid depth ratio in each numerical simulation.
| Case No. | h1:h2 | η [m] | Case No. | h1:h2 | η [m] | Case No. | h1:h2 | η [m] |
|---|---|---|---|---|---|---|---|---|
| A1 | 20:80 | 0.053 | B1 | 25:75 | 0.049 | C1 | 30:70 | 0.065 |
| A2 | 0.106 | B2 | 0.097 | C2 | 0.078 | |||
| A3 | 0.148 | B3 | 0.109 | C3 | 0.094 | |||
| A4 | 0.172 | B4 | 0.135 | C4 | 0.108 | |||
| A5 | 0.225 | B5 | 0.154 | C5 | 0.134 |
Note: h1 is the upper fluid depth, h2 is the lower fluid depth, is the wave amplitude.
© 2020 by the authors. Licensee MDPI, Basel, Switzerland. This article is an open access article distributed under the terms and conditions of the Creative Commons Attribution (CC BY) license (http://creativecommons.org/licenses/by/4.0/).
Share and Cite
MDPI and ACS Style
Ding, W.; Ai, C.; Jin, S.; Lin, J. 3D Numerical Investigation of Forces and Flow Field around the Semi-Submersible Platform in An Internal Solitary Wave. Water 2020, 12, 208. https://doi.org/10.3390/w12010208
AMA Style
Ding W, Ai C, Jin S, Lin J. 3D Numerical Investigation of Forces and Flow Field around the Semi-Submersible Platform in An Internal Solitary Wave. Water. 2020; 12(1):208. https://doi.org/10.3390/w12010208
Chicago/Turabian StyleDing, Weiye, Congfang Ai, Sheng Jin, and Jinbo Lin. 2020. "3D Numerical Investigation of Forces and Flow Field around the Semi-Submersible Platform in An Internal Solitary Wave" Water 12, no. 1: 208. https://doi.org/10.3390/w12010208
Note that from the first issue of 2016, this journal uses article numbers instead of page numbers. See further details here.