Metallic Pollution and the Use of Antioxidant Enzymes as Biomarkers in Bellamya unicolor (Olivier, 1804) (Gastropoda: Bellamyinae)


1
Department of Biological Sciences, Faculty of Sciences, King Abdulaziz University, Jeddah 80203, Saudi Arabia
2
Department of Biology, Faculty of Life Science, Ahmadu Bello University, Zaria 810001, Nigeria
*
Author to whom correspondence should be addressed.
Water 2020, 12(1), 202; https://doi.org/10.3390/w12010202
Submission received: 26 December 2019
/
Revised: 9 January 2020
/
Accepted: 9 January 2020
/
Published: 10 January 2020
(This article belongs to the Special Issue Ecological and Health Risk of Soils, Sediments, and Water Contamination)
Abstract
:Industrial and domestic discharges of effluent is one of the major causes of heavy metal pollution in aquatic ecosystems. Samples of benthic sediment and freshwater mollusc Bellamya unicolor were collected from 5 sites in the River Kaduna to determine heavy metal concentration, their ecological risk, and antioxidant enzymes activities in Bellamya unicolor. The results revealed the level of pollution based on heavy metal concentrations across the sites in the order S5 > S3 > S4 > S1 > S2. The ecological risk factor (ErF) revealed that Cd made the highest contribution to pollution, recording the highest ErF (2206.41). Moreover, the results of correlation base multivariate analysis showed that urban and industrial waste were the sources of Cu and Pb in the River Kaduna. The significant positive correlation between metal concentration and antioxidants catalase (CAT) and superoxide dismutase (SOD) was established, with maximum activities of antioxidants at site S5. Results from this study have revealed potential ecological risk as a result of heavy metals pollution in the River Kaduna. Hence the need for approaches and policies be put in place to prevent the discharge of untreated industrial and domestic waste into this aquatic ecosystem.
1. Introduction
Industrialization and urban development are among the major causes of metal pollution in a natural aquatic ecosystem [1]. The persistent nature and bioaccumulation ability of heavy metals in trophic levels make these metals serious pollutants of the aquatic environment [2,3,4]. The presence of heavy metals in an aquatic ecosystem either through adsorption or co-precipitation can threaten its biodiversity, and the health of humans depending on the resources of that ecosystem [5,6]. However, biological and chemical factors influence the mobility of heavy metals in aquatic environments by desorption from sediments into the surface water [7]. This made the surface water a major intermediate source of metal pollutants in benthic sediments, which is the definitive receptor [8,9].
Heavy metal concentrations of sediments and benthic organisms such as freshwater mollusc, speciation and several analytical techniques are often used in the evaluation of probable ecological risks in benthic sediments and their effect on the biota [10,11]. Several environmental factors and pollution indices such as geoaccumulation index (Igeo), ecological risk factors (ErF) and sediment quality guidelines (SQGs) have been used by several authors. It was used to measure the level or degree of pollution caused by metal and the ecological risk posed by metals in benthic sediments [12]. Although chemical speciation is ignored, it can be considered as subjective when evaluation of the level of pollution is computed based on Igeo and ErF. This is done because of the efficiency of these indices in utilizing both the concentration and toxic effect of metals to draw valuable conclusions on risk assessments [13,14].
The discharged industrial and domestic effluent containing toxic metals in aquatic ecosystems is a major concern to the survival of aquatic biota. Freshwater molluscs are not an exception. Although they have devised a means of bioaccumulating the metals even at high levels, due to their high tolerant ability to metal concentrations [15]. This ability makes them a good bio-monitor and bio-indicators of metal pollution in aquatic ecosystems [15,16]. The need to involve freshwater mollusc in ecological risk assessment studies does not stop at their ability to accumulate metal pollutants in high concentration. They also form an important link in the metal cycle for aquatic ecosystems and occupy a trophic level in the aquatic food chain [17,18].
Heavy metal concentrations in high levels can lead to the generation of reactive oxygen species such as H2O2, OH, RO2 among others [19,20]. The manifestation of oxidative stress as a result of oxidative damage to proteins, nucleic acids, and lipids in aquatic organisms exposed to metal-polluted environments is triggered by reactive oxygen species (ROS). This happens when the process of detoxifying metals by organisms has to do with redox cycling reactions [20]. However, another important biomarker of oxidative stress known as defensive antioxidant enzymes is found in organisms [20,21], to scavenge ROS produced in organisms because of metal pollution and oxidative stress. Therefore an increase in ROS formation as a result of an increase in metal pollution triggers an increase in the production of antioxidant enzymes [22,23]. This phenomenon leads to the utilization of antioxidants as biomarkers of environmental pollution, which is a source or primary cause of oxidative stress in organisms [23].
In this study, five sites were selected to evaluate the risk assessment of heavy metals in the River Kaduna. Hence, to achieve the aim of this study, we determined concentrations of heavy metals in sediments and the freshwater mollusc Bellamya unicolor, pollution indices and antioxidant enzyme activities in Bellamya unicolor across the five sites.
2. Materials and Methods
2.1. Study Area
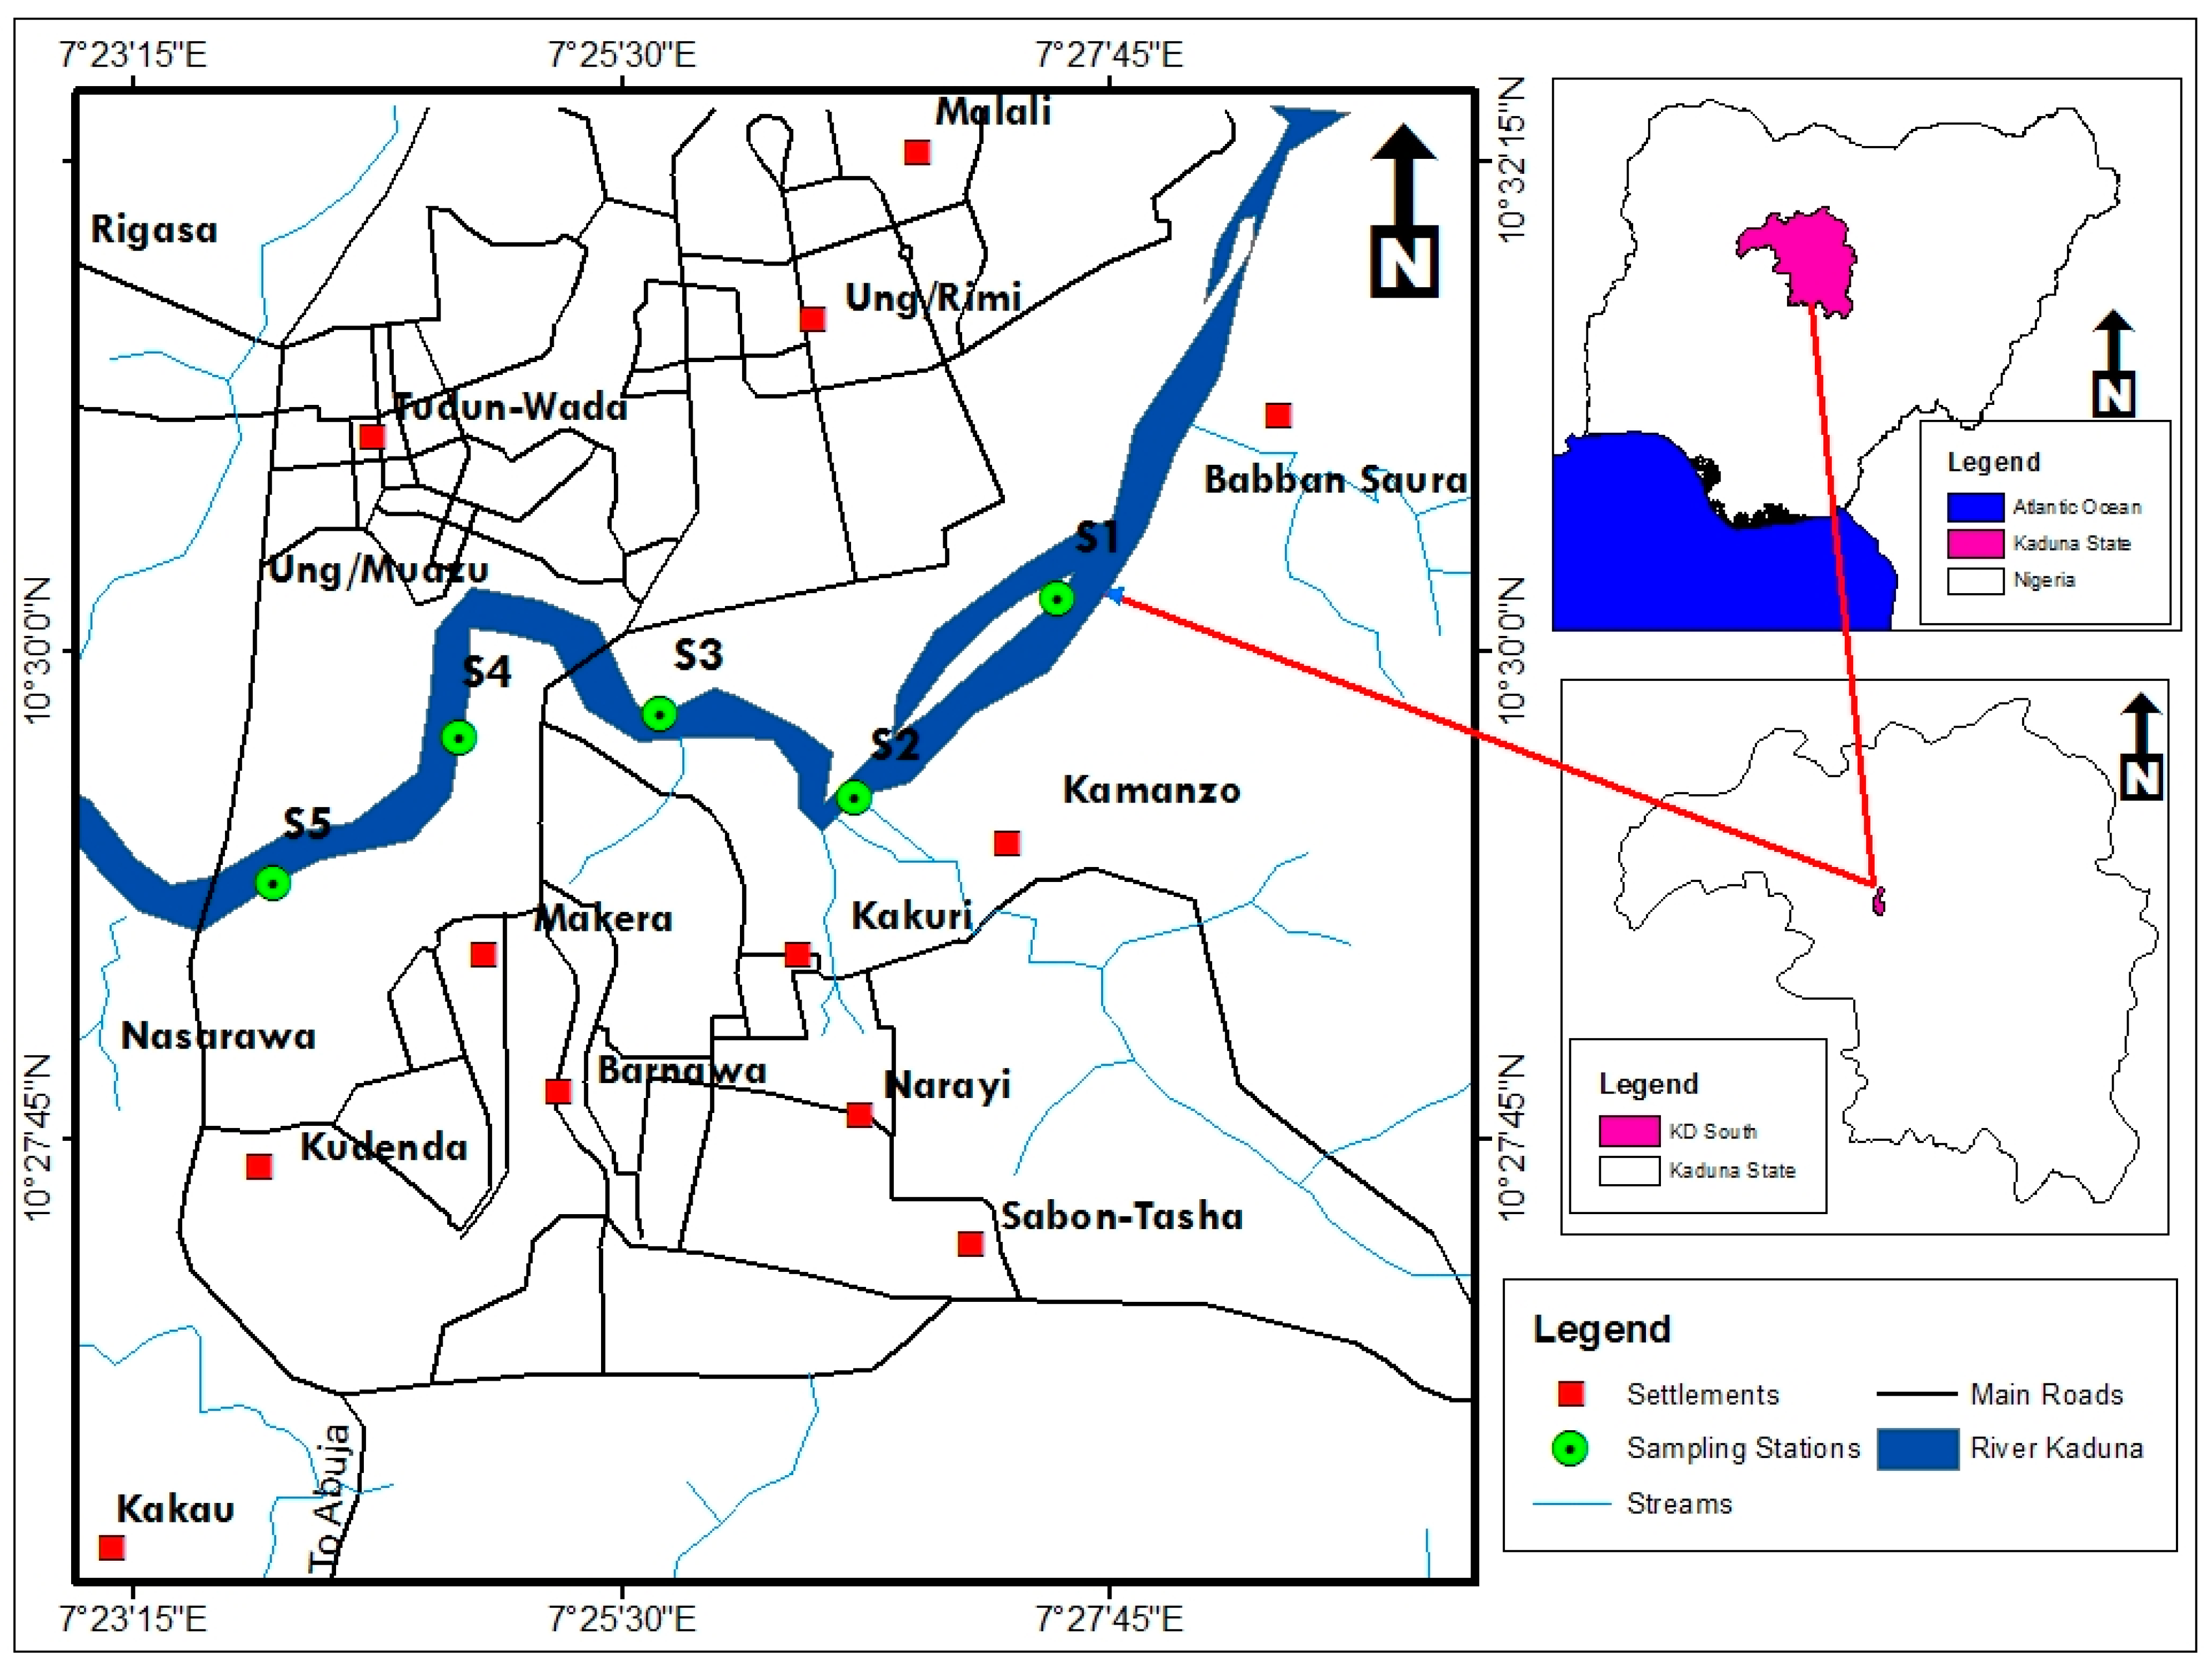
The study area is located in Kaduna state (Lat. 10.52° N and Lat. 12° N, Long. 7.44° E and Long. 9° E). Kaduna state is located in the northern guinea savannah zone of Nigeria as one of the most developed industrial cities (Figure 1). The textile industry, flour mill, fertilizer, plastic, agrochemical, brewery, and bottling companies are some of the major industries sited in Kaduna state. The climatic conditions like most of Nigeria are characterized by the dry and wet season. The wet season commences either in April or May and ends in October of the same year while the dry season begins towards the end of October and ends in March the following year. Annual rainfall on average is between 1450 to 2000 mm with a temperature regime average of 25 to 43 °C, and relative humidity estimated to be between 20 and 40% in January and 60 to 80% in July. The solar radiation of the Kaduna state was 25.0 Wm−2 day−1 [24].
The River Kaduna is one of the major rivers in Nigeria. It stretches southwest and south course before completing a flow of 550 KM into River Niger. During its course through Kaduna city, it stretches along the southern part of the state through Kakuri where it receives industrial and domestic wastewater. It serves as a source of domestic water supply and irrigation farming for Kaduna urban settlements and its various industries [25].
2.2. Collection of Samples
Surface sediments (0–10 cm) were collected along a stretch of River Kaduna from five sites base on the type of anthropogenic activities, stages for the stretch of the river either downstream, upper or in between, and history of sediment pollution. Coordinates of the sites selected were determined and recorded using a T10 handheld Global Positioning System (GPS) receiver. At each site, five grab hauls were sampled using an Ekman’s grab. The samples were sorted in the field to separate Bellamya unicolor from the sediment samples. Bellamya unicolor were identified as described by Brown and Kristensen [26]. After sorting, the samples were placed inside zip lock bags and stored in the icebox to be transported to the laboratory for further analysis.
2.3. Treatment of Samples and Determination of Heavy Metals
Sediment samples were freeze-dried and grounded while samples of Bellamya unicolor were treated and prepared for heavy metal determination and antioxidant enzyme activities assays; 0.4 g of grounded freeze-dried samples was digested in 8 mL of 1:1 HNO3:HCl and kept for 1 h in Anton-Paar PE Multiwave 3000 (microwave oven) set at 200 °C [1,27].
For the freshwater mollusc Bellamya unicolor samples, 0.3 g of the grounded samples were digested chemically in 3:1 HNO3:H2O2 and maintained for 45 min at 180 °C. The volume was then made up to 50 mL using ultra water. The solutions were left to stand after the mixture until the following day. The solute from the digested solution of sediment and Bellamya unicolor tissue was then transferred into polypropylene vials after filtration, stored between 4–5 °C and later analyzed for heavy metals using inductively coupled plasma optical emission spectrometry (ICP-OES, Thermo, Waltham, MA, USA).
2.4. Assay of Antioxidant Enzymes Activities
Bellamya unicolor tissues were separated from the shell and washed with deionized water; 0.25 g of the tissue sample was then homogenized using 0.01 (M) chilled phosphate buffer at pH 7 with ice-cold mortar and pestle. The homogenate was later centrifuged for 25 min at 4 °C and 14,000 rpm [1,28]. The supernatant from the centrifuged samples was used for the measurement of antioxidant enzyme activities using an LT-291 Single Beam ultraviolet-visible (UV-VIS) spectrophotometer.
2.4.1. Assay of Catalase (CAT)
Catalase (CAT) activities in the supernatant of initially centrifuged samples of Bellamya unicolor were assayed as described by Chance and Maehly [29]. CAT activities were estimated spectrophotometrically at 230 nm. The enzyme extract prepared initially was used to measure the activity of catalase. Specific activity was expressed as Ug−1 protein. 1 IU = change in absorbance/min/extinction coefficient (0.021).
2.4.2. Assay of Superoxide Dismutase (SOD)
The activity of superoxide dismutase (SOD) was determined using the method of Kakkar et al. [30]. The initial supernatant prepared was purified by precipitating the protein using 90% ammonium sulphate before an assay of enzyme activities. The fraction was then dialysed against 0.0025 M tris-HCl buffer (pH 7.4) and the supernatant was used as the source of enzyme. The content of the assay solution was made up of 1.2 mL of sodium pyrophosphate buffer, 0.1 mL of phenazine methosulphate (PMS), 0.3 mL of nitro-blue tetrazolium (NBT), 1.3 mL of distilled water and 0.1 mL of the enzyme source. The supernatant was kept inside the vials at 30 °C for 90 s and the reaction was stopped by adding 1 mL of glacial acetic acid. 4.0 mL of n-butanol was added to the reacting mixture and mixed properly, then allow to stand for 10 min and the upper portion of the butanol layer was decanted. Absorbance was measured at 560 nm against a blank of n-butanol. A system that lacks enzyme was used as the control and one unit of activities of the enzyme was define as its concentration needed to inhibit 50% production of chromogen per minute. Specific activity was expressed as Ug−1 protein. 1 IU = change in absorbance/min/extinction coefficient (0.021).
2.5. Sediment Contamination and Ecological Risk Assessment
The geo-accumulation index (Igeo) provides a good explanation of the contamination or pollution status of sediment and thereby gives a better understanding of the possible threat of metal pollutants to natural ecosystem settings [31]. For that reason, Igeo was applied in this study as a quantitative indicator, putting into consideration the classifications that evaluate the level of pollution as described by Müller [32]. This index is expressed mathematically as:
where Cn and Bn are the metal concentration in the sediment and geochemical background value of the element (n).
The levels of metal contamination were classified into seven levels: uncontaminated (<0), uncontaminated to moderately contaminated (0–1), moderately contaminated (1–2), moderately to strongly contaminated (2–3), strongly contaminated (3–4), strongly to extremely contaminated (4–5) and extremely contaminated (>5) [32].
In aquatic ecosystems generally, sediment quality guidelines (SQGs) are utilized to assess the potential risk posed by pollutants to the natural ecosystem [33]. Sub variables of SQGs, which are threshold effect limit (TEL) and probable effect limit (PEL), were used for comparison with metal concentrations in sediment to conclude possible potential ecological risk. The concentrations of metals less than the threshold effect limit (TEL) denote a minimal effect, below which there is no expectation for adverse effects. However, metal concentrations at or greater than the probable effect limit (PEL) denote likely frequent occurrence of adverse biological effects (Table 1).
The ecological risk factor (ErF) was used to further assess the status of metal pollution in sediment and its possible toxicological effect with a comprehensive evaluation of ecological risk constituted by metal contaminants. The basis for the classification of ErF values for metal pollutants was as described by Hakanson [34]. For a particular metal, ErF was expressed as:
where Tri is the toxic response factor of a given metal (i) (Pb = 5, Zn = 1, Cu = 5 Cd = 30, Cr = 2, Ni = 5, Mn = 1) and CFi is the contamination factor of metal (i).
ErF = Tri × CFi
The classification of ErF is in five classes according to Hakanson [34]: low risk (ErF < 30), moderate risk (30 ≤ ErF < 60), considerable risk (60 ≤ ErF < 120), high risk (120 ≤ ErF < 240) and very high risk (ErF ≥ 240).
2.6. Data Analysis
SPSS 22.0 and Minitab version 17.0 statistics software were used for data analysis. At 95% confidence interval (p < 0.05); analysis of variance (ANOVA) was used to test for significance in mean concentrations of metals across sites both in sediment and the freshwater mollusc Bellayma unicolor. Pearson correlation, principal component analysis (PCA) and cluster analysis were used to determine the sources of metal pollutants, the significant relationship between the metals, the relationship between the sites in terms of heavy metal concentration, and the influence of metal concentrations on antioxidant enzymes activities in Bellamya unicolor.
3. Results
3.1. Concentrations of Heavy Metals in Sediment and Freshwater Snail
The summary and some important statistics on heavy metal concentrations in sediment and freshwater mollusc from the River Kaduna used sediment quality guidelines (SQGs) to draw some important conclusions in our study which are presented in Table 1. The concentrations of the heavy metals were compared across the five sites studied both in sediment and freshwater mollusc. Site S5 which is the upstream recorded higher concentrations of heavy metals while site (S1) which the upstream recorded the least concentrations of the nine heavy metals studied.
The ranges for heavy metal concentrations in sediments were 34.54–165.32 mg/kg, 6.36–78.98 mg/kg, 1.63–59.01 mg/kg, 4.50–61.48 mg/kg, 0.96–58.84 mg/kg, 16.09–79.20 mg/kg, 39.43–96.08 mg/kg, 2.64–60.08 mg/kg and 11.42–62.61 mg/kg for Fe, Mn, Cu, Zn, Cd, Cr, Pb, Ni and Co respectively. Heavy metal concentrations in freshwater mollusc were lower than the concentrations in the sediment which ranged from Fe: 6.61–33.30, Mn: 1.34–22.75, Cu: 0.54–16.51, Zn: 1.74–18.63, Cd: 0.92–17.52, Cr: 4.26–17.24, Pb: 6.24–24.20, Ni: 0.63–14.17 and Co: 1.6–21.46.
A comparison was made between heavy metal concentrations in benthic sediment samples with TEL and PEL (Table 2). The result of the comparisons revealed that Cu, Cd, Cr, Pb, and Ni fell between TEL and PEL for 46.4, 20.8, 57.4, 100 and 61.2% of the samples respectively. However Cd again also had a value above PEL for 79.2% of the samples.
3.2. Ecological Risk Assessment of Heavy Metals
3.2.1. Geo-Accumulation Index (Igeo)
In this study, the values of Igeo recorded for heavy metal concentrations of sediment samples from the River Kaduna are presented in Table 3. Based on the classification by Muller [32], the recorded values of Igeo for Cd at sites S1 (−2.39) and S2 (−2.91) fell into class zero, which means the sediments in S1 and S2 were unpolluted by Cd. In contrast, all the sites were found to be extremely polluted with the other heavy metals with Igeo > 5 falling in class 6. However, site S4 Igeo (0.33) for Cd fell in class 1, and S3 (3.53) and S5 (3.56) fell in class 4 indicating unpolluted to moderate pollution, and strongly polluted respectively.
3.2.2. Ecological Risk Factor (ErF)
For ErF results of heavy metal concentrations in the River Kaduna, the level of pollution was in the order Cd > Co > Ni > Pb > Cr > Cu > Zn > Mn (Table 4). Compared to other heavy metals, Cd ErF revealed a high metal pollution level especially at site S5 (ErF = 2206.41). However, the values of ErF for Mn, Cu, Zn, Cr, Pb, Ni, and Co revealed low potential ecological risk or pollution. But in total, the multi-metal ErF as reflected for variation in sites classified the sediments into low pollution to very high pollution in the sequence S5 > S3 > S4 > S1 > S2. Sites S3, S4, and S5 were classified as having very high ecological risk with ErF ≥ 320, S2 as a low potential ecological risk with ErF <40, and S1 as a moderate potential ecological risk with ErF falling between 40–79.9.
3.3. Identification of Pollution Sources
Pearson correlation analysis (Table 5) revealed significant relationship between the metals except Fe–Mn (0.584), Fe–Cr (0.632), Mn–Cu (0.567), Cu–Zn (0.619), Mn–Pb (0.592), Cu–Cr (0.555), Cu–Ni (0.622), Cr–Pb (0.572) and Pb–Co (0.608). However, Cd concentration at p < 0.05 and p < 0.01 was significantly correlated with all the other metals concentrations.
The similarity in terms of the pattern of distribution of heavy metals was established through the utilisation of principal component analysis (PCA); PCA pulls the data together into a form that can be managed easily and takes out a small number of latent factors to analyse the relationship between the variables observed [35,36]. PCA was applied here primarily to evaluate the source origin of heavy metals in the region.
The results for PCA are presented in Table 6. The high eigenvalue is an indication of pattern and to what extent the data is spread and this leads to consideration of high eigenvalue as the principal component. The components/factors associated with the results of PCA for heavy metals in sediments and freshwater mollusc had a total variation of 92.5%. Component 1 (PC1) recorded the highest eigenvalue of 13.82, accounting for 76.80% of the total variation, and dominate the other components with more significant variation and strong positive loadings (>0.90) of Mn, Cu, Cd, Cr, and Pb in the sediment. Component 2 (PC2) accounted for 8.81% of total variation and had moderate positive loadings (>0.50) of Cu and Pb in the sediment. Component 3 (PC3) accounted for 6.89% of the total variation having moderate positive loadings (>0.50) on Co.
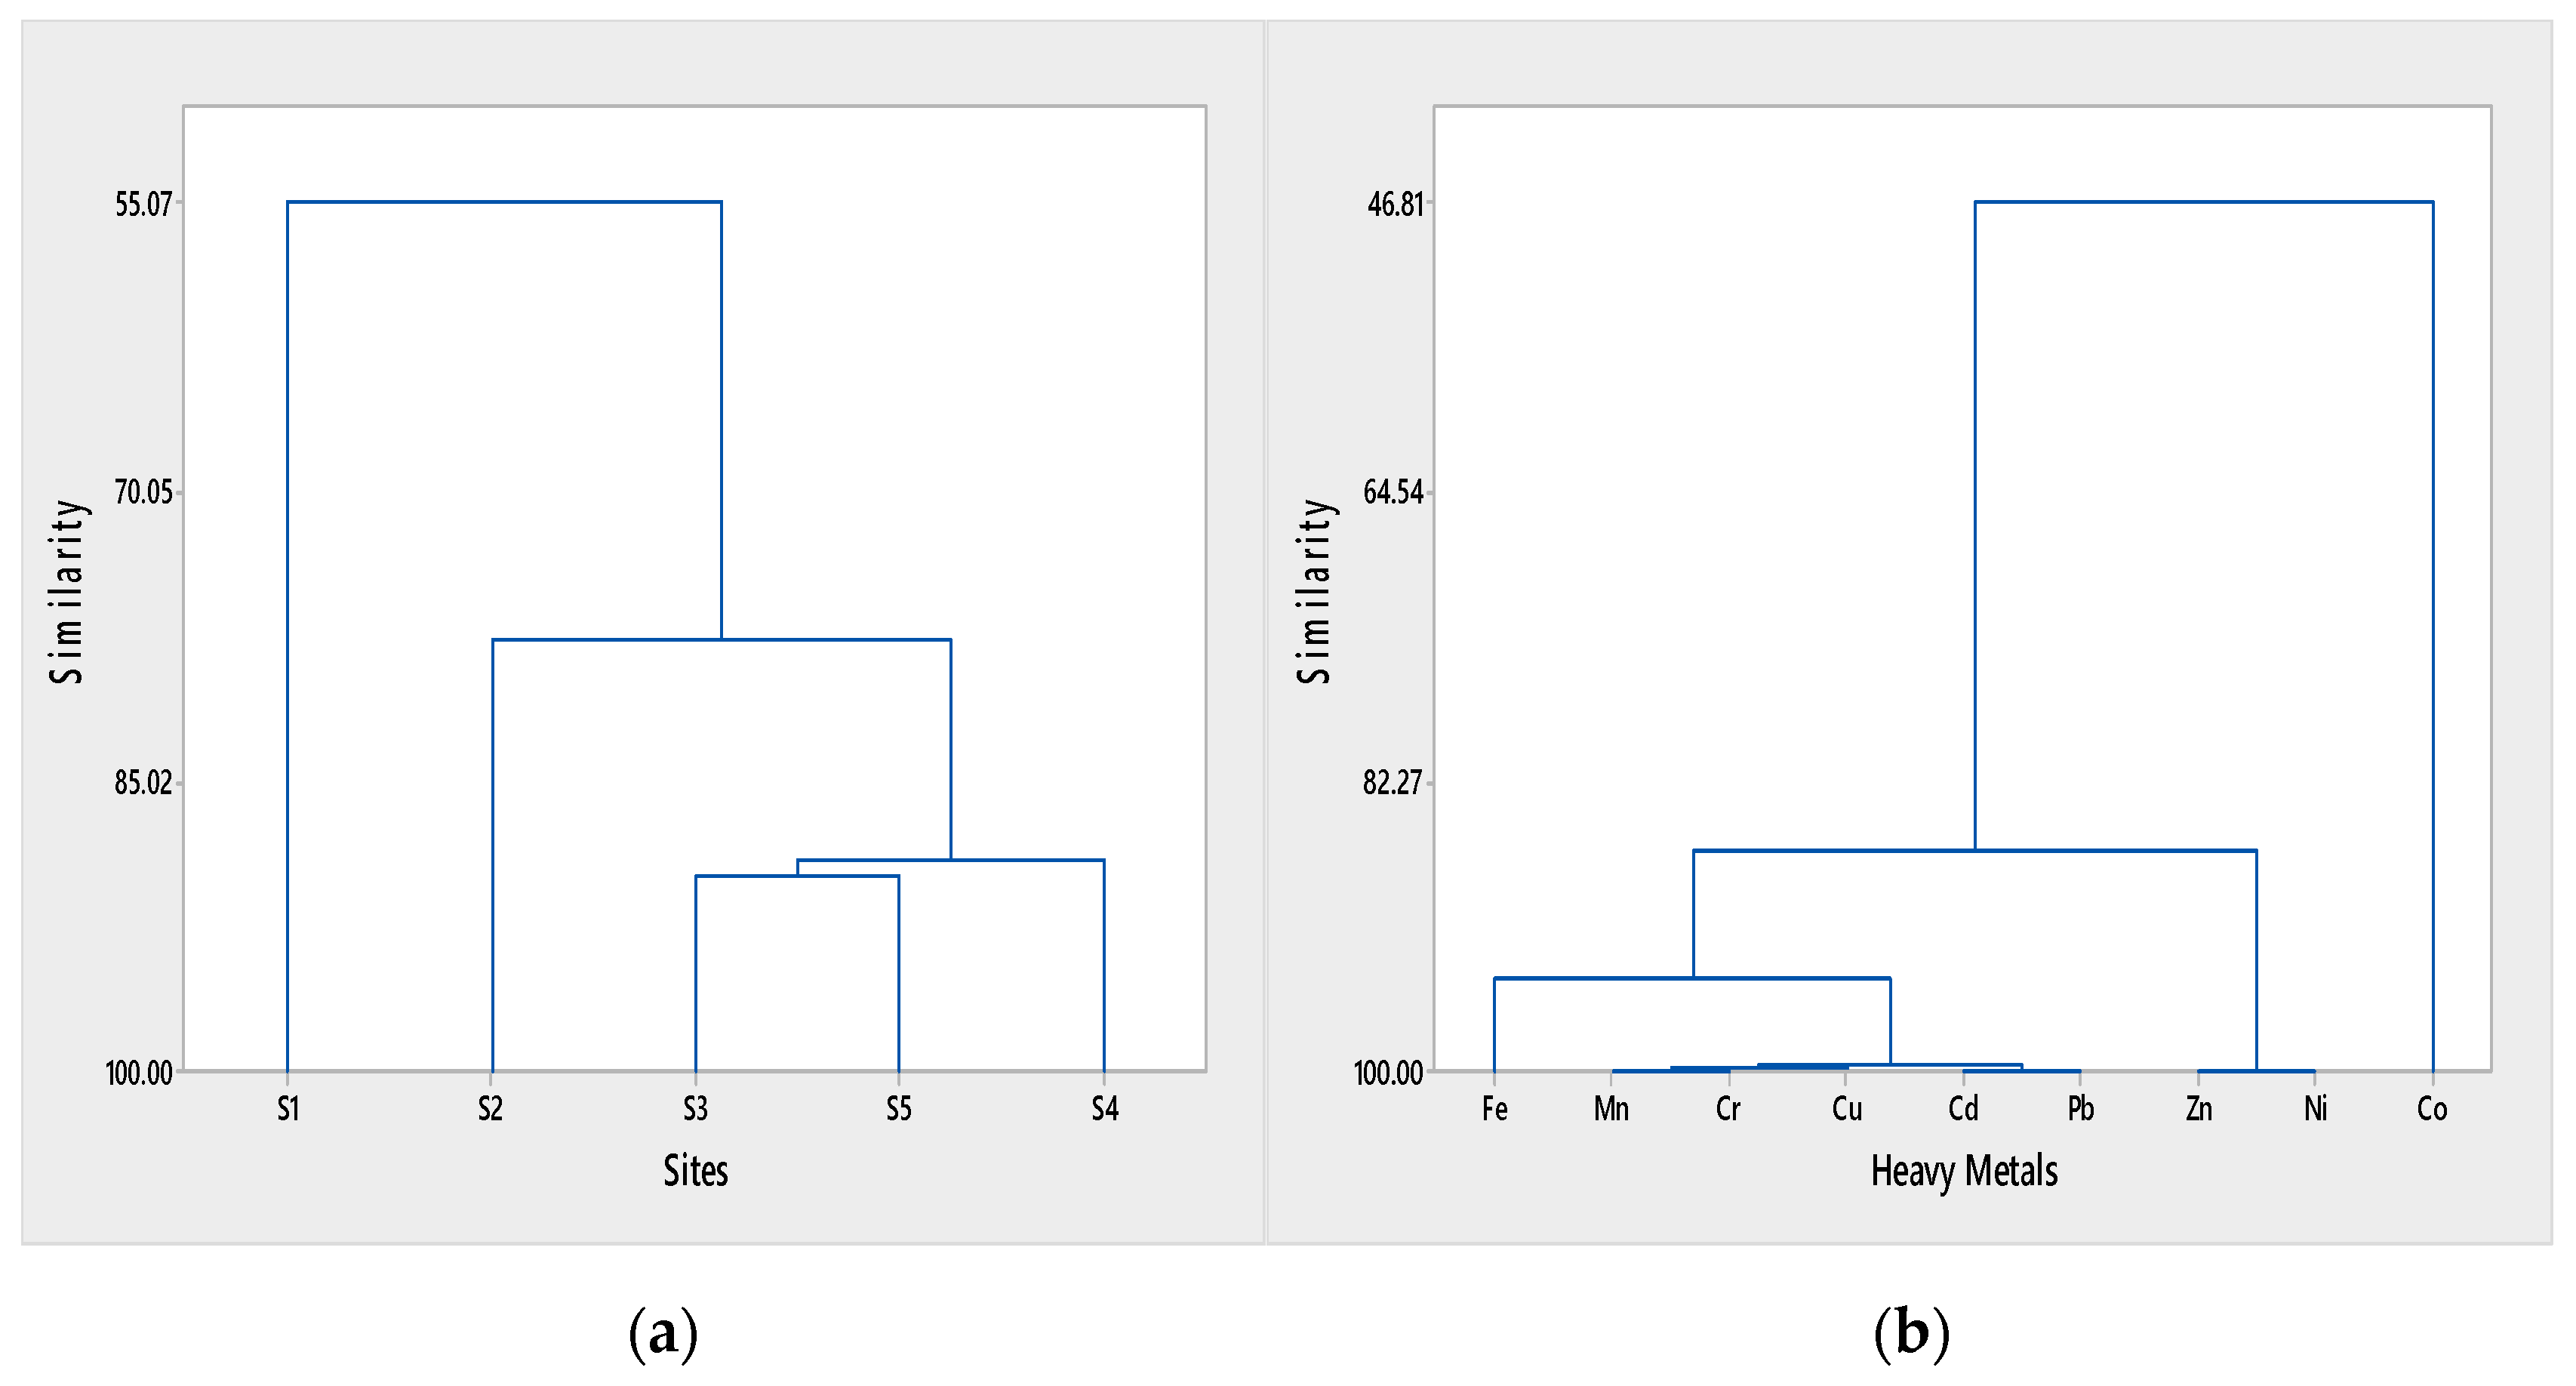
Cluster analysis reveals the relationship between sampling sites (Figure 2a) based on heavy metals concentrations and also the relationship between the metals (Figure 2b). For the relationship between the sites, three (3) clusters were formed at a similarity level of 89.09. The first cluster presented only site S1 and the second cluster had only site 2 while the third cluster grouped sites S3, S4, and S5. Four (4) clusters were formed for the relationship between the metals at a similarity level of 99.57. The clusters were Cluster 1 (Fe), Cluster 2 (Mn, Cr, Cu, Cd, and Pb), Cluster 3 (Zn and Ni) and Cluster 4 (Co).
3.4. Antioxidant Enzyme Activities
Antioxidant enzymes such as CAT and SOD can be used to monitor changes in an environment through the measurement of their activities in an organism present in that same environment. The activities of CAT and SOD in this study are shown in Figure 3a,b respectively. Significant variation existed at p < 0.05 across the sites for the two antioxidants with sites S5 recording the highest activities for both CAT and SOD. However, CAT activities ranged from 6.67–72.46 Ug−1 protein and SOD 2.70–12.49 Ug−1 protein. The sequence for activities of CAT and SOD across the sites; S5 > S3 > S4 > S1 > S2 corresponded with that of heavy metals concentrations, Igeo and ErF.
A significant positive correlation (p < 0.01) and (p < 0.05) existed between CAT, SOD and all the heavy metals except Fe (0.567) which did not correlate with CAT significantly.
4. Discussion
The high concentrations of heavy metals recorded in this study downstream (S5) and the significant variations across the sites both in sediment and freshwater molluscs can be as a result of anthropogenic activities from the nearby settlements and the industries sited close to the aquatic ecosystem under study [37,38]. However, even though reduced to non-anthropogenic activities were seen or recorded at site S1 which is located upstream, concentrations of heavy metals were still recorded. This can be due to the atmospheric deposition of heavy metals and the effect of runoff that ends up in the river [17,39]. The deposition of metals from the atmosphere, industries located at the catchment, effluents of agrochemical sources and domestic sewage discharge forms part of the input for metal pollutants of anthropogenic sources. Their effect is reflected in natural aquatic ecosystem sediments with negative consequences to benthic organisms and the general wellbeing of the ecosystem [40,41].
Several authors [4,6,14] report similar findings in ecological assessment of the aquatic ecosystem having variations in different sites, with maximum concentration at sites with industrial plants and more anthropogenic activities.
The concentrations of heavy metals such as Cu, Cd, Cr, Pb and Ni that fall between TEC and PEC values for 46.4, 20.8, 57.4, 100 and 61.2% respectively from sediment quality guidelines of the freshwater ecosystem may be an indication of occasionally serious negative effects of this metals upon the ecosystem under study [4]. However, 79.2% of samples with a concentration of Cd greater than PEL reflected the frequent occurrence of biological effect [42]. Comparison is made between metal concentrations with TEC and PEC values to identify if heavy metals present in the sediment has the possibility of threatening the aquatic life [14,42].
This site has industries sited close to it and receives effluents from the industries. Hence, serious attention might be required at this site due to high concentrations of metal pollutants in comparison with the other sites. Pollution as a result of industrial effluent and domestic waste discharge contributes to the rise in concentrations of metal pollutants leading to contamination of the ecosystem [4,43].
The Igeo of heavy metals in sediments were generally higher in site S5 and lower in sites S1 and S2. Igeo scoring of S1 and S2 into class zero [32] for Cd indicate no contamination with Cd. Cd is well known as one of the major pollutants with industrial effluents and domestic sewage as its source [43]. However, extreme pollution of the sites with heavy metals especially S5 with Igeo >5 having a score of 6 reflects on the source variations of the metal pollutants and the nature of catchments. Site S5 is downstream where the other stretch of the river ends up, receiving some of its contents apart from the effluents received from the nearby industrial plants. Downstream has been reported in several studies to have more pollutants affecting the natural wellbeing of that particular ecosystem setting [44,45,46].
Considerable ecological risk exhibited by the metals across the sites is linked with the level of geoaccumulation recorded. The ecological risk was consistent with Igeo for both metals and site variation as revealed by multi-metal ErF. Cd posed a high ecological risk in River Kaduna with an expectation of an adverse effect expected to occur suggesting that they are present in high concentrations, especially at site S5 with the maximum ErF value. This major ecological risk in surface sediment of the River Kaduna by Cd must have been seriously influenced by anthropogenic activities, leading to a high toxic response factor [6]. The low and moderate potential ecological risk in sites S1 and S2 may be a result of metals present in residual forms and minimal concentrations [31,47,48].
Source and migration of metals may be reflected by correlation analysis and PCA [49,50]. Non-significant correlation between Fe–Mn, Fe–Cr, Mn–Cu, Cu–Zn, Mn–Pb, Cu–Cr, Cu–Ni, Cr–Pb, and Pb–Co indicates different factors controlling the availability and concentrations of these metals [4,9]. This implies the metals might have originated from different sources. This was also revealed in the PCA; the groupings of metals, and component 1 and 2 accounting for 76.80% and 8.81%, respectively, with strong positive loading of Mn, Cu, Cd, Cr and Pb in the sediment and moderate positive loading of Cu and Pb in the sediment. This implies urban and industrial waste to be the source of Mn, Cu, Cd, Cr and Pb [51,52].
Similarity and dissimilarity in groups are effectively represented using cluster analysis. Three cluster formations for sites under study revealed a close relationship between these sites. Grouping of S3, S4, and S5 together at a similarity level of 89.09 indicates possible similarities in human activities, site morphology and the pristine background types of sources [53]. The significant relationship revealed by cluster analysis at 99.57 similarity level for the relationship between the metals, grouping Mn, Cr, Cu, Cd, and Pb together makes it possible that they have the same natural and anthropogenic sources [54,55]. This is also a link to the multiple effects of these metals on benthic organisms. For example, Bellamya unicolor collected during our sampling for this study. Our result agrees with the finding of Peijnenburg et al. [56]; Li et al. [55]; Chung et al. [54]. These authors assess and monitor heavy metal sources and their risk in different aquatic environments.
CAT and SOD activities were used in this study as biomarkers to measure the extent of stress in the River Kaduna as reflected in Bellamya unicolor sampled from the same environment at different sites. CAT and SOD are a type of antioxidant enzyme that scavenges reactive oxygen species (ROS) (H2O2, OH, O2, etc.) produced by organisms as a result of oxidative stress caused as a result of unfavorable environmental conditions such as metal pollution [1]. Significant variation in CAT and SOD activities across the sites with high activities in site S5 may be a result of different concentrations of ROS production at the sites with high concentrations at site S5 due to high metal pollution [57]. The scavenging ability of antioxidants increases through their activities in response to increased ROS to reduce or prevent membrane lipid peroxidation by ROS and to improve membrane stability of the cell [58,59].
The significant positive correlation between the antioxidants and the metals showed that the organism Bellamya unicolor is under stress as a result of an increase in metal contamination. Bakshi et al. [1] report similar findings for the biological response of an aquatic organism to metal contamination through antioxidant activities. They revealed an increase in antioxidants with a spatial and temporal increase in heavy metal concentrations.
Our results in this study tend to bridge the gap in knowledge for metal pollution risk assessment, and the use of CAT and SOD as primary biomarkers in benthic organisms of a tropical ecosystem. There has so far been no report, to the best of our knowledge, assessing risk assessment using ecological indices, antioxidant enzymes and Bellamya unicolor as a biomonitor. Our study will provide data to be used as a baseline for studies in the River Kaduna and other related tropical rivers in the same region.
5. Conclusions
The results from this study provide information on the contamination of heavy metals Fe, Mn, Cu, Zn, Cd, Cr, Pb, Ni, and Co in surface sediment of the River Kaduna and their bioavailability in the freshwater mollusc Bellamya unicolor sampled from the same ecosystem.
At a 95% confidence interval, significant variation existed in the concentration of metals in surface sediment and freshwater molluscs across the sampling sites with the site S5 (downstream) having the maximum metal concentrations.
Cd concentration in sediment was greater than PEL, which implies likely frequent occurrence of biological effect by Cd in the River Kaduna with the possibility of threatening the aquatic life. This was reflected in Cd ErF values that are higher than the values of ErF for other metals. Igeo and ErF values follow the same sequence with maximum values at site S5 revealing very high ecological risk with Igeo > 5 and ErF > 320. Mn, Cu, Cd, Cr, and Pb originate mainly from urban and industrial waste as revealed by PC1 and PC2 analysis while S3, S2, and S3 have similar anthropogenic activities and natural metal inputs as shown in cluster analysis. Significant variations existed in CAT and SOD activities in Bellamya unicolor across the sites with maximum activities recorded at sites S5 for both antioxidants. This also coincides with the high values of Igeo and ErF at site S5. However, there is a significant positive correlation between the antioxidants and metal concentrations.
Important approaches and policies should be put in place to prevent the discharge of untreated industrial and domestic waste into the River Kaduna. The approach should involve the prevention of irrigation farming close to the river and, in that way, non-point sources of pollution can be abated and there can be a decrease in ecological risk associated with metal pollutants.
Author Contributions
M.O.A., and A.B.A. conceived the idea and performed the laboratory analysis. All of the authors contributed to give the manuscript its present shape. All authors have read and agreed to the published version of the manuscript.
Funding
This research was funded by the Deanship of Scientific Research (DSR), King Abdulaziz University, Jeddah, under grant number D-024-130-1441. The authors, therefore, gratefully acknowledge DSR technical and financial support.
Acknowledgments
The authors acknowledge the Deanship of Scientific Research (DSR), King Abdulaziz University, Jeddah for their technical and financial support.
Conflicts of Interest
The authors declare there is no conflict of interest.
References
- Bakshi, M.; Ghosh, S.; Chakraborty, D.; Hazra, S.; Chaudhuri, P. Assessment of potentially toxic metal (PTM) pollution in mangrove habitats using biochemical markers: A case study on Avicennia officinalis L. in and around Sundarban, India. Mar. Pollut. Bull. 2018, 133, 157–172. [Google Scholar] [CrossRef]
- Bastami, K.D.; Bagheri, H.; Kheirabadi, V.; Zaferani, G.G.; Teymori, M.B.; Hamzehpoor, A.; Soltani, F.; Haghparast, S.; Harami, S.R.M.; Ghorghani, N.F. Distribution and ecological risk assessment of heavy metals in surface sediments along southeast coast of the Caspian Sea. Mar. Pollut. Bull. 2014, 81, 262–267. [Google Scholar] [CrossRef] [PubMed]
- Xiao, R.; Bai, J.; Lu, Q.; Zhao, Q.; Gao, Z.; Wen, X.; Liu, X. Fractionation, transfer, and ecological risks of heavy metals in riparian and ditch wetlands across a 100-year chronosequence of reclamation in an estuary of China. Sci. Total Environ. 2015, 517, 66–75. [Google Scholar] [CrossRef] [PubMed]
- Ke, X.; Gui, S.; Huang, H.; Zhang, H.; Wang, C.; Guo, W. Ecological risk assessment and source identification for heavy metals in surface sediment from the Liaohe River protected area, China. Chemosphere 2017, 175, 473–481. [Google Scholar] [CrossRef]
- Suresh, G.; Ramasamy, V.; Sundarrajan, M.; Paramasivam, K. Spatial and vertical distributions of heavy metals and their potential toxicity levels in various beach sediments from high-background-radiation area, Kerala, India. Mar. Pollut. Bull. 2015, 91, 389–400. [Google Scholar] [CrossRef] [PubMed]
- Xu, M.; Sun, W.; Wang, R. Spatial Distribution and Ecological Risk Assessment of Potentially Harmful Trace Elements in Surface Sediments from Lake Dali, North China. Water 2019, 11, 2544. [Google Scholar] [CrossRef] [Green Version]
- Hill, N.A.; Simpson, S.L.; Johnston, E.L. Beyond the bed: Effects of metal contamination on recruitment to bedded sediments and overlying substrata. Environ. Pollut. 2013, 173, 182–191. [Google Scholar] [CrossRef] [PubMed]
- Bermejo, J.S.; Beltrán, R.; Ariza, J.G. Spatial variations of heavy metals contamination in sediments from Odiel river (Southwest Spain). Environ. Int. 2003, 29, 69–77. [Google Scholar] [CrossRef]
- Kükrer, S.; Şeker, S.; Abacı, Z.T.; Kutlu, B. Ecological risk assessment of heavy metals in surface sediments of northern littoral zone of Lake Çıldır, Ardahan, Turkey. Environ. Monit. Assess. 2014, 186, 3847–3857. [Google Scholar] [CrossRef]
- Yang, Z.; Wang, Y.; Shen, Z.; Niu, J.; Tang, Z. Distribution and speciation of heavy metals in sediments from the mainstream, tributaries, and lakes of the Yangtze River catchment of Wuhan, China. J. Hazard. Mater. 2009, 166, 1186–1194. [Google Scholar] [CrossRef]
- Yu, G.; Liu, Y.; Yu, S.; Wu, S.; Leung, A.; Luo, X.; Xu, B.; Li, H.; Wong, M.H. Inconsistency and comprehensiveness of risk assessments for heavy metals in urban surface sediments. Chemosphere 2011, 85, 1080–1087. [Google Scholar] [CrossRef] [PubMed]
- Zahra, A.; Hashmi, M.Z.; Malik, R.N.; Ahmed, Z. Enrichment and geo-accumulation of heavy metals and risk assessment of sediments of the Kurang Nallah—Feeding tributary of the Rawal Lake Reservoir, Pakistan. Sci. Total Environ. 2014, 470, 925–933. [Google Scholar] [CrossRef] [PubMed]
- Zhu, H.N.; Yuan, X.Z.; Zeng, G.M.; Jiang, M.; Liang, J.; Zhang, C.; Juan, Y.; Huang, H.J.; Liu, Z.F.; Jiang, H.W. Ecological risk assessment of heavy metals in sediments of Xiawan Port based on modified potential ecological risk index. Trans. Nonferrous Met. Soc. China 2012, 22, 1470–1477. [Google Scholar] [CrossRef]
- Rahman, M.S.; Hossain, M.B.; Babu, S.O.F.; Rahman, M.; Ahmed, A.S.; Jolly, Y.; Choudhury, T.; Begum, B.; Kabir, J.; Akter, S. Source of metal contamination in sediment, their ecological risk, and phytoremediation ability of the studied mangrove plants in ship breaking area, Bangladesh. Mar. Pollut. Bull. 2019, 141, 137–146. [Google Scholar] [CrossRef]
- Waykar, B.; Petare, R. Studies on monitoring the heavy metal contents in water, sediment and snail species in Latipada reservoir. J. Environ. Biol. 2016, 37, 585. [Google Scholar]
- Zhou, Q.; Zhang, J.; Fu, J.; Shi, J.; Jiang, G. Biomonitoring: An appealing tool for assessment of metal pollution in the aquatic ecosystem. Anal. Chim. Acta 2008, 606, 135–150. [Google Scholar] [CrossRef]
- Chen, M.; Boyle, E.A.; Switzer, A.D.; Gouramanis, C. A century long sedimentary record of anthropogenic lead (Pb), Pb isotopes and other trace metals in Singapore. Environ. Pollut. 2016, 213, 446–459. [Google Scholar] [CrossRef]
- Shalaby, B.; Samy, Y.M.; Mashaly, A.O.; El Hefnawy, M.A.A. Comparative Geochemical Assessment of Heavy Metal Pollutants among the Mediterranean Deltaic Lakes Sediments (Edku, Burullus and Manzala), Egypt. Egypt. J. Chem. 2017, 60, 361–378. [Google Scholar] [CrossRef] [Green Version]
- Halliwell, B.; Gutteridge, J.M. Free Radicals in Biology and Medicine; Oxford University Press: Oxford, UK, 2015. [Google Scholar]
- Gawad, S.S.A. Concentrations of heavy metals in water, sediment and mollusc gastropod, Lanistes carinatus from Lake Manzala, Egypt. Egypt. J. Aquat. Res. 2018, 44, 77–82. [Google Scholar] [CrossRef]
- Buhler, D.R.; Williams, D.E. The role of biotransformation in the toxicity of chemicals. Aquat. Toxicol. 1988, 11, 19–28. [Google Scholar] [CrossRef]
- Regoli, F.; Principato, G.; Bertoli, E.; Nigro, M.; Orlando, E. Biochemical characterization of the antioxidant system in the scallop Adamussium colbecki, a sentinel organism for monitoring the Antarctic environment. Polar Biol. 1997, 17, 251–258. [Google Scholar] [CrossRef]
- Siwela, A.H.; Nyathi, C.; Naik, Y.S. A comparison of metal levels and antioxidant enzymes in freshwater snails, Lymnaea natalensis, exposed to sediment and water collected from Wright Dam and Lower Mguza Dam, Bulawayo, Zimbabwe. Ecotoxicol. Environ. Saf. 2010, 73, 1728–1732. [Google Scholar] [CrossRef] [PubMed]
- NIMET. Nigeria Meteorological Agency; CRC Press: Kaduna, Nigeria, 2010. [Google Scholar]
- KEPA. Kaduna State Environmental Protection Authority, Revised in 1998:1998. Available online: http://www.kepa.org.ng/ (accessed on 31 December 2019).
- Brown, D.; Kristensen, T. A Field Guide to African Freshwater Snails I. West African species. Dan. Bilharz. Lab. Charlottenlund 1993, 32. [Google Scholar]
- United States Environmental Protection Agency (USEPA). Method 3051 A. Microwave Assisted Acid Digestion of Sediments, Sludge’s, Soils and Oils; USEPA, U.S. Government Printing Office: Washington, DC, USA, 1997. Available online: http://www.epa.gov/SW-846/pdfs/3051a (accessed on 31 December 2019).
- Banaee, M.; Sureda, A.; Taheri, S.; Hedayatzadeh, F. Sub-lethal effects of dimethoate alone and in combination with cadmium on biochemical parameters in freshwater snail, Galba truncatula. Comp. Biochem. Physiol. Part C Toxicol. Pharm. 2019, 220, 62–70. [Google Scholar] [CrossRef] [PubMed]
- Chance, B.; Maehly, A. [136] Assay of catalases and peroxidases. Methods Enzymol. 1955, 2, 764–775. [Google Scholar]
- Kakkar, P.; Das, B.; Viswanathan, P. A modified spectrophotometric assay of superoxide dismutase. Indian J. Biochem. Biophys. 1984, 21, 130–132. [Google Scholar]
- Cheng, H.; Li, M.; Zhao, C.; Yang, K.; Li, K.; Peng, M.; Yang, Z.; Liu, F.; Liu, Y.; Bai, R. Concentrations of toxic metals and ecological risk assessment for sediments of major freshwater lakes in China. J. Geochem. Explor. 2015, 157, 15–26. [Google Scholar] [CrossRef]
- Muller, G. Schwermetalle in den sedimenten des Rheins-Veranderungen seit. Umschav 1979, 79, 133–149. [Google Scholar]
- Wang, Y.; Yang, L.; Kong, L.; Liu, E.; Wang, L.; Zhu, J. Spatial distribution, ecological risk assessment and source identification for heavy metals in surface sediments from Dongping Lake, Shandong, East China. Catena 2015, 125, 200–205. [Google Scholar] [CrossRef]
- Hakanson, L. An ecological risk index for aquatic pollution control. A sedimentological approach. Water Res. 1980, 14, 975–1001. [Google Scholar] [CrossRef]
- Loska, K.; Wiechuła, D. Application of principal component analysis for the estimation of source of heavy metal contamination in surface sediments from the Rybnik Reservoir. Chemosphere 2003, 51, 723–733. [Google Scholar] [CrossRef]
- Ma, X.; Zuo, H.; Tian, M.; Zhang, L.; Meng, J.; Zhou, X.; Min, N.; Chang, X.; Liu, Y. Assessment of heavy metals contamination in sediments from three adjacent regions of the Yellow River using metal chemical fractions and multivariate analysis techniques. Chemosphere 2016, 144, 264–272. [Google Scholar] [CrossRef] [PubMed]
- Chai, M.; Shi, F.; Li, R.; Shen, X. Heavy metal contamination and ecological risk in Spartina alterniflora marsh in intertidal sediments of Bohai Bay, China. Mar. Pollut. Bull. 2014, 84, 115–124. [Google Scholar] [CrossRef] [PubMed]
- Cui, J.; Zang, S.; Zhai, D.; Wu, B. Potential ecological risk of heavy metals and metalloid in the sediments of Wuyuer River basin, Heilongjiang Province, China. Ecotoxicology 2014, 23, 589–600. [Google Scholar] [CrossRef]
- Lin, Q.; Liu, E.; Zhang, E.; Nath, B.; Shen, J.; Yuan, H.; Wang, R. Reconstruction of atmospheric trace metals pollution in Southwest China using sediments from a large and deep alpine lake: Historical trends, sources and sediment focusing. Sci. Total Environ. 2018, 613, 331–341. [Google Scholar] [CrossRef]
- Sutherland, R. Bed sediment-associated trace metals in an urban stream, Oahu, Hawaii. Environ. Geol. 2000, 39, 611–627. [Google Scholar] [CrossRef]
- Liu, E.; Birch, G.F.; Shen, J.; Yuan, H.; Zhang, E.; Cao, Y. Comprehensive evaluation of heavy metal contamination in surface and core sediments of Taihu Lake, the third largest freshwater lake in China. Environ. Earth Sci. 2012, 67, 39–51. [Google Scholar] [CrossRef]
- Zhang, R.; Zhou, L.; Zhang, F.; Ding, Y.; Gao, J.; Chen, J.; Yan, H.; Shao, W. Heavy metal pollution and assessment in the tidal flat sediments of Haizhou Bay, China. Mar. Pollut. Bull. 2013, 74, 403–412. [Google Scholar] [CrossRef]
- Zhang, J.; Wang, S.; Xie, Y.; Wang, X.; Sheng, X.; Chen, J. Distribution and pollution character of heavy metals in the surface sediments of Liao River. Huan Jing Ke Xue Huanjing Kexue 2008, 29, 2413–2418. [Google Scholar]
- Mummullage, N.; Wasanthi, S. Source Characterisation of Urban Road Surface Pollutants for Enhanced Water Quality Predictions. Ph.D. Thesis, Queensland University of Technology, Brisbane, Australia, 2015. [Google Scholar]
- Brady, J.P.; Kinaev, I.; Goonetilleke, A.; Ayoko, G.A. Comparison of partial extraction reagents for assessing potential bioavailability of heavy metals in sediments. Mar. Pollut. Bull. 2016, 106, 329–334. [Google Scholar] [CrossRef]
- Duodu, G.O.; Goonetilleke, A.; Ayoko, G.A. Potential bioavailability assessment, source apportionment and ecological risk of heavy metals in the sediment of Brisbane River estuary, Australia. Mar. Pollut. Bull. 2017, 117, 523–531. [Google Scholar] [CrossRef] [PubMed]
- Brady, J.P. Heavy Metals in the Sediments of Northern Moreton Bay, Queensland, Australia. Ph.D. Thesis, Queensland University of Technology, Brisbane, Australia, 2015. [Google Scholar]
- Liu, R.; Bao, K.; Yao, S.; Yang, F.; Wang, X. Ecological risk assessment and distribution of potentially harmful trace elements in lake sediments of Songnen Plain, NE China. Ecotoxicol. Environ. Saf. 2018, 163, 117–124. [Google Scholar] [CrossRef] [PubMed]
- Wang, Y.; Hu, J.; Xiong, K.; Huang, X.; Duan, S. Distribution of heavy metals in core sediments from Baihua Lake. Procedia Environ. Sci. 2012, 16, 51–58. [Google Scholar] [CrossRef] [Green Version]
- Suresh, G.; Ramasamy, V.; Meenakshisundaram, V.; Venkatachalapathy, R.; Ponnusamy, V. Influence of mineralogical and heavy metal composition on natural radionuclide concentrations in the river sediments. Appl. Radiat. Isot. 2011, 69, 1466–1474. [Google Scholar] [CrossRef]
- Mohiuddin, K.; Otomo, K.; Ogawa, Y.; Shikazono, N. Seasonal and spatial distribution of trace elements in the water and sediments of the Tsurumi River in Japan. Environ. Monit. Assess. 2012, 184, 265–279. [Google Scholar] [CrossRef]
- Chandra, R.; Yadav, S.; Yadav, S. Phytoextraction potential of heavy metals by native wetland plants growing on chlorolignin containing sludge of pulp and paper industry. Ecol. Eng. 2017, 98, 134–145. [Google Scholar] [CrossRef]
- Varol, M.; Şen, B. Assessment of nutrient and heavy metal contamination in surface water and sediments of the upper Tigris River, Turkey. Catena 2012, 92, 1–10. [Google Scholar] [CrossRef]
- Chung, C.Y.; Chen, J.J.; Lee, C.G.; Chiu, C.Y.; Lai, W.L.; Liao, S.W. Integrated estuary management for diffused sediment pollution in Dapeng Bay and neighboring rivers (Taiwan). Environ. Monit. Assess. 2011, 173, 499–517. [Google Scholar] [CrossRef]
- Li, J.; He, M.; Han, W.; Gu, Y. Analysis and assessment on heavy metal sources in the coastal soils developed from alluvial deposits using multivariate statistical methods. J. Hazard. Mater. 2009, 164, 976–981. [Google Scholar] [CrossRef]
- Peijnenburg, W.J.; Zablotskaja, M.; Vijver, M.G. Monitoring metals in terrestrial environments within a bioavailability framework and a focus on soil extraction. Ecotoxicol. Environ. Saf. 2007, 67, 163–179. [Google Scholar] [CrossRef]
- Harish, S.; Murugan, K. Oxidative stress indices in natural populations of Avicennia alba Blume. as biomarker of environmental pollution. Environ. Res. 2011, 111, 1070–1073. [Google Scholar] [CrossRef] [PubMed]
- Shahid, M.; Pourrut, B.; Dumat, C.; Nadeem, M.; Aslam, M.; Pinelli, E. Heavy-metal-induced reactive oxygen species: Phytotoxicity and physicochemical changes in plants. In Reviews of Environmental Contamination and Toxicology; Springer: New York, NY, USA, 2014; Volume 232, pp. 1–44. [Google Scholar]
- Asaeda, T.; Barnuevo, A. Oxidative stress as an indicator of niche-width preference of mangrove Rhizophora stylosa. Forest Ecol. Manag. 2019, 432, 73–82. [Google Scholar] [CrossRef]
Figure 1.
Map of River Kaduna showing sampling sites.

Figure 2.
Cluster analysis for the relationship between (a) sites; (b) heavy metals.

Figure 3.
Antioxidant enzymes activities in Bellamya unicolor across the sites for (a) catalase (CAT); (b) superoxide dismutase (SOD).
Figure 3.
Antioxidant enzymes activities in Bellamya unicolor across the sites for (a) catalase (CAT); (b) superoxide dismutase (SOD).


Table 1.
Consensus-based sediment quality guideline values (mg/kg) for heavy metals in sediment and averages for metals concentration in sediments and Bellamya unicolor sampled from the River Kaduna.
Table 1.
Consensus-based sediment quality guideline values (mg/kg) for heavy metals in sediment and averages for metals concentration in sediments and Bellamya unicolor sampled from the River Kaduna.
| Fe | Mn | Cu | Zn | Cd | Cr | Pb | Ni | Co | |
|---|---|---|---|---|---|---|---|---|---|
| CSd | 90.8225 | 42.2875 | 31.285 | 33.5475 | 29.4975 | 46.67625 | 67.66875 | 31.6575 | 34.6275 |
| Range | 34.54–165.32 | 6.36–78.98 | 1.63–59.01 | 4.50–61.48 | 0.96–58.84 | 16.09–79.20 | 39.43–96.08 | 2.64–60.08 | 11.42–62.61 |
| CSn | 20.8825 | 9.0625 | 7.295 | 7.555 | 7.4225 | 10.3725 | 15.0375 | 7.27 | 7.435 |
| Range | 6.61–33.30 | 1.34–22.75 | 0.54–16.51 | 1.74–18.63 | 0.92–17.52 | 4.26–17.24 | 6.24–24.20 | 0.63–14.17 | 1.6–21.46 |
| TEL | NA | NA | 35.7 | 123 | 0.596 | 37.3 | 35 | 18 | NA |
| PEL | NA | NA | 197 | 315 | 3.53 | 90 | 91.3 | 36 | NA |
Note: CSd = Concentration of heavy metals in sediment. CSn = Concentration of heavy metals in freshwater snail: Bellamya unicolor. TEL = Threshold effect level. PEL = Probable effect level, NA = Not available.
Table 2.
Comparison between sediment quality guidelines (SQGs) and concentration of heavy metals in sediment of the River Kaduna.
Table 2.
Comparison between sediment quality guidelines (SQGs) and concentration of heavy metals in sediment of the River Kaduna.
| SQGs | Fe | Mn | Cu | Zn | Cd | Cr | Pb | Ni | Co |
|---|---|---|---|---|---|---|---|---|---|
| % of samples < TEL | NA | NA | 53.6 | 100 | 0 | 42.6 | 0 | 38.8 | NA |
| % of samples btw TEL-PEL | NA | NA | 46.4 | 0 | 20.8 | 57.4 | 100 | 61.2 | NA |
| % of samples > PEL | NA | NA | 0 | 0 | 79.2 | 0 | 0 | 0 | NA |
Note: TEL = Threshold effect level. PEL = Probable effect level, NA = Not available.
Table 3.
Geoaccumulation (Igeo) values of heavy metals in sediments and their class.
| Igeo | ||||||||
|---|---|---|---|---|---|---|---|---|
| Sites | Mn | Cu | Zn | Cd | Cr | Pb | Ni | Co |
| S1 | 11.81 | 5.61 | 8.15 | −2.39 | 9.89 | 9.00 | 6.42 | 5.78 |
| S2 | 12.47 | 7.04 | 8.40 | −2.91 | 10.31 | 9.03 | 7.51 | 7.13 |
| S3 | 15.34 | 10.79 | 11.96 | 3.53 | 12.09 | 10.31 | 11.40 | 9.62 |
| S4 | 13.68 | 8.18 | 10.07 | 0.33 | 10.96 | 9.72 | 9.24 | 7.84 |
| S5 | 15.44 | 10.79 | 11.93 | 3.56 | 12.21 | 10.32 | 11.41 | 9.63 |
| Mean | 13.75 | 8.48 | 10.10 | 0.42 | 11.09 | 9.68 | 9.19 | 8.00 |
| Level | 6 | 6 | 6 | 1 | 6 | 6 | 6 | 6 |
Note: S = Site.
Table 4.
Enrichment factor (ErF) values of heavy metals in sediment samples from the River Kaduna.
| (Individual Metal) | (Multi-Metal) ErF | ||||||||
|---|---|---|---|---|---|---|---|---|---|
| Sites | Mn | Cu | Zn | Cd | Cr | Pb | Ni | Co | ErF |
| S1 | 0.01 | 0.02 | 0.03 | 35.86 | 0.32 | 2.27 | 0.38 | 1.32 | 40.21 |
| S2 | 0.02 | 0.07 | 0.04 | 25.31 | 0.43 | 2.32 | 0.58 | 3.26 | 32.03 |
| S3 | 0.16 | 0.62 | 0.44 | 2160.00 | 1.45 | 5.60 | 8.51 | 17.74 | 2194.52 |
| S4 | 0.09 | 0.32 | 0.24 | 1103.20 | 0.88 | 4.07 | 4.56 | 9.26 | 1122.61 |
| S5 | 0.17 | 0.62 | 0.45 | 2206.41 | 1.58 | 5.65 | 8.58 | 17.89 | 2241.35 |
| Mean | 0.09 | 0.33 | 0.24 | 1106.16 | 0.93 | 3.98 | 4.52 | 9.89 | 1126.14 |
Note: S = Site.
Table 5.
Pearson correlation analysis among heavy metals and antioxidant enzymes.
| Fe | Mn | Cu | Zn | Cd | Cr | Pb | Ni | Co | SOD | CAT | |
|---|---|---|---|---|---|---|---|---|---|---|---|
| Fe | 1 | ||||||||||
| Mn | 0.584 | 1 | |||||||||
| Cu | 0.777 ** | 0.567 | 1 | ||||||||
| Zn | 0.671 * | 0.984 ** | 0.619 | 1 | |||||||
| Cd | 0.728 * | 0.971 ** | 0.660 * | 0.985 ** | 1 | ||||||
| Cr | 0.632 | 0.988 ** | 0.555 | 0.993 ** | 0.981 ** | 1 | |||||
| Pb | 0.765 ** | 0.592 | 0.994 ** | 0.638 * | 0.671 * | 0.572 | 1 | ||||
| Ni | 0.672 * | 0.978 ** | 0.622 | 0.993 ** | 0.988 ** | 0.992 ** | 0.634 * | 1 | |||
| Co | 0.640 * | 0.982 ** | 0.585 | 0.993 ** | 0.983 ** | 0.987 ** | 0.608 | 0.986 ** | 1 | ||
| SOD | 0.809 ** | 0.822 ** | 0.845 ** | 0.827 ** | 0.877 ** | 0.809 ** | 0.860 ** | 0.832 ** | 0.822 ** | 1 | |
| CAT | 0.567 | 0.779 ** | 0.758 * | 0.765 ** | 0.769 ** | 0.735 * | 0.801 ** | 0.759 * | 0.777 ** | 0.904 ** | 1 |
Note: ** Correlation is significant at the 0.01 level (2-tailed), * Correlation is significant at the 0.05 level (2-tailed), SOD = Superoxide dismutase, CAT = Catalase.
Table 6.
Principal component analysis (PCA) loadings for heavy metals in sediment (Sd) and Bellamya unicolor (S).
Table 6.
Principal component analysis (PCA) loadings for heavy metals in sediment (Sd) and Bellamya unicolor (S).
| Component | |||
|---|---|---|---|
| Heavy Metal | PC1 | PC2 | PC3 |
| Fe_S | 0.74 | 0.40 | 0.03 |
| Mn_S | 0.97 | −0.20 | −0.02 |
| Cu_S | 0.73 | −0.23 | 0.01 |
| Zn_S | 0.98 | −0.17 | −0.02 |
| Cd_S | 0.99 | −0.10 | 0.00 |
| Cr_S | 0.97 | −0.23 | −0.02 |
| Pb_S | 0.75 | −0.17 | 0.05 |
| Ni_S | 0.98 | −0.16 | 0.03 |
| Co_S | 0.97 | −0.22 | 0.30 |
| Fe_Sd | 0.85 | 0.26 | 0.21 |
| Mn_Sd | 0.97 | −0.18 | 0.07 |
| Cu_Sd | 0.97 | 0.63 | −0.01 |
| Zn_Sd | 0.68 | 0.36 | −0.05 |
| Cd_Sd | 0.98 | −0.18 | −0.05 |
| Cr_Sd | 0.98 | −0.16 | 0.01 |
| Pb_Sd | 0.97 | 0.60 | −0.09 |
| Ni_Sd | 0.67 | 0.33 | −0.52 |
| Co_Sd | 0.24 | 0.07 | 0.95 |
| Eigenvalue | 13.82 | 1.59 | 1.24 |
| Total variance (%) | 76.80 | 8.81 | 6.89 |
Note: Method of extraction: principal component analysis. Rotation method. Bold numbers indicate a strong loading value (>0.9); moderate loading value (>0.5).
© 2020 by the authors. Licensee MDPI, Basel, Switzerland. This article is an open access article distributed under the terms and conditions of the Creative Commons Attribution (CC BY) license (http://creativecommons.org/licenses/by/4.0/).
Share and Cite
MDPI and ACS Style
Aljahdali, M.O.; Alhassan, A.B. Metallic Pollution and the Use of Antioxidant Enzymes as Biomarkers in Bellamya unicolor (Olivier, 1804) (Gastropoda: Bellamyinae). Water 2020, 12, 202. https://doi.org/10.3390/w12010202
AMA Style
Aljahdali MO, Alhassan AB. Metallic Pollution and the Use of Antioxidant Enzymes as Biomarkers in Bellamya unicolor (Olivier, 1804) (Gastropoda: Bellamyinae). Water. 2020; 12(1):202. https://doi.org/10.3390/w12010202
Chicago/Turabian StyleAljahdali, Mohammed Othman, and Abdullahi Bala Alhassan. 2020. "Metallic Pollution and the Use of Antioxidant Enzymes as Biomarkers in Bellamya unicolor (Olivier, 1804) (Gastropoda: Bellamyinae)" Water 12, no. 1: 202. https://doi.org/10.3390/w12010202
Note that from the first issue of 2016, this journal uses article numbers instead of page numbers. See further details here.