A Clustered, Decentralized Approach to Urban Water Management


1
Department of Environmental and Civil Engineering, U.A. Whitaker College of Engineering, Florida Gulf Coast University, 10501 FGCU Boulevard, Fort Myers, FL 33965-6565, USA
2
Emergent Technologies Institute, U.A. Whitaker College of Engineering, 16301 Innovation Lane, Florida Gulf Coast University, Fort Myers, FL 33913, USA
*
Author to whom correspondence should be addressed.
Water 2020, 12(1), 185; https://doi.org/10.3390/w12010185
Submission received: 13 September 2019
/
Revised: 22 November 2019
/
Accepted: 21 December 2019
/
Published: 9 January 2020
(This article belongs to the Special Issue Management of Urban Water Services)
Abstract
:Current models in design of urban water management systems and their corresponding infrastructure using centralized designs have commonly failed from the perspective of cost effectiveness and inability to adapt to the future changes. These challenges are driving cities towards using decentralized systems. While there is great consensus on the benefits of decentralization; currently no methods exist which guide decision-makers to define the optimal boundaries of decentralized water systems. A new clustering methodology and tool to decentralize water supply systems (WSS) into small and adaptable units is presented. The tool includes two major components: (i) minimization of the distance from source to consumer by assigning demand to the closest water source, and (ii) maximization of the intra-cluster homogeneity by defining the cluster boundaries such that the variation in population density, land use, socio-economic level, and topography within the cluster is minimized. The methodology and tool were applied to Arua Town in Uganda. Four random cluster scenarios and a centralized system were created and compared with the optimal clustered WSS. It was observed that the operational cost of the four cluster scenarios is up to 13.9 % higher than the optimal, and the centralized system is 26.6% higher than the optimal clustered WSS, consequently verifying the efficacy of the proposed method to determine an optimal cluster boundary for WSS. In addition, optimal homogeneous clusters improve efficiency by encouraging reuse of wastewater and stormwater within a cluster and by minimizing leakage through reduced pressure variations.
1. Introduction
Human well-being and improvement are governed by the availability of water and energy [1]. These resources are either becoming less abundant relative to demand or are running the risk of critical scarcity in many places with recent crises occurring in Cape Town, South Africa and Chennai, India [2,3]. Despite long- and short-term shortages, the conventional approach of designing centralized urban utility systems has been driven by 19th century technological principles, applied during a time when resources were abundant, demand was relatively small, and growth in urban areas was rapid [4]. This approach has led to a highly complex, interconnected, and dysfunctional systems that are a hindrance to efficient and sustainable resource management, particularly where growth patterns were uncontrolled and chaotic. With increasing global change pressures including population increases and climate change, there are increasing concerns about whether conventional centralized water systems will be able to manage scarcer and less reliable water resources in a cost- efficient manner [5,6]. These systems also require a huge management effort and small changes in one part of the system can cause change propagation through the whole system. For example, the rationing of water in areas with a scarce water supply is a complex problem. The problem is even greater in the case of large systems and when network distribution system pressure variation is high, and the treated water supply is intermittent. This can cause unacceptable variations in the distribution system pressure with some cities having negative pressure during parts of high demand days (e.g., Jeddah, Saudi Arabia).
The conventional approach of design of infrastructure systems has been based on deterministic assumptions about the future despite the reality that such conditions are unknown. Urban systems face a range of future dynamic global change pressures such as population growth and urbanization, changes in socio-economic conditions, and technological developments. The current models of urban resource management and their corresponding complex infrastructure have already failed or are on the verge of collapse from the perspective of cost effectiveness, performance, and inability to adapt to the future change requirements, and loss of water-supply sources [7]. For example, the long-term planning of a large centralized water system under conditions of uncertain spatial growth of population may lead to consequences such as unnecessary investment, leading to system performance problems or other issues.
In order to cope with these challenges, various researchers have proposed decentralization of urban water systems. Decentralized water systems are small sub-systems (clusters) that have a large degree of autonomy within the overall system. According to Bieker et al. [8], future urban water systems are likely to be more decentralized than conventional systems because added water reuse systems require reducing the distance between water users and treatment locations. In addition, decentralization minimizes energy demand and infrastructure costs and maximizes the potential for recovery of heat energy if water is used close to where it is generated [8,9,10,11,12].
Besides efficient use and reuse of scarce and less reliable resources, there are additional reasons that support the shift from conventional centralized water systems to decentralized clustered water systems. Clustered systems could be adapted to future changes with low effort and without affecting the performance of the entire system [13,14]. Their modular diversity exponentially increases the number of possible configurations that can be achieved for urban water systems from a given set of inputs. Decentralized/clustered water systems can be implemented in an incremental fashion, which reduces investment costs and makes the transition easier to manage [15,16,17]. In addition, decentralized water systems allow a staged development that traces the urban growth trajectory more closely and can be implemented more quickly than a conventional approach (as the planning and implementation process is easier to manage). According to Wang et al. [16], the gradual stepwise development of decentralized systems enables the expansion of urban water systems that follows the spatial growth, and hence, embeds flexibility to water systems. In addition, clustered systems provide a better capacity to reduce the risk associated with water-system contamination through biological or chemical ingression as well as malicious attacks with chemical, biological and/or radiological agents. This is because decentralized units are small and independent units where the effect associated with water contamination and malicious attacks will be contained within a cluster. However, in case of centralized urban water-supply systems any contaminant ingression and malicious attack could propagate to the whole systems. Internal peak demand storage of potable water, in the form of aquifer storage and recovery systems, can be integrated into decentralized systems wherein the injection and recovery wells can be placed near ground storage tanks or pumping stations within the localized distribution and not only near the water treatment plants [18].
While there is great consensus on the benefits of decentralized water systems, one of the challenges for cities to move to a decentralized resource management is the lack of clear understanding on what clustered water systems should look like. To the best of our knowledge, no methods exist which guide planners in how to cluster/decentralize urban water systems. Thus, this paper presents a clustering methodology/tool that allows for better clustering of urban water systems into small and adaptable units. The efficacy of the developed clustering methodology/tool is also demonstrated in a real case study of Arua, Uganda.
2. Methods
2.1. Proposed Water Supply System Clustering Method
The proposed clustering methodology for water supply systems (WSS) is based on two major principles: (i) minimization of the distance from source to consumer, and (ii) maximization of the homogeneity within the cluster. In order to define an optimal cluster boundary that minimizes source-demand distance and maximizes the homogeneity within the cluster, various parameters such as the location of water sources (surface water and ground water), topography (Digital elevation-DEM), spatial and temporal distribution of population, land use characteristics, and the socio-economic status of the area are considered [19]. These parameters are used to define source-demand distance, intra-cluster demand, and topographic homogeneity of the study area [20].
2.2. Source-Demand Distance
The clustered system efficient use of diversified local resources is a key reason why they are more resilient than conventional urban water systems. The sources-demand location plays an important role in reducing the transport distance of water and associated investment cost. Assigning demand to the nearest source location reduces the effort to collect and distribute water to the users. This reduces the cost of the pipe network (due to reduced pipe size/length) required and the energy needed for pumping long distances. Leakage is dependent on system pressure. Basically, the higher the pressure, the larger the leak flow and vice versa [21]. The break rates of water mains depend of several factors such as pipe material, pipe condition and pipe length [22]. The reduction of source-demand distance using a clustered approach results in lesser transport of water for use and reuse, thereby maximizing resource conservation and minimizing losses (i.e., leakage). In addition, it improves the potential to reuse and recycle wastewater to the proximity within the cluster.
2.3. Intra-Cluster Demand and Topographic Homogeneity
Understanding the water consumption and topography characteristics is extremely important for optimization of investment, operation costs and maximization of resource efficiency. Traditionally, analyses were performed for large regions which involved a variety of topography, land uses, and associated demand characteristics. However, with the advent of clustering, study of the behavior of smaller areas has become necessary to allow for the creation of uniformity within the clusters. The population distribution, land use and socio-economic parameters are aggregated into a spatio-temporal demand distribution of the area. Intra-cluster demand homogeneity is used as one of the parameters to minimize the effort required to move water and wastewater. Intra-cluster homogeneity is the measure of the similarities or dissimilarities between parcels of the same cluster. Clustering of large and small demand areas together involves huge variations in consumption which can cause larger pressure fluctuations than areas with similar demand distribution. This causes additional efforts to supply and manage water and wastewater in the area. For example, areas with urban agriculture have different demand patterns than industrial or residential areas. Thus, maximizing the similarities by clustering residential and agricultural areas separately will improve the required efforts as compared to if they were clustered together. The clustering of different land uses into unique clusters will ensure multiple uses of water by cascading it from higher to lower-quality needs and through reclamation treatments for a return to the supply side of the other cluster. Water used by residential clusters can be re-used by industrial or agricultural clusters. Demand based clustering also improves the ability to implement relevant technology (i.e., water treatment and wastewater reuse recycling schemes) within a homogeneous cluster. This also allows better control of small and homogeneous cluster units.
Topography is the other major factor which affects the flow of water and wastewater. Areas with similar topographic characteristics (minimum differential relief) reduces cost associated with infrastructure and pumping of water and wastewater in the area. However, large variations in topography increases the effort required to collect and supply water, discharge wastewater, and develop reuse systems. For example, water supply systems in areas with large topographic variations cause large pressure fluctuations and require a large amount of energy for pumping, as well as a large system capacity to satisfy the required level of service. Thus, partitioning the urban area based on improved intra-cluster topographic homogeneity will reduce the costs associated with water system investment and operation (energy). It allows for improved resource efficiency by encouraging reuse and recycling of wastewater within the cluster and by minimizing leakage (distribution system water loss) through reduced pressure variations. It is recognized that inhomogeneity of demand pattern (i.e., industrial, commercial, and residential)/variation (evening/day) within a large urban water system can be beneficial as the peak demands of different types of users do not overlap. However, the analysis conducted herein focuses on the homogeneity of source-demand distance, and the reduction of topographic variations within a decentralized cluster to reduce demand pressure variations and effort required to transport water for use/reuse.
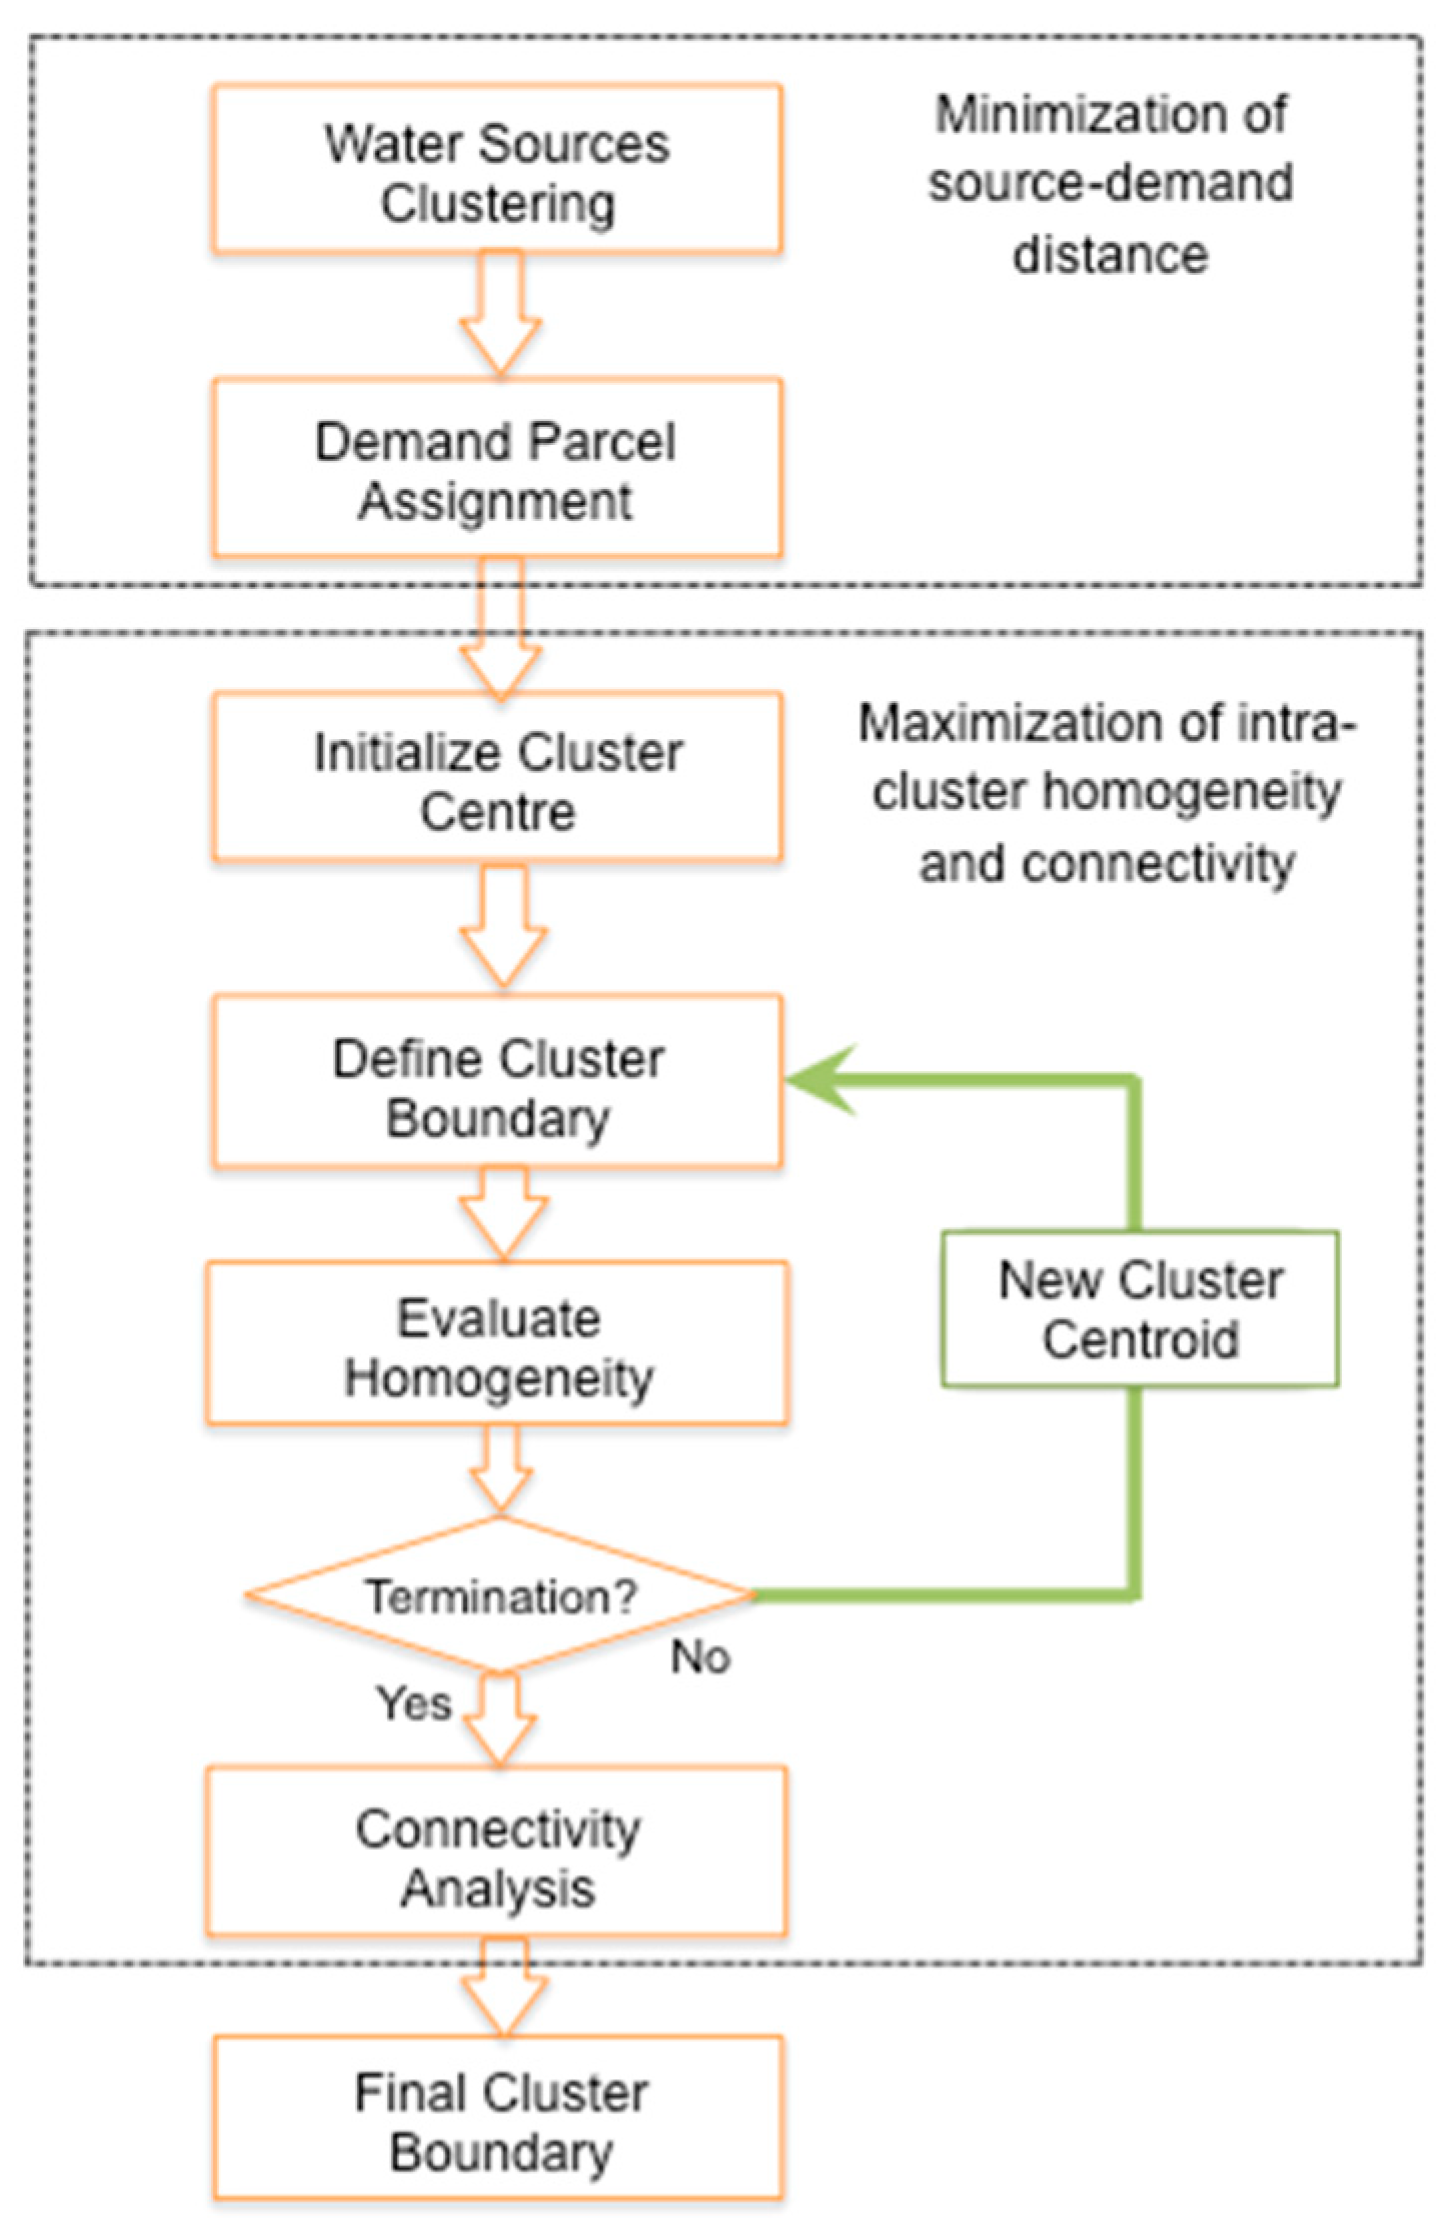
The methodology uses two major steps for clustering water-supply systems (WSS); minimization of source-demand distance and maximization of intra-cluster homogeneity. The details of the proposed steps are shown in Figure 1. The starting point of the proposed method to cluster WSS is to consider all the input parameters of the study areas. This involves the location of water sources (surface water, groundwater, and stormwater collection points), topography, spatio-temporal population growth and associated demand, land use characteristics and socio-economic status. Thus, the proposed clustering method minimizes the source-demand distance by assigning demand to the source. The Euclidean norm minimization approach is used to minimize source-demand distance. This method also maximizes the homogeneity within the cluster so that source-demand distance, topography, and demand variations are minimized. Euclidean norm is chosen as a method of minimization because, in many scientific and engineering applications, the data space is Euclidean and the Euclidean metric has the advantage of being isotropic (rotation invariant) where all vectors are processed in the same way, regardless of their orientation [23,24]. A K-means algorithm is applied to maximize intra-cluster homogeneity [20].
2.4. Minimization of Source-Demand Distance
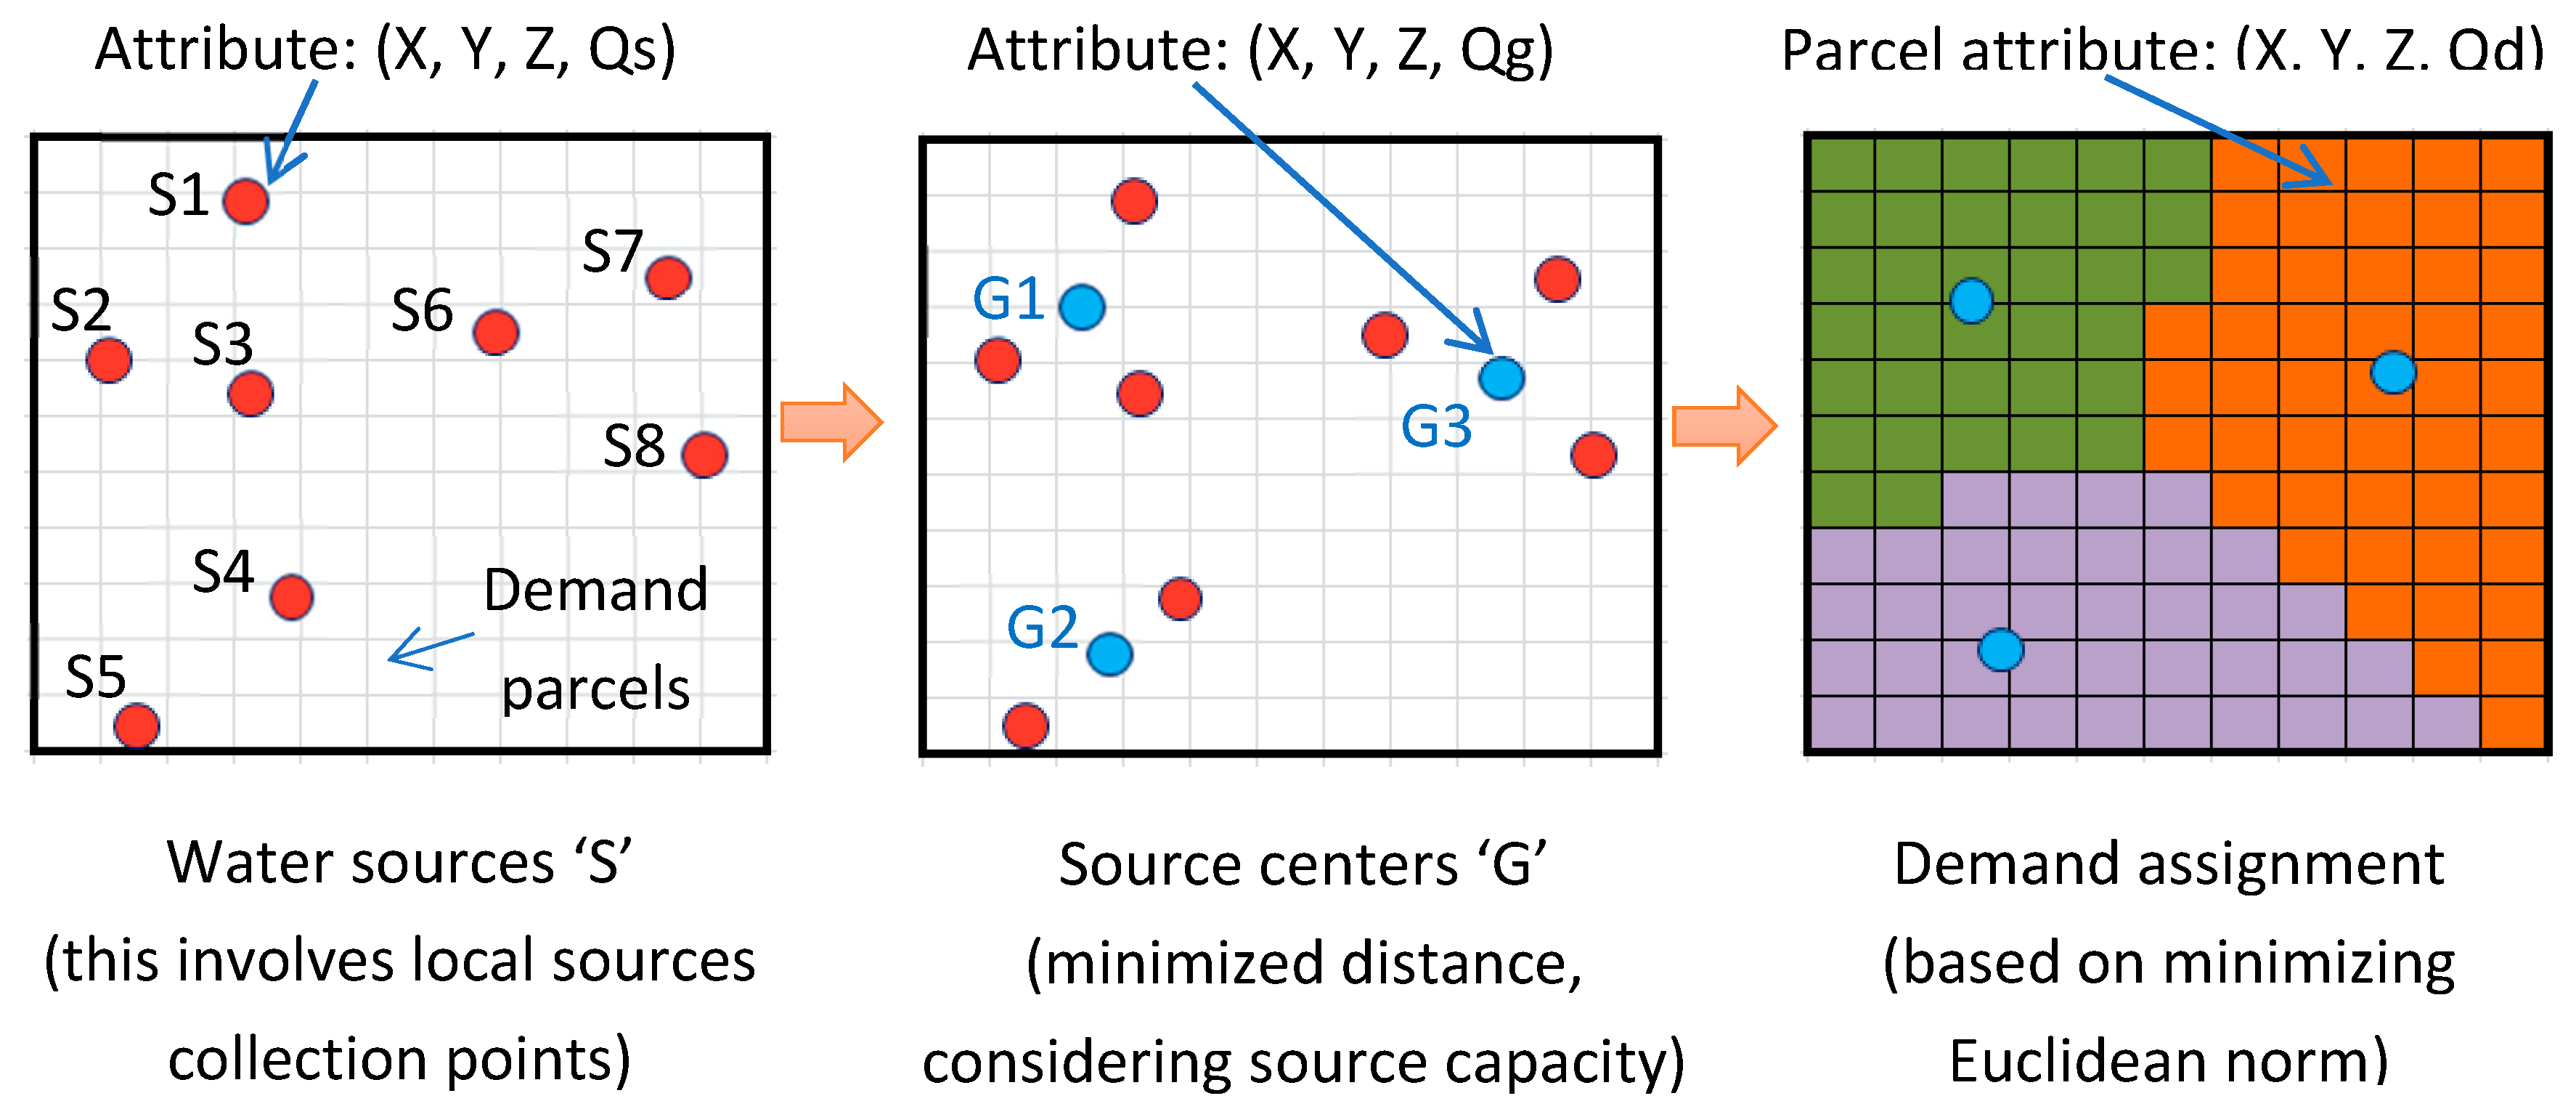
The first part of the proposed clustering method involves prior grouping of spatially distributed available water sources, such as surface and groundwater sources, stormwater, and greywater. This method involves grouping water sources and determining their group center such that the effort required for collection is minimized. Then each demand parcel is assigned to one source group center such that the distance between source and demand parcel (grid cell) is minimized. Grid parcels are square cells characterized by attributes of spatial location (X and Y coordinates), elevation, and demand. The source-demand distance for each parcel depends on the specified source center locations. Euclidean norm minimization is used to optimize the source-demand distance for all clusters. The formulation is done as a demand assignment problem where each parcel is assigned to the nearest source. Then parcel membership is determined from the minimization process.
The determination of the optimal number of source centers is not the focus of this paper. The number of clusters for the area can be determined from the required size of a cluster. According to Bieker et al. [8], the size of a cluster must be guided by the principle “as small as possible, as big as necessary” to achieve the ecological, economic, and social interest. BMBF [25] compared different scales for areas which range from 10,000 up to more than 200,000 people and proposed a recommended size ranging from 50,000 to 100,000 people as a suitable scale for an integrated decentralized system for fast growing urban areas. Bieker et al. [8] argued that this scale offers huge opportunity in recovering heat from wastewater streams as the transport distance is short. The size of a cluster could be used to pre-determine an initial number of clusters or source groups and could be changed during the process of clustering. For example, considering an area with 8 water sources and 121 demand parcels (each representing a 100 m by 100 m area), the pictorial representation of the demand parcel assignment to the nearest source center is shown in Figure 2.
2.5. Identification of Source Centers: Water Source Clustering
Once the groups of sources are identified, a simple source center calculation is carried out to determine the centroid of the sources within the same group. Taking a similar approach as in determining a mass center, the source center is calculated using Equation (1),
where Dc is source center, Qi and Di are the supply capacity of the source and the distance from reference water source.
2.6. Assignment of Demand Parcel to the Nearest Source
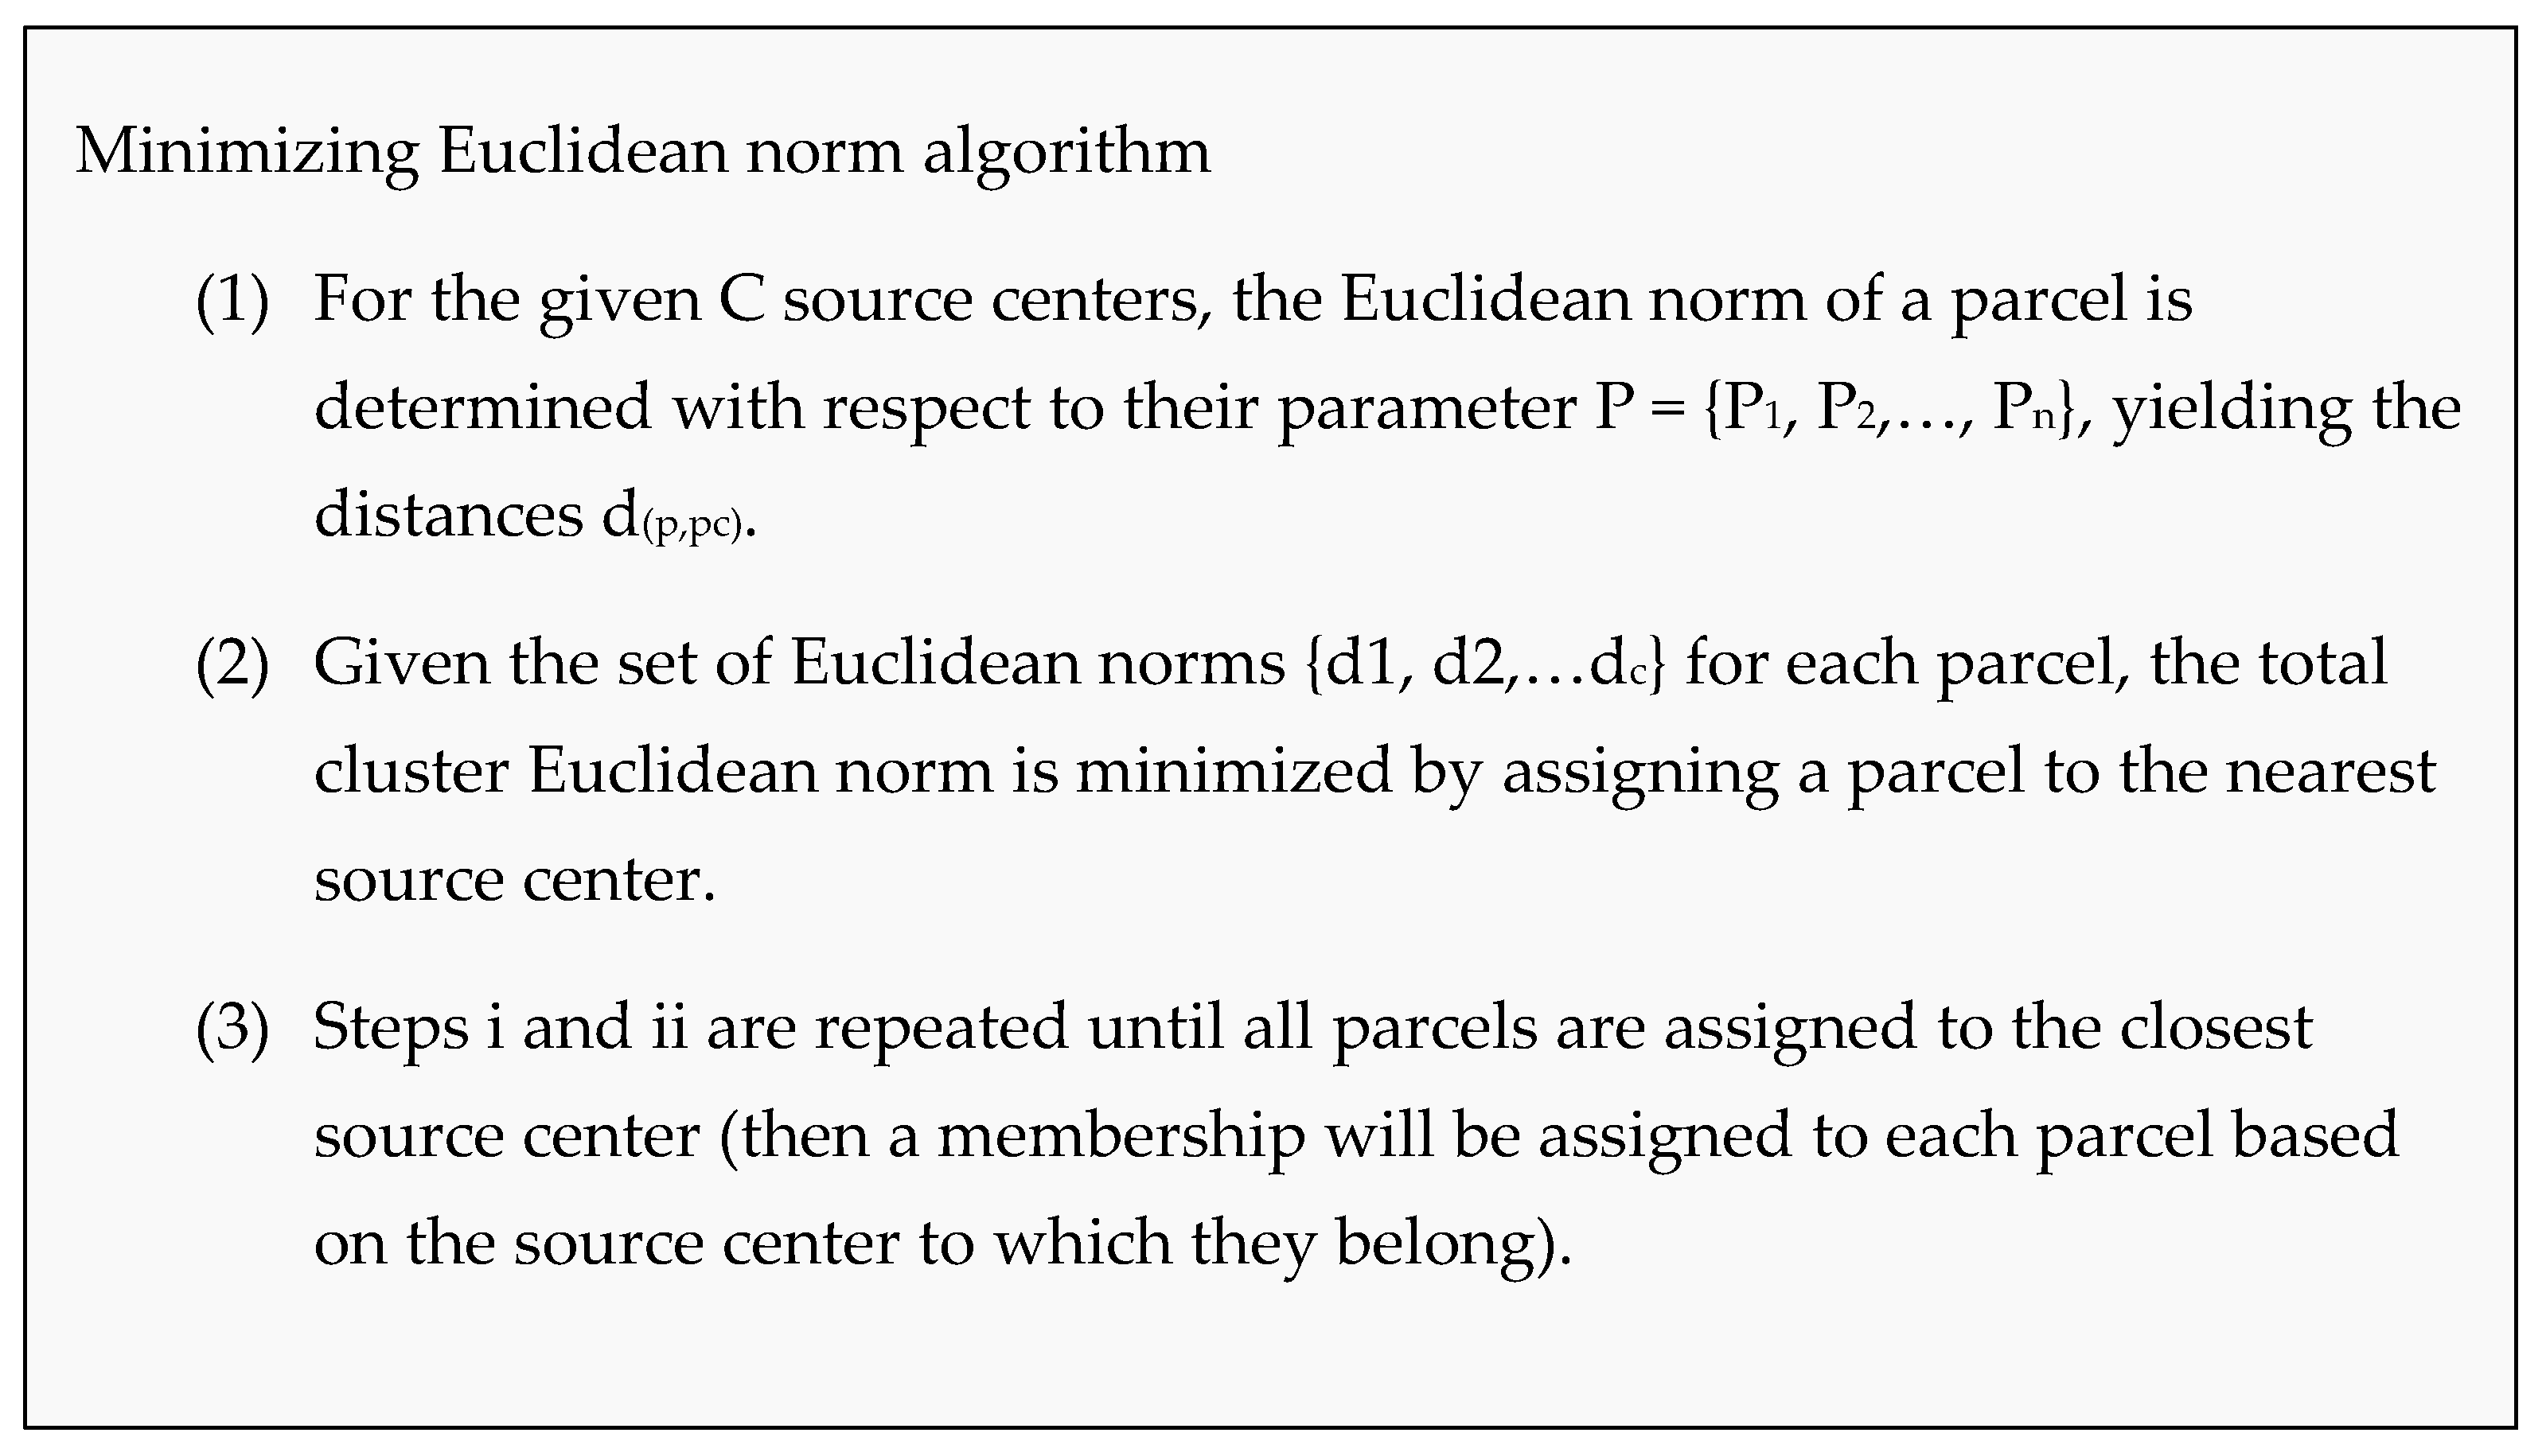
Source allocation is a demand assignment problem where demand parcels are assigned to the nearest source center. The method employs a minimization of the sum of Euclidean norms within the cluster. Some researchers have proposed minimizing the sum of Euclidean distance for shortest-path optimization [26]. The theories and algorithms for minimizing Euclidean distance can be applied to many optimization problems. In this study, the sum of Euclidean norms is used to determine the membership of parcels based on the shortest distance to the water source centers. The same membership is given to the parcels that are assigned to the same source center. This increases the compactness [27] and reduces the cost of pipe networks and the energy needed for pumping long distances. Compacted networks with closer proximity also increase resource efficiency by reducing leakage that would be higher in large centralized systems. Given a set of parcels (representing the study area) with dimension vector P = {P1, P2,…,Pn}, Euclidean norm defines, the absolute value of P. is the Euclidean norm of P that is used to measure the distance between points [28]. For example, suppose and the source centers are defined by . Then the shortest distance from the source to the parcel is determined using Equation (2).
Given the Euclidean norm of each parcel (from each source center), distance minimization is performed using Equation (3),
where is the Euclidean norm from the source centers, is the minimum Euclidian norm of each parcel from source centers, is an attribute which is described by parameters where the variation needs to be minimized (i.e location and elevation parameters). Then, each parcel will have membership (to the source center) based on the minimization of Euclidean norms. The membership defines grouping of similar parcels which are assigned to the same source center. The Euclidean norm minimization algorithm is shown in Figure 3.
The movement of water is based on an absolute distance which depends on the link (pipe) layout and pressure distribution; this requires hydraulic simulation of the whole network. However, to simplify the clustering process, in this study the minimization of the Euclidean norm is employed by using the relative distance based on the coordinate of demand parcels and supply centers. Once the parcels are assigned to the source center by the minimizing Euclidean norm principle, the membership values are used in the maximization of cluster homogeneity.
2.7. Maximization Intra-Cluster Homogeneity and Connectivity
Traditionally, the design of WSS has been performed for large spatial extent areas which involve a variety of topography, population distribution, land use, socio-economic, and associated demands. However, with the advent of decentralization, the study of the behavior of smaller areas has become a necessity so as to allow for uniformity within the clusters. In this section, clustering involving the maximization of intra-cluster homogeneity and connectivity analysis is used. Intra-cluster homogeneity is used to measure the similarity or dissimilarity between parcels of the same cluster. Maximization of intra-cluster homogeneity allows clustering the parcels so that parcel attributes within a cluster are closely related to one another [20]. Three major parameters are considered in the clustering process. These are membership (determined by Euclidean norm minimization), topography (elevation of the parcels), and spatio-temporal demand distribution (determined from the population distribution, land use, and socio-economic parameters). The clustering process involves the grouping of similar parcels. An inter-cluster homogeneity is used as a measure of similarity between parcels and a K-means optimization technique is employed to maximize intra-cluster homogeneity by minimizing the total cluster variance with respect to the mean value. In addition, a connectivity analysis is proposed to ensure the linkage of parcels within clusters. The details of the proposed steps are discussed in the subsections.
2.8. K-means for Clustering WSS
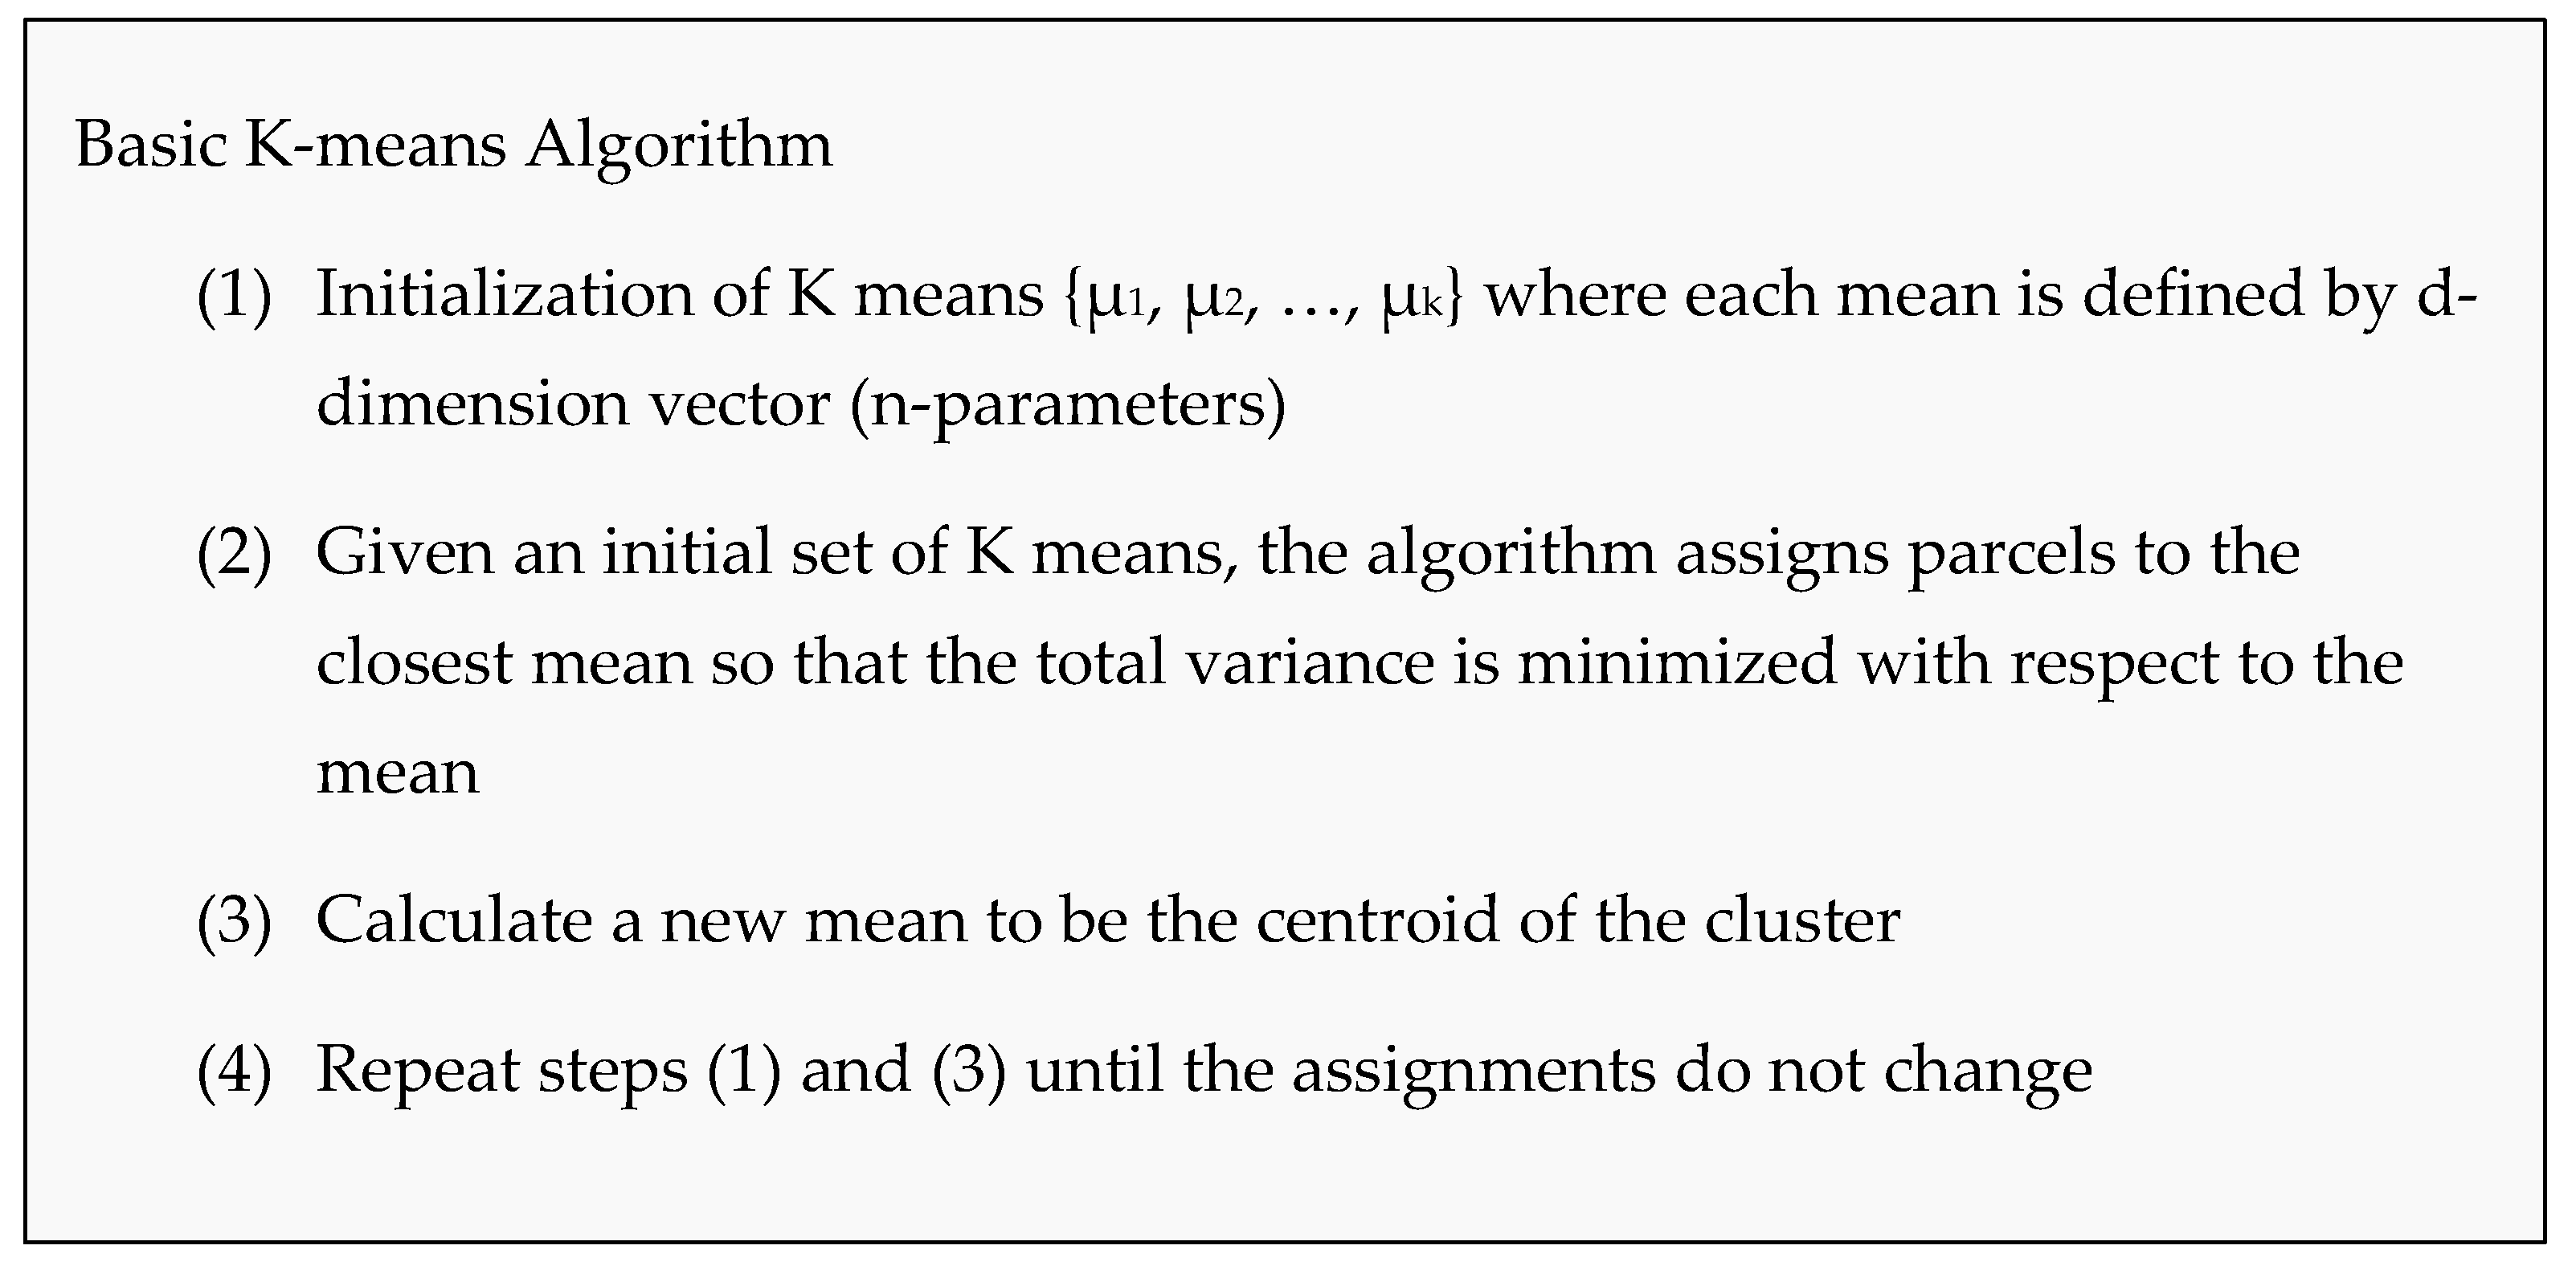
“K-means clustering is a method of cluster analysis which aims to partition n observations into K clusters in which each observation belongs to the cluster with the nearest mean” [29]. It is an evolutionary algorithm that minimizes the proximity to the mean of the cluster [29]. The name K-means comes from its method of operation in which it assigns observation on K clusters based on the observation proximity to the mean of the cluster. The squared Euclidean norm is used as a measure of homogeneity. A K-means algorithm is a commonly employed method that converges to a local optimum value for clustering. It is very popular because it is computationally fast and memory efficient. A K-means algorithm is used herein to cluster the WSS based on the principle of minimizing the dissimilarity of the three parameters: source-demand distance, topography, and demand within the cluster. Unlike topography and demand, the distance parameter is dependent on the source centers; thus, distance related membership value (discussed earlier) is used to identify to which source center each parcel is assigned.
Given a set of parcels p representing the study area {X1, X2,…, Xp}, where each parcel has n-dimensions (i.e., topography, elevation), K-means clustering aims to partition the parcels (p) into K clusters (K≤p) within an assigned data-set S {S1, S2,…,Sk}. For the given cluster, assignment A that involves K groups, the total cluster variance is minimized through minimization of the sum of the squares of Euclidean norm for all clusters using Equation (4),
where is cluster assignment, K is the number of clusters, Ni is the number dataset assigned to Si, µi is mean of parcels in cluster Si and is calculated using Equation (5) [30].
A K-means algorithm achieves optimal clustering assigning parcels so that the difference between parameters of the parcels and their centroids are as small as possible. Maximizing intra-cluster homogeneity for WSS involves several steps (as shown in Figure 1). Firstly, the optimizer selects initial cluster centroids (means) randomly. Secondly, an initial cluster boundary is defined by assigning demand parcels to the initial cluster centroids. Thirdly, the K-means optimization evaluates the difference between parameters of the parcels and their centroids (this is used as a measure of homogeneity). Fourthly, the optimization uses the homogeneity as a termination criterion. It uses an iteration based evolutionary optimization which involves the assignment of parcels to the closest mean and calculating a new mean until the assignment no longer changes (means no improvement in homogeneity). Thus, the simulation stops. Otherwise the above steps repeat until there is no change in parcel assignment between subsequent simulations. Figure 4 shows the basic K-means algorithm used in clustering WSS.
Though the K-means algorithm maximizes the similarity within a cluster, it has some shortcomings. One of the limitations is that it does not consider the geospatial relative location of different neighboring parcels. The specific problem of clustering water systems requires the ability to handle not only the spatial extent, but also the geographic component with respect to neighboring parcels (i.e., the need to have the same membership parcels in the same spatial location). To avoid the possibility of detaching parcels of the same cluster in different spatial locations, intra-cluster parcel connectivity is used.
2.9. Intra-Cluster Parcels Connectivity
Intra-cluster parcel connectivity, defined as the linkage of a parcel within a cluster, is used to check whether a parcel of one cluster is located in another cluster. Given the membership of parcel “P” defined as P(m,n) and neighbor parcels as P(n±1,m±1), if parcel P(m,n) of one cluster neighbors two or more parcels from another cluster, and has only one neighbor from its own cluster, the evaluation of the minimum Euclidean norm of the parcel P(m,n) is performed with respect to the neighboring cluster centroid and is re-assigned to the closest one. In addition, the periphery parcels, which do not have many neighbors, are merged to the nearest cluster group in case they belong to another cluster. This connectivity analysis alone does not guarantee the existence of cluster members in another spatial location. One can use the smallest recommended size of cluster and/or the smallest demand that a cluster should supply to decide on merging isolated parcels to the neighboring cluster. An isolated parcel group will be kept as an independent cluster if the demand it supplies is greater than the required minimum size/demand within the cluster. However, a parcel group that does not satisfy the mentioned condition will be merged to the neighbor cluster. The decision of which cluster to combine is made by evaluating the minimum Euclidean norm value with respect to the centroid of neighboring clusters.
3. Results of Cluster Analysis Application to Arua, Uganda
3.1. General Description of the Area
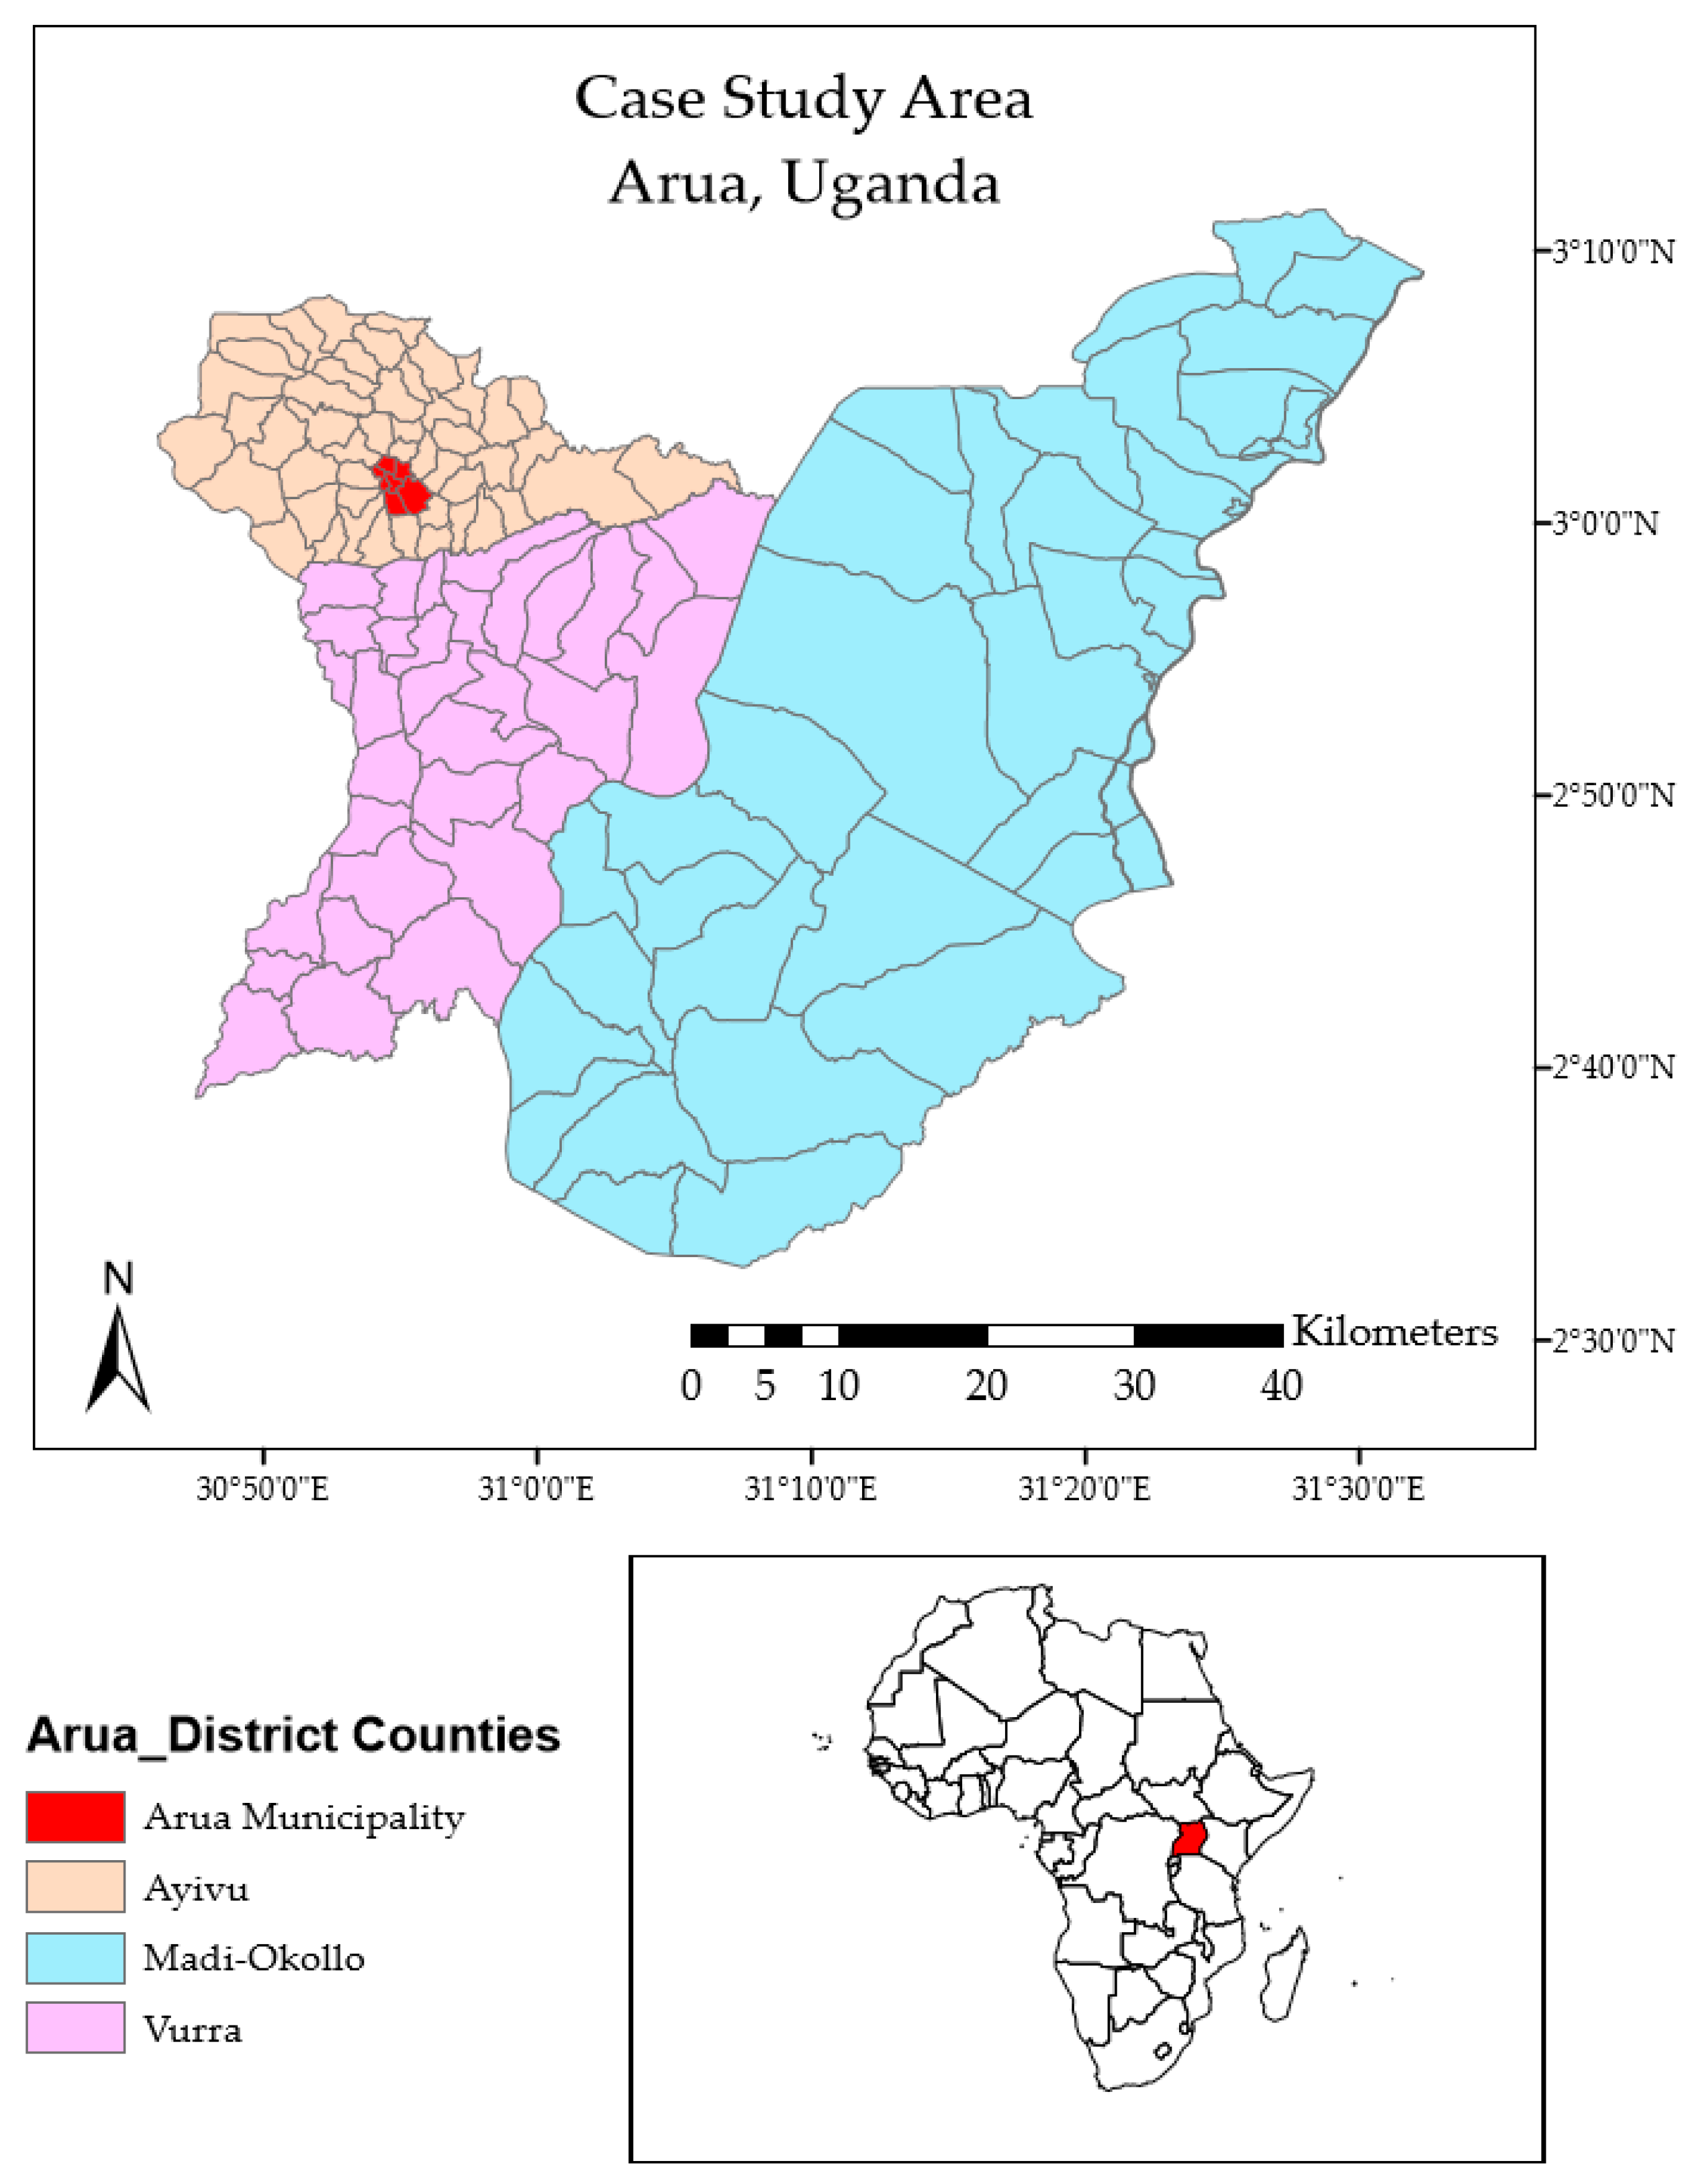
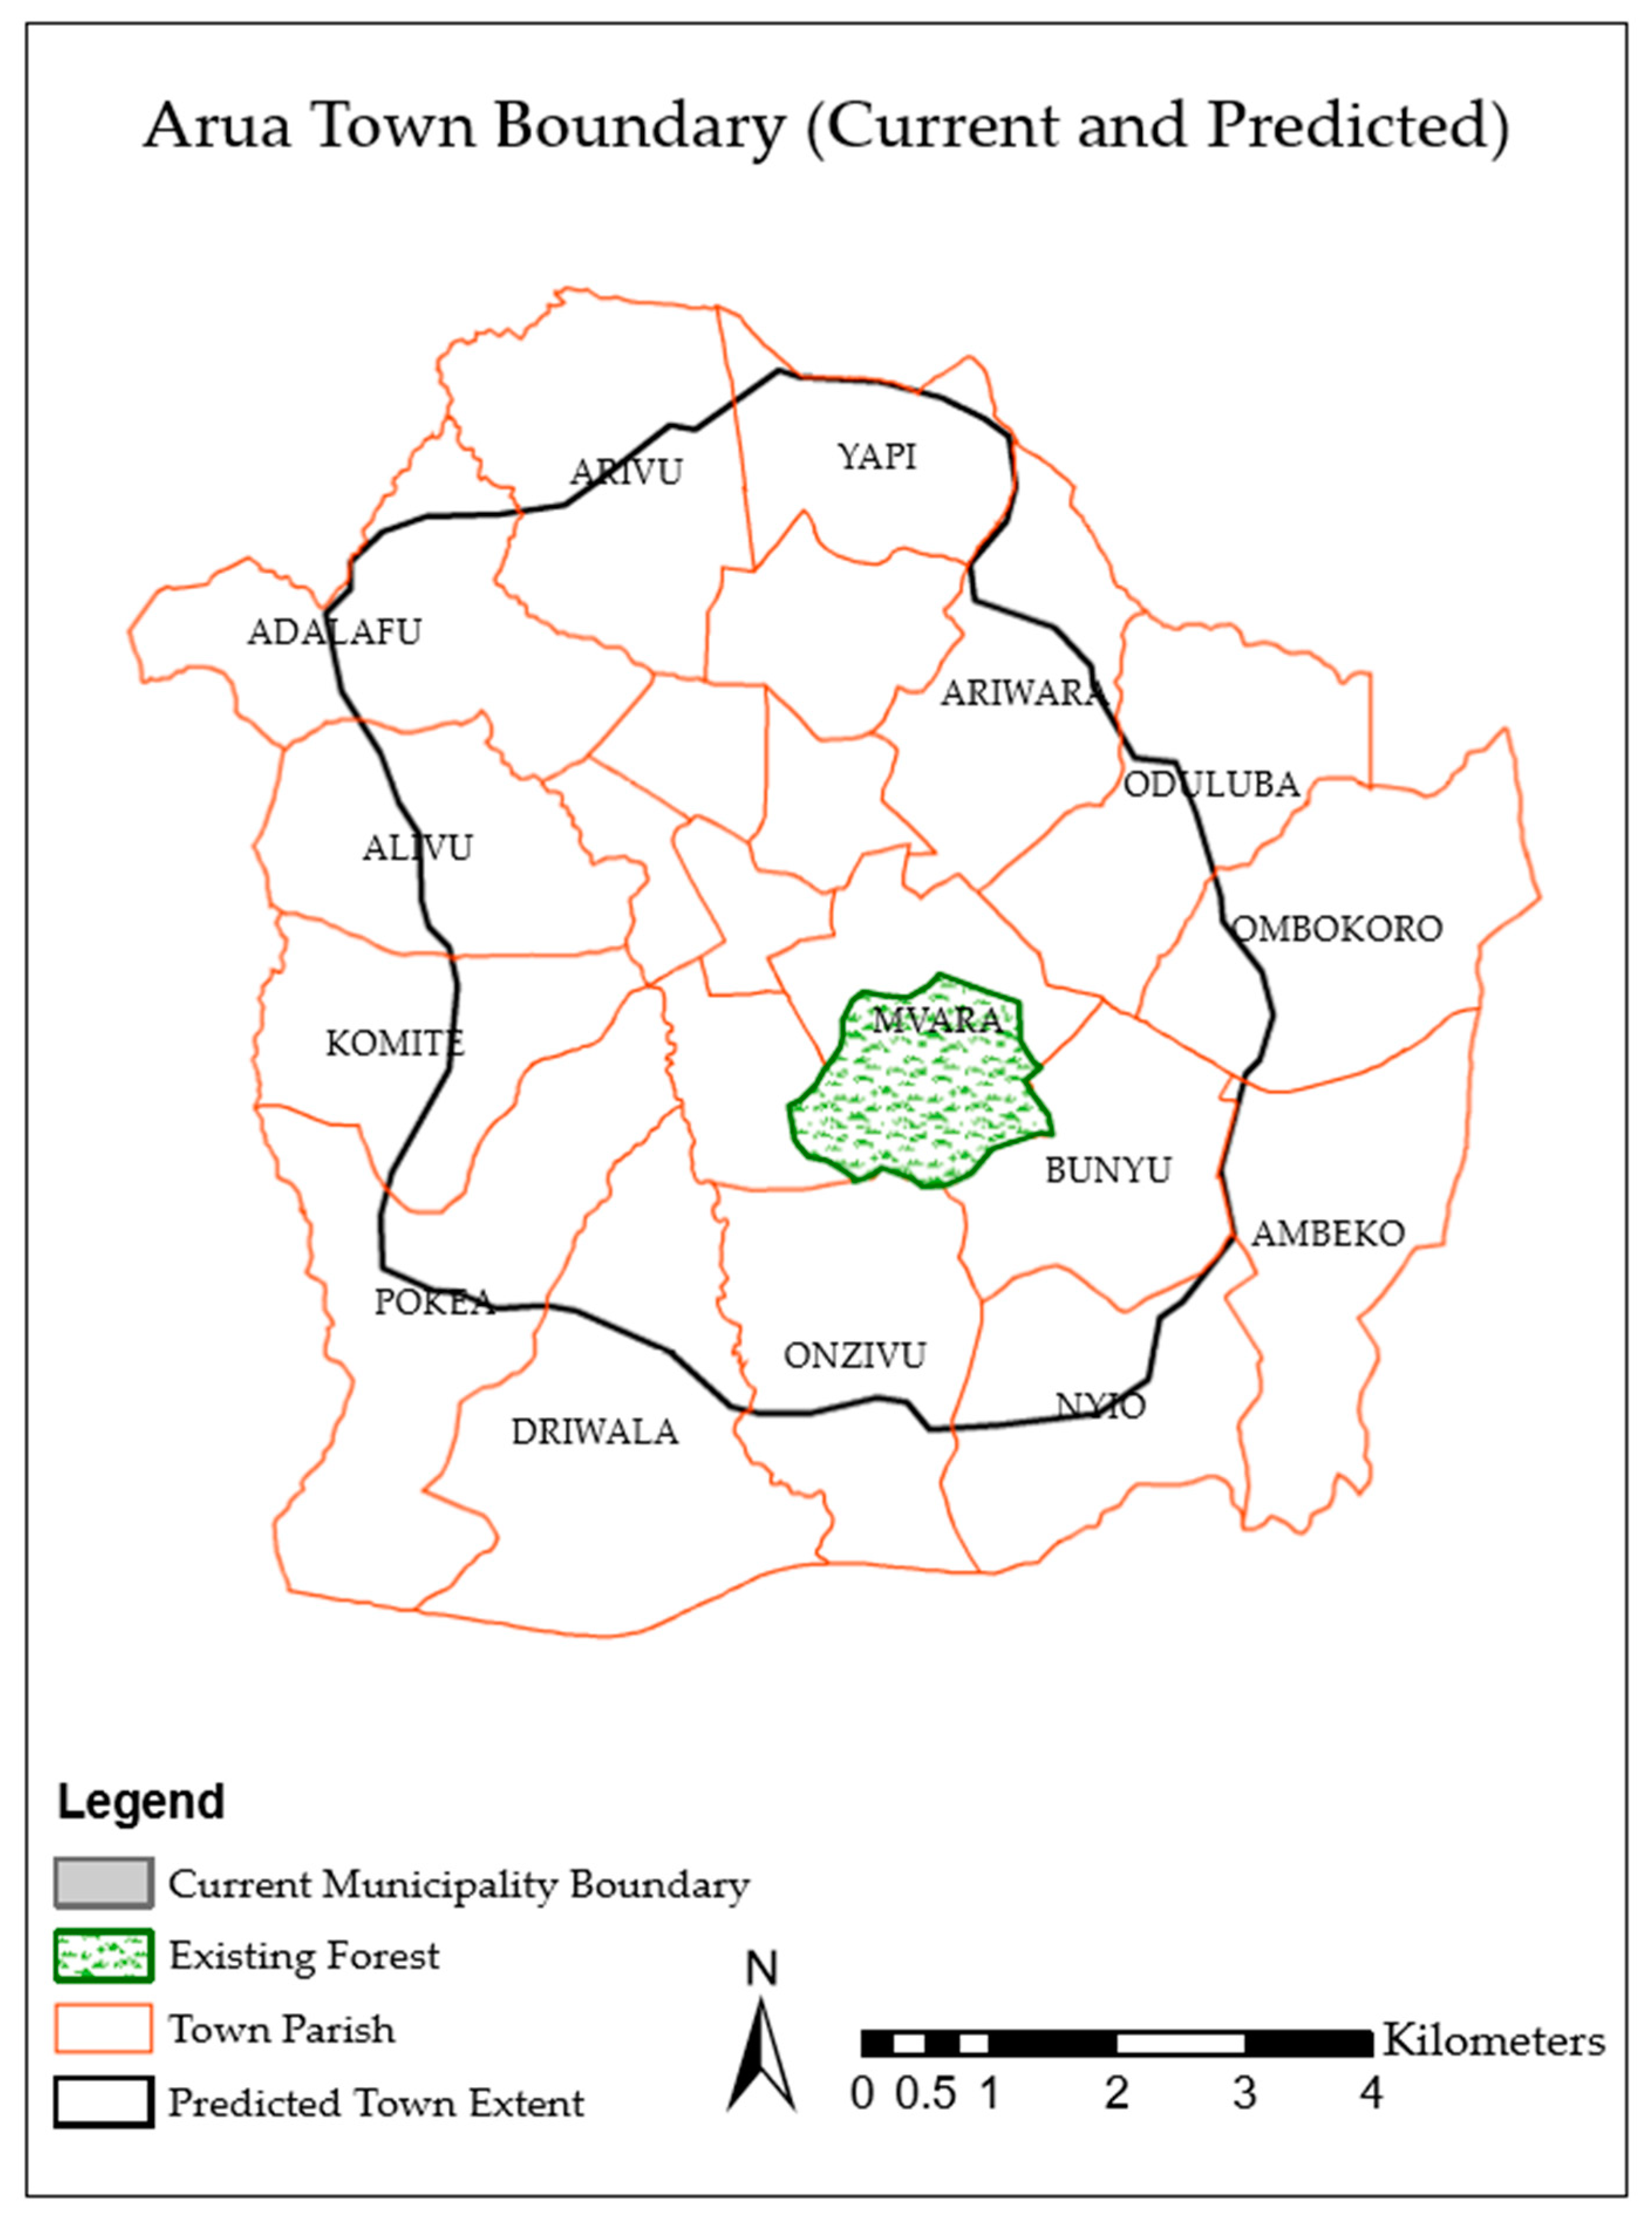
The developed clustering methodology was applied to a real case study in Arua, Uganda. Arua is located in the Northern Region of Uganda and lies between latitude 20°30′ N and 30°50′ N and longitude 30°030′ E and 31°030′ E (Figure 5). The Aura municipality is one of the fastest growing municipalities in the country. According to the statistical abstracts of the Uganda Bureau of Statistics [31], the population of the Arua municipality was 59,400 in 2011, with the population around the periphery of the municipality reported to be 49,893. With an annual growth rate of 3.4%, the total population in 2032 is estimated to be 220,887. The predicted spatial extent of Arua in 2032 is shown in Figure 6.
The town of Arua is experiencing a critical shortage of water because it depends on only a small river (Enyau River) for its supply [32]. With population growth and increasing wealth it is predicted that the water demand will likewise rise to 17,217 m3/d in the year 2032, which would worsen the water shortage. This predicted future demand takes into consideration the different population density and socio-economic status of each of the parish areas.
The current approach to water management in Arua is based on a conventional centralized approach where water is collected upstream, used, and discharged downstream and does not encourage the use of local sources such as groundwater, stormwater harvesting, or wastewater reuse and recycling. It has become obvious that the current practices of urban water management are not sustainable to meet the future challenges in Arua. However, the rapid urban growth in emerging areas coupled with the fact that those emerging areas do not have mature infrastructure and urban planning for the area has not yet occurred means that there are real opportunities to implement a clustered urban water system management system in Arua.
3.2. Application of the Proposed Clustering Method and Results
One of the major initiatives of the Arua municipality is to degazette (repurpose) the forest area (called Barifa) in a 5-year time period and incorporate it into the central business district of the town. Since the forest area has a predefined boundary, the clustering processes in this study can isolate this area and consider it to be a pre-clustered unit. Additionally, prior to the clustering process, a decoupling of the existing central WSS from the emerging areas was performed by identifying the existing municipality boundary (Figure 6). Then the proposed WSS clustering technique which minimizes the source-demand distance and maximizes intra-cluster homogeneity was applied.
3.3. Source-Demand Distance minimization
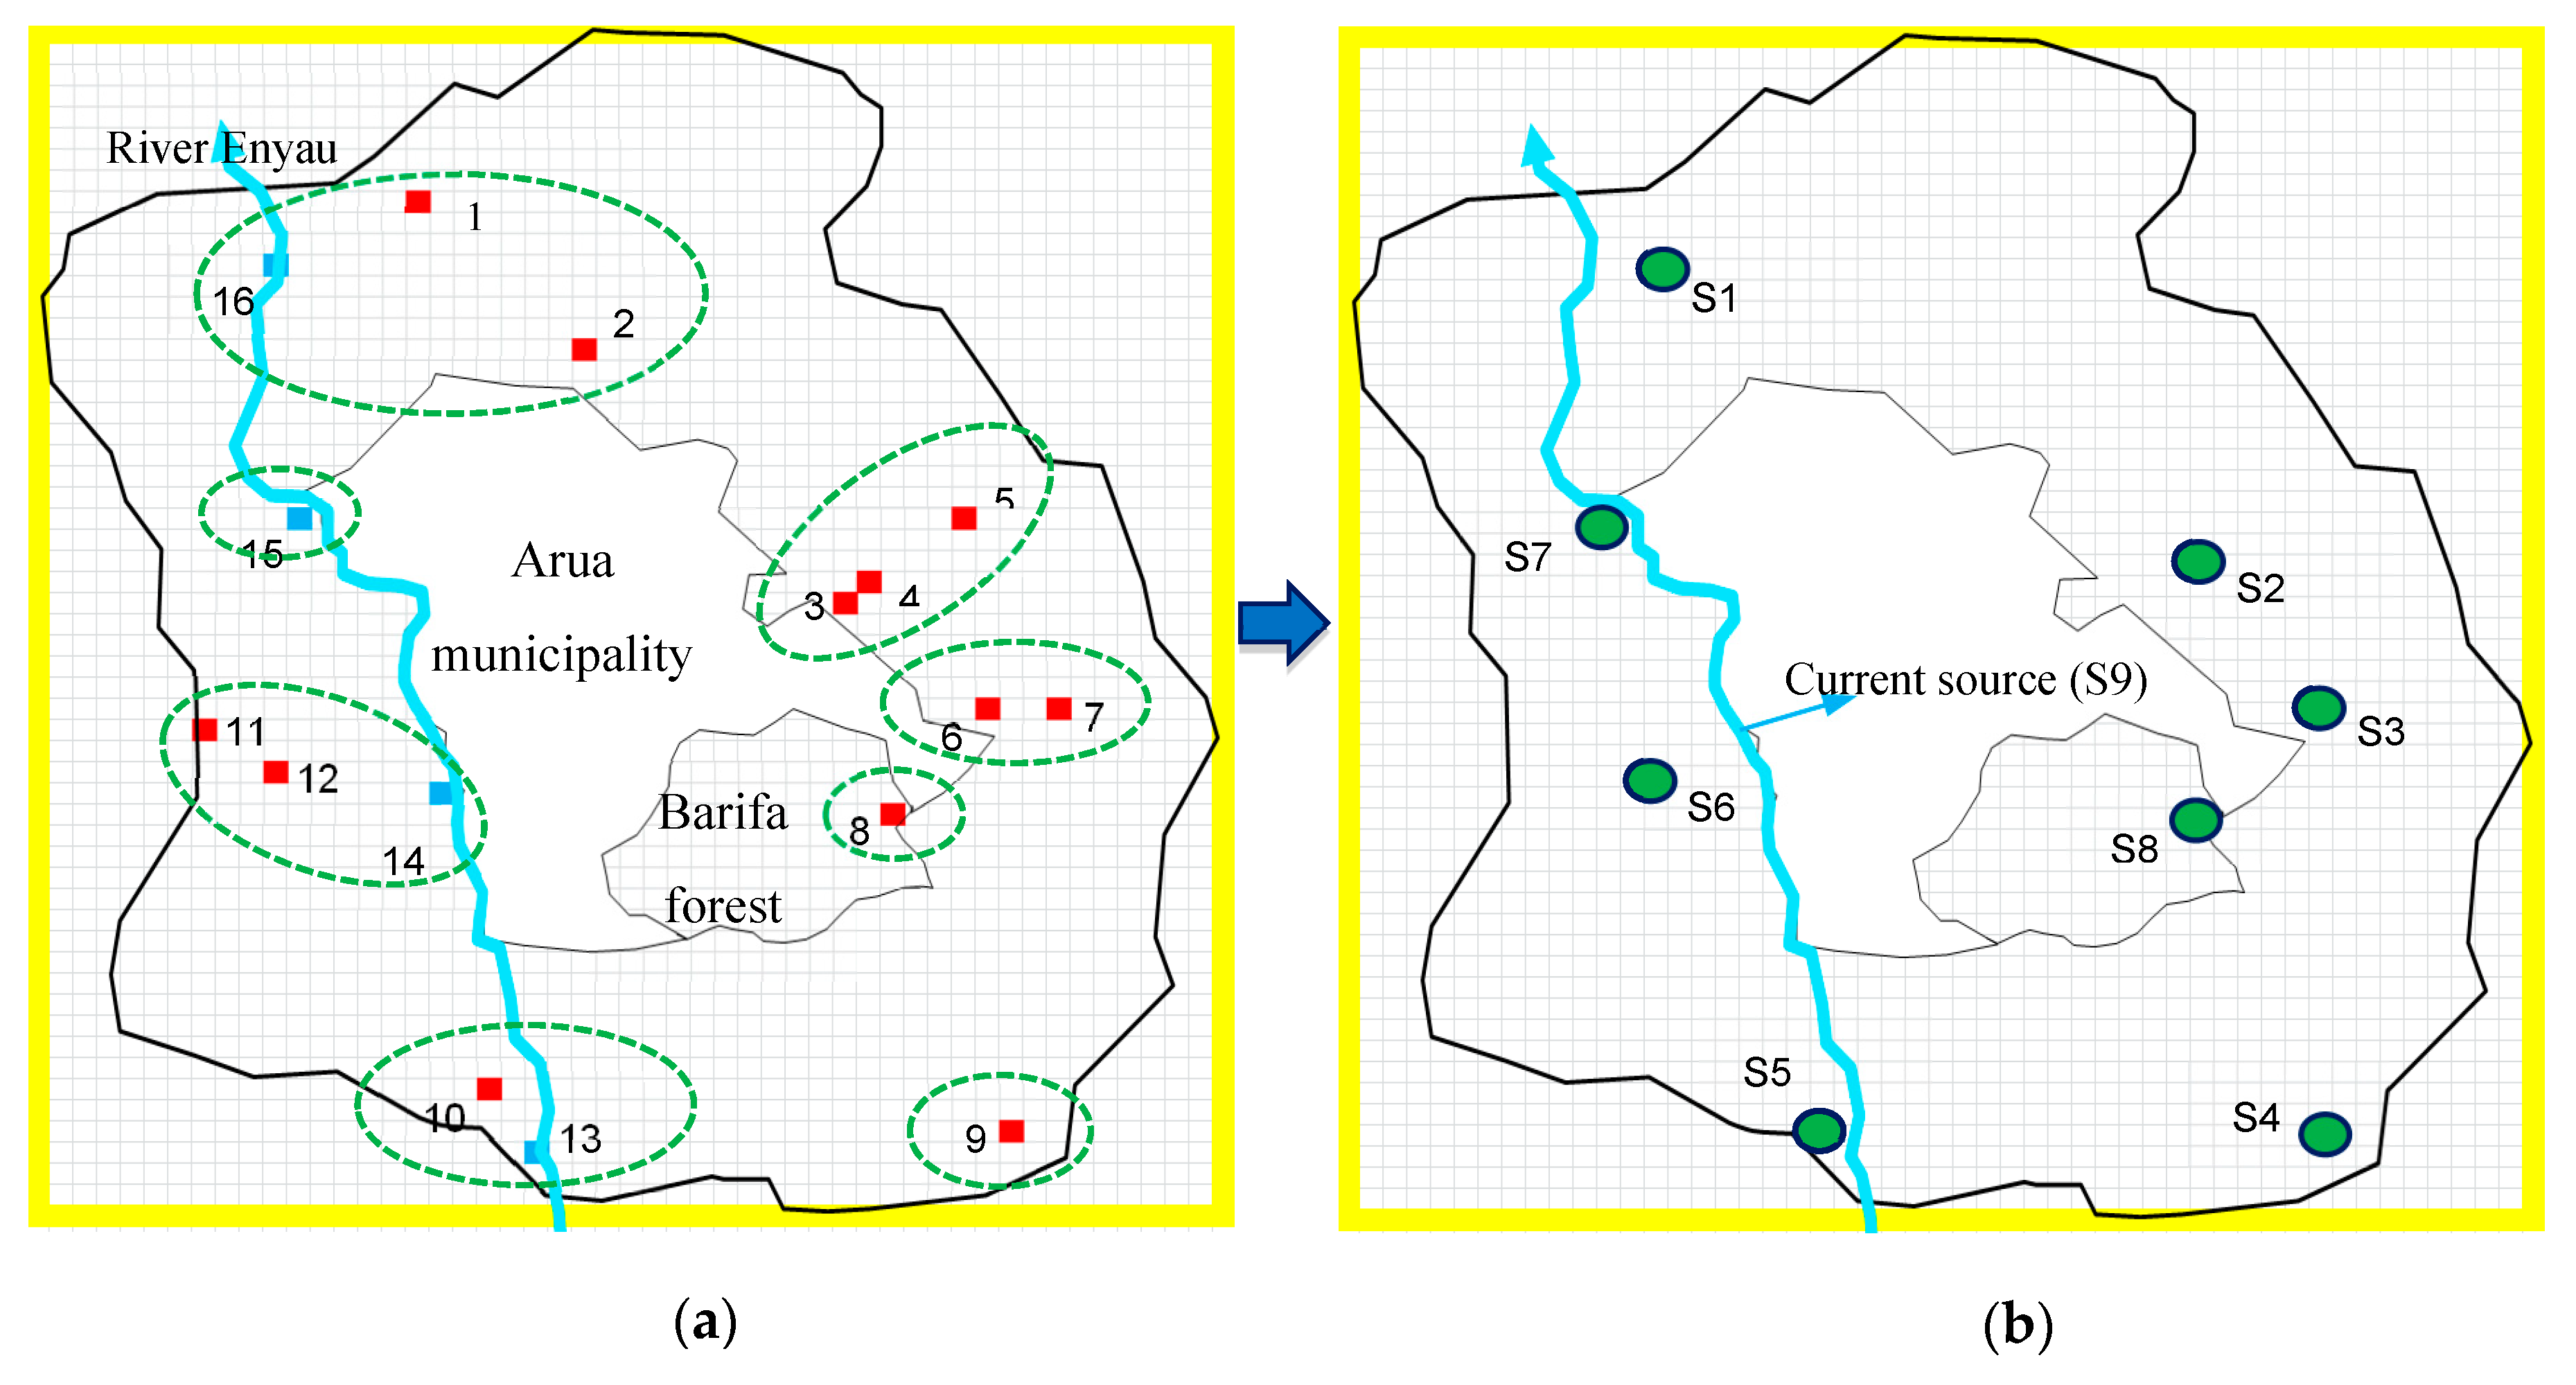
In this case study, 10 groundwater sources and 4 potential surface-water abstraction locations were identified (Figure 7). Once the capacity and locations of available sources were identified, the water sources were merged into groups such that the distance between grouped sources was minimized. Since the demand variation is small for the case study of Arua in Uganda, the area was discretized into small parcels of the size 150 m by 150 m. While a smaller/larger parcel size may offer different benefits/drawbacks in the overall analysis, the main principle of decentralized clustered approach is not constrained by the parcel sizes [33] and the sensitivity analysis of parcel resolution is not the focus of this paper. The available water-source abstraction locations of the area were aggregated into seven groups. The decision to propose a number of groups might depend on the size of the area, the size of clusters required, the numbers of water source locations available, etc. Different researchers have highlighted the need for case-by-case analysis to determine the population number that should be supplied by a single source to determine the smaller cluster size [8,25]. However, the determination of the number of groups required is not the focus of this paper. Thus, the minimum cluster size with a population of 10,000 was used in decentralizing the emerging area as suggested by Webster et al. [5] to determine the number of source centers for grouping. The evaluation of the distance between sources was preformed using Equation (2). The output of source-group identification process is shown in Figure 7a,b. Once the groups were identified the X, Y coordinate and supply capacity Qs were used to calculate source-centers. The source and source-center information is summarized in Table 1.
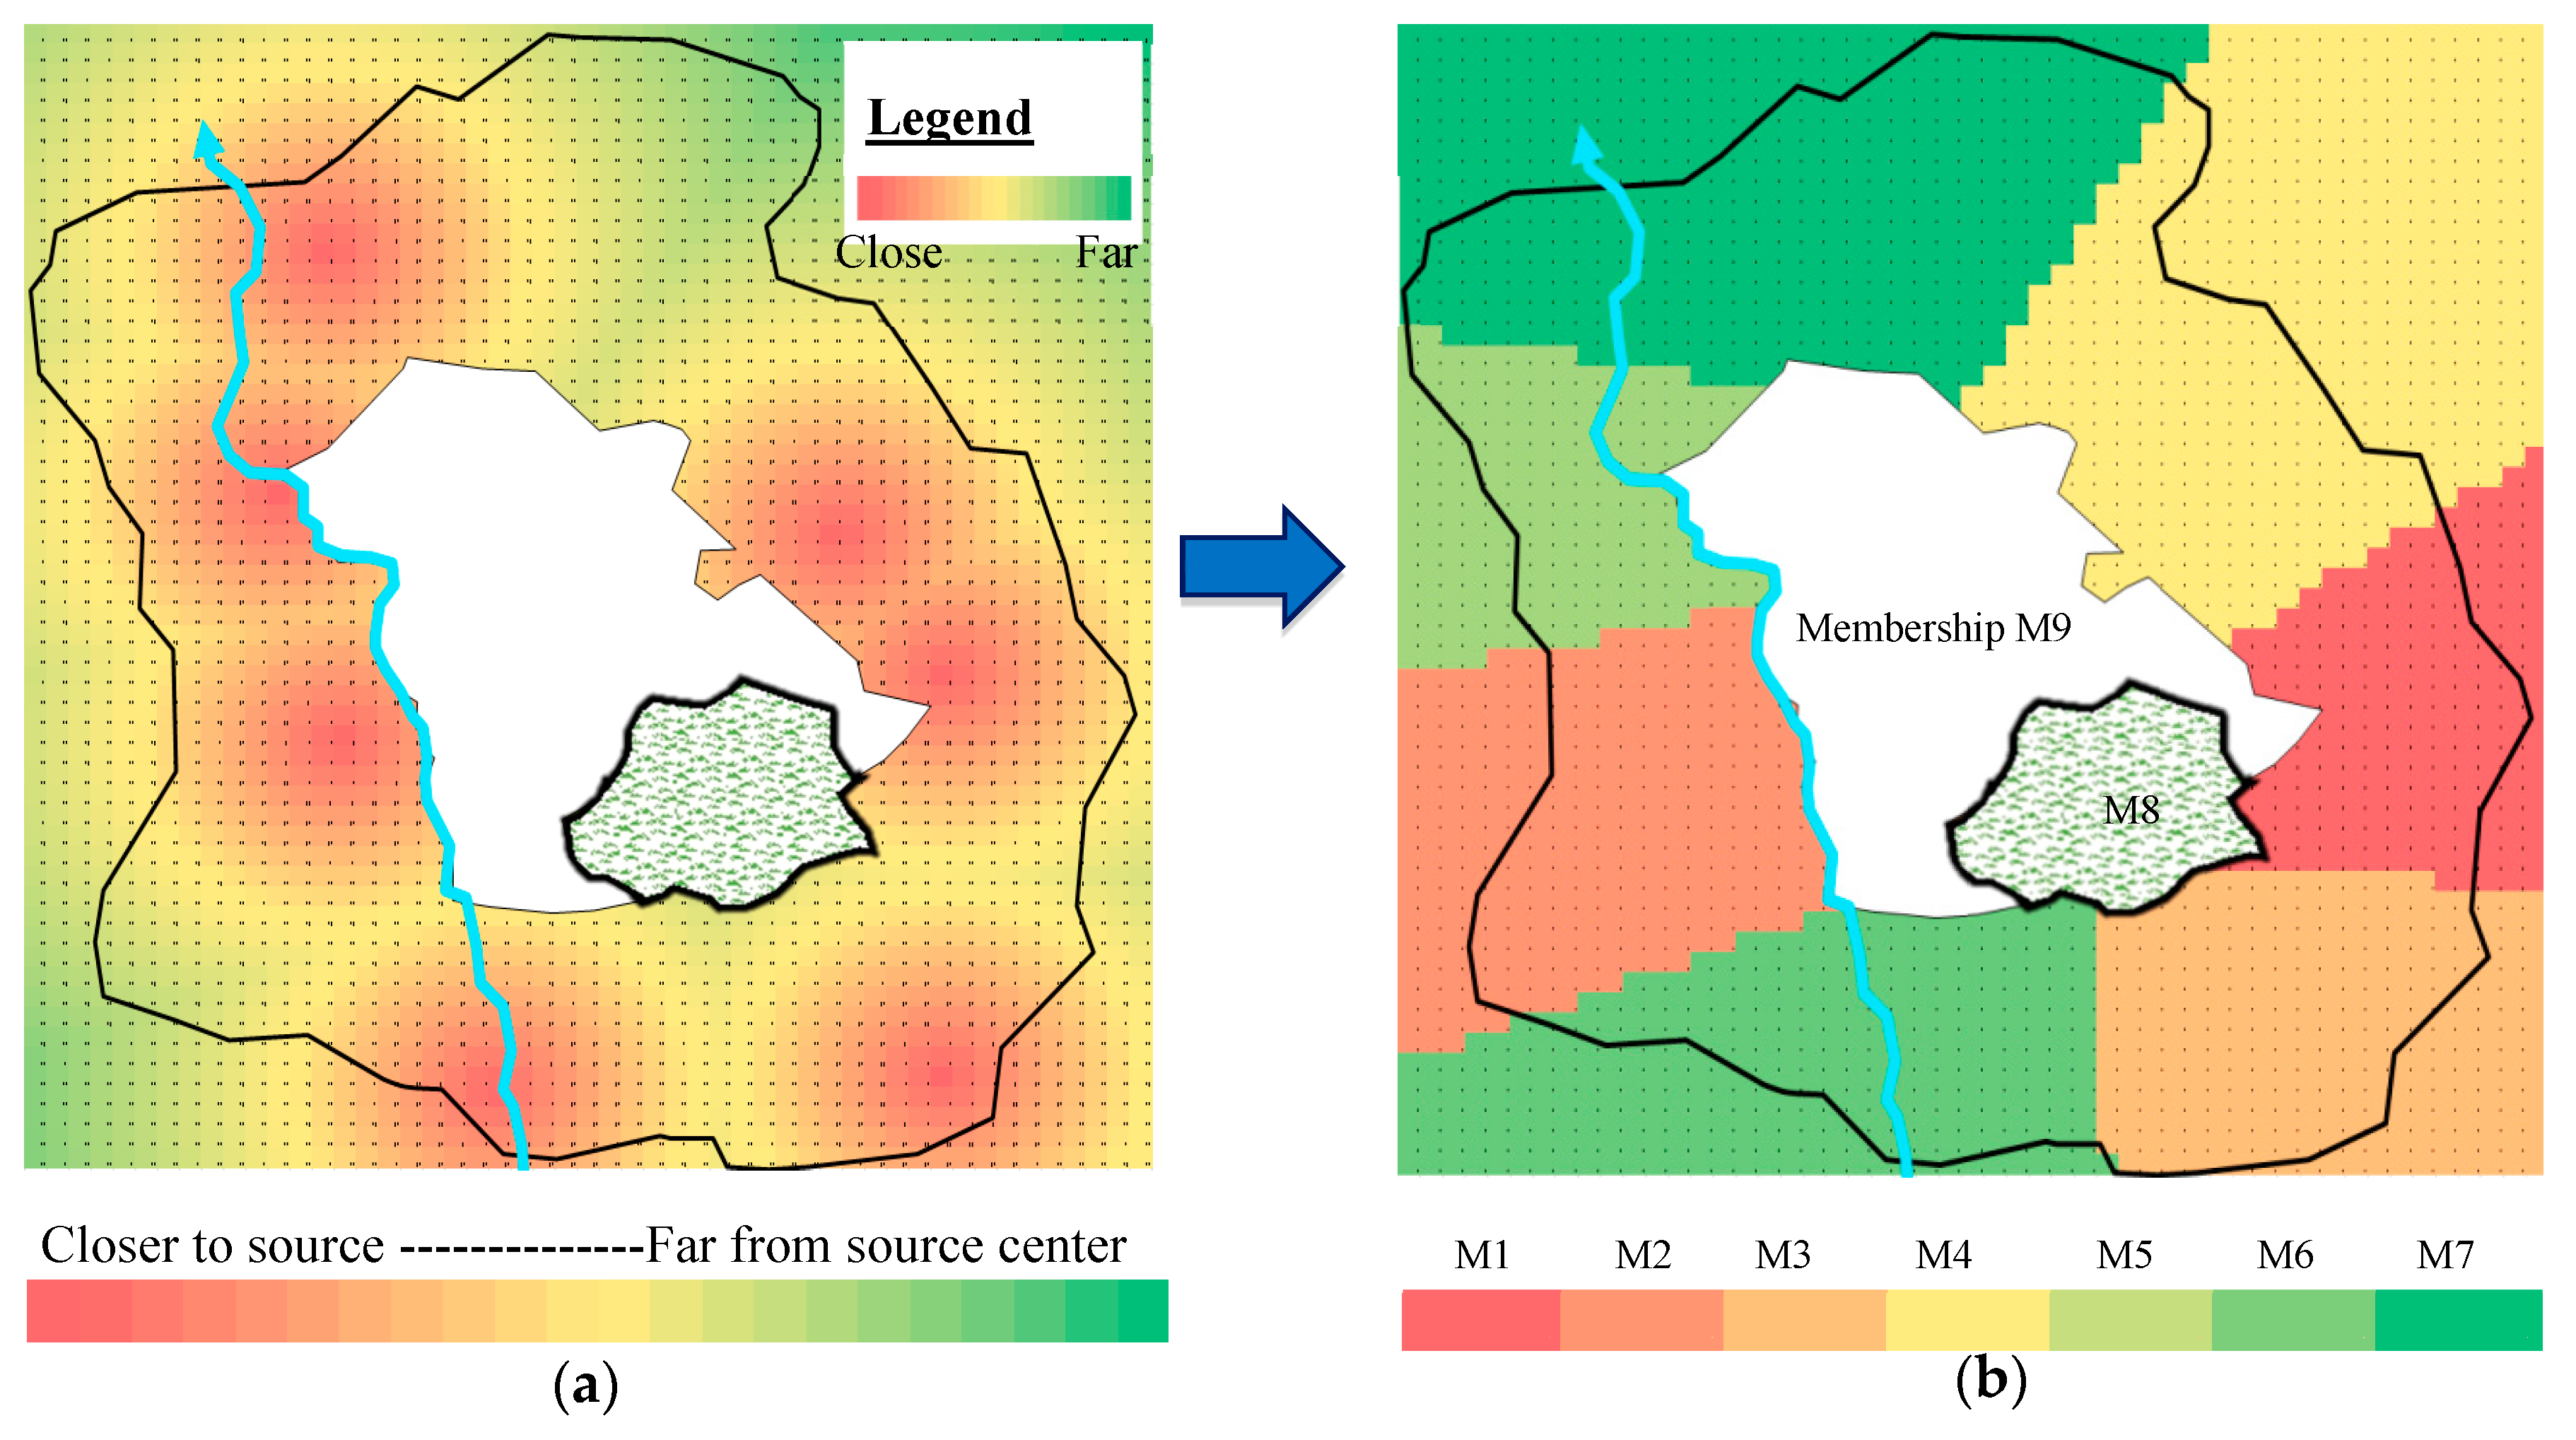
Once a source center was identified, the discretized square parcels (150 m by 150 m) were assigned to the source centers. Each parcel has a location, topography, and demand attribute. This stage used the location attribute (X, Y) coordinate of parcels and the centroid of the available sources as inputs to minimize the source-demand location for each parcel. This case study treats the forest areas (planned development) and the central municipality boundary as an independent unit clusters wherein the boundary and inbounded sources are pre-identified prior to the clustering process. Equation (2) is applied to each parcel of the emerging areas to determine the Euclidean norm from the 7 source centers in the emerging area. Given the Euclidean norm of each parcel (from the 7 source centers), the distance minimization was performed using Equation (3). Then, each parcel was assigned a membership value. Figure 8a,b shows the output of parcels assigned to the nearest source and the membership respectively using Euclidian norm minimization. The membership defines groupings of similar parcels which are apportioned to the same source center.
The above clustering shown in Figure 8 is purely based on distance and does not include demand and topographic parameters. The next stage incorporates these parameters in addition to a membership value using intra-cluster homogeneity maximization.
3.4. Maximizing Homogeneity and Connectivity Analysis
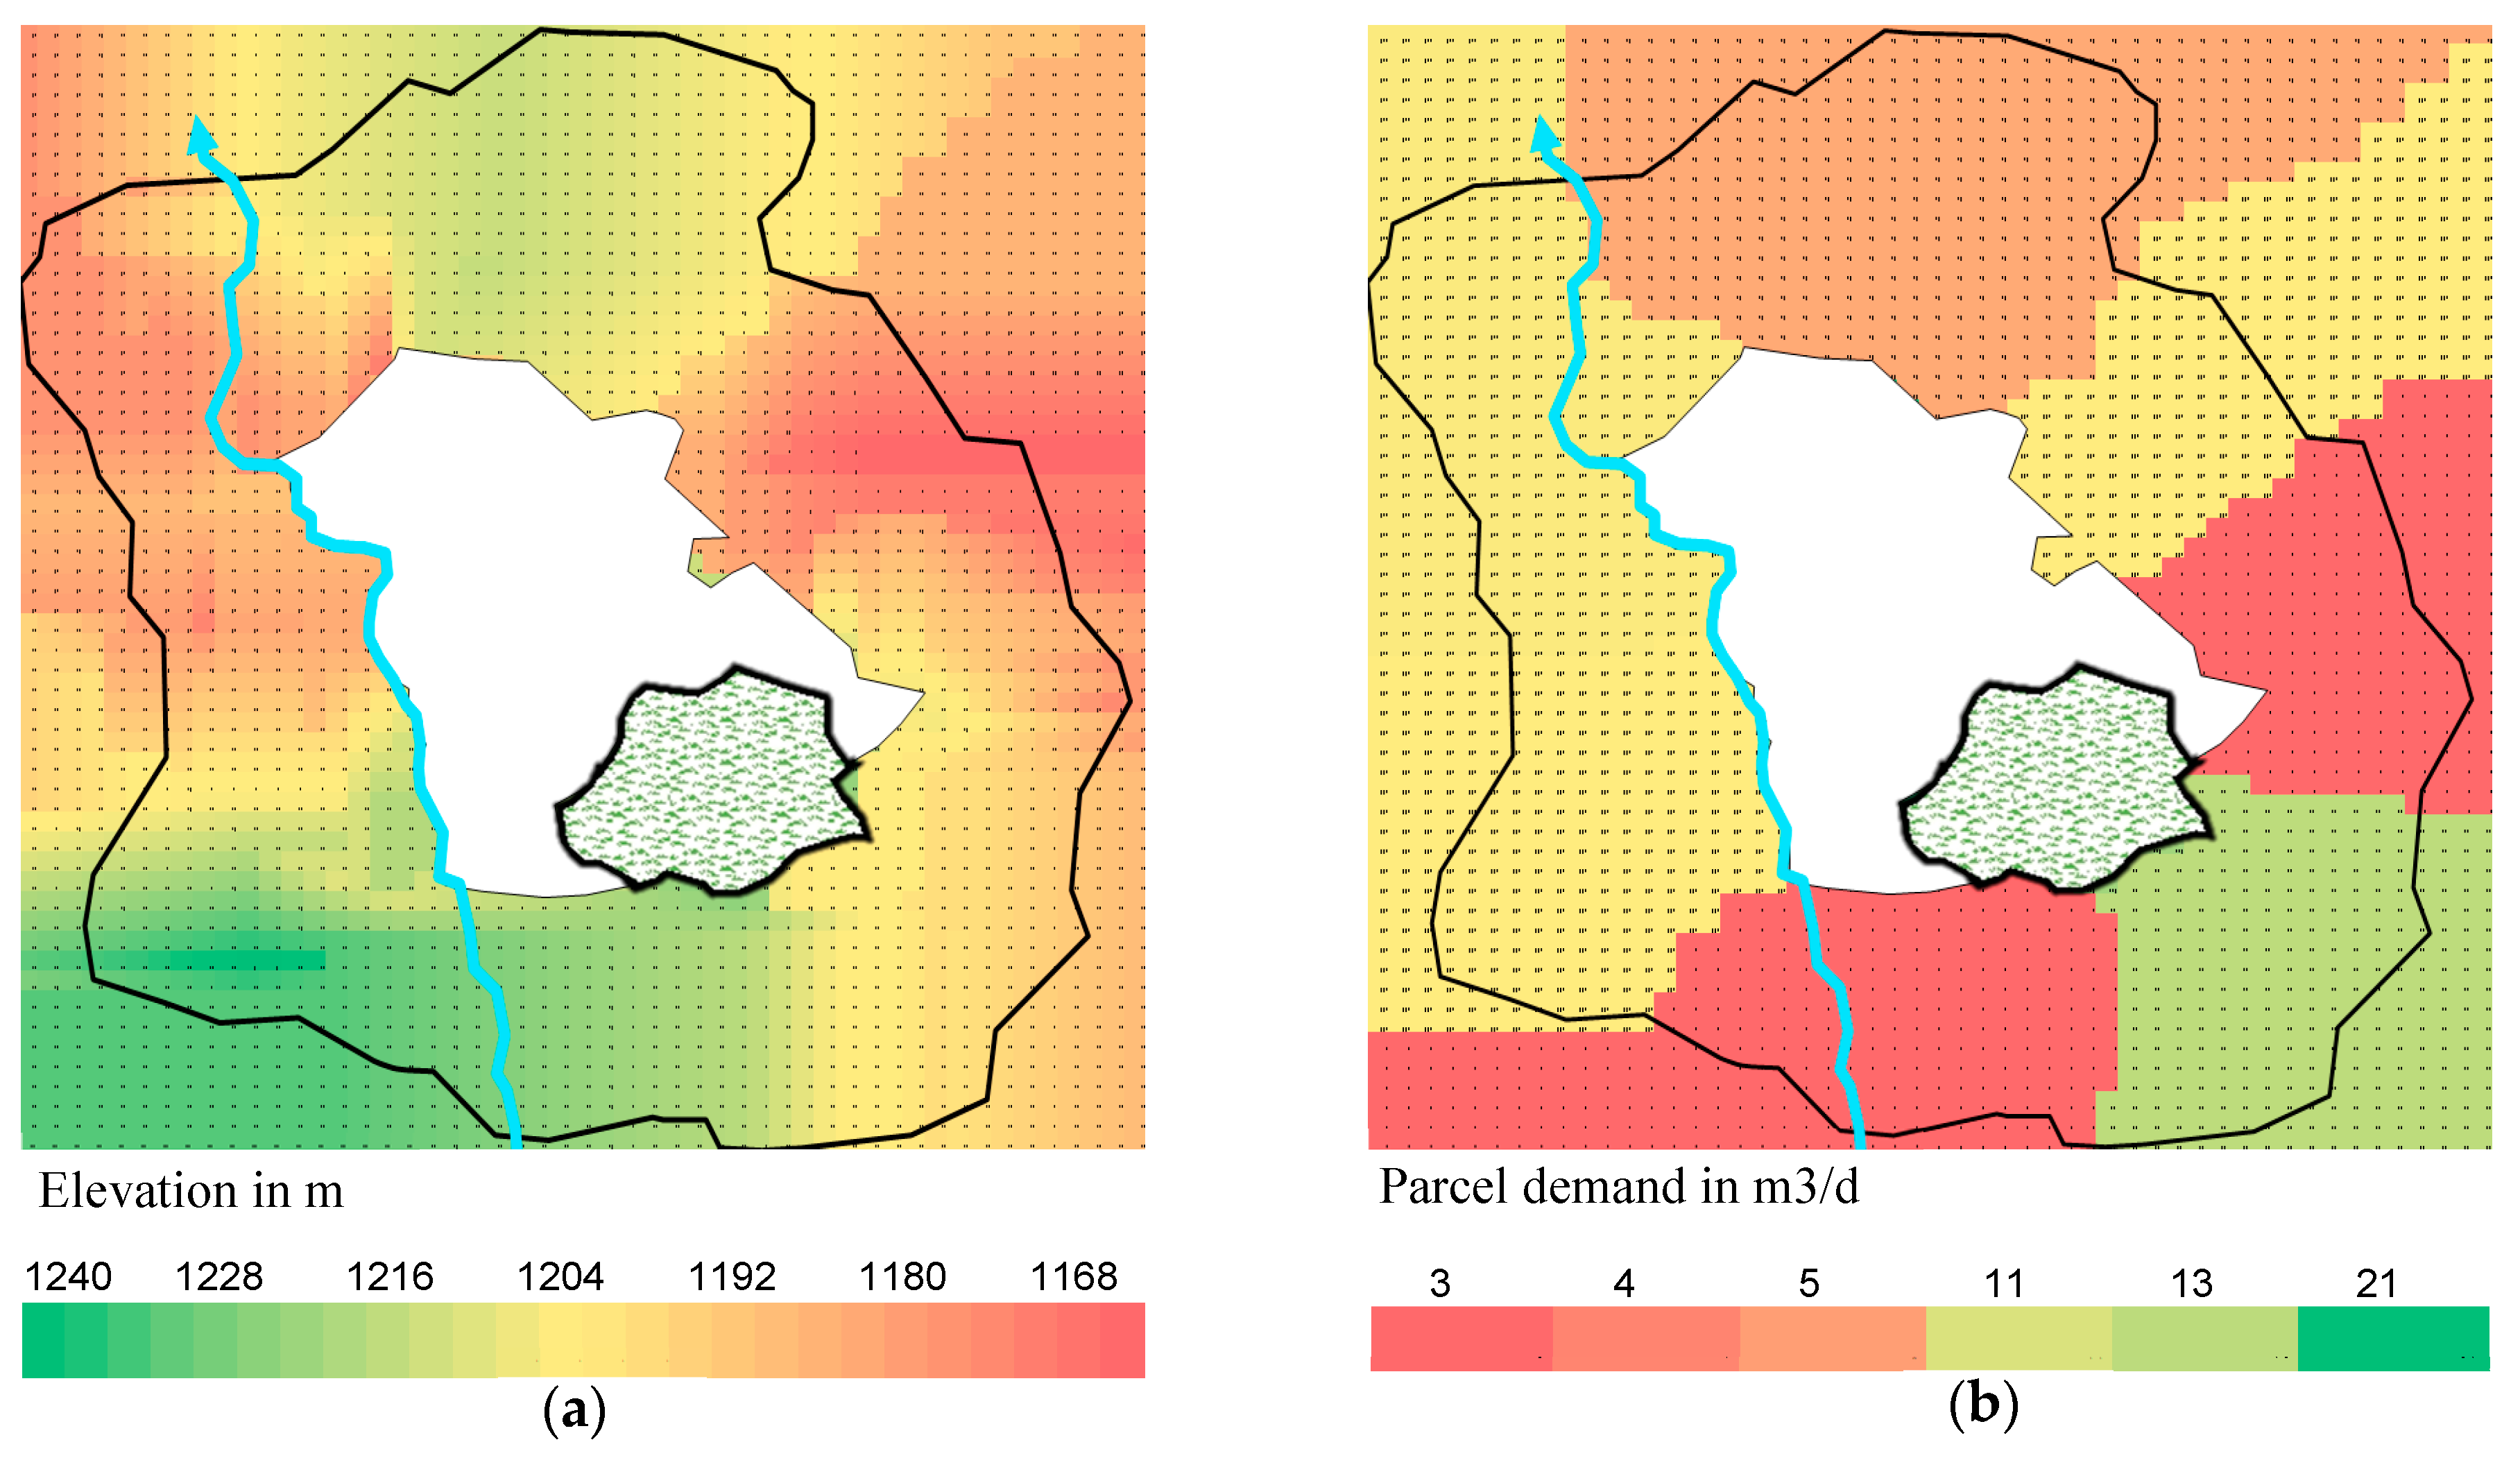
Homogeneity maximization was applied to determine the final cluster boundaries for the study area. The distance-based membership value (determined in the distance minimization stage), topographic, and demand information were used as input parameters. The study area topography ranges from 1160 m to 1240 m asl, and the determination of demand was performed using the population, socio-economic status, and land use information. The input elevation and demand information are plotted for the case study area and shown in Figure 9a,b.
Given the input parameters, a K-means algorithm was applied to maximize the intra-cluster homogeneity. Multiple runs of the K-means simulation were performed to avoid the problem associated with initialization, and the algorithm showed similar clusters. The final output of the clusters is shown in Figure 10a.
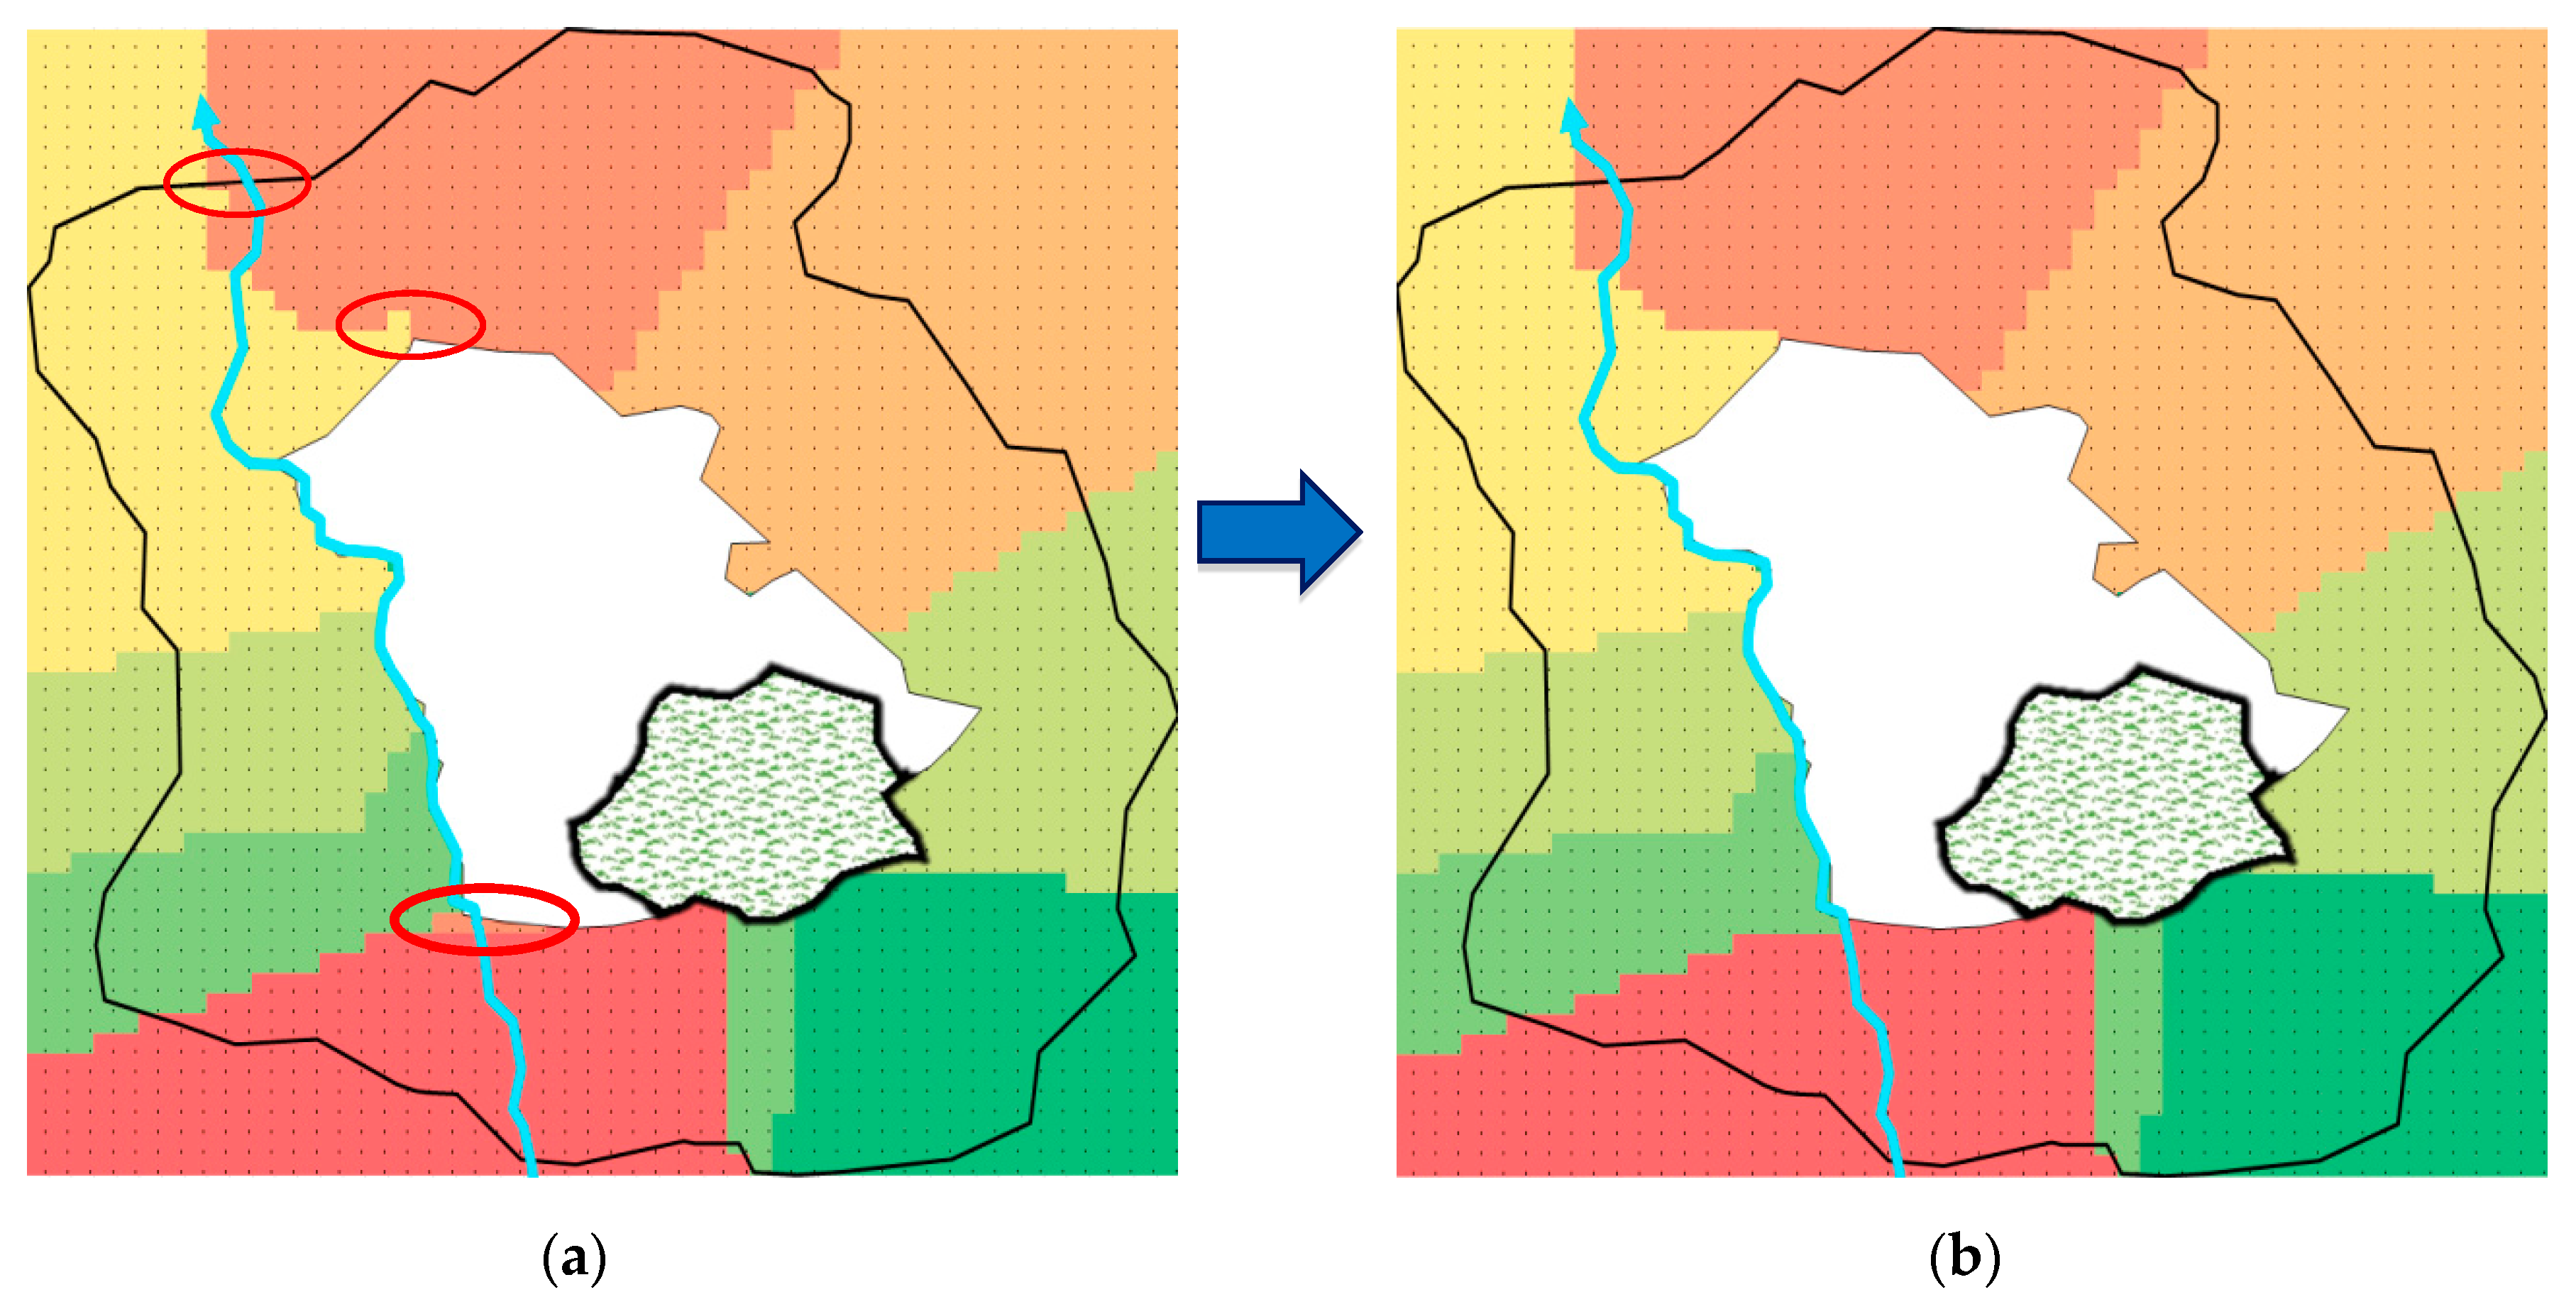
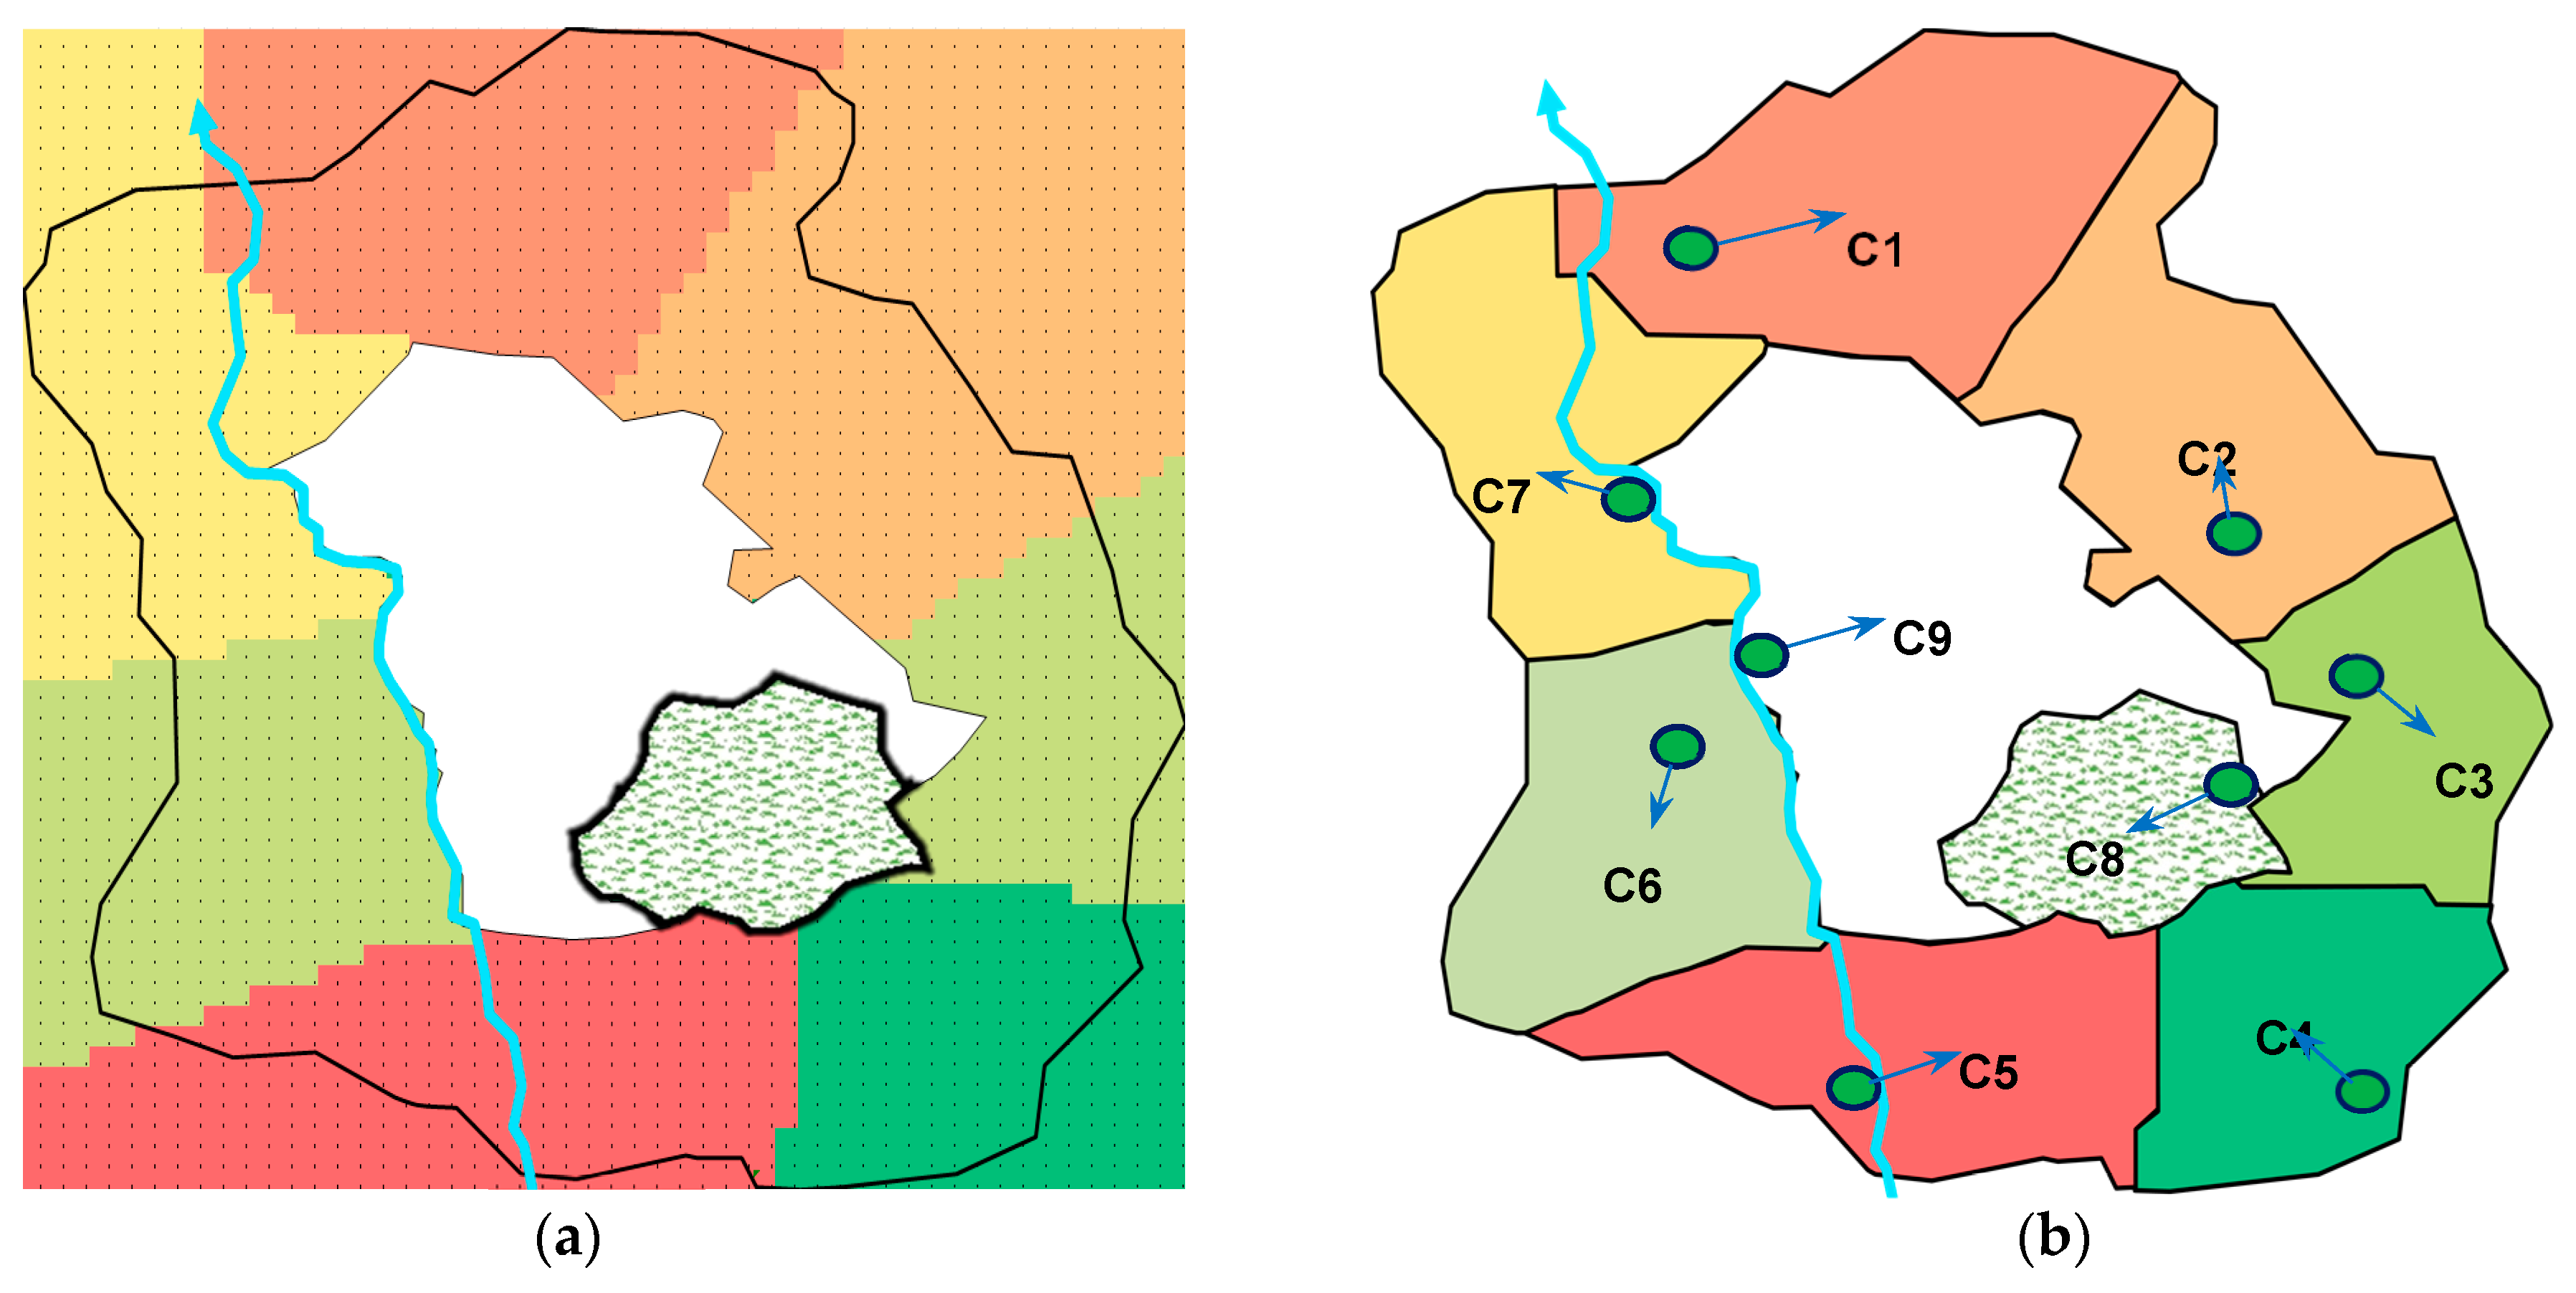
As shown in Figure 10a, the same members could be in different spatial locations (see circled areas). To incorporate the spatial component of cluster location, intra-cluster parcel connectivity was applied. The parcel connectivity involves refining the boundary and merging parcels of one cluster which are located in a different cluster. First, simple parcel connectivity was done by considering the membership of each parcel. In this case study, parcels circled in red in Figure 10a are merged to their neighbors as shown in Figure 10b. Secondly, if there is a parcel group which is in another cluster, the size was used to decide whether to keep the group as a new independent cluster or to merge it with the nearest cluster. A group merging was performed if a cluster/group was too small. Groups with a size less than 20% of the maximum cluster size were distributed to the neighboring cluster to avoid large variation in cluster size. However, a recommended cluster size and/or the smallest demand that a cluster should supply were used to decide whether to merge isolated parcels. Figure 11a shows the final cluster boundaries after isolated neighboring parcels were re-distributed, and the final cluster boundary for the case study area is shown in Figure 11b.
The developed clustering method offers an adequate solution to the decentralization paradigm through clusters that allow for improving the movement of water and wastewater in the area. It divides urban area into clusters to allow for the provision of flexible, modular decentralized WSS. Although, a full water balance analysis (i.e., source availability, recharge rate, current and future demand, water usage from different sectors) for Arua, Uganda is not presented, it should be noted that the sustainable use of the resource needs to be ensured. For example, when different water resources are identified for each decentralized region, the available water sources (ex. groundwater, surface water) and recharge rate from aquifer/infiltration or rainfall can meet the current and future demand of each decentralized region. If not, there will be issues of resource depletion and lack of sustainability.
4. Discussion
4.1. Performance Analysis
The proposed WSS clusters accomplishes two principles: (i) minimization of the distance from source to consumer, and (ii) maximization of the intra-cluster homogeneity. Testing to ascertain if these principles favorably impact cost is necessary to verify that the clustering method indeed produces an optimized WSS. Cost efficiency can be measured in a variety of ways, however, in this research a parcel-based power usage analysis was utilized. Several WSS are required for a suitable analysis; by assuming the same relative size and number of clusters, random WSS scenarios can be designed. By choosing four randomly clustered WSSs, a power footprint analysis can be conducted on each scenario and compared to the power footprint of the proposed optimized WSS clusters.
4.2. Method for Power Usage Analysis
Four decentralized WSS scenarios were considered when calculating power usage for each cluster. This was necessary to create an acceptable sample size for the analysis. To generate randomly assigned clusters, the cluster boundaries for each scenario were rotated approximately 10° counter-clockwise from the previous scenario. This includes scenario-1 through Scenario-4. In addition, a typical centralized WSS was used as a benchmark for comparison. Since the design of WDS is not the focus of this paper, a parcel-based power footprint calculation was used for comparison between the scenarios. The power requirements of the four decentralized WSS boundaries were compared with the proposed decentralized WSS. Operational cost can be visualized by analysis of the power requirements for the various scenarios. Cost is directly proportional to power, therefore the cluster which demands the least power will be most cost efficient. The power provided by a pump is determined using Equation (6),
where P is the power to supply the fluid, ρ is the density of the fluid in kg/m3, g is the gravitational acceleration in m/s2, Q is the flow rate in m3/s, and hp is the total head in meters. The total head is the summation of the velocity head (), friction head (), and elevation head () are found in Equation (7). The velocity head was calculated using . Over large distances, the friction loss of the fluid flowing through the pipes must be calculated. In 2015, Hunter Industries published the article Friction Loss Tables [34], which includes standard PSI loss for various types and sizes of piping. The article also contains Equation (8), the Hazen-Williams formula used for pipe head loss calculations,
where is the friction loss (PSI) per 30.48 m (100 ft), C is the coefficient of retardation of pipe material, Q is the flow volume (GPM), and d is the inside diameter of pipe in imperial units. For example, assuming the water will be supplied by a 2.54 cm (1 in) schedule 80 pipe, the coefficient of retardation would be 150 with an inner diameter of 2.43 cm (0.957 in). The friction loss can be converted into a friction head using Equation (9). The calculation then has to be converted into metric units.
In this equation, is the imperial unit weight of the fluid and D is the distance from the source center to the parcel. In some cases, the source center elevation is greater than the parcel being supplied with water, causing the elevation head to be negative. When this arises, the summation of the heads will most likely be negative; it is assumed that the power cannot be negative. This ensures only positive power requirements are considered for the total cluster. The last calculation is converting the power requirements to a yearly operational cost. The following formula Equation (10) can be used to estimate the cost,
where the cost is in USD per year, P is the power in Watts, R is the current conversion factor for Ugandan Shilling (UGX) to USD, C is the current price per kWh for Uganda in shs/kWh. This calculation was completed for each scenario in the power usage scenario analysis.
4.3. Power Usage-Scenario Analysis
The design of water distribution network and optimization of capital cost is not the focus of this paper. Thus, to conduct a comparative analysis on the case study in Arua, a few assumptions had to be made and used for each scenario in a similar manner. Every cluster scenario of the WSS considered to have similar 15.24 cm (6-inch) schedule 80 distribution main with a length halfway to the farthest distance from the source center to the cluster boundary. In addition, a 2.54 cm (1-inch) schedule 80 pipe is to be used for all distribution from the main to customer networks, having a coefficient of retardation of 150 and an inner diameter of 2.43 cm (0.957 in) (used in Equation (8)). This assumption is made so that each random WSS scenario is compared with optimized cluster using parcel-based energy usage. A few characteristics will change for each parcel of different scenarios, such as length, elevation and flow rate; the length, elevation and flow rate are taken from Figure 9a,b. The same assumptions are applied to the centralized WSS scenario where the source center is located at the existing water source C9.
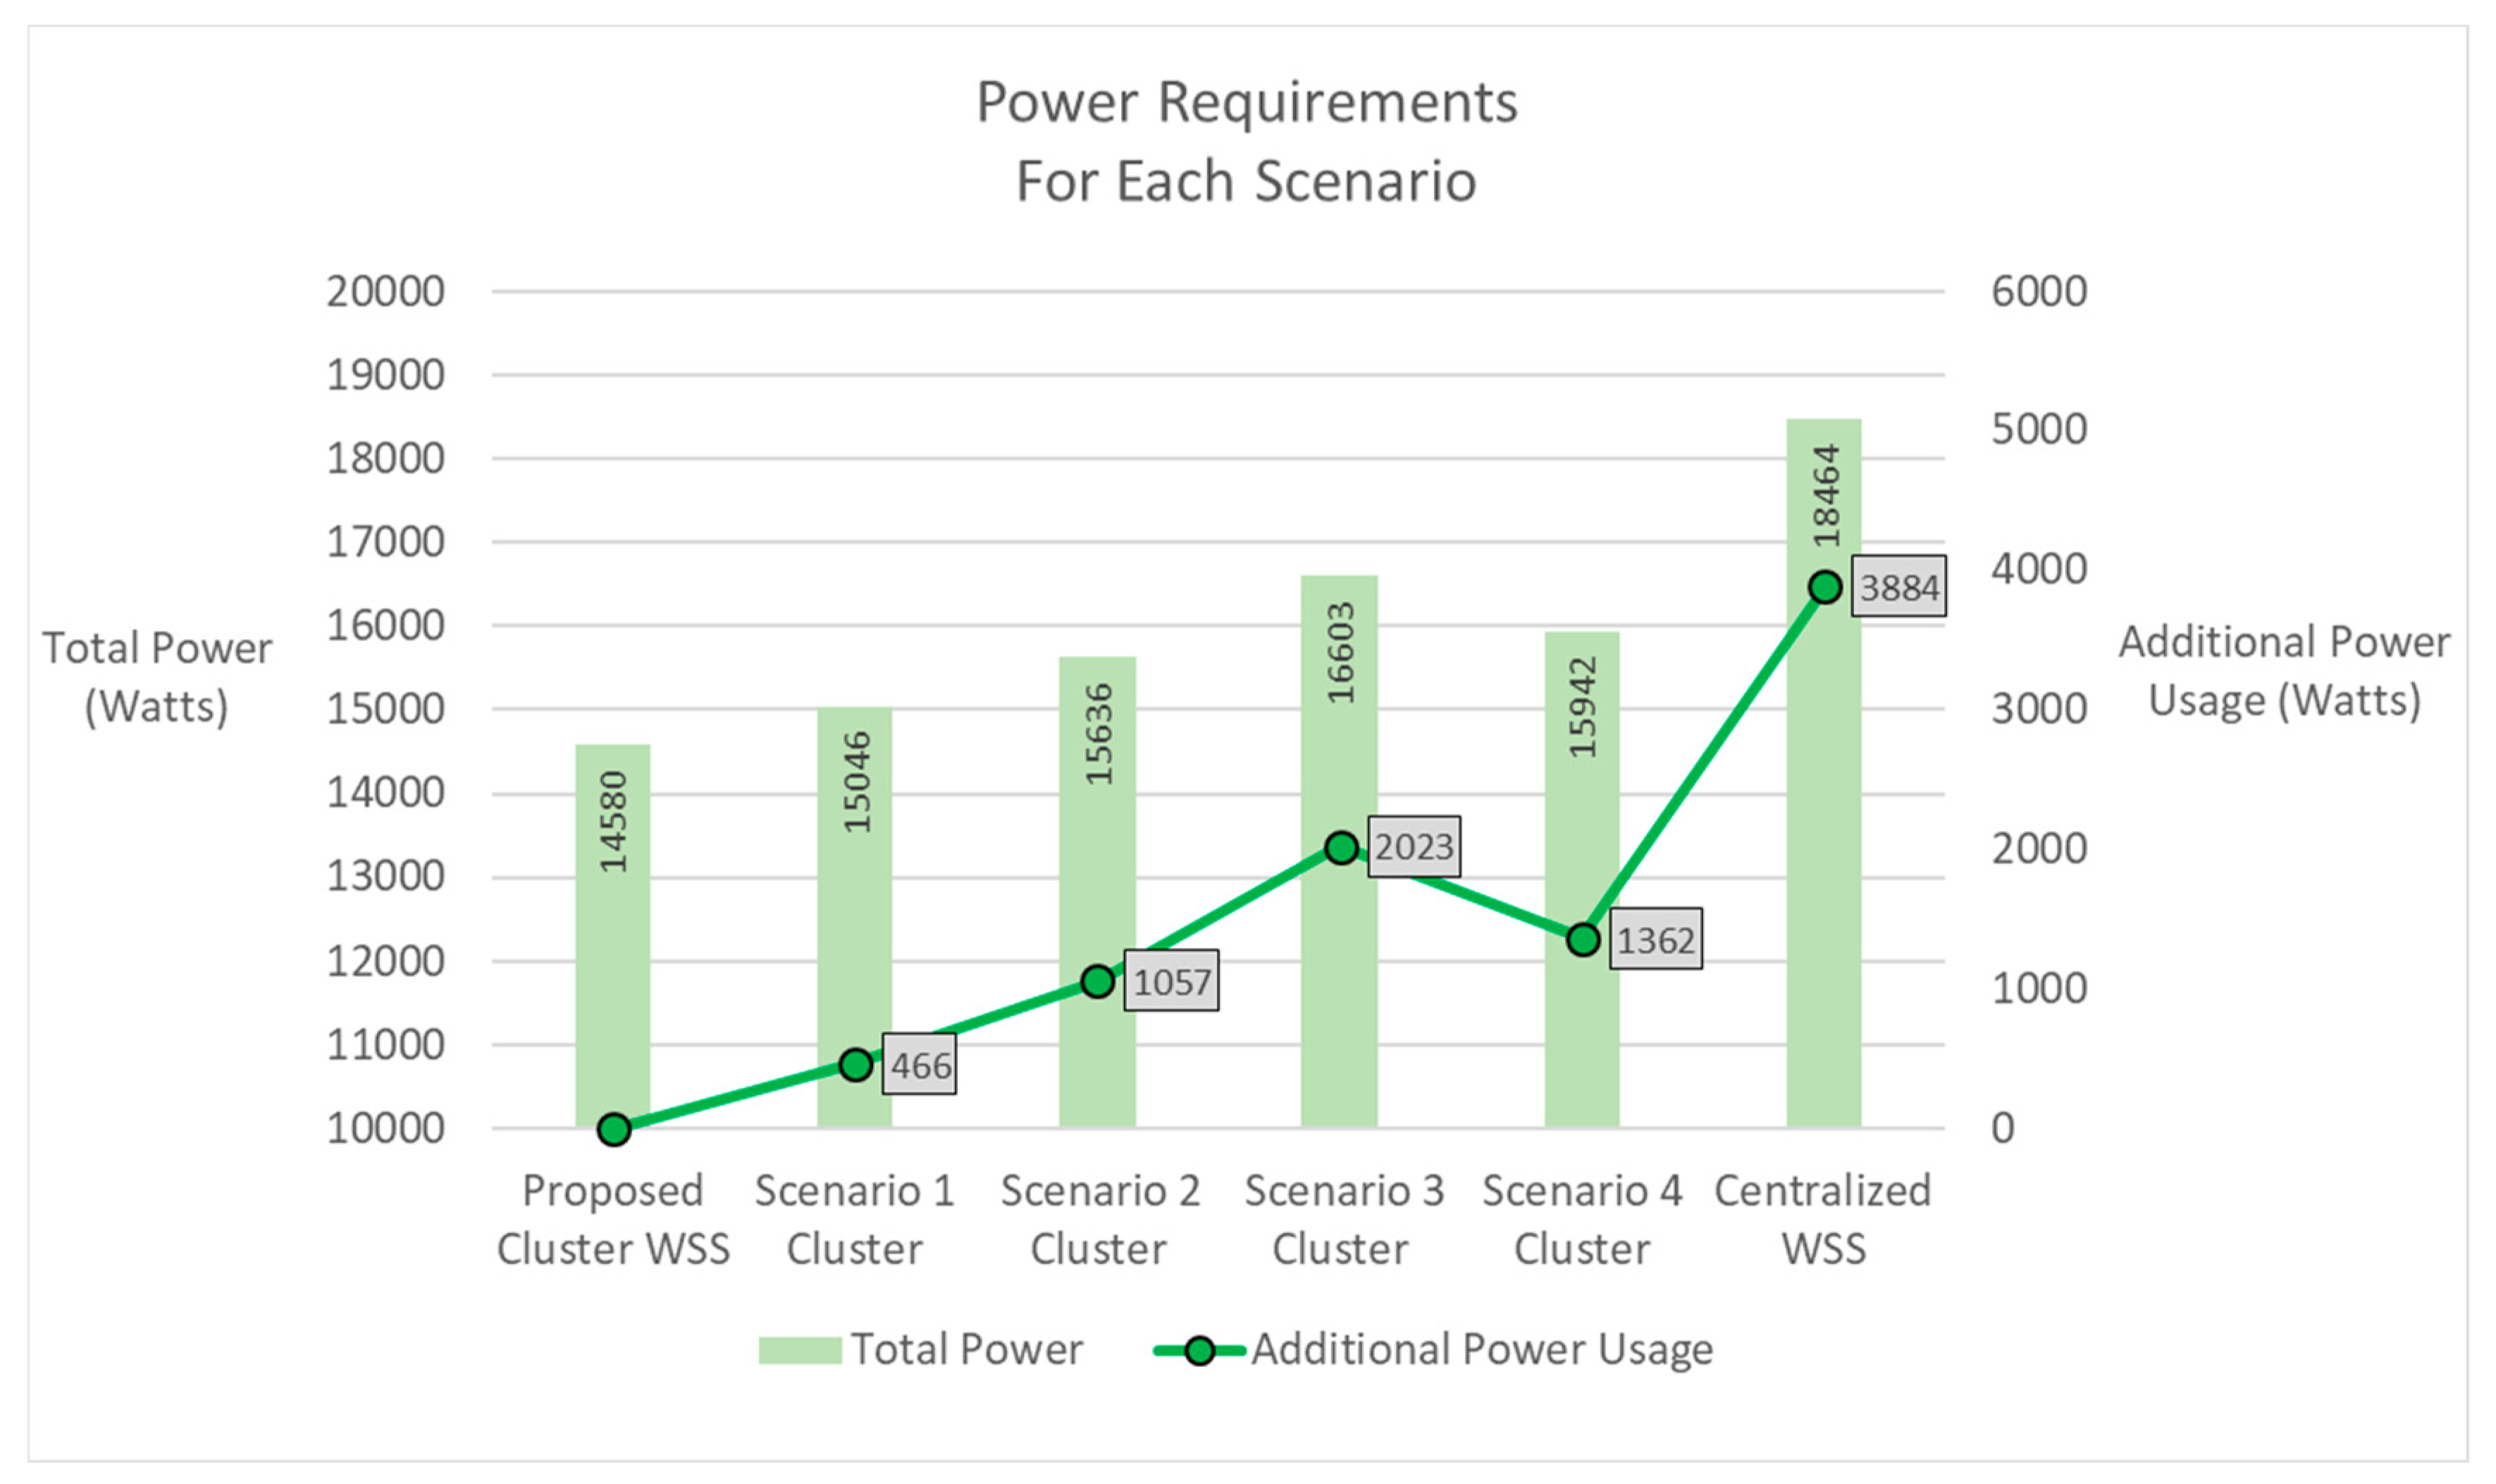
When performing the power usage analysis, all equations and concepts discussed in the methodology section were applied to each parcel within the enclosed area, excluding parcels in the existing municipality, forest area and outside the predicted town extent (Figure 6). This was done for each of the five scenarios to produce an adequate sample for the power usage analysis. Table 2 shows the power requirements of each cluster within every scenario, the total power required by each scenario, the additional power usage each scenario has compared to the proposed WSS, and the operational cost per year for each scenario was calculated. It is also important to note that this is a comparative analysis as opposed to an absolute O&M cost estimate of an optimal WDS. The total and excess power usage from Table 2 is represented in Figure 12 with two separate axes.
The yearly operational cost for each scenario was estimated using Equation (10). To use this equation, the current conversion rate for UGX to USD and the price per kWh must be known; as of November 2018, the conversion rate was $0.00027 USD/UGX (retrieved from Google Finance) and the price was $0.185247 USD/kWh [35]. Table 2 contains the total cost of the proposed WSS and randomly clustered scenarios.
The data shown in Table 2 evidently confirms that the proposed decentralized WSS requires less power and therefore money to operate. Figure 12 illustrates the proposed WSS scenario has the lowest power consumption compared to the conventional centralized WSS and the randomly generated clustered WSS. It was also observed that the operational cost of the random cluster scenarios is 3.2% to 13.9 % higher and centralized system is 26.6% higher than the optimal clustered WSS, consequently verifying the efficacy of the proposed method to determine an optimal cluster boundary for WSS.
4.4. Water Security and Resiliency
Clustered water systems with small ecological footprints that typically use locally available water sources, tend to increase urban water system security. Efficient use of resources is a key reason that clustered systems are more resilient than conventional urban water systems [36,37]. Diversification of water sources is crucial for achieving water security and resiliency. In particular, clustered WSS utilizes non-conventional water sources and fit-for-purpose water supplies. For example, stormwater, grey water and black water can be collected and used close to the source. This provides an additional portfolio of water sources that are not leveraged in existing centralized systems, but that can be better incorporated into decentralized systems and ultimately, improves water security. In addition, clustered systems reduce the amount of water extracted from a centralized water source which usually requires long-distance transport. The diversification of water source allows improvement of environmental flows that are critical for restoring downstream ecosystems in riverine systems.
Clustered systems involve small and modular units that can absorb a high level of disturbances and self-directs the path of adaptation toward a more desirable state [38]. When one cluster system faces a major disturbance, it maintains the capacity of other clusters to perform essential functions. For example, WSS are frequently exposed to leakage and waterborne outbreaks leading to a disruption in the operation; this disruption could cause a water outage across the whole system in a convention utility system. However, clustered systems provide resiliency that allows most areas to operate properly while one cluster is under maintenance. By partitioning the area into separated WSS, the risk of a total system disruption can be reduced. It allows decentralized technologies to be installed within clusters that maintains public health and environmental quality.
4.5. Future Research
While the research documented herein has provides a detailed method that can be used to conduct a cluster analysis, the example application was performed in a simplistic manner to demonstrate the importance of the method. However, more research is required to apply the analysis method developed to more complex utility system design issues with a wider range in pipe diameters and lengths. In addition, the same analysis could be applied to electric utility design, road and street design, and other urban infrastructure.
5. Conclusions
Currently no method exists which guides planners and engineers on how to cluster Water Supply Systems (WSS). To address this need, a new optimization model that supports the development of clustered (decentralized) water systems has been developed and applied to a real case study in Arua, Uganda. The developed clustering methodology is based on two major principles: the minimization of the distance from source to consumer by assigning demand to the closest source center, and the maximization of the homogeneity within a cluster. Euclidean norm minimization was used to optimize the source-demand distance for all parcels to minimize the transportation distance and corresponding infrastructure requirements. Intra-cluster homogeneity was used to measure the similarity or dissimilarity between parcels of the same cluster. Maximization of intra-cluster homogeneity allows clustering the parcels so that parcel attributes within a cluster are closely related to one another. Three major parameters considered in the clustering process, include membership (determined from Euclidean norm minimization), topography (elevation of the parcels), and spatio-temporal demand distribution (determined from the population distribution, land use, and socio-economic parameters). A K-means optimization technique were applied to maximize intra-cluster homogeneity to reduce the costs associated with water system investment and operation (energy and leakage) and to improve resource efficiency (recycling). The efficacy of the developed clustering method was tested in a real case study of Arua, Uganda. The WSS in Arua was divided into nine clusters, thereby reducing the effort required to move water and wastewater, as well as developing systems that offer opportunity to adapt to future changes. The case study demonstrated that it is possible to apply the developed methodology to delineate clusters based on minimizing distance between source and use and maximizing the intra-cluster homogeneity. An analysis using calculated power requirements showed that the clustered approach did provide lower cost and more efficiency.
Author Contributions
S.T. developed the concepts, preformed the modelling and wrote the initial manuscript. T.M.M. checked the methodology and revised the final manuscript. J.-Y.K. edited the final manuscript. J.H. helped with the power usage analysis. All authors have read and agreed to the published version of the manuscript.
Funding
The authors thank the U. A. Whitaker of Engineering, Emergent Technologies Institute at Florida Gulf Coast University for providing funding to publish this research.
Conflicts of Interest
The authors declare no conflicts of interest.
References
- United Nations Educational, Scientific and Cultural Organization (UNESCO). Water A Shared Responsibility: The United Nations World Water Development Report 2; Berghahn Books: New York, NY, USA, 2006. [Google Scholar]
- Poplak, R. What’s Actually behind Cape Town’s Water Crisis. The Atlantic. 15 February 2018. Available online: https://www.theatlantic.com/international/archive/2018/02/cape-town-water-crisis/553076/ (accessed on 13 August 2019).
- Masih, N.; Slater, J. As A Major Indian City Runs Out of Water, 9 Million People Pray for Rain. The Washington Post. 28 June 2019. Available online: https://www.washingtonpost.com/world/2019/06/28/major-indian-city-runs-out-water-million-people-pray-rain/?noredirect=on (accessed on 13 August 2019).
- Bairoch, P.; Goertz, G. Factors of urbanisation in the nineteenth century developed countries: A descriptive and economic analysis. Urban Stud. 1986, 23, 285–305. [Google Scholar] [CrossRef] [Green Version]
- Webster, M.; Jacobsen, M.; Vairavamoorthy, K. The Future of Water in African Cities: Why Waste Water; International Bank for Reconstruction and Development/International Development Association (World Bank): Washington, DC, USA, 2012. [Google Scholar]
- Valerie, N. New Approach in Decentralized Water Infrastructure; Coalition of Alternative Wastewater Treatment: Gloucester, MA, USA, 2008; Available online: https://www.csu.edu/cerc/researchreports/documents/NewApproachesInDecentralizedWaterInfrastructure2008.pdf (accessed on 14 August 2019).
- Grigg, N.S. Total Water Management: Practices for a Sustainable Future; American Water Works Association: Denver, CO, USA, 2008. [Google Scholar]
- Bieker, S.; Cornel, P.; Wagner, M. Semicentralised supply and treatment systems: Integrated infrastructure solutions for fast growing urban areas. Water Sci. Technol. 2010, 61, 2905–2913. [Google Scholar] [CrossRef] [PubMed] [Green Version]
- Chen, R.; Wang, X. Cost-benefit evaluation of a decentralized water system for wastewater reuse and environmental protection. Water Sci. Technol. 2009, 59, 1515–1522. [Google Scholar] [CrossRef] [PubMed]
- Verstraete, W.; Van de Caveye, P.; Diamantis, V. Maximum use of resources present in domestic “used water”. Bioresour. Technol. 2009, 100, 5537–5545. [Google Scholar] [CrossRef] [PubMed]
- Newman, P. Sustainable urban water systems in rich and poor cities--steps towards a new approach. Water Sci. Technol. 2001, 43, 93–99. [Google Scholar] [CrossRef] [PubMed]
- Cornel, P.; Meda, A.; Bieker, S. Wastewater as a source of energy, nutrients and service water. Treatise Water Sci. 2011, 3, 92. [Google Scholar]
- Kluge, T.; Libbe, J. Transformation of Network Infrastructure–Strategies for Communities: The Example Water; Difu-Beitrage zur Stadtforschung: Berlin, Germany, 2006. [Google Scholar]
- Böhm, H.R.; Schramm, S.; Bieker, S.; Zeig, C.; Anh, T.H.; Thanh, N.C. The semicentralized approach to integrated water supply and treatment of solid waste and wastewater—A flexible infrastructure strategy for rapidly growing urban regions: The case of Hanoi/Vietnam. Clean Technol. Environ. Policy 2011, 13, 617–623. [Google Scholar] [CrossRef]
- Weber, B.; Cornel, P.; Wagner, M. Semi-centralized supply and treatment systems for (fast growing) urban areas. Water Sci. Technol. 2007, 55, 349–356. [Google Scholar] [CrossRef] [PubMed]
- Wang, X.; Chen, R.; Zhang, Q.; Li, K. Optimized plan of centralized and decentralized wastewater reuse systems for housing development in the urban area of Xi’an, China. Water Sci. Technol. 2008, 58, 969–975. [Google Scholar] [CrossRef] [PubMed]
- Tsegaye, S.; Eckart, J.; Vairavamoorthy, K. Urban water management in cities of the future: Emerging areas in developing countries. In On the Water Front; Lundqvist, J., Ed.; SIWI: Stockholm, Sweden, 2012; pp. 42–48. [Google Scholar]
- Maliva, R.G.; Missimer, T.M. Aquifer Storage and Recovery and Managed Aquifer Recharge Using Wells: Planning, Hydrogeology, Design, and Operation; Schlumberger: Houston, TX, USA, 2010. [Google Scholar]
- GAUFF Consulting Engineers. Arua Emergency Water Supply Project: Inception Report. GAUFF Consulting Engineers. 2011. Available online: http://www.amk.rwth-aachen.de/uploads/media/RECLAIM_WATER_ Publishable_Final_Activity_Report.pdf (accessed on 15 July 2012).
- Herrera, M.; Canu, S.; Karatzoglou, A.; Perez-García, R.; Izquierdo, J. An approach to water supply clusters by semi-supervised learning. In Proceedings of the International Congress on Environmental Modelling and Software 190, Ottawa, ON, Canada, 5–8 July 2010. [Google Scholar]
- Puust, R.; Kapelan, Z.; Savic, D.A.; Koppel, T. A review of methods for leakage management in pipe networks. Urban Water J. 2010, 7, 25–45. [Google Scholar] [CrossRef]
- Wang, Y.; Zayed, T.; Moselhi, O. Prediction models for annual break rates of water mains. J. Perform. Constr. Facil. 2009, 23, 47–54. [Google Scholar] [CrossRef]
- Celebi, M.E.; Celiker, F.; Kingravi, H.A. On Euclidean norm approximations. Pattern Recognit. 2010, 44, 278–283. [Google Scholar] [CrossRef] [Green Version]
- Barni, M.; Bartolini, F.; Buti, F.; Cappellini, V. Optimum linear approximation of the Euclidean norm to speed up vector median filtering. In Proceedings of the 2nd IEEE International Conference on Image Processing (ICIP’95), Washington, DC, USA, 23–26 October 1995. [Google Scholar]
- BMBF. Final report of Sino-German Research Project. In Semicentralized Supply and Disposal Systems for Fast Growing Urban Regions in China; German Federal Ministry of Science and Technology: Berlin, Germany, 2006. [Google Scholar]
- Andersen, K.D.; Christiansen, E.; Conn, A.R.; Overton, M.L. An efficient primal-dual interior-point method for minimizing a sum of Euclidean norms. SIAM J. Sci. Comput. 2000, 22, 243–262. [Google Scholar] [CrossRef] [Green Version]
- Dopp, K.A.; Godfrey, N. Legislative Redistricting-Compactness and Population Density Fairness. 2011. Available online: https://ssrn.com/abstract=1945879 or http://dx.doi.org/10.2139/ssrn.1945879 (accessed on 14 August 2019).
- D’Agostino, M.; Dardanoni, V. What’s so special about Euclidean distance? Soc. Choice Welf. 2009, 33, 211–233. [Google Scholar] [CrossRef]
- Singh, K.; Malik, D.; Sharma, N. Evolving limitations in K-means algorithm in data mining and their removal. Int. J. Comput. Eng. Manag. 2011, 12, 105–109. [Google Scholar]
- Al-Saleh, M.F.; Yousif, A.E. Properties of the standard deviation that are rarely mentioned in classrooms. Aust. J. Stat. 2009, 38, 193–202. [Google Scholar] [CrossRef]
- Uganda Bureau of Statistics (UBOS). Mid-Year Projected Population for Town Councils; Uganda Bureau of Statistics (UBOS): Kampala, Uganda, 2011. [Google Scholar]
- COWATER. District Town Sewerage, Sanitation Feasibility Study: Arua Master Plan, National; Water and Sewerage Corporation: Arua, Uganda, 2005. [Google Scholar]
- Jung, Y.T.; Narayanan, N.C.; Cheng, Y.-L. Cost comparison of centralized and decentralized wastewater management systems using optimization model. J. Environ. Manag. 2018, 213, 90–97. [Google Scholar] [CrossRef] [PubMed]
- Hunter. The Handbook of Technical Irrigation Information. A Complete Reference Source for the Professional. 2015. Available online: https://www.hunterindustries.com/sites/default/files/tech_handbook_of_technical_irrigation_information.pdf (accessed on 30 August 2019).
- UMEME. The Electricity End-User Retail Base Tariffs for 2019 as Set and Announced by The Electricity Regulatory Authority; UMEME: Kampala, Uganda, 2018. [Google Scholar]
- Marlow, D.R.; Moglia, M.; Cook, S.; Beale, D.J. Towards sustainable urban water management: A critical reassessment. Water Res. 2013, 47, 7150–7161. [Google Scholar] [CrossRef] [PubMed]
- Sapkota, M.; Arora, M.; Malano, H.; Moglia, M.; Sharma, A.; George, B.; Pamminger, F. An overview of hybrid water supply systems in the context of urban water management: Challenges and opportunities. Water 2015, 7, 153–174. [Google Scholar] [CrossRef] [Green Version]
- Werbeloff, L.; Brown, R. Working towards sustainable urban water management: The vulnerability blind spot. Water Sci. Technol. 2011, 64, 2362–2369. [Google Scholar] [CrossRef] [PubMed]
Figure 1.
The proposed method for clustering WSS.

Figure 2.
Assignment of parcels to the source center. (X, and Y are location parameters, Z is elevation above sea level (asl), Qd is parcel demand, Qs and Qg are capacity of local water sources and group source respectively).
Figure 2.
Assignment of parcels to the source center. (X, and Y are location parameters, Z is elevation above sea level (asl), Qd is parcel demand, Qs and Qg are capacity of local water sources and group source respectively).

Figure 3.
Basic minimizing Euclidean norm algorithm.

Figure 4.
Basic K-means Algorithm.

Figure 5.
Geographic location of Arua, Uganda.

Figure 6.
Predicted spatial extent of Arua in year 2032.

Figure 7.
(a) Available water sources and their groups; (b) Water-source centers (based on minimized Euclidean distance).
Figure 7.
(a) Available water sources and their groups; (b) Water-source centers (based on minimized Euclidean distance).

Figure 8.
Maps showing parcel assignment (Minimized Euclidean norm) (a) and parcel membership-M based on source-demand distance (b).
Figure 8.
Maps showing parcel assignment (Minimized Euclidean norm) (a) and parcel membership-M based on source-demand distance (b).

Figure 9.
Maps showing elevation in m (asl) in the study area (a) and parcel water demand in m3/d (b).
Figure 9.
Maps showing elevation in m (asl) in the study area (a) and parcel water demand in m3/d (b).

Figure 10.
Maps showing (a) initial K-means clusters and (b) and clusters after merging isolated parcels.
Figure 10.
Maps showing (a) initial K-means clusters and (b) and clusters after merging isolated parcels.

Figure 11.
Maps showing clusters after re-distributing small groups (a) and WSS cluster boundaries with source centers (green circles) (b).
Figure 11.
Maps showing clusters after re-distributing small groups (a) and WSS cluster boundaries with source centers (green circles) (b).

Figure 12.
The bar graph represents the total power requirements per cluster. The line graph represents the excess power of the WSS scenarios compared to the proposed WSS.
Figure 12.
The bar graph represents the total power requirements per cluster. The line graph represents the excess power of the WSS scenarios compared to the proposed WSS.


Table 1.
Source groups and location of source centers.
| Source Group | Source no. | Water Source-Center Location | |
|---|---|---|---|
| X (m) | Y (m) | ||
| 1 | 1 | 1992 | 6772 |
| 2 | |||
| 16 | |||
| 2 | 3 | 5461 | 4650 |
| 4 | |||
| 5 | |||
| 3 | 6 | 6181 | 3600 |
| 7 | |||
| 4 | 9 | 6150 | 600 |
| 5 | 10 | 3110 | 510 |
| 13 | |||
| 6 | 11 | 2062 | 3108 |
| 12 | |||
| 14 | |||
| 7 | 15 | 1650 | 4950 |
| Forest (8) | 8 | 5400 | 2850 |
| Municipality (9) | 2400 | 3150 | |
Table 2.
Power requirements of each cluster, total power and operational cost per year for every WSS scenario.
Table 2.
Power requirements of each cluster, total power and operational cost per year for every WSS scenario.
| Proposed Cluster WSS | Scenario 1 Cluster | Scenario 2 Cluster | Scenario 3 Cluster | Scenario 4 Cluster | Centralized WSS | |
|---|---|---|---|---|---|---|
| Cluster Number | Power Per Cluster (W) | Power Per Cluster (W) | Power Per Cluster (W) | Power Per Cluster (W) | Power Per Cluster (W) | Power for Centralized (W) |
| 1 | 852.14 | 804.53 | 739.50 | 934.16 | 956.58 | 18,463.78 |
| 2 | 2967.08 | 3497.88 | 3990.10 | 4420.44 | 4742.18 | |
| 3 | 1154.50 | 971.45 | 820.32 | 868.80 | 941.99 | |
| 4 | 4597.13 | 4296.83 | 4435.66 | 4472.43 | 2986.95 | |
| 5 | 460.32 | 398.16 | 366.06 | 526.45 | 587.94 | |
| 6 | 4545.88 | 5074.51 | 5183.64 | 5124.28 | 5089.55 | |
| 7 | 2.46 | 2.38 | 101.09 | 256.46 | 636.46 | |
| Total Power | 14,579.51 | 15,045.74 | 15,636.38 | 16,603.01 | 15,941.65 | 18,463.78 |
| Additional Power Usage | 0.00 | 466.23 | 1056.87 | 2023.50 | 1362.14 | 3884.27 |
| US$ Per Year | $23,659 | $24,416 | $25,374 | $26,943 | $25,870 | $29,962 |
© 2020 by the authors. Licensee MDPI, Basel, Switzerland. This article is an open access article distributed under the terms and conditions of the Creative Commons Attribution (CC BY) license (http://creativecommons.org/licenses/by/4.0/).
Share and Cite
MDPI and ACS Style
Tsegaye, S.; Missimer, T.M.; Kim, J.-Y.; Hock, J. A Clustered, Decentralized Approach to Urban Water Management. Water 2020, 12, 185. https://doi.org/10.3390/w12010185
AMA Style
Tsegaye S, Missimer TM, Kim J-Y, Hock J. A Clustered, Decentralized Approach to Urban Water Management. Water. 2020; 12(1):185. https://doi.org/10.3390/w12010185
Chicago/Turabian StyleTsegaye, Seneshaw, Thomas M. Missimer, Jong-Yeop Kim, and Jason Hock. 2020. "A Clustered, Decentralized Approach to Urban Water Management" Water 12, no. 1: 185. https://doi.org/10.3390/w12010185
Note that from the first issue of 2016, this journal uses article numbers instead of page numbers. See further details here.