Performance and Kinetics of a Pond-Constructed Wetland System Treating Beef Manure Pile and Exercise Yard Runoff in Eastern Ontario

Department of Civil Engineering, University of Ottawa, 161 Louis Pasteur, Ottawa, ON K1N 6N5, Canada
*
Author to whom correspondence should be addressed.
Water 2020, 12(1), 168; https://doi.org/10.3390/w12010168
Submission received: 25 November 2019
/
Revised: 21 December 2019
/
Accepted: 24 December 2019
/
Published: 7 January 2020
(This article belongs to the Special Issue Advances in Constructed Wetland)
Abstract
:Runoff from manure piles and permanent outdoor confinement areas are common sources of pollution from livestock operations, which must be properly managed in accordance with local environmental regulations. Seven months of performance data from a pond-free water surface constructed wetland system receiving cattle feedlot runoff in Eastern Ontario, Canada, were used to evaluate performance and quantify first-order reaction rate constants (k) for organic matter and nutrients. Kinetic values were shown to be strongly temperature dependent and to adequately represent average treatment over the operating season; however, k values varied significantly on shorter time scales due to the event-based nature of the treatment system. Plant (duckweed) uptake of soluble phosphorus and ammonia in the pond was shown to be a predominant mechanism of nutrient removal. The pond-wetland system was effective at reducing biological oxygen demand (BOD5) by 67%, total phosphorus (TP) by 45%, and total nitrogen (TN) by 64%, providing a cost-effective and appropriate solution for beef producers.
1. Introduction
The recycling of nutrients, implicit in the use of animal manure as an agricultural fertilizer, has always been a central component to sustainable livestock production. However, beef producers often store manure in uncovered piles and keep animals in outdoor confinement areas, giving rise to the generation of manure pile and exercise yard runoff. The runoff, which can be characterized as having a low agronomic benefit but a high pollution potential, must be properly managed to meet regulatory requirements and to avoid contamination of ground or surface waters [1,2,3]. Conventional uncovered manure piles, permanently exposed to rainfall, represent a challenge for farmers given the significant quantity of runoff produced. Passive treatment technologies, such as pond and free water surface constructed wetland (FWS CW) systems, can provide appropriate solutions for runoff management on beef farms and are able to attenuate pulse flows and tolerate variable water levels from storm events [4,5,6]. Pond and FWS CWs can meet livestock producer’s preference for technology with low capital costs and low labor requirements [7].
CW systems have been widely designed and characterized for domestic wastewater applications using the P-k-C* model, described by Kadlec and Wallace [6], while recent studies have also demonstrated the model’s applicability in the design of agricultural wastewater FWS CWs [8,9]; however, data from livestock applications remain relatively scarce. In this study, an experimental pond-FWS CW system, treating beef manure pile and exercise yard runoff in eastern Ontario, Canada, was evaluated, and the FWC CW modeled. The study objectives were: (i) to evaluate the pond-FWS CW system performance and to elucidate treatment mechanisms, (ii) to determine average wetland kinetic removal rate constants and temperature coefficients, and (iii) to investigate the effect of precipitation events on treatment performance and kinetics. It is intended that the results derived from this study would serve to broaden our current understanding of runoff treatment wetland systems and to help improve the design of future treatment systems.
2. Materials and Methods
2.1. Site Description and Operation
The pond-FWS CW system evaluated in this study is located at the Pemdale beef farm in Winchester, Ontario, Canada (approx. 60 km south of Ottawa, ON, Canada), which is comprised of an average of 30 cattle. Over the wetland operating season from May to November, 30-year climate normals vary from 1.3 °C in November to 20.5 °C in July with an average of 13.4 °C and an average precipitation of 610 mm. The 2017 operating season had a somewhat above average daily temperature of 15.2 °C and was an abnormally wet year, with the farm receiving 922 mm of rainfall from May to November. The system stops operating in early December when average temperatures drop below 0 °C, runoff ceases, and the FWS CW water column freezes.
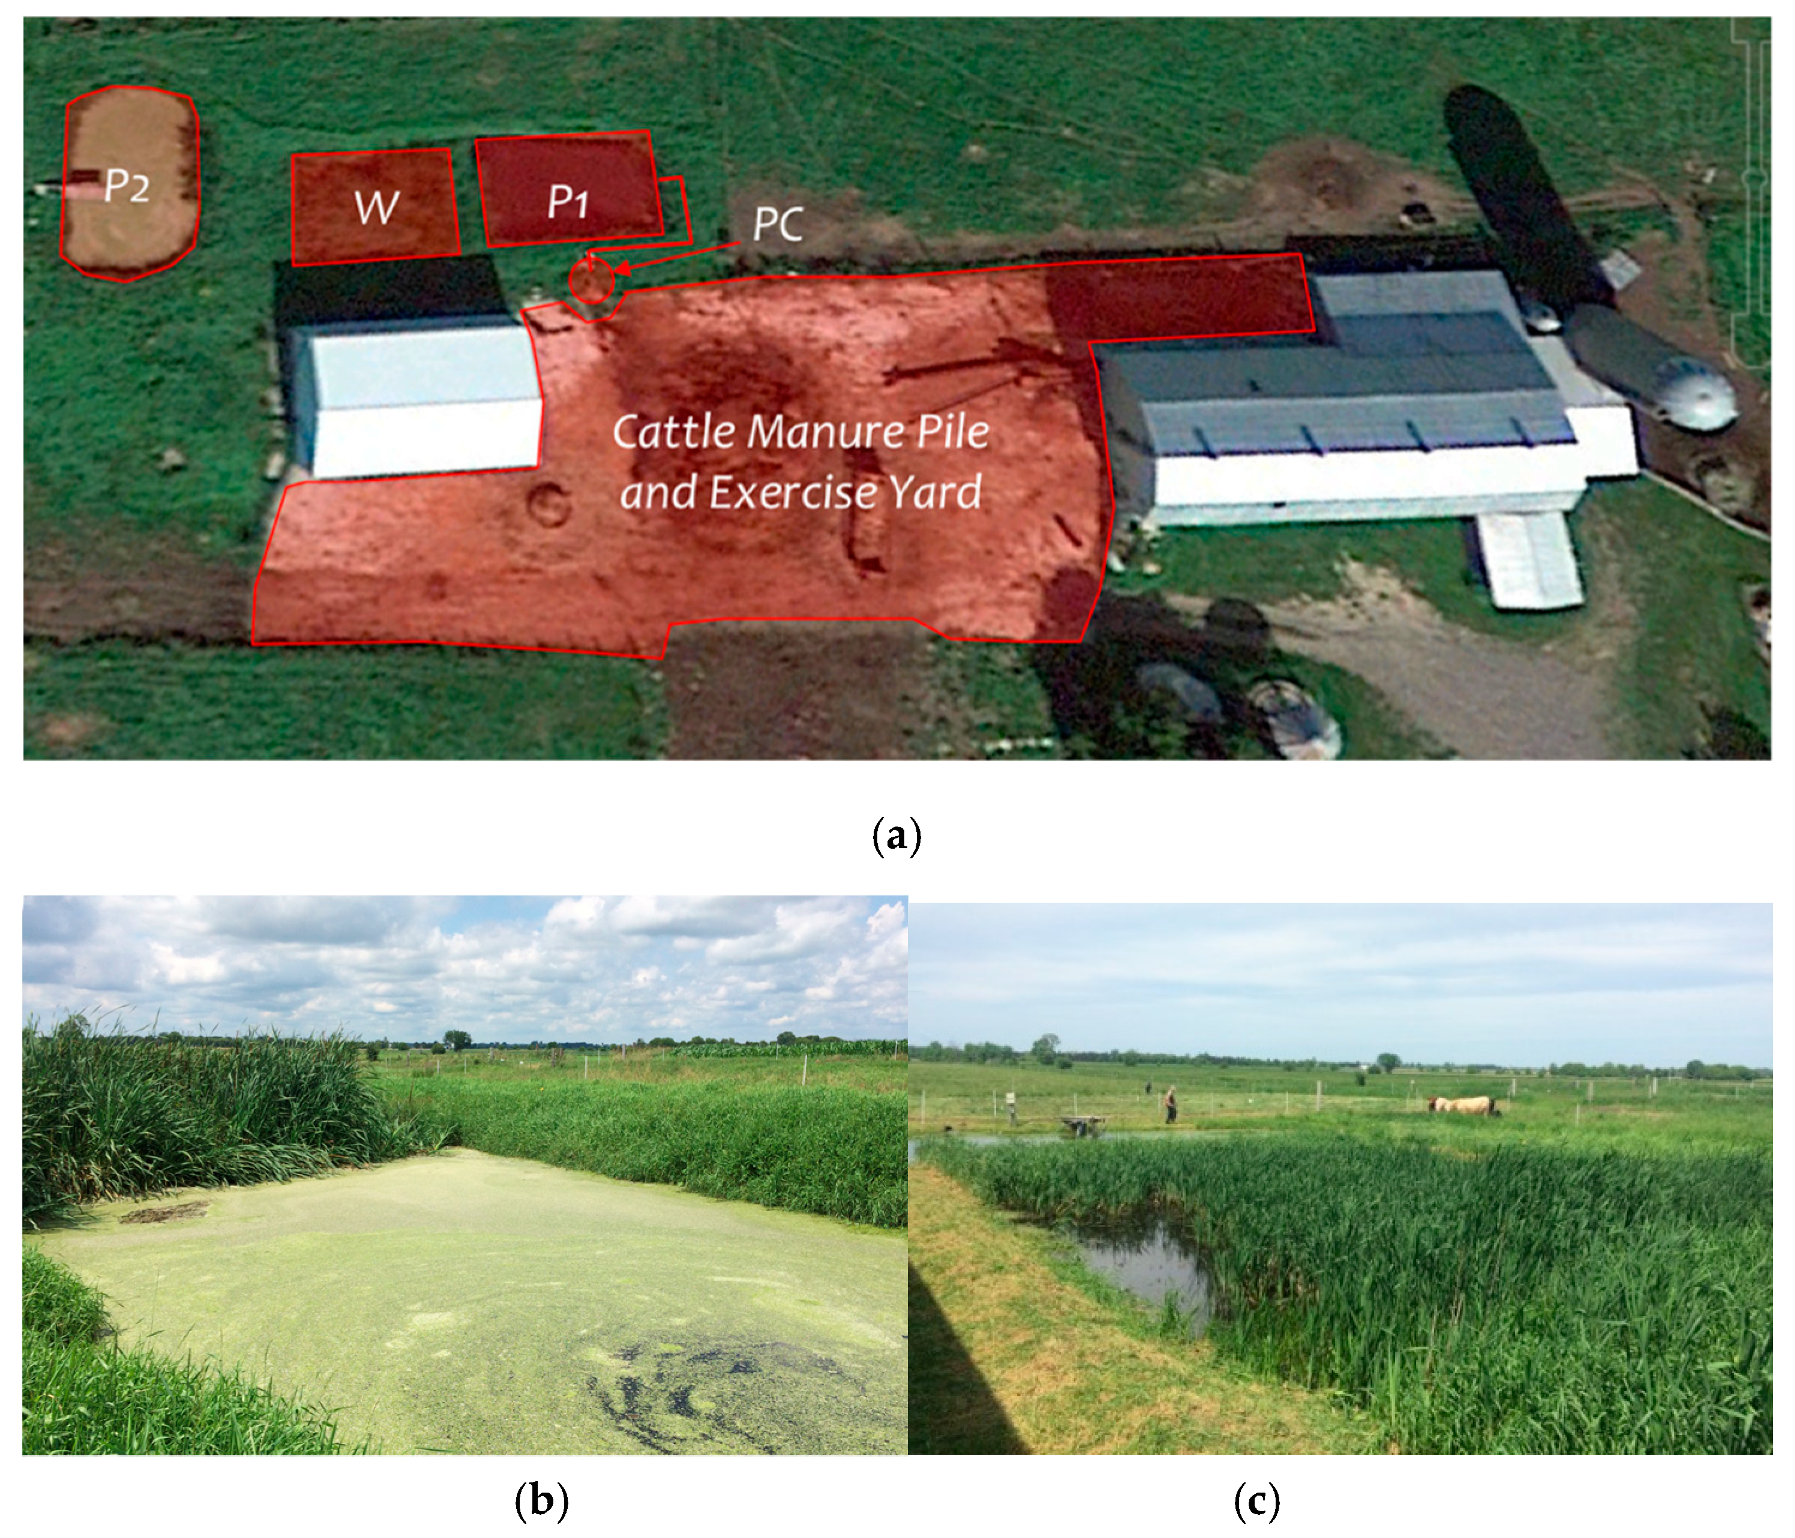
The manure is piled on an uncovered 1000 m2 concrete pad and spread onto the surrounding fields every three years as fertilizer. Manure and the exercise yard runoff are discharged from the concrete pad into a concrete pump chamber (PC) and then pumped into a primary treatment pond (P1), through a header pipe. The pond has an area of 109 m2 and a depth of 1.5 m. An overflow weir in vegetated heavy clay soil runs the entire width of the pond with the effluent flowing into a surface flow constructed wetland (W). Both P1 and W were constructed in the native clay soil compacted with an excavator shovel. The constructed wetland spans approximately 9 × 11.5 m (103.5 m2) and has an average depth of 0.3 m. The wetland contains mainly cattails (Typha sp.) that start re-growing during April and reach full growth by June. The wetland effluent is stored in an existing farm pond (P2), where it flows to an existing farm surface drain. P2 was influenced by groundwater and was not included in the study. The pond-FWS CW was constructed during the fall of 2014 and is depicted in Figure 1.
A total of 44 sampling visits were conducted throughout the seven-month study period, from the beginning of the growing season in May until the beginning of freeze-up in November. Cumulative pump runtime data were recorded during every visit, and in-situ measurements of water temperature, dissolved oxygen, and pH were conducted in PC, P1, and W. Single grab samples were collected from PC, P1, W, and P2 effluent at each visit using a bottle sampler to reach mid-depth at each sampling point. Field duplicates were collected approximately every ten samples and after intense rain events when concentrations were expected to change drastically. Samples were collected 1–2 times per week from May to November of 2017 and immediately transported to the environmental engineering research laboratory at the University of Ottawa for analysis. Triplicate analyses were done every 10 samples for laboratory quality assurance. The following analyses were conducted using the procedures outlined in the standard methods for the examination of water and wastewater APHA (2005): Chemical oxygen demand (COD)—method 5220; biochemical oxygen demand (BOD5)—method 5210 B; total phosphorus (TP)—method 4500 B and C; phosphates (PO43− as P)—method 4500 P; and total suspended solids (TSS)—method D and E. For nitrogen species, the following analytical methods were used: total nitrogen (TN)—Hach method 10072; ammonia (NH4+ as N)—Nessler method; nitrates (NO3− as N)—Hach method 10206 TNT 835. In the case of NH4+ and NO3−, samples were filtered prior to analysis to avoid turbidity interference. Duplicate samples of TN and TP were also filtered prior to analysis to determine the soluble organic nutrient fractions. Soluble TN and TP concentrations were obtained by multiplying an average soluble fraction with the average concentration of TN or TP from unfiltered samples.
Meteorological data (precipitation, air temperature, wind speed, and relative humidity) were obtained from the Kemptville (ON) meteorological station (25 km from the site) for May, while data from the Winchester agricultural research station (adjacent to the research site) were utilized for the rest of the study period (June–November).
2.2. Data Analysis
The information collected was divided into six periods to study temporal variation in temperature on system performance, isolate periods of consistent precipitation, and reduce variability due to short-term variations of inflow and outflow quality (synoptic error) [6]. Since averages of at least three hydraulic retention times should be used when estimating W kinetic constants and comparing removal rates to avoid synoptic error [6], time periods of approximately one month were used. A lag time, based on a three-tank in the series model [10], was utilized to align the W inlet and outlet samples collected for each of the 44 sample dates. The pond was assumed to be completely mixed, so no lag correction between PC to P1 samples was applied. To calculate residence times, a volumetric efficiency coefficient of 0.82 was used for W [6].
Given that the flow was dependent on the intensity and frequency of precipitation events, the hydraulic loading rate (HLR) and the hydraulic retention time (HRT) in each subsystem were variable. The average flow varied from 0.7 to 7.1 m3/d in P1 and from 1.2 to 7.9 m3/d in W. The slight increase in the flow values in W was due to the water mass balance that considered the volume of daily precipitation and daily evaporation of P1 in the calculation of the W influent. Infiltration through the compacted heavy clay soil was assumed to be negligible. This mass balance was also used to correct for any effect of dilution or concentration on the constituents in W, given that its small volume was more sensitive to any change due to precipitation or evapotranspiration. To calculate the daily evaporation rates in P1, the formula developed by Hargreaves (1968) was used as it has been found to provide a reasonable estimate of evaporation in Northern Ontario regions [11,12,13]. The retention time ranged between 15.3–149 days and 3.9–25 days in the P1 and W, respectively. Table 1 presents these values for each of the six periods analyzed, as well as the averaged DO concentrations and the monthly-averaged water temperatures used for further correction of kinetic constants.
To characterize the performance of W in reducing contaminants, the P-k-C* model [6] was used. The P-k-C* model, or relaxed tanks in series (TIS) concentration model is defined to be:
where Ci is the inlet concentration (mg/L), Ce is the outlet concentration (mg/L), C* is the background concentration, P is the apparent number of tanks in series (TIS), and k is the first-order areal rate constant (m/yr). Considering the potential for dependence of the kinetic constants on temperature, the Arrhenius temperature coefficient θ was incorporated in the formula to normalize k for temperature effects. The k values are reported at 20 °C:
where θ is the Arrhenius temperature coefficient.
These two formulas were used to calibrate the parameters of the P-k-C* model that best predict the concentration values observed in the W effluent for each of the constituents for the six periods from May to November.
A routine was programmed in MS Excel to generate random sets of values of the parameters P, k, θ, and C* and to evaluate iteratively the function described in the P-k-C* model for each constituent. The ranges used to generate the array of values for each parameter were: {1–4} for P as used by [6]; {0–68 m/yr (BOD5 and COD); 0–18 m/yr (TP and PO4−3); 0–32 m/yr (TN); 0–26 m/yr (NH4+); 0–9.2 m/yr (NO3−)} for k as the maximum values found in literature for each constituent [14,15]; {0–12 mg/L (BOD5); 0–240 mg/L (COD); 0–5 mg/L (TP and PO4−3); 0–18 mg/L (TN); 0–2.5 mg/L (NH4+); 0–1 m/yr (NO3−)} for C* as the minimum concentration values observed in the study for each constituent (Figure 2); and {0–1.07} for θ as the widest range observed by [6]. Modeled effluent concentration values were generated in each of the 3000 iterations performed for each constituent, and the sum of squares (SS) between the modeled and observed values was assessed. These SS values were then used as a proxy of the goodness of fit and were then ranked in descending order to identify which sets of P, k, θ, and C* generated modeled values that described better the observed concentrations. All the best-fit combinations that yielded within 1.5 times the lowest SS were used to calculate average model parameters and confidence intervals.
The F-test for statistical lack of fit analysis was employed and computed in Microsoft Excel to determine if the model was adequate and described well the observed values [16], where n is the overall sample size, c is the number of fitted values (each value corresponding to a period), and the null hypothesis (H0: no significant lack of fit) is rejected if F’ > F (c−4, n−c, 0.05).
Coefficients of determination were calculated to compare the modeled to actual data for each water quality parameter.
3. Results and Discussion
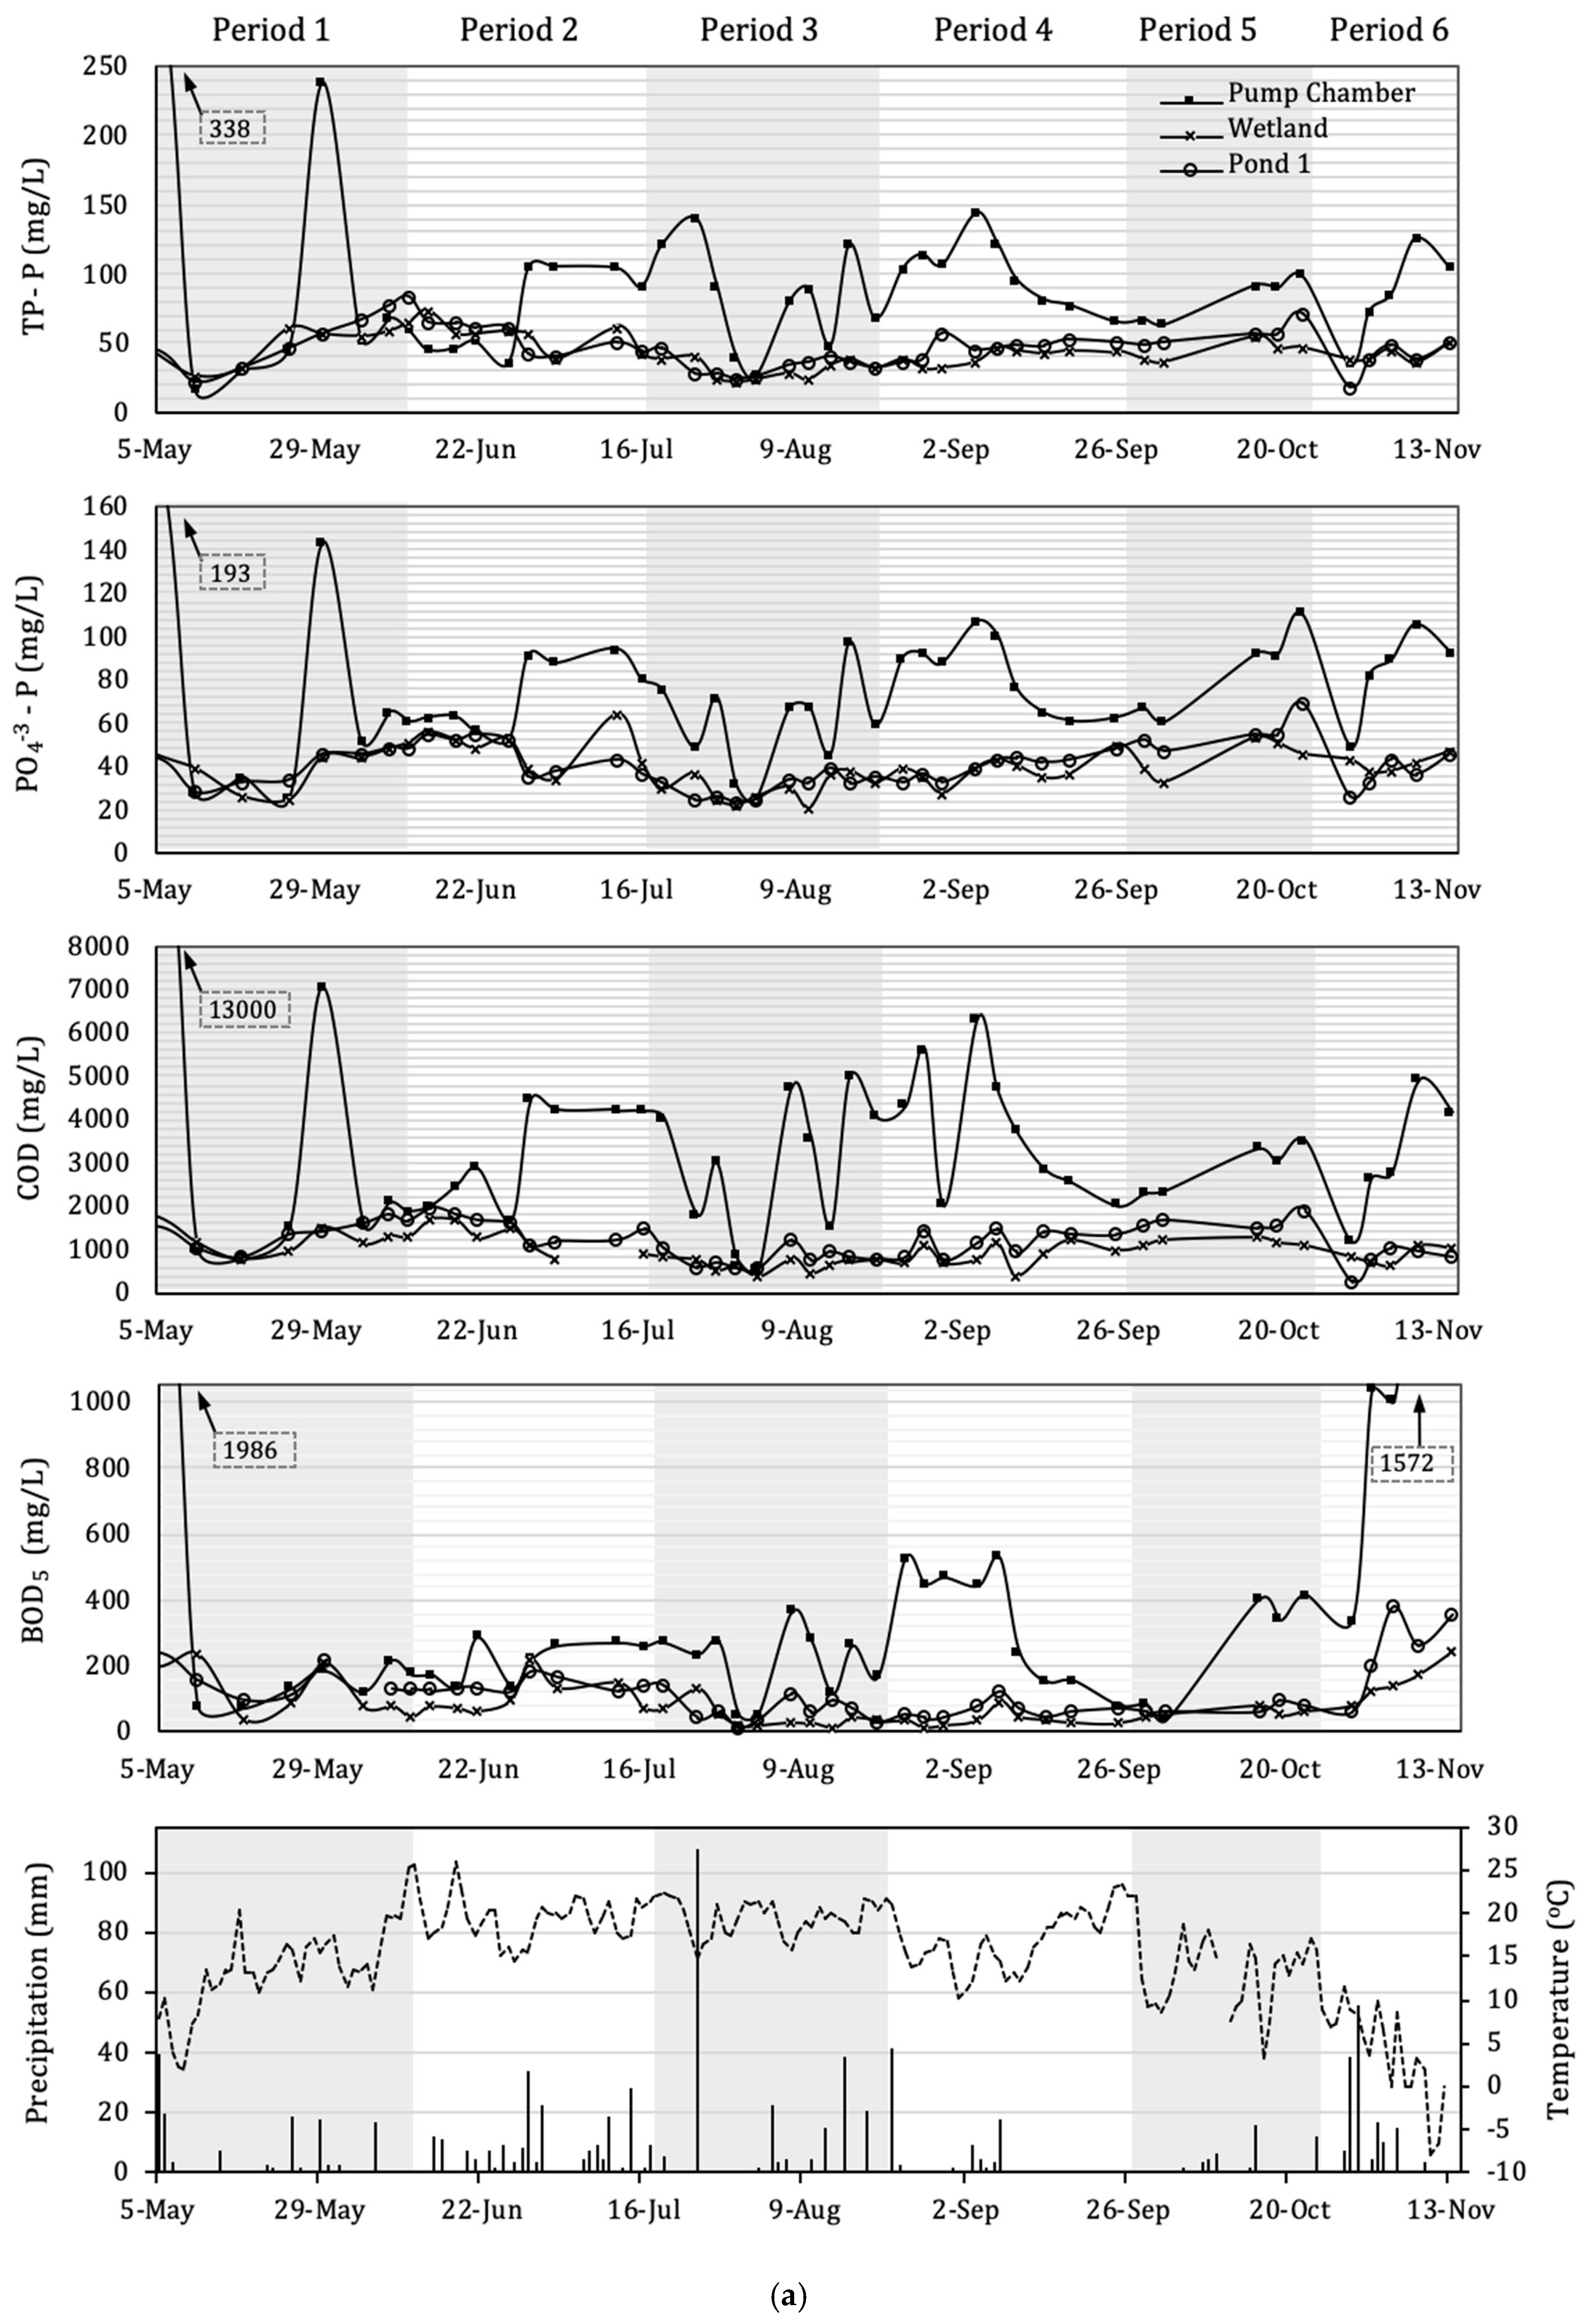
The concentrations of each of the constituents observed in PC, P1, and W are presented in Figure 2.
Relatively constant conditions of temperature and precipitation occurred throughout each period. Period 1 was characterized by the spring melting season with low and medium intensity rainfall events (mostly < 20 mm/d). Period 2 was characterized by being very humid, with numerous days of medium-intensity rainfall (up to 39 mm/d) that generated persistent humid conditions in the manure pile and increased concentrations of all constituents entering the system (PC). Period 3 had separated high-intensity rainfall events (up to 107 mm/d), which generated a high variability in the concentrations of all constituents analyzed throughout the system. This variability seemed to depend on the intensity of the event and the hydraulic capacity of the pond and wetland. Periods 4 and 5 were characterized by scarce rainfall, mostly low intensity, which generated long residence times in the system and large differences in constituent concentrations between P1 and W. Rain patterns and increases in concentrations similar to those of Period 2 occurred in Period 6, but at lower temperatures.
Average concentrations of the water constituents in PC, P1 (i.e., the inflow of the wetland), and W (i.e., the outflow of the wetland) are provided in Table 2.
3.1. Organic Matter
The organic matter was analyzed as both BOD5 and COD to reveal potential patterns between their respective removals and their ratios throughout the system. The COD/BOD5 ratio observed in PC averaged 7.6 with a range of 6.0–14.9, which is similar to reported values in previous cattle manure runoff analysis, which ranged from 8.8 to 24.8 [17,18].
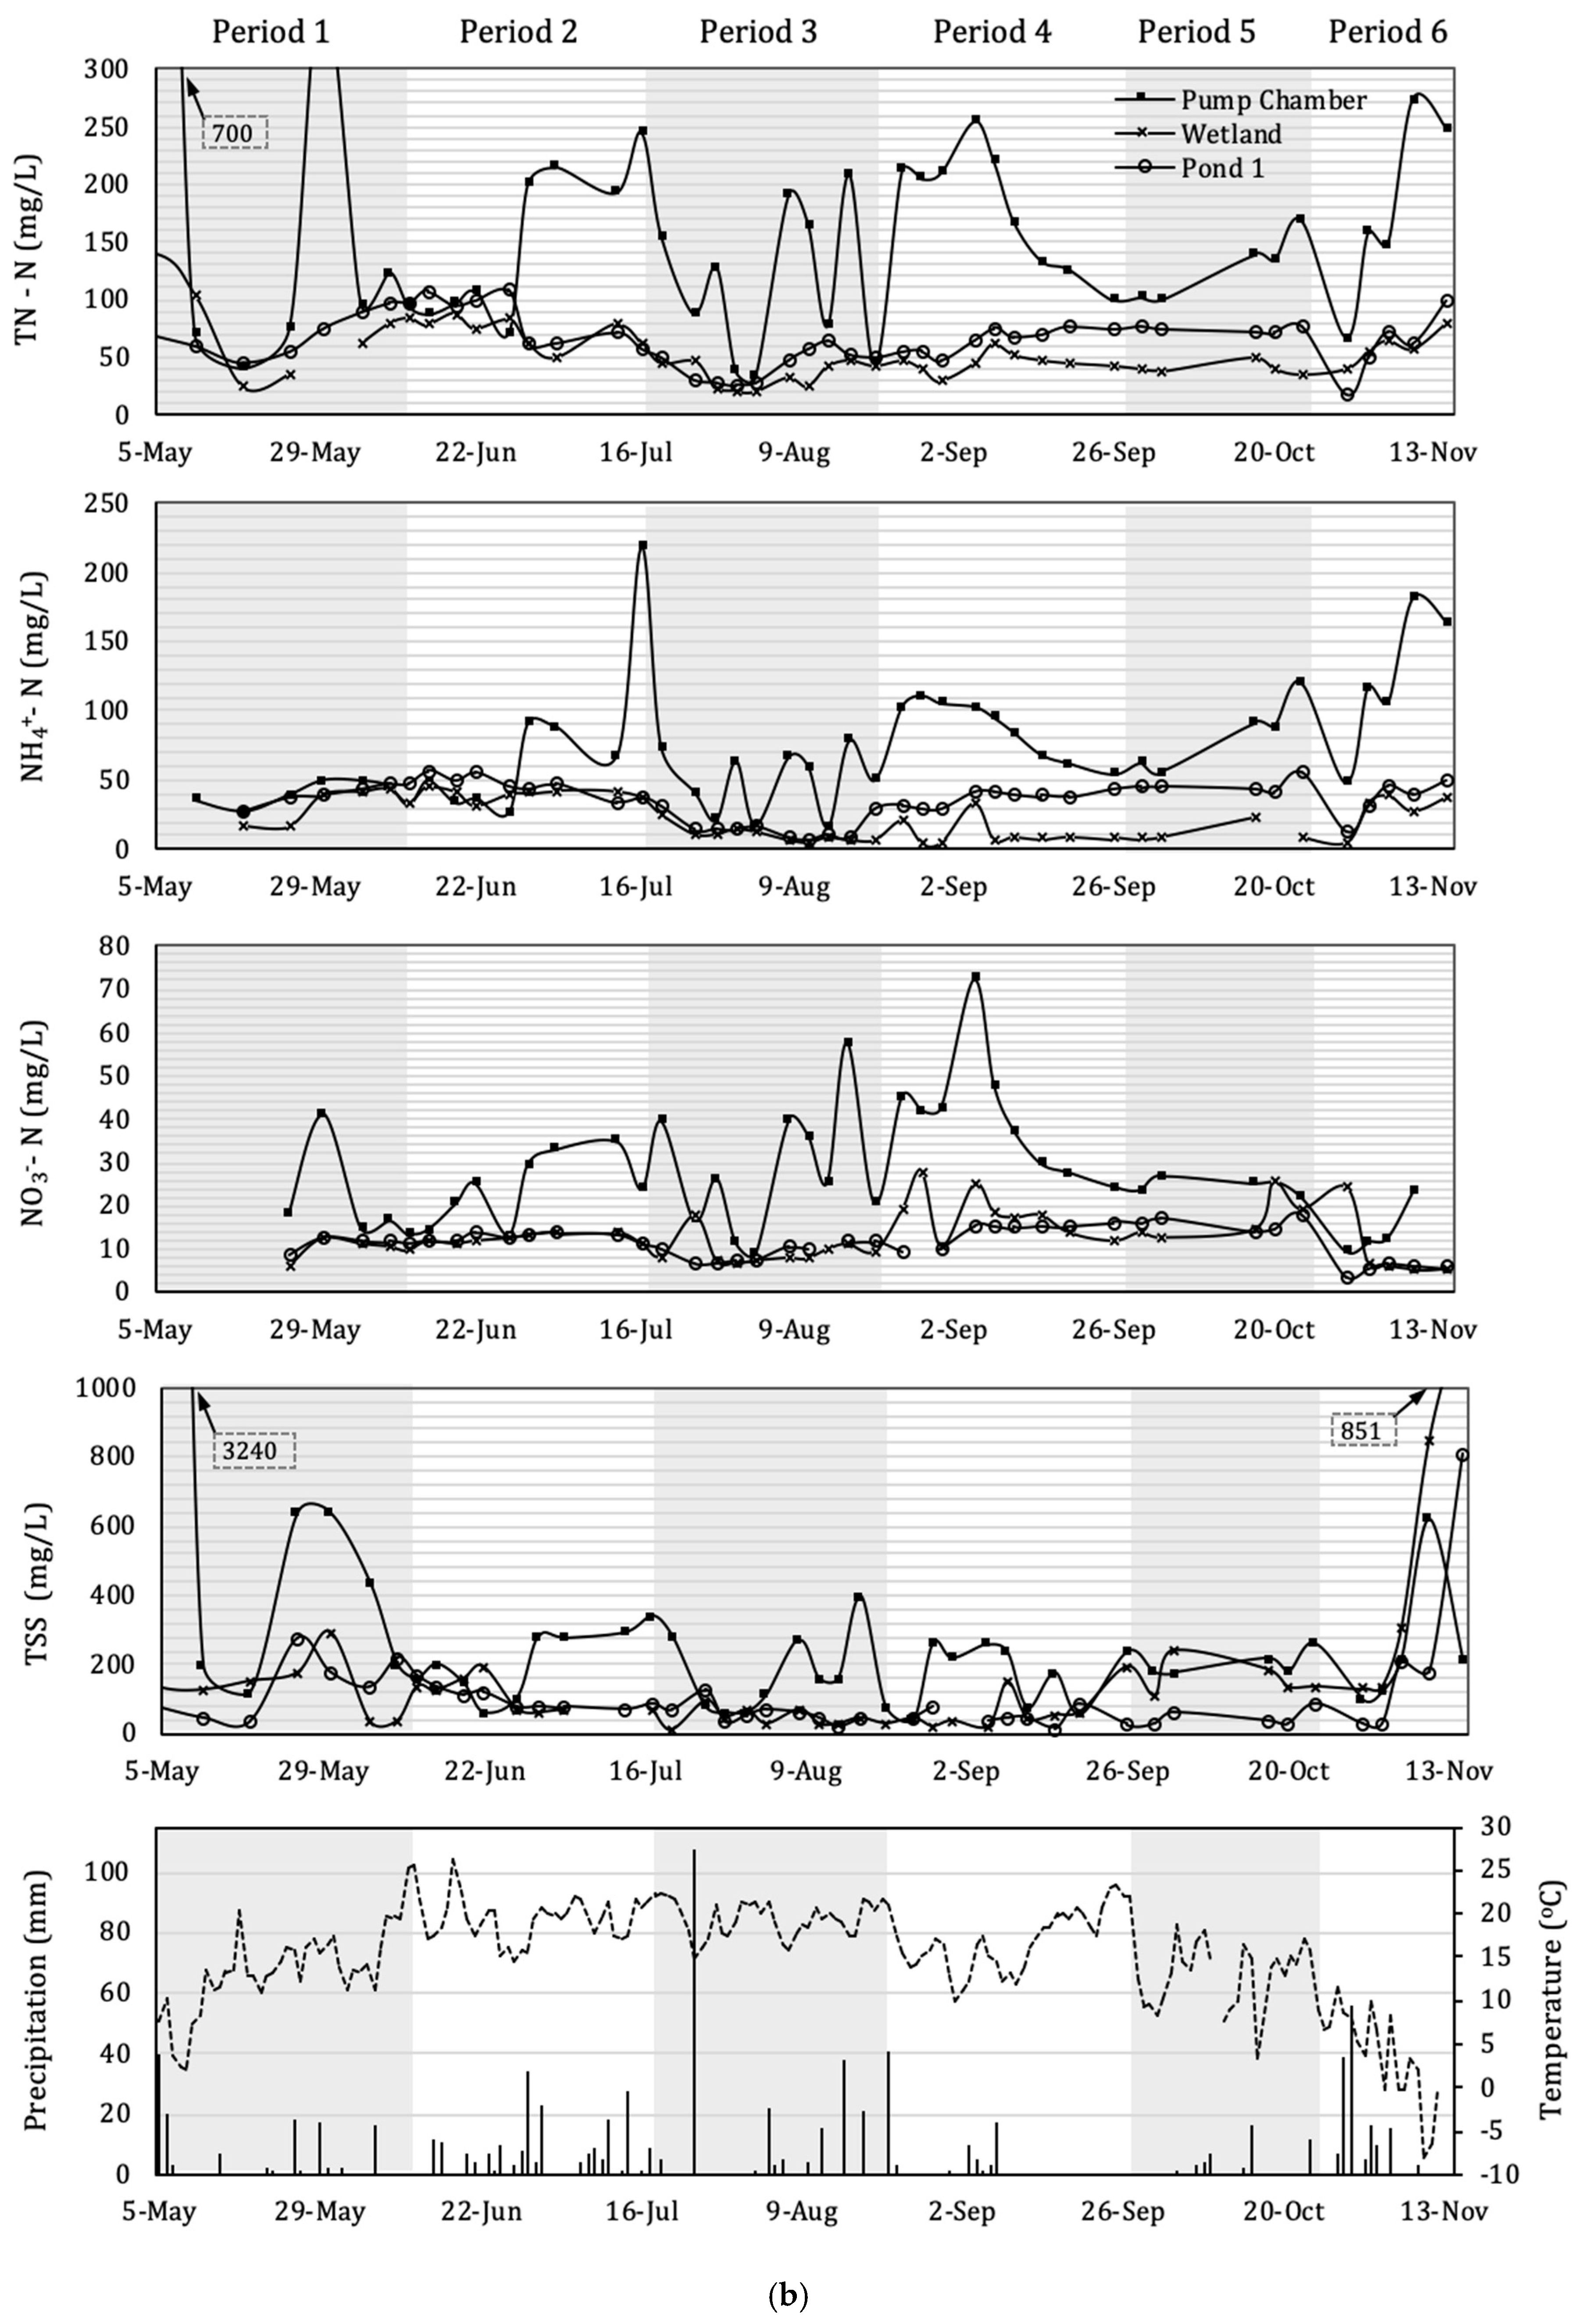
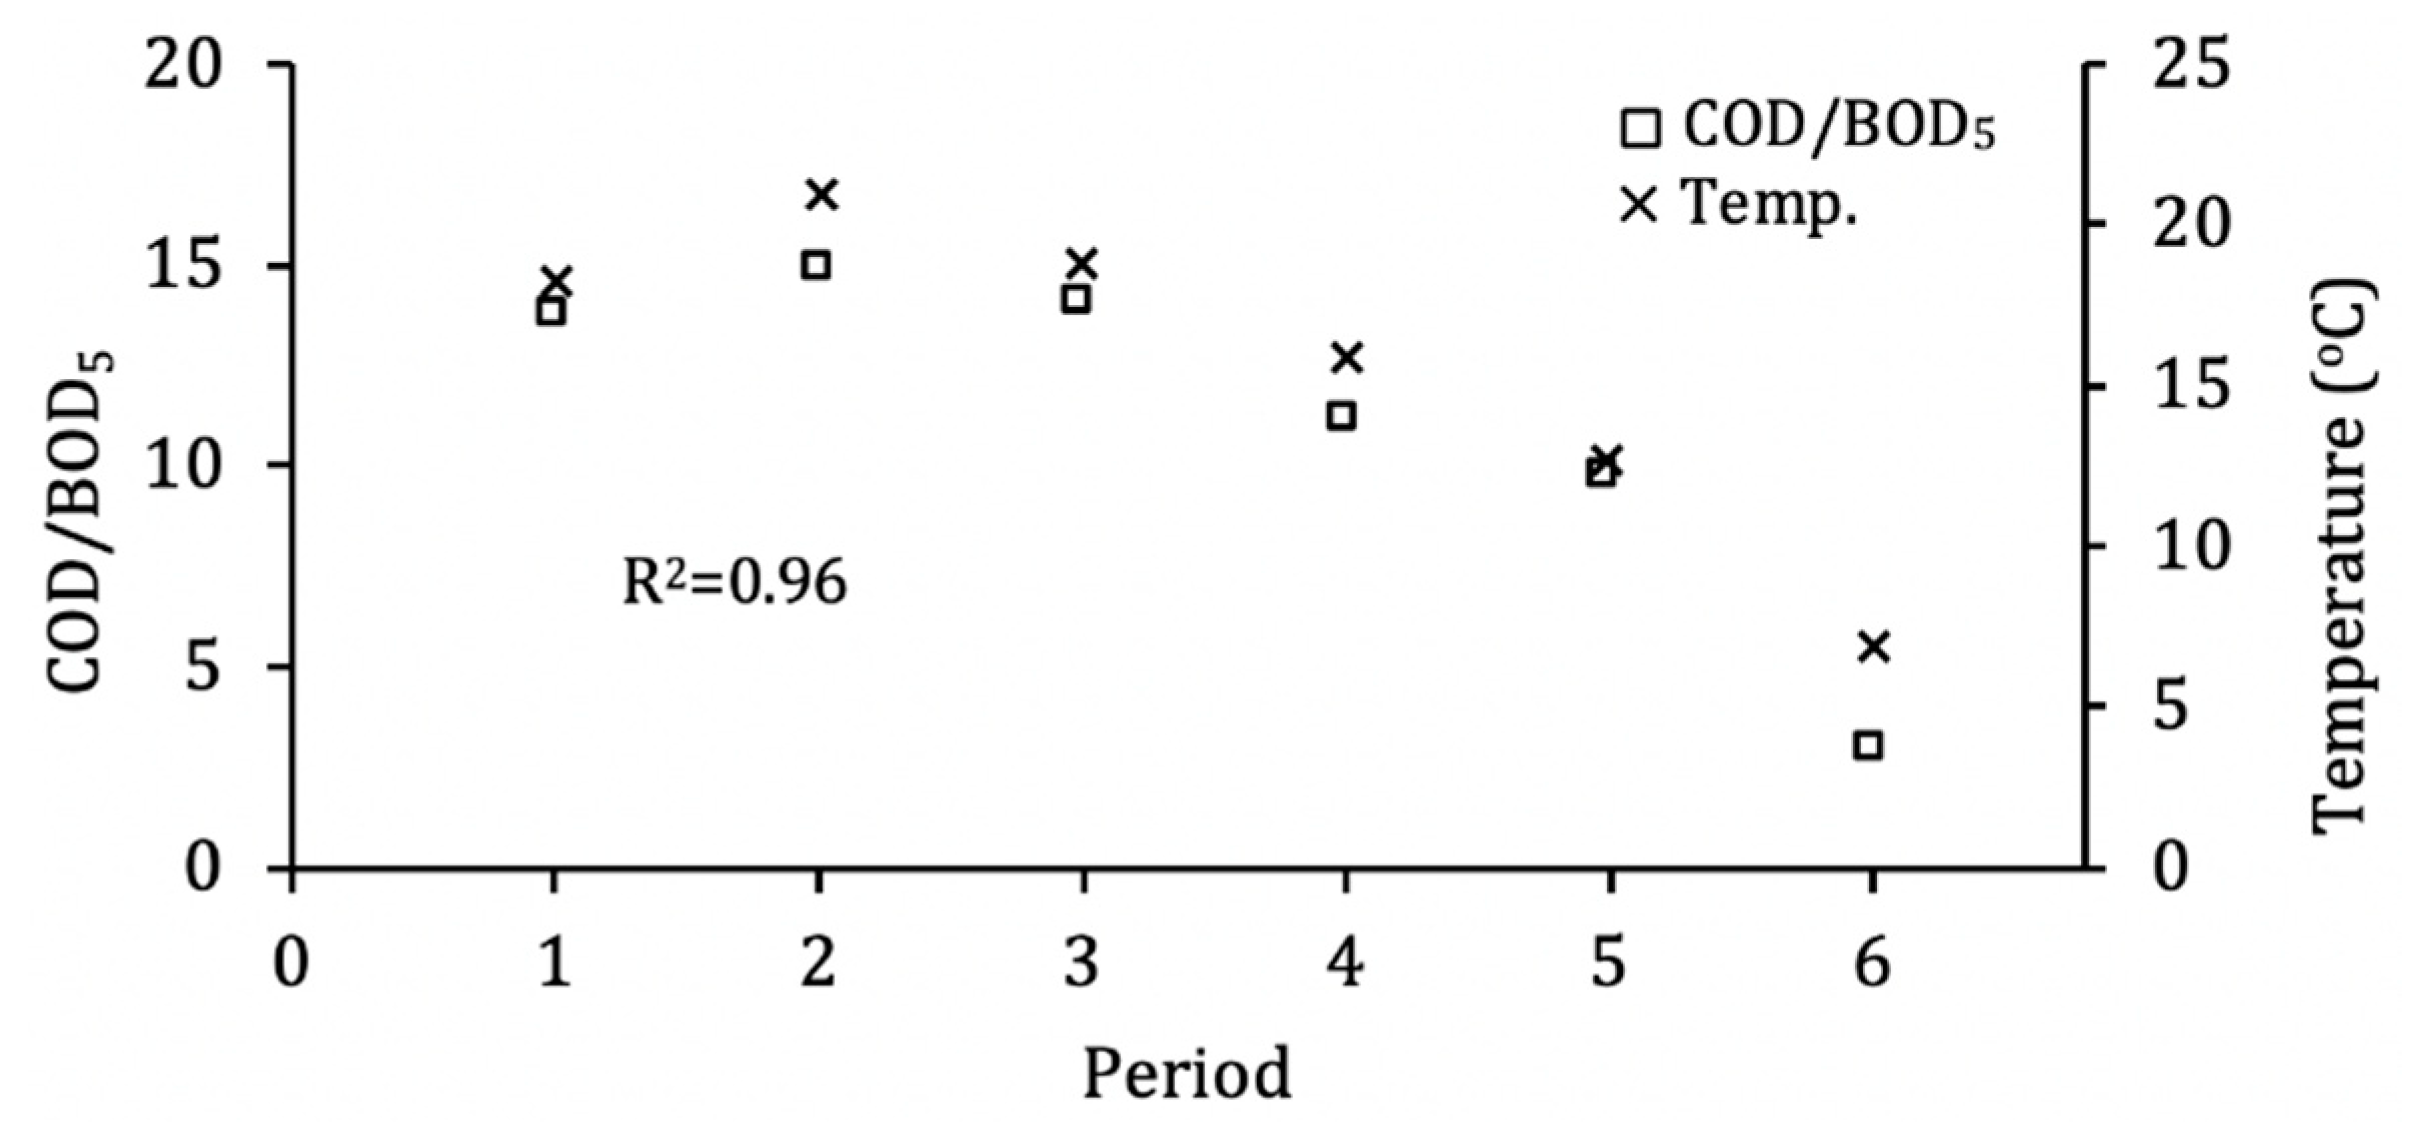
The COD/BOD5 in PC (i.e., raw manure pile runoff) throughout the year showed a high correlation with temperature (R2 = 0.96) (Figure 3). It has been demonstrated that with increasing temperature, the degradation of organic matter in composting piles is accelerated, resulting in stability being more quickly attained, a lower BOD5, and higher COD/BOD5 [19]. Stability is achieved when the biodegradability of the pile content decreases and, subsequently, the microbial activity is limited by access to readily biodegradable matter. Biodegradability is proportional to the fraction of BOD5 in an organic matter [20], which affects the COD/BOD5 ratio of the pile. Figure 3 demonstrates that during the warmer months (Periods 1–4), the manure pile resembled a compost pile with a reduced fraction of readily degradable organic matter being washed out during rain events. This suggested that the way the manure is being stored, the season and the ambient temperature could have a significant impact on the composition of the organic matter entering the system.
The influent COD/BOD5 ratios were much higher than typical municipal wastewater, which has COD/BOD5 ratios ranging from 1.3 to 3.3 [6,21], possibly due to the high content of cellulose in manure, which is subjected to much slower microbial hydrolysis than the proteins and lipids commonly found in sewage [22]. The pond/wetland system was effective at removing 67% BOD5 and 66% COD, with most removal occurring in the pond (Table 2). This was lower than expected in a domestic wastewater FWS CW treatment system, where efficiencies above 80% could be achieved in the wetland stage alone [23]. This might be due to the high COD/BOD5 ratio, which increased throughout the system and indicated that the organic matter became progressively more difficult to treat as the readily biodegradable fraction was removed (Table 3).
3.2. Phosphorus
Table 3 divides TN and TP into particulate and soluble components to better understand nutrient removal mechanisms. Soluble TN includes NO3−, NH4+, and soluble organic N, while soluble TP includes PO43− and soluble organic P.
The pond/wetland system was quite effective at reducing TP and PO43− by 45% and 43%, respectively (Table 2). However, most of the removal occurred in P1, where 12.6 mg/L or 87% of the particulate P was removed, likely through sedimentation, and 23.8 mg/L or 35% of soluble P was removed either through sorption or plant uptake (Table 3). In settling or stabilization ponds, sorption processes have finite retention capacities and can remove limited P after reaching saturation of active sites. In surface flow wetlands, the median time to saturation is about one year, and it is expected to be shorter in ponds since the volume to surface area ratio is larger, and the lack of area available limits their sorption capacity [6]. It is presumed that the elevated removal of soluble phosphorus observed in P1 was due to plant or microbial uptake related processes, given the soluble nature of PO43−, and the lack of evidence of other significant removal mechanisms under these conditions [6,9,24]. This proposed pathway of removal was supported by the observation of significant growth of floating macrophytes, or duckweed (Lemna sp.), in the pond throughout the monitoring period.
By contrast, all the remaining 1.9 mg/L of particulate P was removed in W, while only 4% (1.8 mg/L) of the remaining soluble P was removed. The apparent lack of removal in W could be due to the seasonal translocation of phosphorus from rhizomes to aboveground plant parts. During the spring growth spurt, up to 100% of the plant growth P needs may be withdrawn from storage in the belowground biomass [6]. Even in warmer months, microbial and plant uptake may be operating rapidly, but so are leaching and decomposition processes in the litter, reducing the net removal rate of this nutrient [6]. Overall, the wetland performed poorly with respect to phosphorus removal.
Other researchers have reported low TP treatment efficiencies for wetlands receiving wastewater from livestock and agricultural operations, especially as the wetland ages and the sorption sites for P reach saturation [4,6,8,25,26]. Stone et al. [25] indicated that the removal of phosphorus from swine-derived wastewater could reach 85% at input concentrations of between 1 and 3 mg/L, but as the concentration increased beyond 40 mg/L, this percentage could drop to 6%, which coincided with the removal observed in W in this study.
3.3. Nitrogen
The TN average concentration in PC was quite elevated at 145 mg/L, with 50% as NH4+, 31% as organic N (Norg), and 19% as NO3−. The average concentration of 27 mg/L NO3−-N was higher than literature values, where concentrations of 10 mg/L-N were not exceeded in cattle feedlot runoff [6,8,17]. NO3− is largely absent in fresh manure; however, nitrification can occur in a manure pile if favorable conditions of moisture content and oxygen transfer are present. For example, peaks of up to 72 mg/L of NO3−-N were observed following intermittent low-intensity rain (<10 mm/d), such as during period 5 (Figure 2b). These observations are supported by both [19] and [27], who reported increases in NO3− concentrations in manure compost piles of more than 600% on a dry weight basis. The relatively high NO3− concentrations observed in this study supported the hypothesis that composting processes are occurring in the manure pile.
The removal of TN in the system was greater in P1 as compared to the wetland. The N removal mechanisms present in a stabilization pond have been identified by previous research as follows: sedimentation of the particulate N, mainly Norg; plant uptake of inorganic N, mainly NH4+ as a preferable source of N for assimilation given that it is more reduced energetically than NO3−; and the ammonification-nitrification-denitrification cycle [6]. The latter depends on dissolved oxygen (DO) stratification in the pond, which promotes the conversion of Norg and NH4+ to NO3− on the surface and the stripping of NO3− to N2 (g) in the deeper anaerobic zones. In P1, all nitrogen species were reduced by 46% to 62% (Table 2), keeping their percent distribution almost unchanged from PC to P1. Most of the particulate N (76%) was removed through sedimentation in P1, while the remaining 53% of soluble Norg was converted to NH4+ or hydrolyzed (Table 2 and Table 3). This suggested that in P1, the removal rate of NH4+ was greater than that of the other nitrogen species, given that it had to counteract the simultaneous ammonification of Norg to maintain the same concentration ratio. Nitrification processes are inhibited at DO concentrations below 1 mg/L [28], as was the case in P1, where the average DO concentration was 0.7 mg/L (Table 1). Given the absence of optimal conditions for nitrification, it was hypothesized that the active net removal of NH4+ and soluble Norg observed in P1 was through plant uptake.
Regarding NO3− removal, although plant uptake could also play a role, it was more likely that the anaerobic conditions of P1 promoted the removal of this form of nitrogen through denitrification. Cedergreen and Madson [29] found that duckweed had a 2 to 30 times higher affinity and 3 to 11 times higher capacity for NH4+ uptake than for NO3−, depending on the plant structure and the availability of each nitrogen species, suggesting that plant uptake only played a marginal role in NO3− removal.
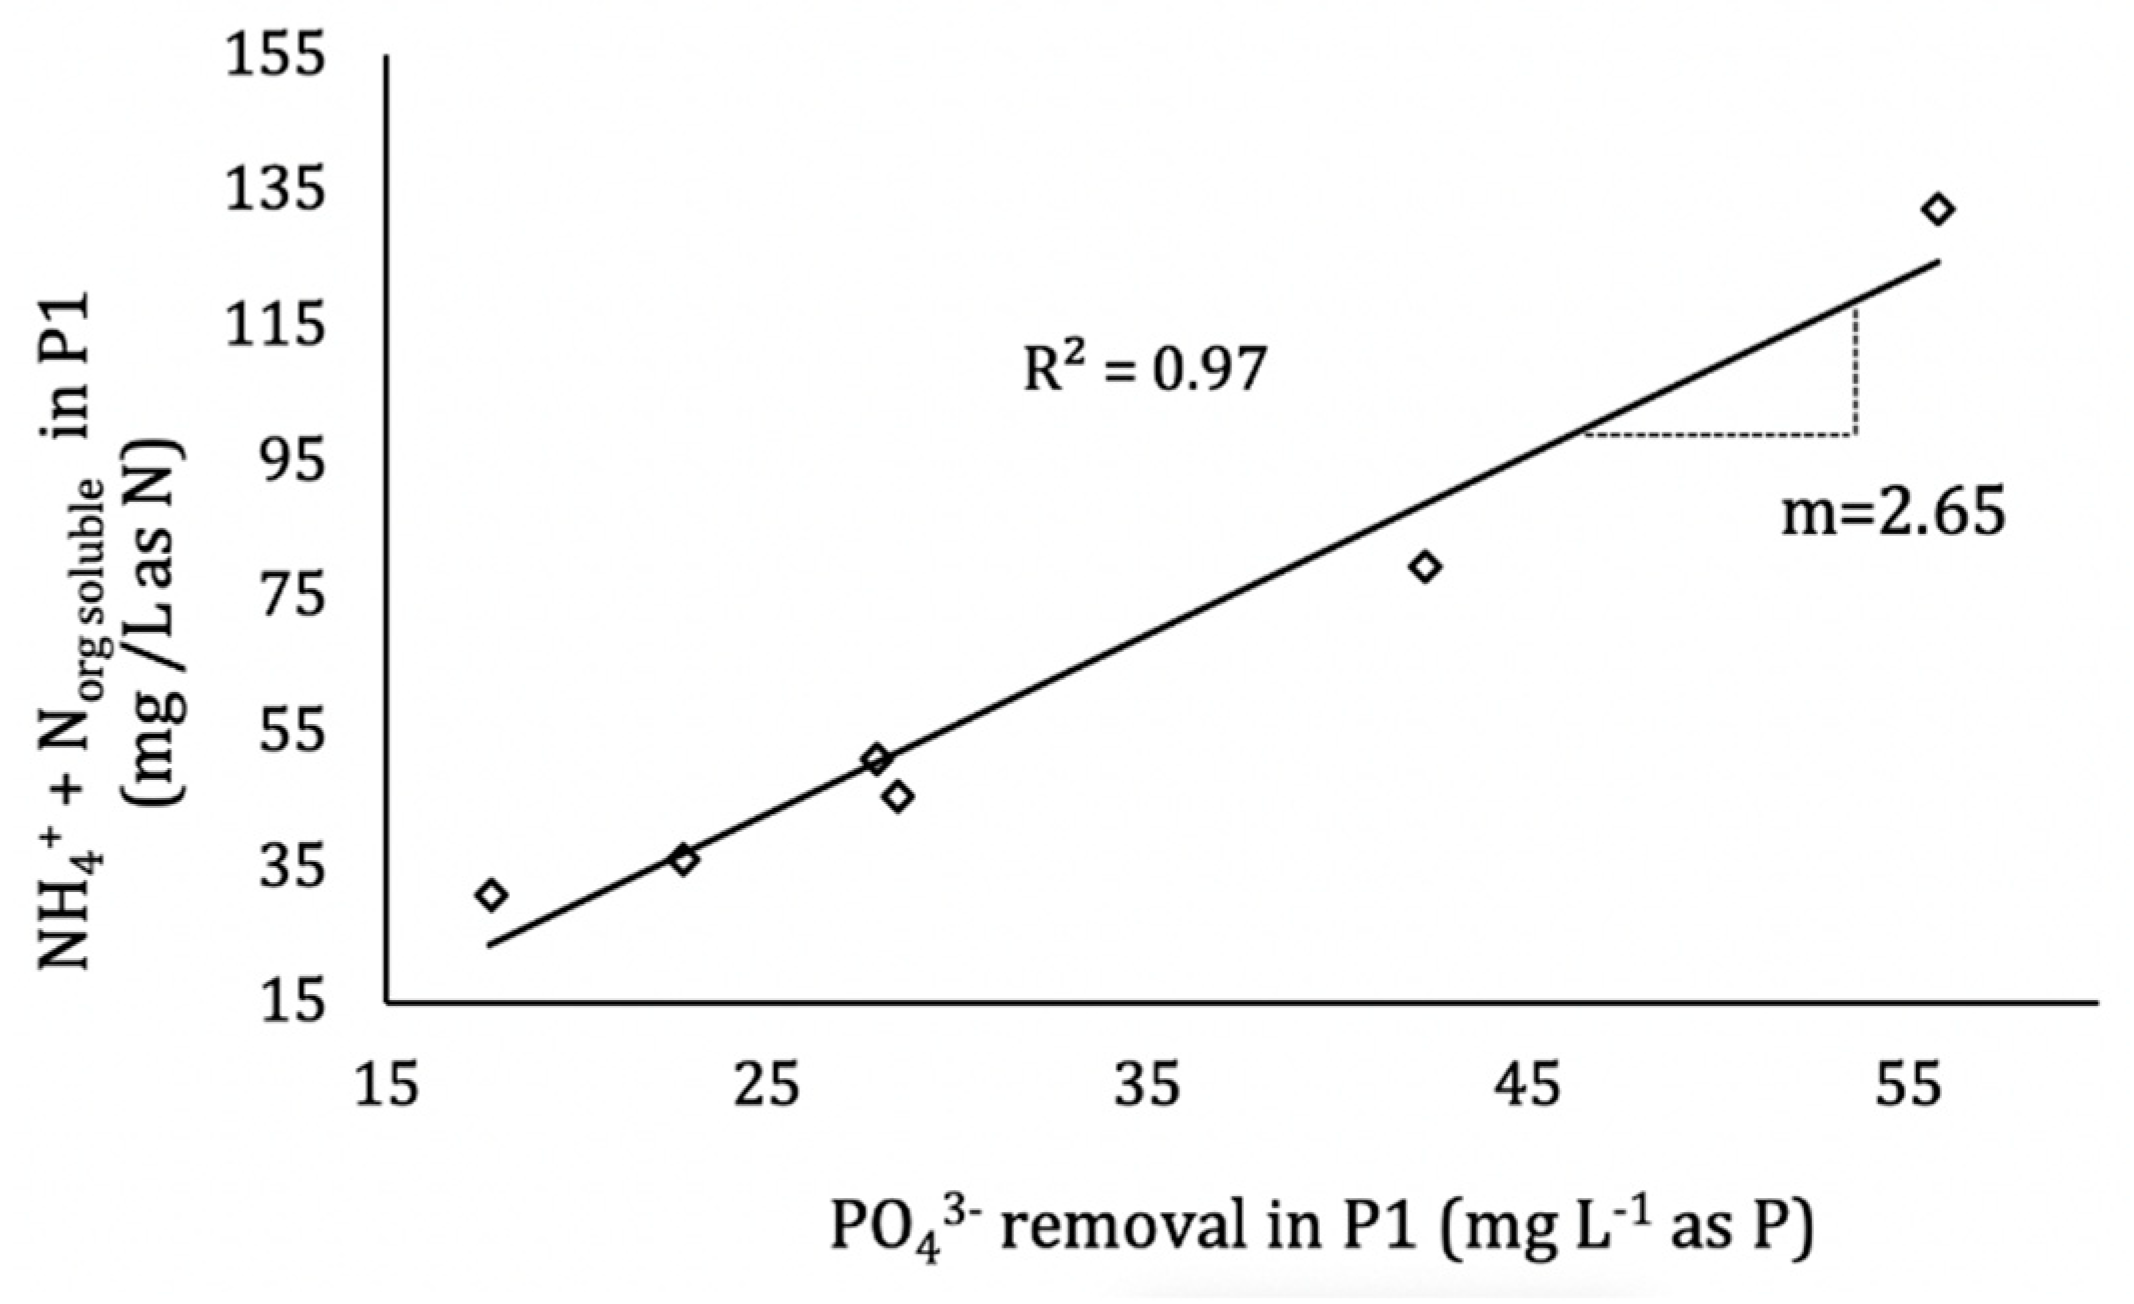
A close correlation between the concentration removal of PO43− and the sum of NH4+ and soluble Norg in P1 was observed (R2 = 0.97) in Figure 4, while this relationship was not evident in W. These observations supported the hypothesis that the most important sink of nutrients in P1, and the overall system, is linked to plant uptake. Many authors have reported an active role of duckweed in the removal of nutrients in stabilization ponds. The N:P ratio in the harvested biomass varies from 2.55:1 to 3.57:1 in duckweed-based treatment applications with livestock wastewater [30,31], or up to 4.31:1 in municipal wastewater applications [32]. This relationship has been shown to vary depending on the concentration of nutrients in the lagoon [33], and, therefore, it is related to the type of water that is being treated. The same authors reported an observed duckweed biomass production of between 18 and 29 g/m2/d on a dry weight basis. In the present study, the N:P ratio in the removal of PO43− and the sum of NH4+ and soluble Norg in P1 was 2.65:1 mg/L (Figure 4) and produced an estimated biomass yield of 33 g/m2/d on a dry weight basis based on a duckweed N content of 6.6% [31]. Considering that the N:P ratio observed in the removal of NH4+ and soluble Norg and PO43− fell within the reported N:P range for duckweed and that the biomass yield estimated in P1 was comparable to values reported in literature, it was likely that the observed soluble nutrient removal in P1 was largely due to plant biomass growth. The correlation supported this hypothesis since it indicated that the removal of both nutrients was subject to a common process and that the performance in the treatment of both P and N responded to the same external factors.
TN removal was lower in W (21%) compared to P1 (53%). Ammonification and nitrification appeared to be the dominant processes taking place, with 1.1 mg/L reduction in soluble Norg, a 13.4 mg/L (38%) reduction in NH4+-N, and a 1.4 mg/L increase in NO3−-N. Average DO concentrations in W varied monthly from 0.8 to 1.7 mg/L with an overall average of 1.3 mg/L (Table 1), which is sufficient for nitrification [28], while anoxic zones were likely present in the sediment. This suggested that although having only one pond in the system could bring important organic matter and nutrient removal, the wetland was key to increasing the oxygen levels in the water and to promoting the transformation of nitrogen species, which improved the overall treatment.
Although there was evidence of nitrification, it was likely that this process could be inhibited by the high concentration of organic material in W influent. The high C/N ratio favored the conditions for heterotrophs (C-removers) to outcompete autotroph nitrifiers, inducing low nutrients removal. The lower TN removal rates of W as compared to P1 could also be linked to the fact that plant uptake did not appear to play a significant role in W due to a lack of commensurate PO43− removal.
3.4. Suspended Solids
The system performed poorly with respect to TSS removal. P1 represented the largest net removal of this constituent in the system, which might be attributed to longer retention times and a layer of duckweed that protected the water from wind action. Generally, wetlands are expected to achieve net solids removal higher than 50% in agricultural contexts [10,34]; however, this study showed the opposite. Resuspension of solids in the water column of W was observed during the last three study periods from 22 August–15 November (Figure 2b). Period 5, which corresponds to the period with the lowest precipitation, coincided with the period of greatest removal of solids in P1 (72.3%), as well as with the greater resuspension of TSS in W (most negative removal, −198%). Disturbing bottom sediments in W during sampling might have been the cause of the elevated TSS concentrations observed. Also, Jia et al. [6] argued that, in most cases, the concentration of TSS in the effluent of a wetland was attributed to biological processes, rather than by the concentration of TSS in the incoming flow. In particular, the solids leaving the system are often generated debris fragments from the accretion by decomposition of leaves and plant material and the resuspension of already settled solids in the wetland as opposed to from solids entering the system.
3.5. First Order Kinetic Rate Constants
The parameters C*, k, and θ recommended in the literature for agricultural runoff were calculated from the average values of wetland applications that treat wastewaters from livestock operations of different types (swine, cattle, dairy, and poultry) and showed a high level of variability, likely based on wastewater source and climate [8,14,25]. P-k-C* model parameters were optimized in this study using the sum of squares as a lack of fit minimization function with results presented in Table 4.
The optimum mean values of C* were within the range recommended by [10], and the 95% confidence intervals were relatively narrow, representing between 5% and 12% of the mean value.
The incorporation of the parameter P accounts for non-ideal flow patterns typical of treatment wetlands. Previous reported k values were calculated, assuming a hydraulic efficiency intermediate between completely mixed and plug flow, approximated by three completely mixed tanks in series for all constituents [10,14]. However, some authors suggest different P-values after studies with tracers or in configurations that minimize short-circuiting and promote plug-flow [6,9]. In this study, the optimized P-value varied from 2 to 2.9 tanks in series.
The calculated θ coefficients indicated that there was a significant effect of temperature on all kinetic constants in W (θ > 1). The value of θ = 1.06 found BOD kinetics contradicts [6], who recommended the value of θ = 1 for the design of domestic wastewater wetlands, suggesting k is not temperature-dependent. However, Knight et al. [10] calculated an average value of θ = 1.03 from the livestock wastewater database, supporting this study’s findings that temperature had an effect on kBOD. The value for NH4+ kinetics of θ = 1.05 was consistent with θ coefficients found in the literature of approximately 1.05 [6,10]. The calculated, optimized values of θ for TP, PO4, and NO3− kinetics did not have much physical sense since the kinetic rates for these three parameters were all very low or negative.
The small (<2% of the mean value) standard deviations of R2 in Table 4 indicated that all parameter solutions within the 95% CI ranges fitted the data very closely. For every constituent, the F-test for statistical lack of fit analysis accepted the null hypothesis, stating that there was no significant lack of fit between the modeled and the observed data. This indicated that the model inadequacy was not significantly greater than the experimental error and, therefore, the model described the observed data.
Table 5 presents a summary of the k values obtained after optimization compared to average values reported in the literature for livestock operations and their corresponding ranges. It should be noted that, as indicated in the table, some of the values reported were based on the C*-k model (Kadlec and Knight, 1996, as cited in [10]), which assumed a P-value close to 3 in the calculations. Although all the constants fell within the wide range of results found in the literature, the TN and TP k20 values were lower than those reported by different authors. This was reflected in very similar W inflow and outflow concentrations, shown in Figure 2, especially for TP. Part of the differences between observed and literature values might be due to factors, such as the wastewater source, the age of the wetlands included in each study, the time horizon used in the calculation of the constants, and operational parameters, such as the configuration of each system and the level of dissolved oxygen (DO) in the water. This last factor was critical when predicting the performance of a wetland in the treatment of different forms of nitrogen, given that their removal was contingent on chain processes that were very sensitive to changes in DO concentration. Constants describing the conversion or removal of different forms of nitrogen between different studies were difficult to compare without consideration for the Redox condition.
The k20 value should not change with time in a given wetland since it is characteristic of each system. However, by using the C*, P, and θ optimized values to recalculate the individual k values from each of the six defined periods, a high variation was observed, reported as the range of variation of the optimized k20 constants in Table 5. This showed that although a unique optimized k20 value could adjust, to some extent, the observed and predicted values of concentration of the W effluent on an annual scale, the k values varied significantly on a monthly scale (approximate length of each period).
No clear evidence of a correlation between k20 and precipitation, flow, retention times, or with input concentrations was found, but similar patterns of change were observed in the concentration of the constituents in P1 and W after rain events with similar intensity, which could explain the variability of k20 observed on a monthly scale.
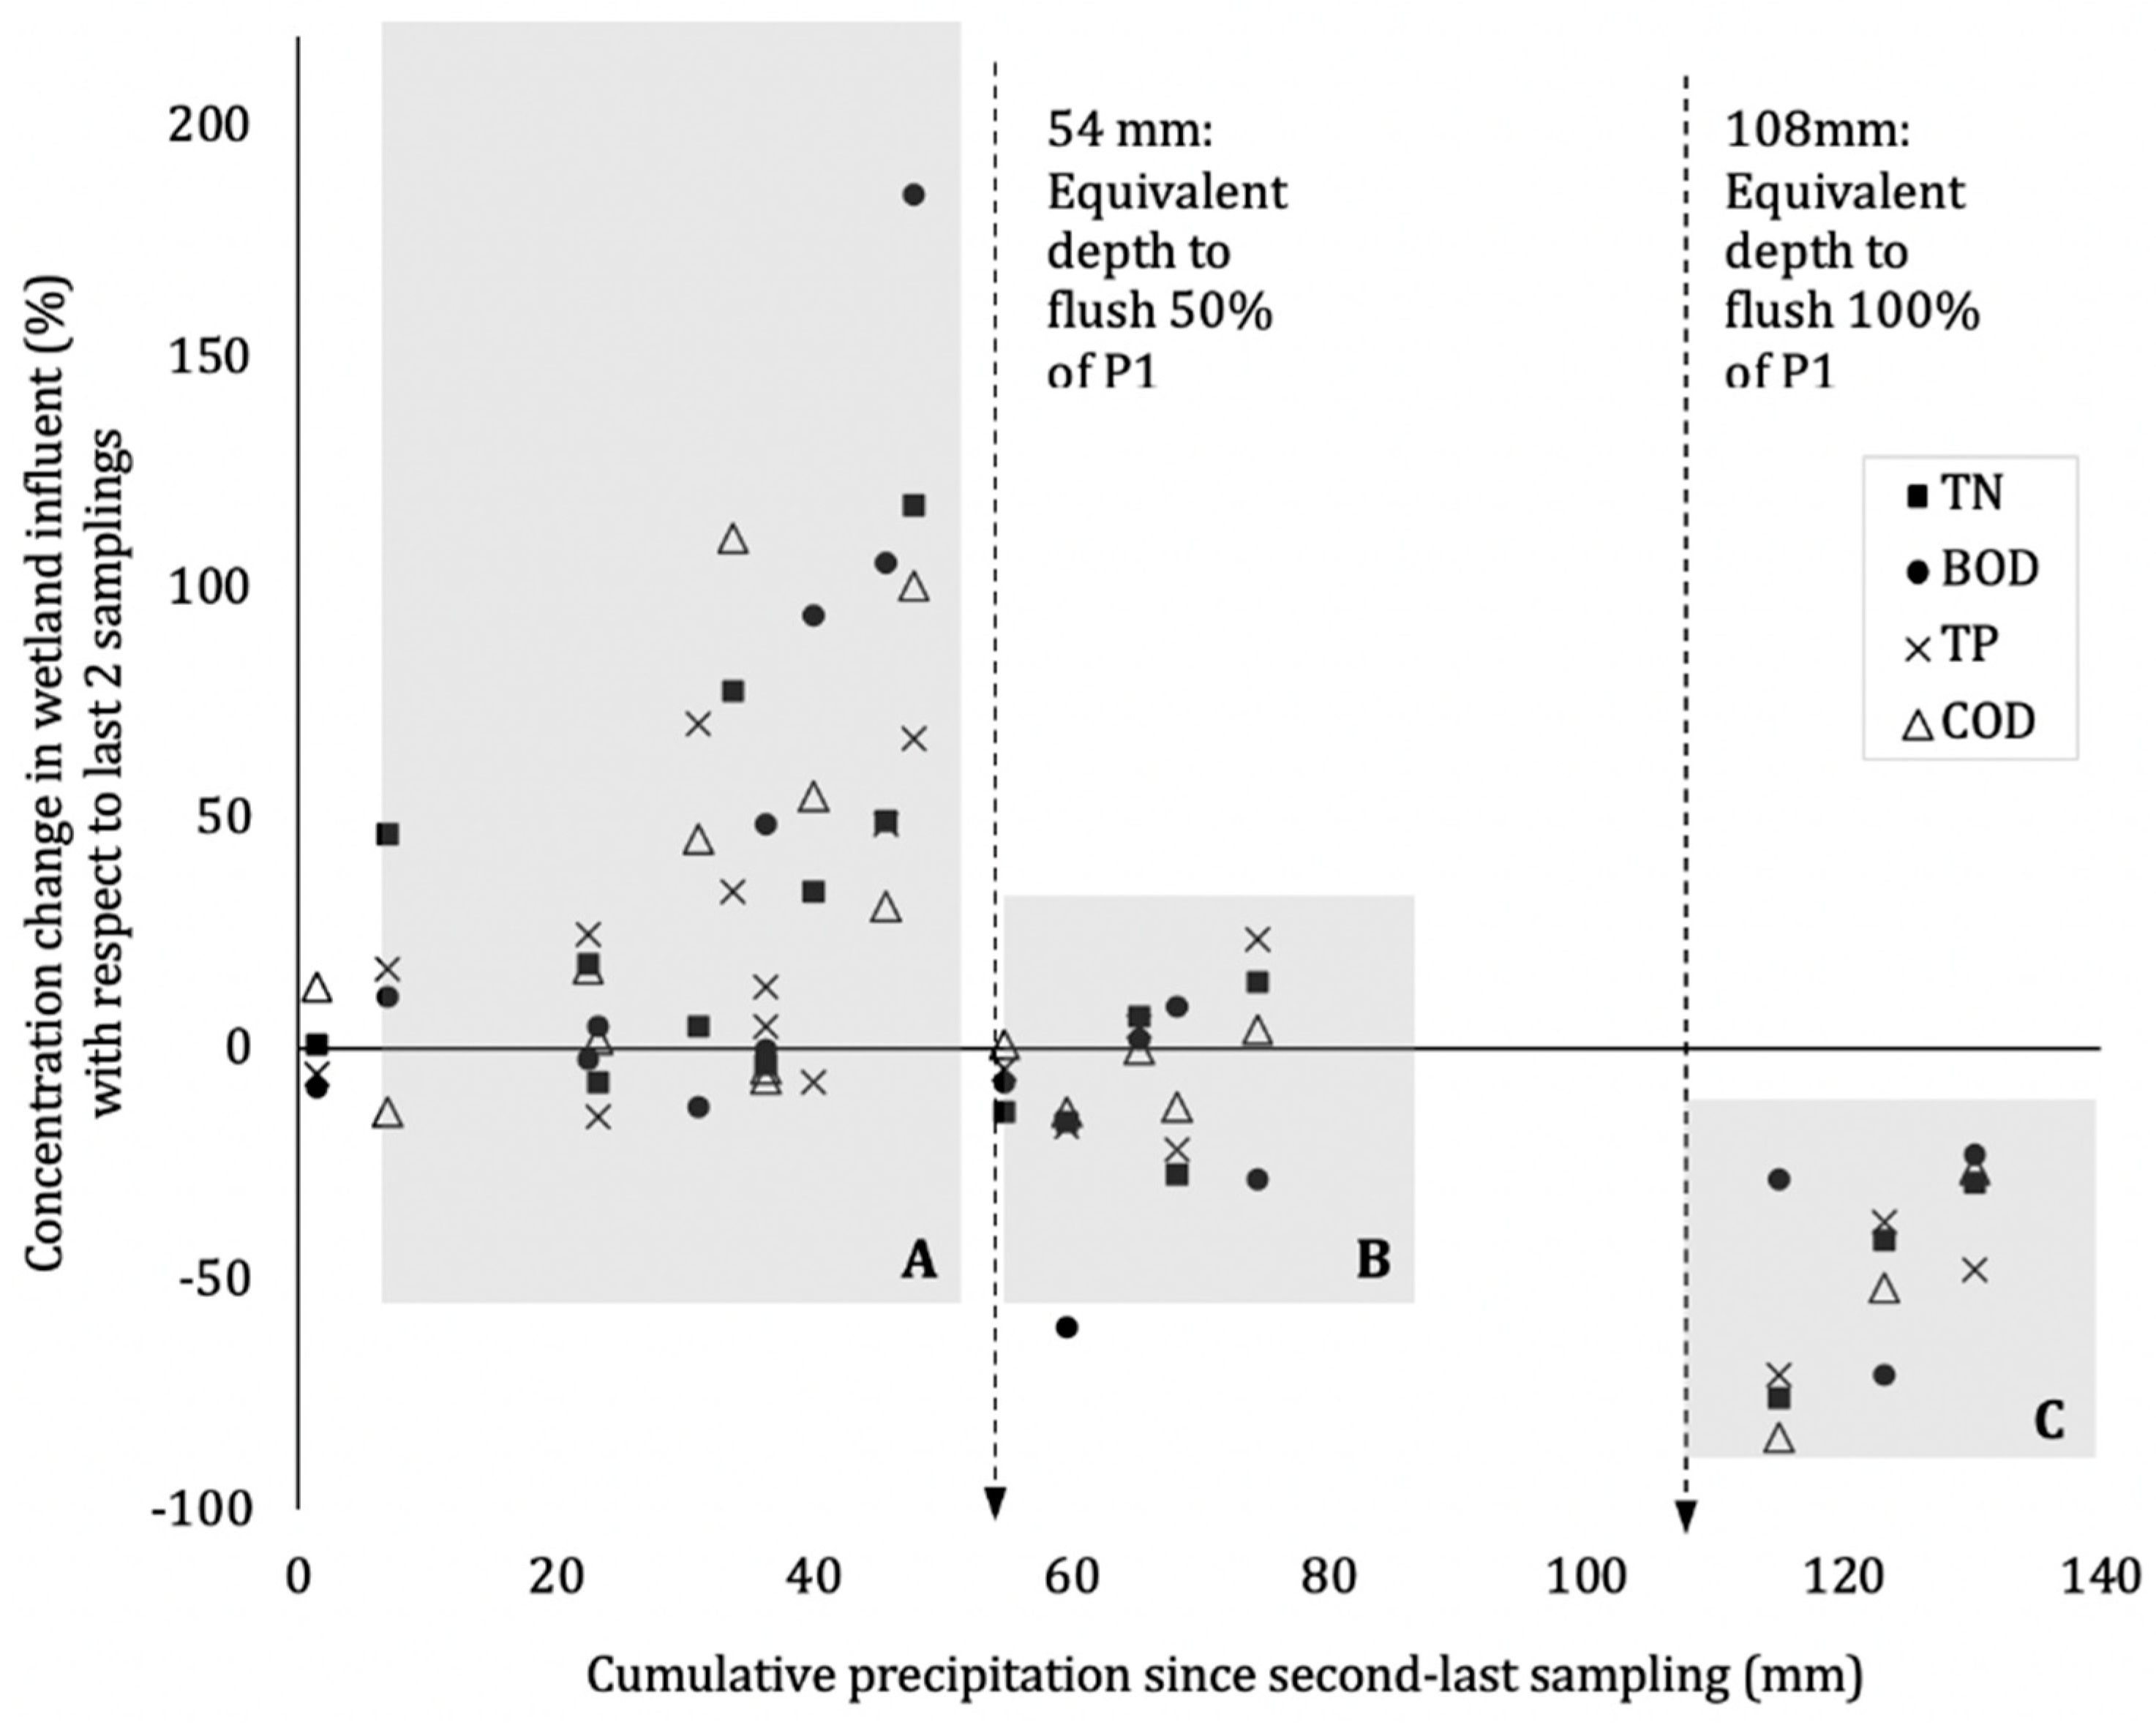
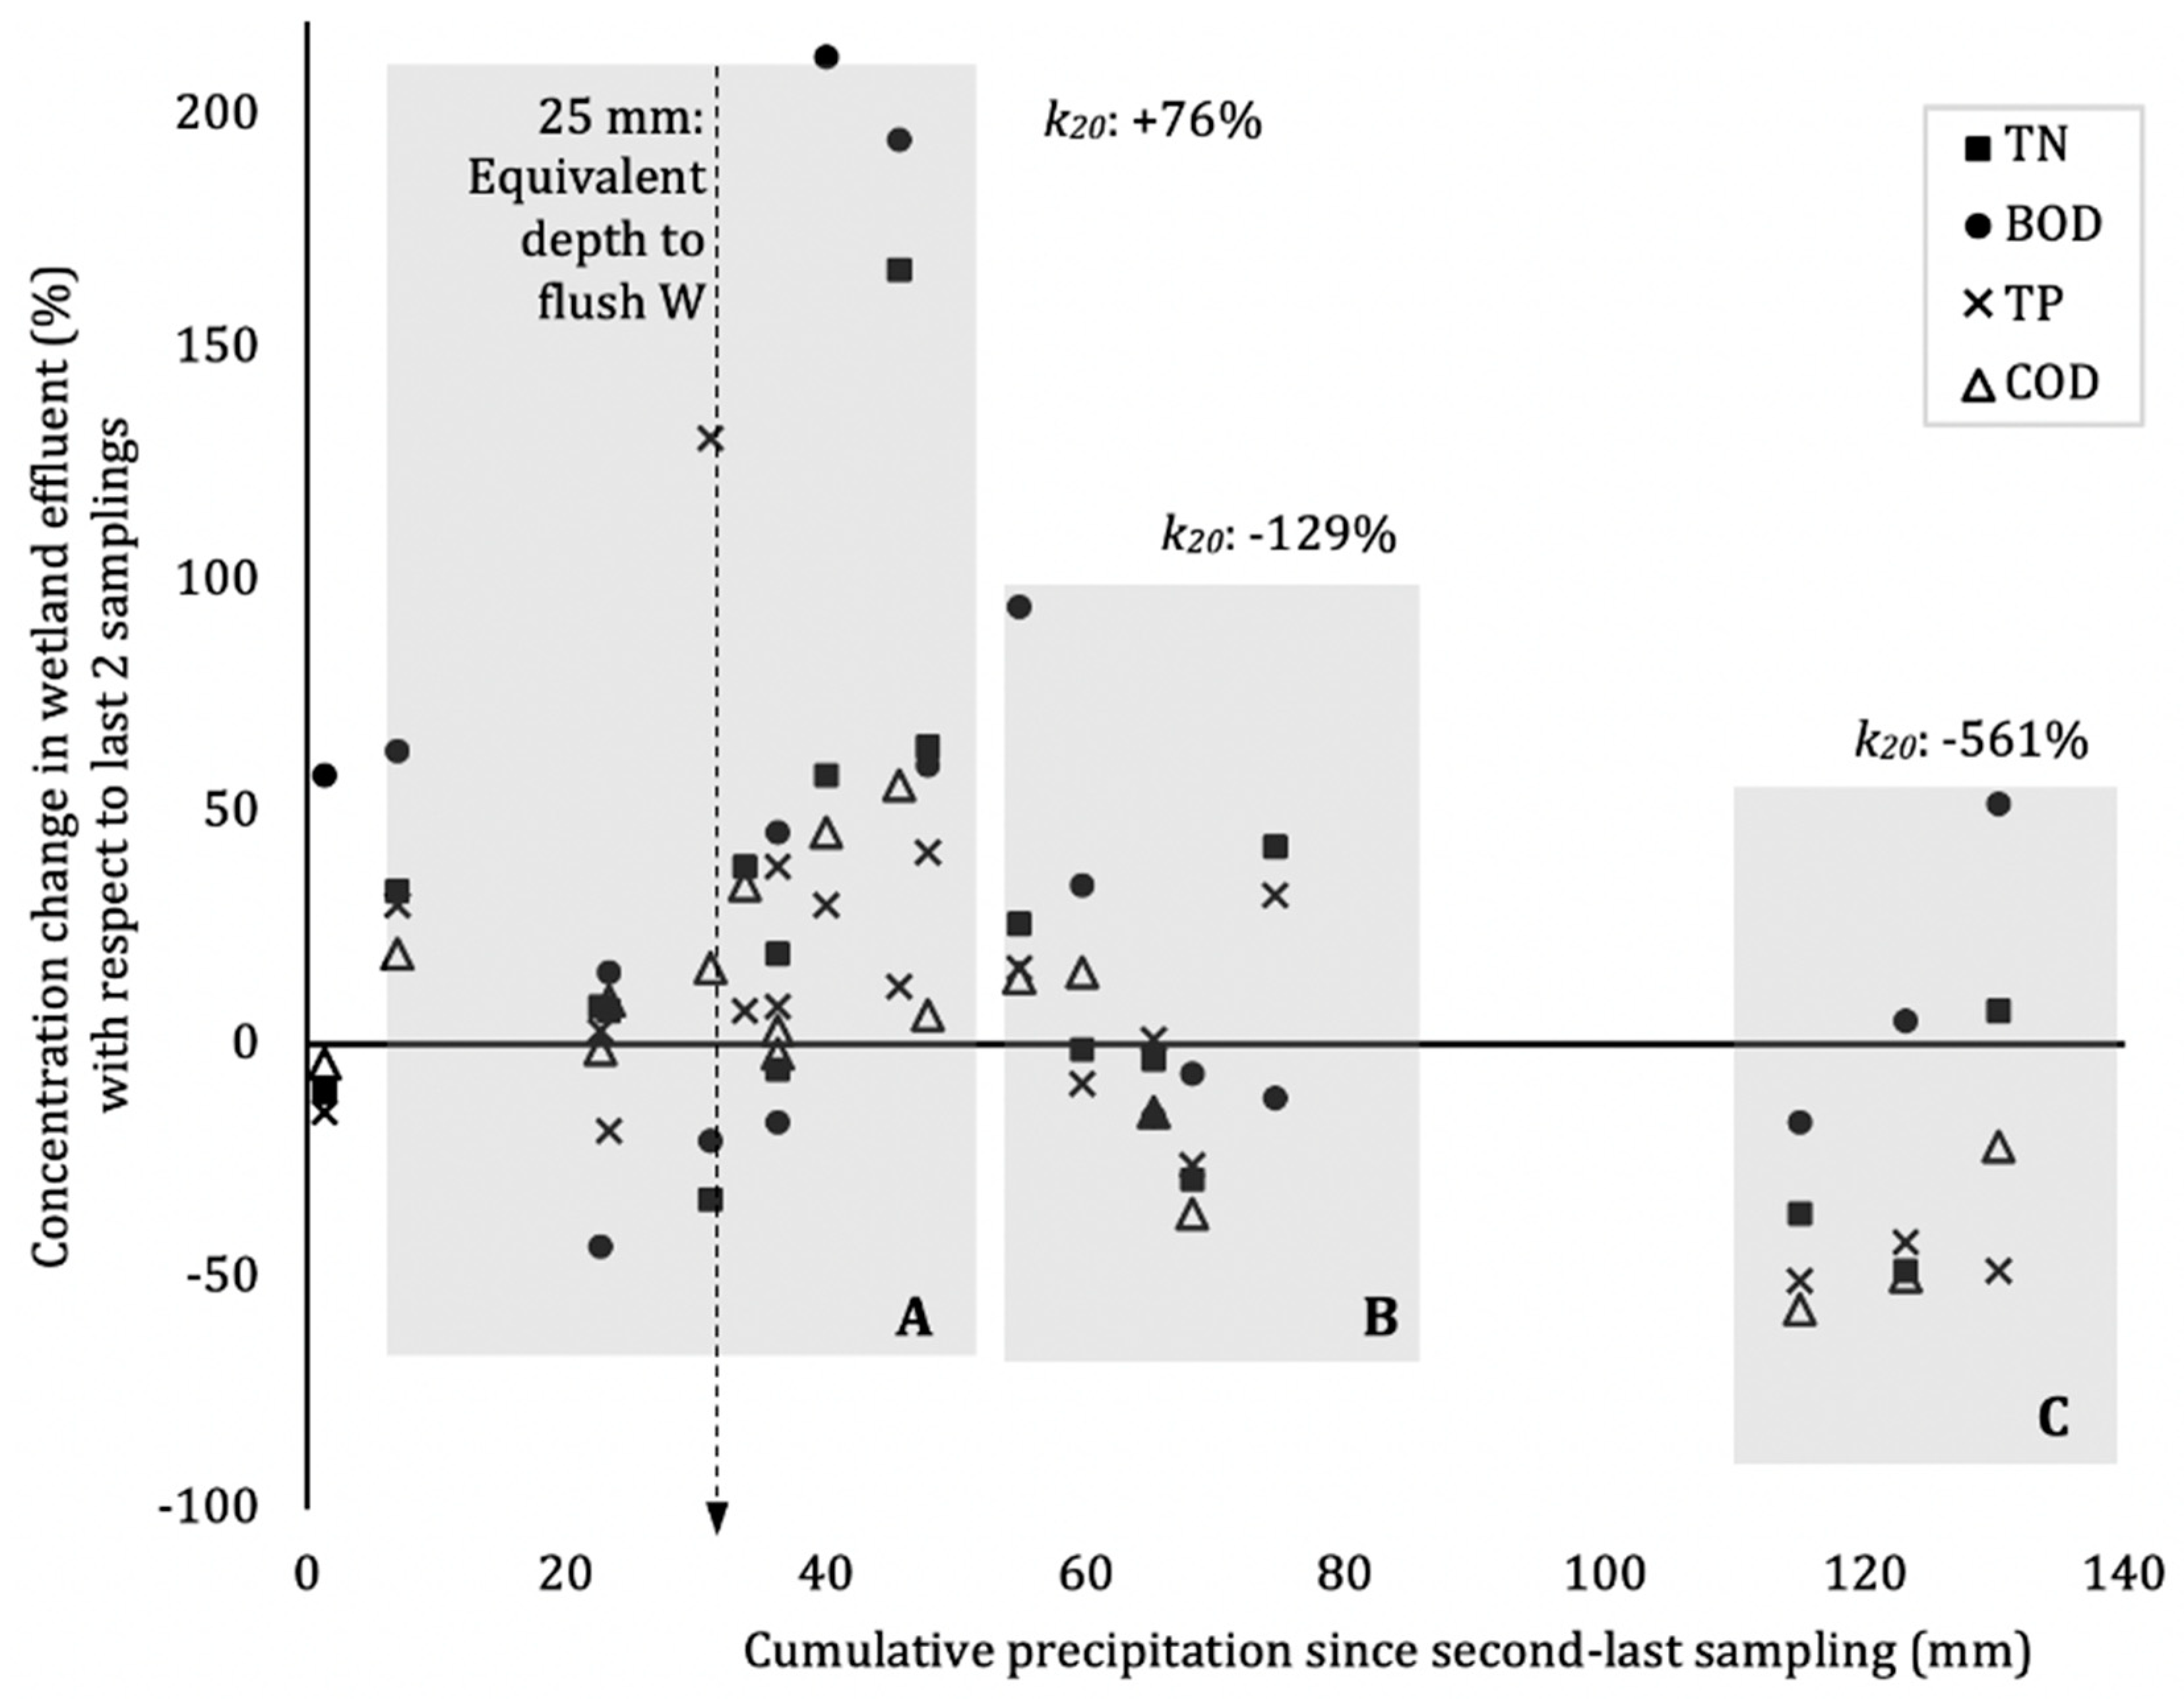
Figure 5 and Figure 6 show the reduction in the concentration of TN, TP, COD, and BOD5 in the wetland influent (i.e., P1) and the wetland effluent (i.e., W) with respect to antecedent rainfall and grouped into thresholds 50% and 100% of the system being flushed. Low cumulative rainfall in the preceding days since the second-last sampling resulted in increased influent concentrations of all constituents with respect to past samples (shaded region A, Figure 5). In contrast, after intense precipitation events or after conditions of high cumulative precipitation, the influent concentrations decreased significantly with respect to past samples (shaded regions B and C, Figure 5). These patterns of concentration change were similar for the wetland effluent (Figure 6). When the volume of recent precipitation events approached or exceeded the volumetric capacity of P1 and W, a displacement of untreated but strongly diluted water towards the end of the system was generated. This resulted in noise in the calculation of W efficiency and kinetics in the treatment of pollutants, given that the k20 values calculated during periods where this occurred were affected by a dilution factor. For a better understanding of the role of the wetland in the net removal of pollutants during these events, it would be necessary to implement sampling frequencies that are linked to the intensity of precipitation events and conduct a separate analysis for each flow event with detailed time-series data.
In a study of the characterization of livestock feedlots, Miner et al. [17] concluded that runoff from low-intensity rainfall was generally more heavily polluted than that from intense rain, given that in these events, the nutrients and organic matter in manure had more time to solubilize in the incoming water [17]. This could explain the large increase in the concentration of all constituents, even two sampling dates, after moderate-intensity rainfall events. After W inlet concentrations increase, the treatment performance might also be compromised, given that there was greater oxygen demand in the system that could affect sensitive processes, such as nitrogen removal. A significant difference between values in regions A, B, and C was observed in both Figure 5 and Figure 6 (p < 0.05).
The k20 values of all the constituents during each of the rainfall events were calculated to better understand how the dilution or concentration of the influent affected the efficiency of the wetland. Figure 6 shows the average change in the k20 value of the plotted constituents during the rain events grouped in each shaded zone. In zone A, which corresponds to a more concentrated influent, there was an average increase of 76% in all the constituent k20 values. On the other hand, when the influent was more diluted, the change in the kinetic rate of the wetland was negative, showing an average reduction of 129% in zone B and 561% in zone C with respect to optimized year-based k20 values reported in Table 4. Changes in k20 values were more pronounced for BOD, COD, and TN, whose removals were dependant on common variables, such as DO.
These changes in k20 values indicated that the kinetics of the wetland were significantly affected by rainfall events, affecting both constituent input concentration and retention time. Therefore, while the P-k-C* model could effectively be used to design event-based systems for average annual performance, the model did not adequately account for individual events. As explained by [6], as loadings increase, pollutant removal mechanisms could change: aerobic processes become less of a probable factor and are replaced by anoxic processes.
The number of factors that can affect the performance of a wetland are too many to be described accurately by only one constant (k). The high range of reported k values in the limited literature reflects the number of operating and external variables, which are not considered in the parameter calculation. It is important to note that values for k, C*, P, and θ optimized from insufficient data sets might lead to unrealistic parameter estimates. Ideal data sets would include a broad range of inlet concentrations and hydraulic loading rates over long enough periods to allow consistent wetland performance, as indicated by stable outflow concentrations [14].
The event-driven nature of the wetland system makes it difficult to determine rate coefficients with precision based on a kinetic model for continuous-flow systems. In periods where precipitation events were far apart, the system might have been functioning as a batch reactor instead of a tank-in-series configuration. This is evident in Figure 2 between September and October, where there was almost no precipitation, and effluent concentrations of NH4+, TN, TP, and COD decreased consistently until, in the case of NH4+, reaching background concentrations. In spite of the above, first-order models are still recommended to describe nutrients and organic matter removal in runoff treatment wetlands over averaged periods of operation [6].
4. Conclusions
The pond-FWS CW system was effective at removing organic matter and nutrients with average removal efficiencies of 67% BOD5, 66% COD, 64% TN, and 45% TP over the 7-month operating season. Observed relationships between nitrogen and phosphorus removal in the pond system suggested that plant uptake, likely through the observed prevalence of duckweed, was a predominant nutrient removal mechanism in the system. The system was shown to be a viable management practice for cattle manure pile and exercise yard runoff treatment in a temperate climate.
P-k-C* model parameters were optimized for the FWS CW. The k20 were: 8.8 m/yr for BOD5, 2.4 m/yr for COD, 0.8 m/yr for PO4−3, 0.5 m/yr for TP, 4.1 m/yr for TN, and 7.3 m/yr for NH4+. The computed Arrhenius temperature correction coefficient applied to the k values were: 1.061 for BOD5, 1.034 for COD and TN, 1.032 for TP, 1.035 for PO43− and NO3−, and 1.050 for NH4+. The model was effective (and adequate) at representing average system performance over the operating season, with all the optimized k constants falling within the ranges reported in the literature from similar applications. However, high variations were observed when the model was applied at a monthly time scale due to the event-based nature of the system.
Short-term k20 values were shown to increase with low-intensity storm events and decrease with medium to high-intensity storm events as precipitation affects both the hydraulics and the input concentrations of the system. The effect of isolated rain events on the performance of the wetland was shown to be contingent on the intensity of the event, former humidity conditions of the feedlot, and the hydraulic capacity of the wetland. More complex multi-parameter models are required to better represent event-driven systems at short time-scales.
Author Contributions
Individual contributions are as follows: conceptualization, C.K. and J.M.-F.; methodology, C.K. and J.M.-F. validation, C.K. and R.D.; formal analysis, J.M.-F.; investigation, J.M.-F.; resources, C.K.; writing—original draft preparation, J.M.-F.; writing—review and editing, C.K., R.D. and J.M.-F.; supervision, C.K. and R.D.; project administration, C.K.; funding acquisition, C.K. All authors have read and agreed to the published version of the manuscript.
Funding
This research was funded by the Ontario Ministry of Agriculture, Food and Rural Affairs New Directions Research Program grant number [SR9272], Farm and Food Care Ontario and Agricultural and Agri-food Canada Water Adaptation, Management and Quality Initiative grant number [WAMQI19] and NSERC Discovery grant number [05753/RGPIN/2018].
Acknowledgments
The authors would like to thank the Pemberton family for their support in constructing and maintaining the system and in providing generous access to their property as well as to the Winchester Agricultural Research Station for providing valuable local meteorological data. The authors express gratitude to the graduate, summer co-operative, and volunteer students in the Environmental Engineering Research Laboratory of the University of Ottawa for contributing to the sample collection and analysis during the project, as well as to Eric Brunet for his technical support.
Conflicts of Interest
The authors declare no conflict of interest. The funders had no role in the design of the study; in the collection, analyses, or interpretation of data; in the writing of the manuscript, or in the decision to publish the results.
References
- U.S. Department of Agriculture (USDA); U.S. Environmental Protection Agency (EPA). Unified National Strategy for Animal Feeding Operations; U.S. Department of Agriculture & U.S. Environmental Protection Agency: Washington, DC, USA, 1999.
- Ministry of Agriculture, Food and Rural Affairs. O. Regulation 267/03—Nutrient Management Act, 2002, S.O. 2002, c. 4; Ministry of Agriculture, Food and Rural Affairs: Guelph, ON, Canada, 2002.
- European Commission. The EU Nitrates Directive 2010 Factsheet; European Union: Brussels, Belgium, 2010. [Google Scholar]
- Pries, J.; McGarry, P. Constructed Wetlands for Feedlot Runoff Treatment in Manitoba. In Proceedings of the WEAO Technical Conference, Toronto, ON, Canada, 1–3 April 2001. [Google Scholar]
- Riemersma, S.L. Appropriate Treatment and Management Options for Beef Feedlot Runoff in Alberta. Master’s Thesis, University of Calgary, Calgary, Alberta, Canada, July 2001. [Google Scholar]
- Kadlec, R.H.; Wallace, S.D. Treatment Wetlands, 2nd ed.; Taylor and Francis Group, LLC: Boca Raton, FL, USA, 2009. [Google Scholar]
- Bosak, V.; VanderZaag, A.; Crolla, A.; Kinsley, C.; Gordon, R. Performance of a constructed wetland and pretreatment system receiving potato farm wash water. Water 2016, 8, 183. [Google Scholar] [CrossRef]
- Jamieson, R.; Gordon, R.; Wheeler, N.; Smith, E.; Stratton, G.; Madani, A. Determination of first order rate constants for wetlands treating livestock wastewater in cold climates. J. Environ. Eng. Sci. 2007, 6, 65–72. [Google Scholar] [CrossRef]
- Beutel, M.W.; Morgan, M.R.; Erlenmeyer, J.J.; Brouillard, E.S. Phosphorus removal in a surface-flow constructed wetland treating agricultural runoff. J. Environ. Qual. 2014, 43, 1071–1080. [Google Scholar] [CrossRef] [PubMed]
- Knight, R.L.; Payne, V.W.E., Jr.; Borer, R.E.; Clarke, R., Jr.; Pries, J.H. Constructed wetlands for livestock wastewater management. Ecol. Eng. 2000, 15, 41–55. [Google Scholar] [CrossRef]
- Hargreaves, G.H. Consumptive use derived from evaporation pan data. J. Irrig. Drain. Div. 1968, 94, 97–105. [Google Scholar]
- Rondon, F.F. Estimation of Irrigation Requirement for Venezuela. Master’s Thesis, Utah State University, Logan, UT, USA, 1972. [Google Scholar]
- Panu, U.S.; Nguyen, T. Estimation of Mean Areal Evaporation in Northwestern Ontario. Can. Water Resour. J. 1994, 19, 69–82. [Google Scholar] [CrossRef]
- CH2M HILL & Payne Engineering. Constructed Wetlands for Livestock Wastewater Management, Literature Review, Database, and Research Synthesis; CH2M HILL & Payne Engineering: Gainsville, FL, USA, 1997. [Google Scholar]
- Rozema, E.; VanderZaag, A.; Wood, J.; Drizo, A.; Zheng, Y.; Madani, A.; Gordon, R. Constructed wetlands for agricultural wastewater treatment in northeastern North America: A Review. Water 2016, 8, 173. [Google Scholar] [CrossRef] [Green Version]
- Kozak, A.; Kozak, R.; Staudhammer, C.; Watts, S. Introductory Probability and Statistics: Applications for Forestry and Natural Sciences, 1st ed.; CAB International: London, UK, 2008. [Google Scholar]
- Miner, J.R.; Lipper, R.I.; Fina, L.R.; Funk, J.W. Cattle Feedlot Runoff: Its Nature and Variation. J. Water Pollut. Control Fed. 1966, 38, 1582–1591. [Google Scholar]
- Loehr, R.C. Effluent quality from anaerobic lagoons treating feedlot wastes. J. Water Pollut. Control Fed. 1967, 30, 384–391. [Google Scholar]
- Tian, W.; Li, L.; Liu, F.; Zhang, Z.; Yu, G.; Shen, Q.; Shen, B. Assessment of the maturity and biological parameters of compost produced from dairy manure and rice chaff by excitation—Emission matrix fluorescence spectroscopy. Bioresour. Technol. 2012, 110, 330–337. [Google Scholar] [CrossRef]
- Wei, Z.; Zhang, X.; Wei, Y.; Wen, X.; Shi, J.; Wu, J.; Zhao, Y.; Xi, B. Fractions and biodegradability of dissolved organic matter derived from different composts. Bioresour. Technol. 2014, 161, 179–185. [Google Scholar] [CrossRef] [PubMed]
- Metcalf & Eddy. Wastewater Engineering: Treatment and Reuse, 5th ed.; McGraw-Hill: New York, NY, USA, 2014. [Google Scholar]
- Chen, R.; Nie, Y.; Kato, H.; Wu, J.; Utashiro, T.; Lu, J.; Yue, S.; Jiang, H.; Zhang, L.; Li, Y. Methanogenic degradation of toilet-paper cellulose upon sewage treatment in an anaerobic membrane bioreactor at room temperature. Bioresour. Technol. 2017, 228, 69–76. [Google Scholar] [CrossRef] [PubMed]
- Wang, M.; Zhang, D.Q.; Dong, J.W.; Tan, S.K. Constructed wetlands for wastewater treatment in cold climate—A review. J. Environ. Sci. 2017, 57, 293–311. [Google Scholar] [CrossRef] [PubMed]
- Wang, L.K.; Wang, M.S. Natural Resources and Control Processes, 1st ed.; Springer Nature: Basel, Switzerland, 2016. [Google Scholar] [CrossRef]
- Stone, K.C.; Hunt, P.G.; Szogi, A.A.; Humenik, F.J.; Rice, J.M. Constructed wetland design and performance for swine lagoon wastewater treatment. Society 2002, 45, 723–730. [Google Scholar]
- Tunçsiper, B.; Drizo, A.; Twohig, E. Constructed wetlands as a potential management practice for cold climate dairy effluent treatment—VT, USA. Catena 2015, 135, 184–192. [Google Scholar] [CrossRef]
- Chen, R.; Wang, Y.; Wang, W.; Wei, S.; Jing, Z.; Lin, X. N2O emissions and nitrogen transformation during windrow composting of dairy manure. J. Environ. Manag. 2015, 160, 121–127. [Google Scholar] [CrossRef]
- Stenstrom, M.K.; Poduska, R.A. The effect of dissolved oxygen concentration on nitrification. Water Res. 1980, 14, 643–649. [Google Scholar] [CrossRef]
- Cedergreen, N.; Madsen, T.V. Nitrogen uptake by the floating macrophyte Lemna minor. New Phytol. 2002, 155, 285–292. [Google Scholar] [CrossRef]
- Cheng, J.; Landesman, L.; Bergmann, B.A.; Classen, J.J. Nutrient Removal from Swine Lagoon Liquid by Lemna minor 8627. Trans. ASAE 2002, 45, 1003–1010. [Google Scholar] [CrossRef]
- Mohedano, R.A.; Costa, R.; Tavares, F.; Belli Filho, P. High nutrient removal rate from swine wastes and protein biomass production by full-scale duckweed ponds. Bioresour. Technol. 2012, 112, 98–104. [Google Scholar] [CrossRef] [Green Version]
- Zhao, Y.; Fang, Y.; Jin, Y.; Huang, J.; Bao, H.; Fu, T.; He, Z.; Wang, F.; Zhao, H. Potential of duckweed in the conversion of wastewater nutrients to valuable biomass: A pilot-scale comparison with water hyacinth. Bioresour. Technol. 2014, 163, 82–91. [Google Scholar] [CrossRef] [PubMed]
- Adhikari, U.; Harrigan, T.; Reinhold, D.M. Use of duckweed-based constructed wetlands for nutrient recovery and pollutant reduction from dairy wastewater. Ecol. Eng. 2015, 78, 6–14. [Google Scholar] [CrossRef]
- Cronk, J.K. Constructed wetlands to treat wastewater from dairy and swine operations: A review. Agric. Ecosyst. Environ. 1996, 58, 97–114. [Google Scholar] [CrossRef]
Figure 1.
(a) Plan view of the exercise yard and treatment system (pump chamber, PC; primary treatment pond, P1; free-water surface constructed wetland, W; and settling pond, P2) at the Pemdale farm, Winchester, ON. Google Earth V 7.3.1.4507 imagery (2 September 2016, eye alt 137 m); (b) Picture of the P1 in June; (c) Picture of W in June.

Figure 2.
Daily precipitation, average daily temperature, and wetland inflow (P1) and outflow (W) concentrations along the six selected periods (shaded bands) during the 2017 operating season of the following constituents: (a) total phosphorus (TP), orthophosphate (PO4−3), chemical oxygen demand (COD), biological oxygen demand (BOD5) and (b) total nitrogen (TN), ammonia (NH4+), nitrate (NO3−), total suspended solids (TSS).


Figure 3.
Correlation between COD/BOD5 and temperature in PC over six periods.

Figure 4.
Correlation between concentration removal of PO43− and NH4+ + Norg soluble in P1 for the six study periods during the 2017 operating season.
Figure 4.
Correlation between concentration removal of PO43− and NH4+ + Norg soluble in P1 for the six study periods during the 2017 operating season.

Figure 5.
Change in W influent concentration under different cumulative precipitation scenarios.

Figure 6.
Change in W effluent concentration under different cumulative precipitation scenarios. k20 percent changes are with respect to optimized year-based k20 values reported in Table 4.
Figure 6.
Change in W effluent concentration under different cumulative precipitation scenarios. k20 percent changes are with respect to optimized year-based k20 values reported in Table 4.


Table 1.
Means of dissolved oxygen (DO) concentration, water temperature (T), flow (Q), hydraulic loading rate (HLR), and hydraulic retention time (HRT) for the six monitoring periods in the pond free water surface constructed wetland (FWS CW) system (Pump chamber, PC; primary treatment pond, P1; free-water surface constructed wetland, W).
| Period | DO (mg/L) | T (°C) | Q (m3/d) | HLR (L/m2-d) | HRT (d) | ||||
|---|---|---|---|---|---|---|---|---|---|
| P1 | W | PC and P1 | W | P1 | W | P1 | W | ||
| 1. 05/11–06/12 | 0.2 ± 0.1 | 0.8 ± 0.7 | 18.3 | 4.7 | 4.4 | 42.9 | 42.9 | 23.3 | 7.0 |
| 2. 07/13–07/17 | 0.3 ± 0.3 | 1.4 ± 0.7 | 21.0 | 4.5 | 5.2 | 41.4 | 49.9 | 24.2 | 6.0 |
| 3. 07/18–08/21 | 0.8 ± 0.3 | 1.8 ± 0.8 | 18.9 | 6.1 | 6.7 | 56.3 | 64.6 | 17.8 | 4.6 |
| 4. 08/22–09/26 | 0.7 ± 0.4 | 1.0 ± 0.4 | 15.9 | 0.7 | 1.2 | 6.7 | 12.0 | 149.0 | 25.0 |
| 5. 09/27–10/24 | 0.5 ± 0.2 | 0.9 ± 0.4 | 12.7 | 1.7 | 2.4 | 15.8 | 23.0 | 63.3 | 13.1 |
| 6. 10/25–11/15 | 1.5 ± 1.4 | 1.7 ± 1.3 | 6.9 | 7.1 | 7.9 | 65.5 | 76.6 | 15.3 | 3.9 |
| Mean | 0.7 | 1.3 | 14.8 | 4.1 | 4.6 | 37.4 | 44.1 | 46.1 | 9.6 |
| St. Dev | 0.8 | 0.9 | 5.2 | 2.3 | 2.3 | 20.9 | 22.4 | 48.1 | 7.4 |
Table 2.
Mean concentrations and removal efficiencies for the operating season (May 5 to Nov 15, 2017).
Table 2.
Mean concentrations and removal efficiencies for the operating season (May 5 to Nov 15, 2017).
| Avg. Concentration ± St. Dev. (mg/L) | Removal (%) † | |||||
|---|---|---|---|---|---|---|
| PC | P1 | W | PC-P1 | P1-W | PC-W | |
| BOD5 | 326 ± 322 | 114 ± 78 | 80 ± 61 | 56 | 29 | 67 |
| COD | 3079 ± 1526 | 1196 ± 416 | 970 ± 320 | 58 | 15 | 66 |
| TP | 83.4 ± 39.8 | 47.0 ± 14.7 | 43.3 ± 12.5 | 41 | 6 | 45 |
| PO43-P | 72.1 ± 25.2 | 40.5 ± 10.1 | 39.6 ± 9.8 | 43 | −1 | 43 |
| Porg-P ‡ | 11.3 ± 47.1 | 6.5 ± 17.9 | 3.7 ± 15.9 | 50 | 64 | 73 |
| TN | 145.0 ± 74.0 | 65.1 ± 21.8 | 51.5 ± 20.2 | 53 | 21 | 64 |
| NH4+-N | 72.6 ± 42.8 | 35.2 ± 13.9 | 21.8 ± 14.7 | 46 | 38 | 65 |
| NO3-N | 27.0 ± 14.1 | 11.5 ± 3.6 | 12.9 ± 5.7 | 52 | −20 | 42 |
| Norg-N ‡ | 45.4 ± 86.6 | 18.1 ± 26.1 | 16.2 ± 25.7 | 62 | −3 | 57 |
| TSS | 220 ± 146 | 104 ± 127 | 148 ± 214 | 55 | −62 | 28 |
† Calculated for each period, adopting a lag time to align inlet and outlet samples, and then averaged; ‡ Calculated from mass balance.
Table 3.
COD/BOD5 ratio and N, P particulate/soluble components across treatment system
| COD/BOD5 | TN (mg/L) | TP (mg/L) | |||
|---|---|---|---|---|---|
| Particulate | Soluble | Particulate | Soluble | ||
| PC | 7.6 | 11.1 ± 5.7 | 133.9 ± 68.3 | 14.5 ± 6.9 | 68.9 ± 32.9 |
| P1 | 9.8 | 2.7 ± 0.9 | 62.4 ± 20.9 | 1.9 ± 0.6 | 45.1 ± 14.1 |
| W | 11.6 | 2.0 ± 0.8 | 49.5 ± 19.4 | 0 ± 0 | 43.3 ± 12.5 |
Table 4.
Optimized P-k-C*model parameters and θ coefficients for each water constituent.
| BOD5 | COD | TP | PO43−-P | TN | NH4+-N | NO3–-N | ||
|---|---|---|---|---|---|---|---|---|
| n | 24 | 363 | 126 | 117 | 334 | 186 | 176 | |
| C* (mg/L) | Mean | 8.8 | 125.9 | 2.5 | 2.5 | 10.1 | 1.7 | 0.5 |
| ± 95%CI | 1.1 | 7.3 | 0.3 | 0.3 | 0.6 | 0.1 | 0 | |
| k20 (m/yr) | Mean | 8.73 | 2.42 | 0.79 | 0.45 | 4.07 | 7.28 | −1.00 |
| ± 95%CI | 0.48 | 0.08 | 0.04 | 0.04 | 0.12 | 0.14 | 0.05 | |
| P | Mean | 2.0 | 2.4 | 2.6 | 2.5 | 2.3 | 2.9 | 2.6 |
| ± 95%CI | 0.3 | 0.1 | 0.2 | 0.2 | 0.1 | 0.1 | 0.1 | |
| θ | Mean | 1.061 | 1.034 | 1.032 | 1.035 | 1.034 | 1.050 | 1.035 |
| ± 95%CI | 0.003 | 0.002 | 0.004 | 0.004 | 0.002 | 0.002 | 0.003 | |
| R2 | Mean | 0.93 | 0.60 | 0.91 | 0.88 | 0.69 | 0.91 | 0.81 |
| Std. Dev | 0.01 | 0.02 | 0.02 | 0.01 | 0.02 | 0.01 | 0.02 | |
| F-statistic † | =MSLF/MSPE | 0.34 c | 1.57 a | 0.18 c | 0.33 c | 0.65 a | 0.51 b | 0.47 b |
† Null hypothesis (H0: no significant lack of fit) rejected if ratio between Lack of Fit Mean Square (MSLF) and Pure Error Mean Square (MSPE) is higher than: a F(2, 38, 0.05) = 3.245; b F(2, 37, 0.05) = 3.252; c F(2, 39, 0.05) = 3.238.
Table 5.
Summary of average (and range) of first-order areal kinetic constants, k, (m/yr) for sizing livestock wastewater treatment wetlands.
Table 5.
Summary of average (and range) of first-order areal kinetic constants, k, (m/yr) for sizing livestock wastewater treatment wetlands.
| Type | BOD5 | TP | TN | NH4+-N | NO3-N | |
|---|---|---|---|---|---|---|
| This Study 1 | Cattle | 8.7 (2.3–37.5) a | 0.8 (−3.6–2.75) a | 4.1 (0.5–8.9) a | 7.3 (2.7–17.0) a | −1.0 (−22.3–1.5) a |
| (LWDB, 1997) 2 | All livestock | 22 (7–68) | 8 (2–18) | 14 (5–32) | 10 (−1–26) | |
| (Stone et al., 2002) 2 | Swine | 1.79 | 8.76 | 9.19 | ||
| (Jamieson et al., 2007) | Dairy | 7.0 (0.64–38.7) | 1.6 (−10.2–5.8) | 4.3 (−0.3–17.2) | −0.2 (−15.1–4.3) | |
| (Rozema et al., 2016) 2 | Dairy, abattoir | 6 (0.2–24.1) | 2.9 (−1.3–15.2) | 3.3 (−1.1–9.1) | 2.5 (−0.2–9.2) |
a Range from individual period k calculated using optimized C*-P and θ; 1 There is no reference information for kCOD and kPO4, whose averages and ranges in this study were 2.4 (from −3.7 to 9.4) and 0.5 (from −6.3 to 1.31), respectively; 2 Based on the C *-k model.
© 2020 by the authors. Licensee MDPI, Basel, Switzerland. This article is an open access article distributed under the terms and conditions of the Creative Commons Attribution (CC BY) license (http://creativecommons.org/licenses/by/4.0/).
Share and Cite
MDPI and ACS Style
Mejia-Franco, J.; Kinsley, C.; Delatolla, R. Performance and Kinetics of a Pond-Constructed Wetland System Treating Beef Manure Pile and Exercise Yard Runoff in Eastern Ontario. Water 2020, 12, 168. https://doi.org/10.3390/w12010168
AMA Style
Mejia-Franco J, Kinsley C, Delatolla R. Performance and Kinetics of a Pond-Constructed Wetland System Treating Beef Manure Pile and Exercise Yard Runoff in Eastern Ontario. Water. 2020; 12(1):168. https://doi.org/10.3390/w12010168
Chicago/Turabian StyleMejia-Franco, Juliana, Chris Kinsley, and Robert Delatolla. 2020. "Performance and Kinetics of a Pond-Constructed Wetland System Treating Beef Manure Pile and Exercise Yard Runoff in Eastern Ontario" Water 12, no. 1: 168. https://doi.org/10.3390/w12010168
Note that from the first issue of 2016, this journal uses article numbers instead of page numbers. See further details here.