Next Article in Journal
Correction: Surfleet, C., et al. Hydrologic Response of Meadow Restoration the First Year Following Removal of Encroached Conifers. Water 2019, 11, 428
Next Article in Special Issue
Impacts of Tile Drainage on Phosphorus Losses from Edge-of-Field Plots in the Lake Champlain Basin of New York
Previous Article in Journal
A Comprehensive Index for Measuring Water Security in an Urbanizing World: The Case of Pakistan’s Capital
Previous Article in Special Issue
Sources and Mechanisms of Low-Flow River Phosphorus Elevations: A Repeated Synoptic Survey Approach
 
 
Correction published on 28 June 2020, see Water 2020, 12(7), 1859.
Article

Determining the Impact of Riparian Wetlands on Nutrient Cycling, Storage and Export in Permeable Agricultural Catchments

1
School of Geographical Sciences, University of Bristol, Bristol BS8 1SS, UK
2
British Geological Survey, Maclean Building, Wallingford, Oxfordshire OX10 8BB, UK
3
NERC Isotope Geosciences Laboratory, British Geological Survey, Keyworth, Nottingham NG12 5GG, UK
4
Lancaster Environment Centre, Lancaster University, Bailrigg, Lancaster LA1 4YQ, UK
5
School of Energy, Construction and Environment, Coventry University, Priory Street, Coventry CV1 5FB, UK
6
College of Science and Engineering, School of the Environment, Flinders University, P.O. Box 2100, Adelaide SA 5001, Australia
7
Smith School of Enterprise and the Environment, University of Oxford, Oxford OX1 3QY, UK
*
Author to whom correspondence should be addressed.
Water 2020, 12(1), 167; https://doi.org/10.3390/w12010167
Submission received: 22 November 2019 / Revised: 23 December 2019 / Accepted: 25 December 2019 / Published: 6 January 2020

Abstract

:
The impact of riparian wetlands on the cycling, retention and export of nutrients from land to water varies according to local environmental conditions and is poorly resolved in catchment management approaches. To determine the role a specific wetland might play in a catchment mitigation strategy, an alternative approach is needed to the high-frequency and spatially detailed monitoring programme that would otherwise be needed. Here, we present a new approach using a combination of novel and well-established geochemical, geophysical and isotope ratio methods. This combined approach was developed and tested against a 2-year high-resolution sampling programme in a lowland permeable wetland in the Lambourn catchment, UK. The monitoring programme identified multiple pathways and water sources feeding into the wetland, generating large spatial and temporal variations in nutrient cycling, retention and export behaviours within the wetland. This complexity of contributing source areas and biogeochemical functions within the wetland were effectively identified using the new toolkit approach. We propose that this technique could be used to determine the likely net source/sink function of riparian wetlands prior to their incorporation into any catchment management plan, with relatively low resource implications when compared to a full high-frequency nutrient speciation and isotope geochemistry-based monitoring approach.

Graphical Abstract

1. Introduction

As the international scientific literature produced over the past three decades attests, biogeochemical cycling in wetland systems shows a significant degree of inter- and intra-site variability, leading to highly variable rates, patterns and speciation of C, N and P within and from these wetlands to adjacent surface waters [1,2,3,4,5,6,7,8]. Such variability may be related to the geomorphology and specific soil physical, soil organic, chemical and vegetation character of the wetland, the nature and extent of seasonal, short-term and inter-annual wetting-drying cycles, the specific nutrient speciation of inflowing waters, or to anthropic modifications [9,10,11,12,13,14]. In permeable catchments, there is added complexity in terms of vertical and lateral nutrient exchange with adjacent surface waters and groundwater via the hyporheic zone [4,5,15,16]. Whilst riparian wetlands have been shown to act as biogeochemical cycling hotspots, with the potential to transform and attenuate the nutrient and geochemistry signal from the catchment as it moves from land to water [1,3,17,18,19], the efficacy of this function in real terms is controlled by the specific distribution of functional zones or biogeochemical cycling hotspots within the wetland. These in turn are controlled by the chemical character and distribution of contributing source areas of flow to the wetland between and within a water year, flow routing through the wetland, the residence time of water within the wetland and contact or exposure time between the microbial community and the nutrient parcel transitioning through the wetland; while soil organic carbon content and dissolved organic matter in porewaters acts as an energy resource to support denitrification, with redox status varying laterally, vertically and over time [7,11,20,21]. Reported denitrification rates vary widely within and between riparian wetlands, and over time, with annual rates reported to vary from <3 kg N ha−1 to >500 kg N ha−1 in denitrification hotspots in wet meadow systems, and <4 kg N ha−1 to >65 kg N ha−1 in riparian forests [22].
A wide range of papers have been published on wetland biogeochemistry, demonstrating what often appear to be conflicting behaviours in systems within apparently similar hydrogeological and climatic zones. However, these conflicts are largely attributable to within and between site variability in the size and hydrological connectivity of the major biogeochemical functional zones within the wetlands, differences in the range of variables determined in each programme, and the differences in the frequency of sample collection in both space and time. All too often, a low-resolution sampling programme is implemented, with sampling of wetland soil water at relatively few sites and depths, and for a limited range of nutrient species, due to resource constraints or to the need to employ less invasive sampling techniques in an ecologically sensitive environment. The resulting data are often misleading, suggesting for example, that functions such as denitrification can account for nitrate ‘loss’ across large wetland tracts without ever accounting for the spatial variability in the distribution of that function in the subsurface zone, or over time in response to hydrological flushing events. Meanwhile the catchment management literature often contains gross assumptions regarding the potential rates of nutrient ‘removal’, ‘attenuation’ or ‘loss’ achievable in both natural and constructed wetlands and buffer strips. Nutrient cycling and transformation, temporary storage within the soil matrix, plant and microbial communities of the wetland, and subsequent export of organic nutrient forms to adjacent waters under high flow conditions are all too often missed as alternative causes of the observed patterns. Reported rates of nutrient ‘removal’ following the installation of riparian wetlands or ‘buffer strips’ are then erroneously low for catchment managers [8], or highly variable over the hydrological year [15]. Where a high frequency sampling programme has been undertaken which adopts an holistic approach to assessing C, N and P cycling and flux [23,24,25], very often different conclusions are drawn, and the capacity of wetlands to attenuate nutrient flux from catchment sources, to transform inorganic nutrient influx to organic nutrient forms stored within the wetland, and to export accumulated dissolved organic nutrient stores during flushing events becomes apparent [5,23,26,27,28]. The best environmental policy is underpinned by sound and holistic science, but the resources required to undertake such holistic assessment are significant and often prohibitive even for single-site investigations. An alternative approach is required that can identify the likely distribution of functional zones across large and/or multiple wetland systems without the need to undertake costly, invasive and time-consuming high resolution spatial and temporal monitoring. Here we present such an approach, building on the HydroGeoMorphic UNIT (HGMU) classification of wetlands [29], using a novel toolkit of geophysical, geochemical and natural abundance isotopic methods to identify the distribution of functional zones in complex permeable riparian wetlands and determine their likely impact on nutrient transport, transformation and export to adjacent waters [30,31,32,33]. This recognises the need to understand the subsurface structure and hydrological function within wetlands, given their potentially significant impact on the hydrological and biogeochemical behaviour of catchments, as well as their effects on the wetland habitat itself, and to derive an understanding of where water comes from, how it affects soil redox status and how long it is in contact with the wetland plant and microbial communities.
This approach was developed as part of the project on Hydrogeochemical Functioning of Lowland Permeable Catchments funded from 2002–2005 under the United Kingdom Natural Environment Research Centre (NERC) Lowland Catchment Research (LOCAR) programme [34,35]. The research was undertaken on an instrumented riparian wetland adjacent to the River Lambourn with the aim of identifying the role of these wetlands in modifying the nutrient chemistry of waters draining to the Lambourn from its catchment. The wetland had been the subject of a previous investigation into total nitrogen (N) and total phosphorus (P) cycling dynamics in the wetland soil water and the adjacent river reach [5]. Key findings from the earlier work on this wetland indicated that:
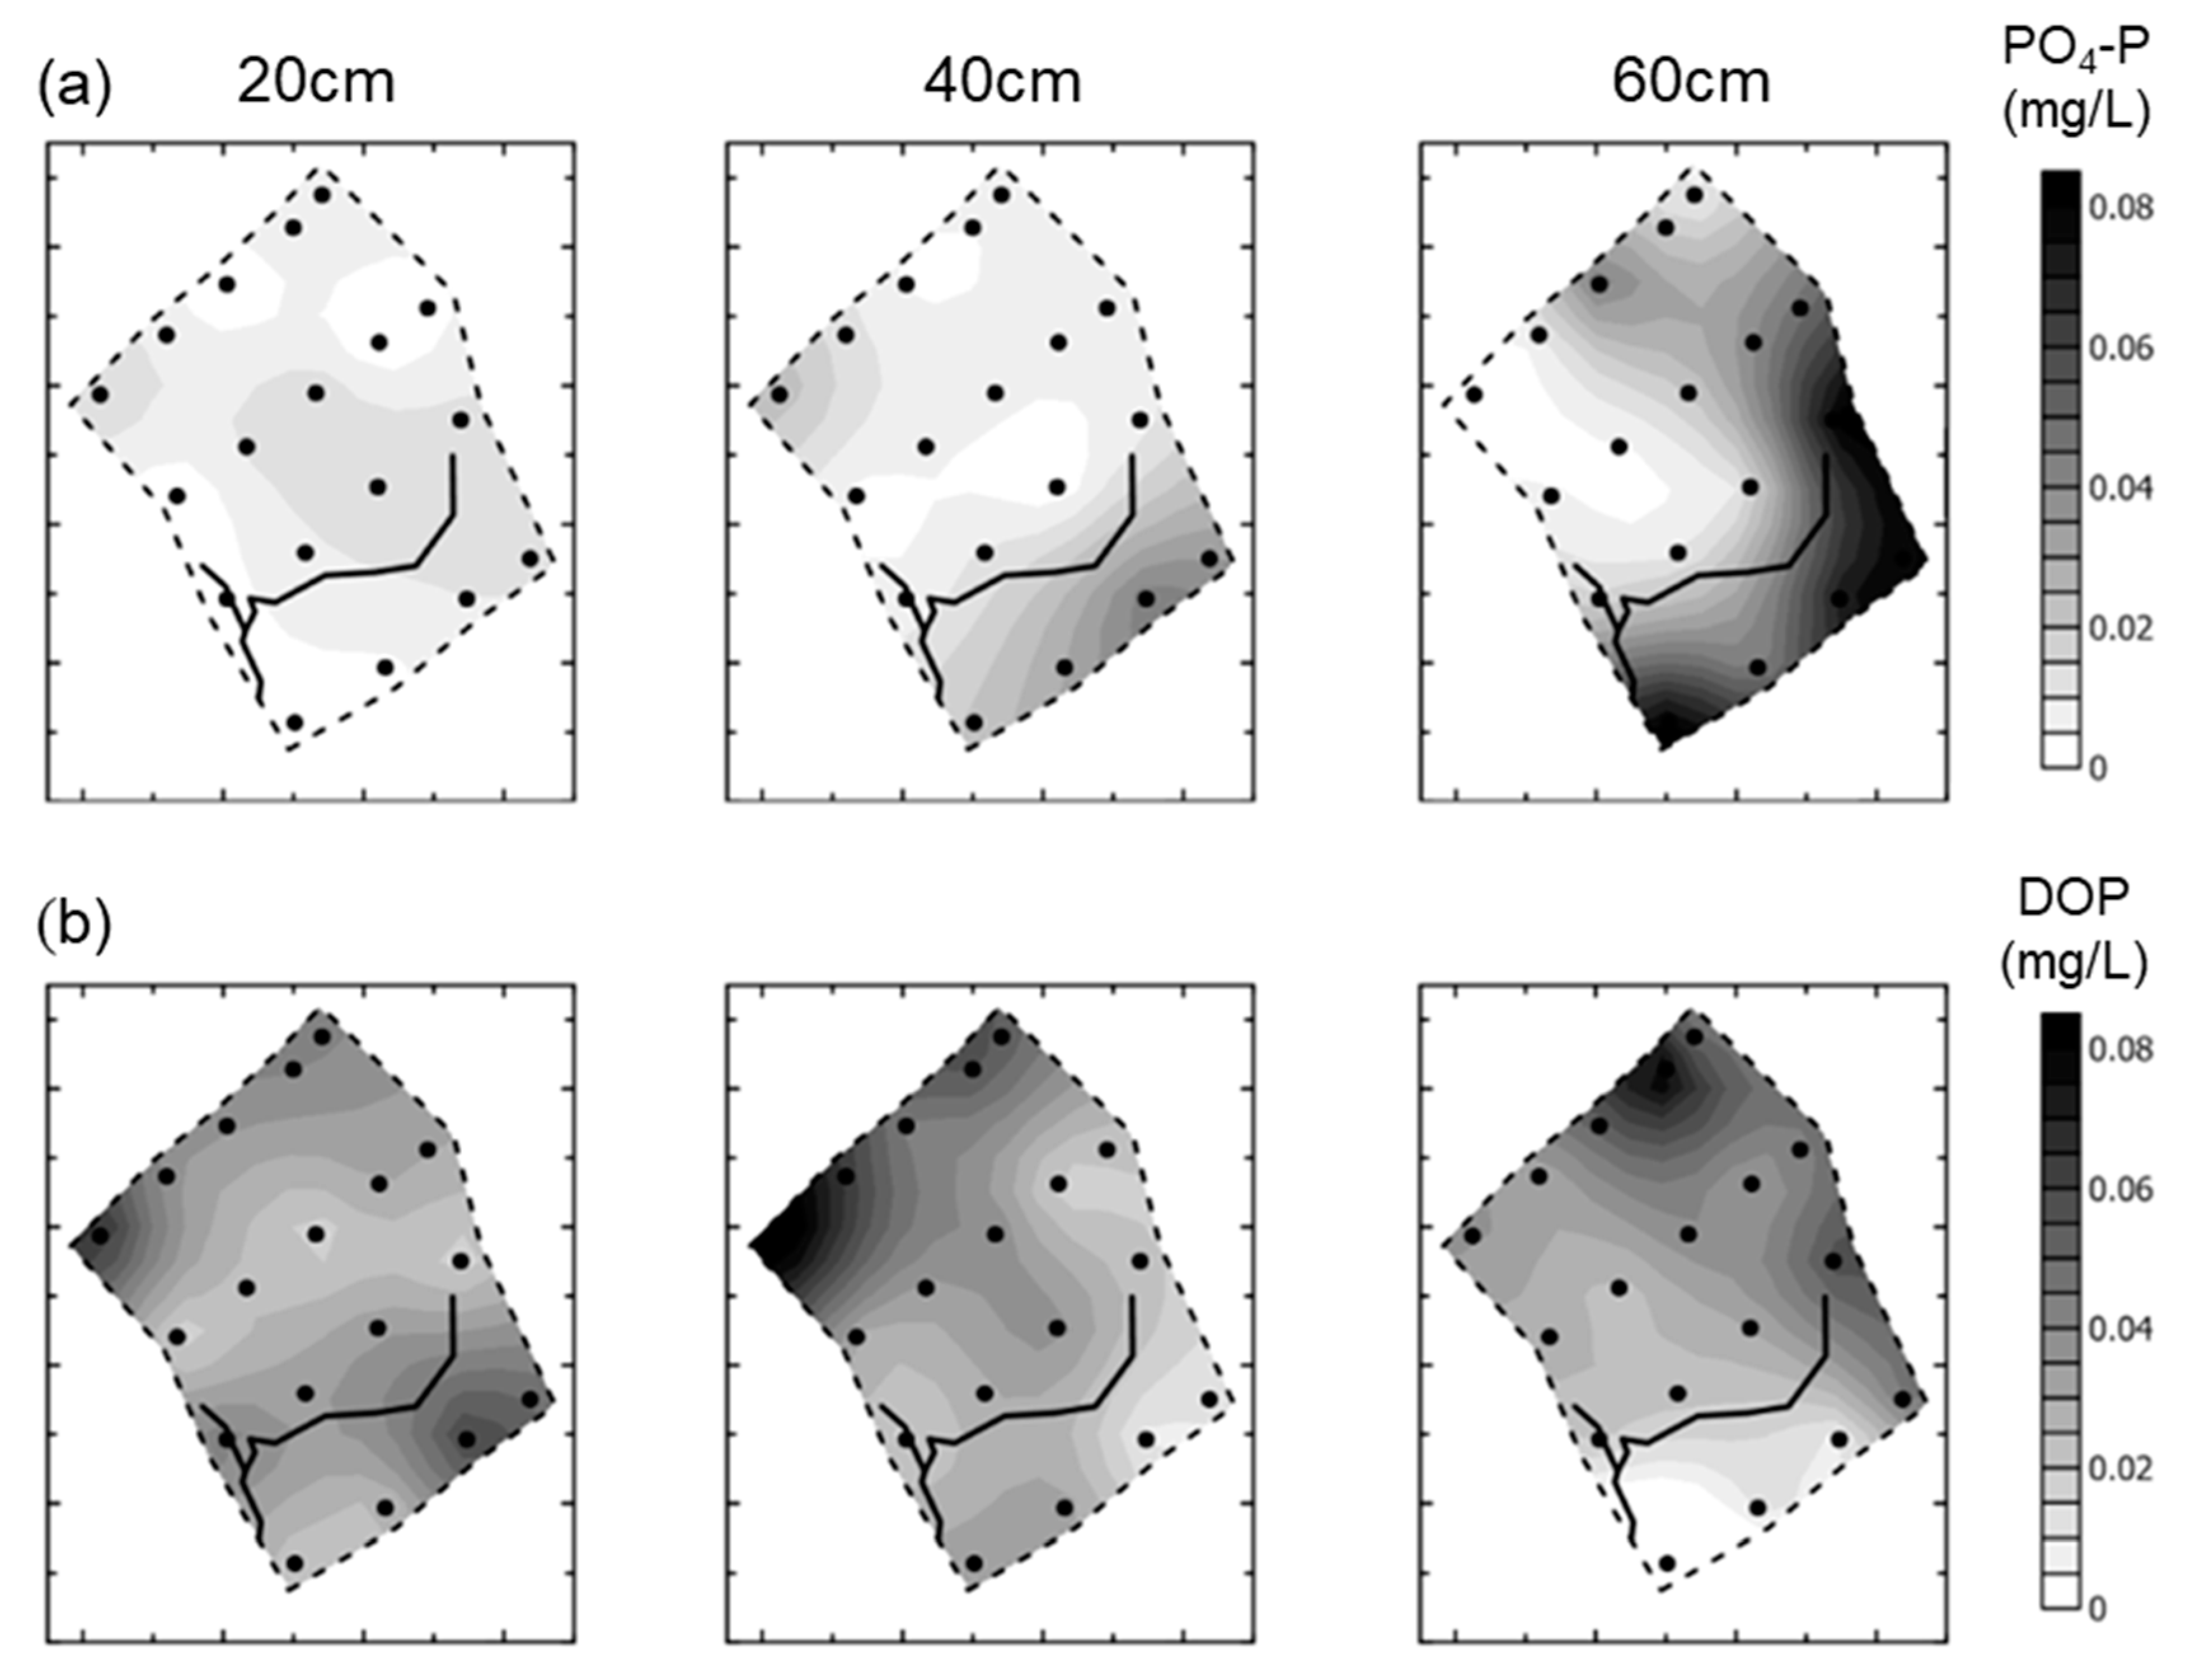
  • Wetlands in these permeable catchments act as a sink for N and P under baseflow conditions, with high concentrations of dissolved organic N (DON) and P (DOP) accumulated in soil porewaters following plant assimilation of nitrate (NO3-N) and orthophosphate (PO4-P), plant dieback and microbial decomposition of dead organic matter.
  • The wetland acts as a nutrient source under high flow conditions, with nutrient-rich porewater exported to the adjacent River Lambourn, predominantly in the form of DON and DOP.
  • Wet-warm periods, with associated changes in soil redox status provide the optimum conditions for gaseous N flux from the wetland via denitrification, and for the desorption of P from the soil matrix and its subsequent flux in aqueous form to the adjacent River Lambourn.
  • The wetland source/sink function varies both from baseflow to high flow conditions, and also from wet year to dry year, with greater rates of nutrient export to the adjacent Lambourn in wetter years, and greater retention of both N and P in the soil porewaters in drier years.
Further work on P and sediment transport and transformations undertaken on the adjacent reach provides additional context for the interpretation of P cycling trends in the current study [36,37,38]. Allied projects funded under LOCAR on the Lambourn and its catchment provide further detailed understanding for this project to draw upon on the biogeochemical process controls on nutrient exchange between groundwater, surface water and the hyporheic zone upstream from the Boxford wetland [31,39], on streamflow generation and surface water-groundwater interactions along the length of the Lambourn [40,41] and the specific role of alluvial deposits in the Lambourn valley wetlands on groundwater–surface water exchange processes [42], and on process controls on nutrient exchange between surface and subsurface zones in the adjacent reach of the Lambourn [43,44,45].
The limitation of this earlier work, however, was that the proportion of catchment flow routed through the wetland and the specific spatial origins of the water in the wetland at any point in time were not known. The latter might comprise any, or a combination, of diffuse flow into the wetland from adjacent hillslopes, road runoff, diffuse influx from groundwater recharge through the valley gravels underlying the wetland, or influx of water from the adjacent river. The dominant hydraulic gradient and thus the source of wetland soil porewaters is likely to vary both in time and space, altering the rate and origins of nutrient influx to the wetland, and the contact time between the wetland plant and microbial communities and the nutrient load in transit which has been reported in previous studies to be a key control on processes such as soil redox and ultimately denitrification in wetland soils [11,20]. This in turn would influence the speciation of the nutrient load as it moves through the wetland.
In this programme, therefore, we adopted a 3-step approach to determine:
  • the sub-surface structure, hydrological connectivity and function of the wetland using geophysical mapping and geochemical ratio techniques to identify the likely origins and residence times of waters within the wetland soil matrix as these varied in space and time. In combination these would allow identification of the potential location of biogeochemical cycling hotspots within the wetland.
  • the nutrient cycling, retention and export behaviour in the wetland using a high temporal and spatial resolution sampling and analysis programme for all N species and P fractions flushed to and through the wetland and out to the adjacent aquifer and river, including the use of isotope ratios to discover direct evidence of the rates and locations of denitrification hotspots in the wetland. From this, we could then determine:
    • the biogeochemical cycling hotspots within the wetland;
    • the extent to which inorganic N and P ‘loss’ could be accounted for via denitrification, biotic uptake, and degradation of dead organic matter leading to the accumulation and subsequent flushing of dissolved organic nutrient fractions within soil porewaters; and
    • the whole system nutrient attenuation behaviour and capacity of natural riparian wetlands in intensively farmed permeable catchments.
  • Whether an alternative, lighter touch approach could effectively identify the wetland biogeochemical functional zones and likely wetland nutrient ‘removal’ efficiency by using geochemical, geophysical and natural abundance isotopic techniques, testing the outcomes from this approach against the fine-resolution but more time-consuming identification of these zones achieved in step 2.

2. Materials and Methods

All research was conducted on the Boxford experimental wetland, UK, instrumented with field sampling equipment included porous cup samplers, dipwells and automatic water samplers (see Section 2.1). The methods used included the characterisation of (1) wetland functional zones using vegetation mapping (Section 2.2), (2) subsurface stratigraphy using geophysical survey techniques (Section 2.3), (3) and biogeochemical functional zones using nutrient speciation, major ion geochemistry and isotope geochemistry analytical approaches (Section 2.4).

2.1. Site Description: The Boxford Wetland

The Boxford experimental wetland lies adjacent to the River Lambourn which drains a predominantly chalk catchment with a complex mixture of alluvial silts and gravels overlying the Seaford chalk in the riparian zone [42,46]. The catchment is farmed intensively, with a mixture of sheep grazing on steep scarp slopes and in the river corridor, and intensive arable production on the dip slopes, occupying 90% of the land area in the catchment [37]. Fertiliser application rates to crops and grass vary from 125 kg N ha−1 on arable crops and permanent grassland to 155 kg N ha−1 on temporary (rotational) grassland. P fertiliser applications vary from 10 kg P ha−1 on grassland to 27 kg P ha−1 on cereal crops and over 50 kg P ha−1 on root crops [43].
The relationship of the Boxford wetland to local catchment topography and geology is shown in Figure 1. The wetland lies on the east bank of the River Lambourn just upstream from the village of Boxford, at the base of a major dry valley feature orientated N–S veering NW–SE closer to the river channel. Topographically this feature appears to indicate a downslope gradient for water to drain through the wetland to the River Lambourn. The wetland soils comprise silty alluvium with a high proportion of nodular flint. These are underlain by a flint gravel matrix of varying thickness which is in turn underlain by Seaford chalk. These alluvial gravels occupy a critical zone controlling surface water–groundwater interactions at the study site and provide an important lateral flow pathway for pollutant transport along the river valley corridor and between the wetland and the adjacent river [42]. However, there are areas of discontinuity along the length of the river and, we propose, under the parts of the wetlands in the river corridor, leading to complex flow pathways and domains within the riparian wetlands. These in turn will generate variable hydrologic residence times within the wetlands, impacting on the extent to which nutrient load delivered to these wetlands is in contact with the key biogeochemical cycling process functions in the wetland.
The River Lambourn flows adjacent to the site from NW to SW, with steeper hillslopes to the north and east. Site elevation varies from 1.8 m along the site margins to −0.8 m above local datum, at the base of a proto-stream channel which drains across the site from NE to SW in alignment with the dry valley feature which adjoins the site at point X (see Figure 2). The proto-stream is a dominant feature within the wetland, with intra-site topography trending downslope from the outer margins of the wetland to the proto-stream network to form a surface topographic micro-catchment. Its alignment with the dry valley feature feeding into the upslope margin of the wetland suggests a linked geomorphic origin to both features, and potentially a major flow path through the wetland from land to stream.

2.2. Characterisation of Wetland Functional Zones Using Vegetation Mapping

Plant community species composition varies across wetlands as a function of variations in site hydrology, hydrochemistry, soil character and subsurface stratigraphy where this impacts on the rooting zone. It can be used as a simple indicator of the effective biogeochemical cycling functional zones within the wetland and was, therefore, mapped in this programme to determine the extent to which it reflected observed nutrient cycling function identified in the traditional high resolution sampling and analysis programme implemented across the site under Step 2. Similarly, hydrologic and geomorphic character have been used to classify the major functional zones within wetlands, stemming from the HGMU classification scheme for wetlands [29]. This provides a static classification of the major functional units within a wetland from a structural perspective, and has been widely applied internationally in wetland assessment schemes, though questions remain over whether, as a stand-alone tool, it can reflect the distribution of biogeochemical function at a process scale in wetlands. Therefore, mapping of these variations, and classification using the HGMU and UK National Vegetation Classification (NVC) scheme [47] was undertaken. The site is dominated by sparse stands of Phragmites australis along the NW-S margins of the site adjacent to the River Lambourn, with Phalaris arundinacea, Glyceria maxima and Carex paniculata common in the wetter and lower lying Tall Grass Washlands (NVC G18) close to the proto-stream channel and the adjacent road. To the NW of the site, Tall Herb Fen (NVC M16) is the dominant vegetation community, dominated by Filipendula ulmaria, Glyceria maxima and Urtica dioica.
The HGMU classification effectively separated the higher margins of the site from the agricultural land upslope, the hawthorn and blackthorn scrub which occurs along the higher upslope margins of the wetland, the public footpath running NW to SE across the top of the site, the private fishing bank (mowed grass) running along the western edge of the wetland, and the lower lying land of the wetland proper, but it makes no distinction between the wetter and drier areas of the wetland proper, nor of those areas lying along the proto-stream channel which is the dominant surface flow pathway through the site, where bypass flow is likely to lead to minimal contact between the nutrient load delivered from the catchment and the biological communities of the wetland. The NVC provides a finer level of distinction, separating the higher and drier areas of the wetland to the W of the site from the lower lying areas of the wetland to the S and E, but still does not distinguish the wetter areas along the line of the proto-stream channel as a potentially distinct functional zone.

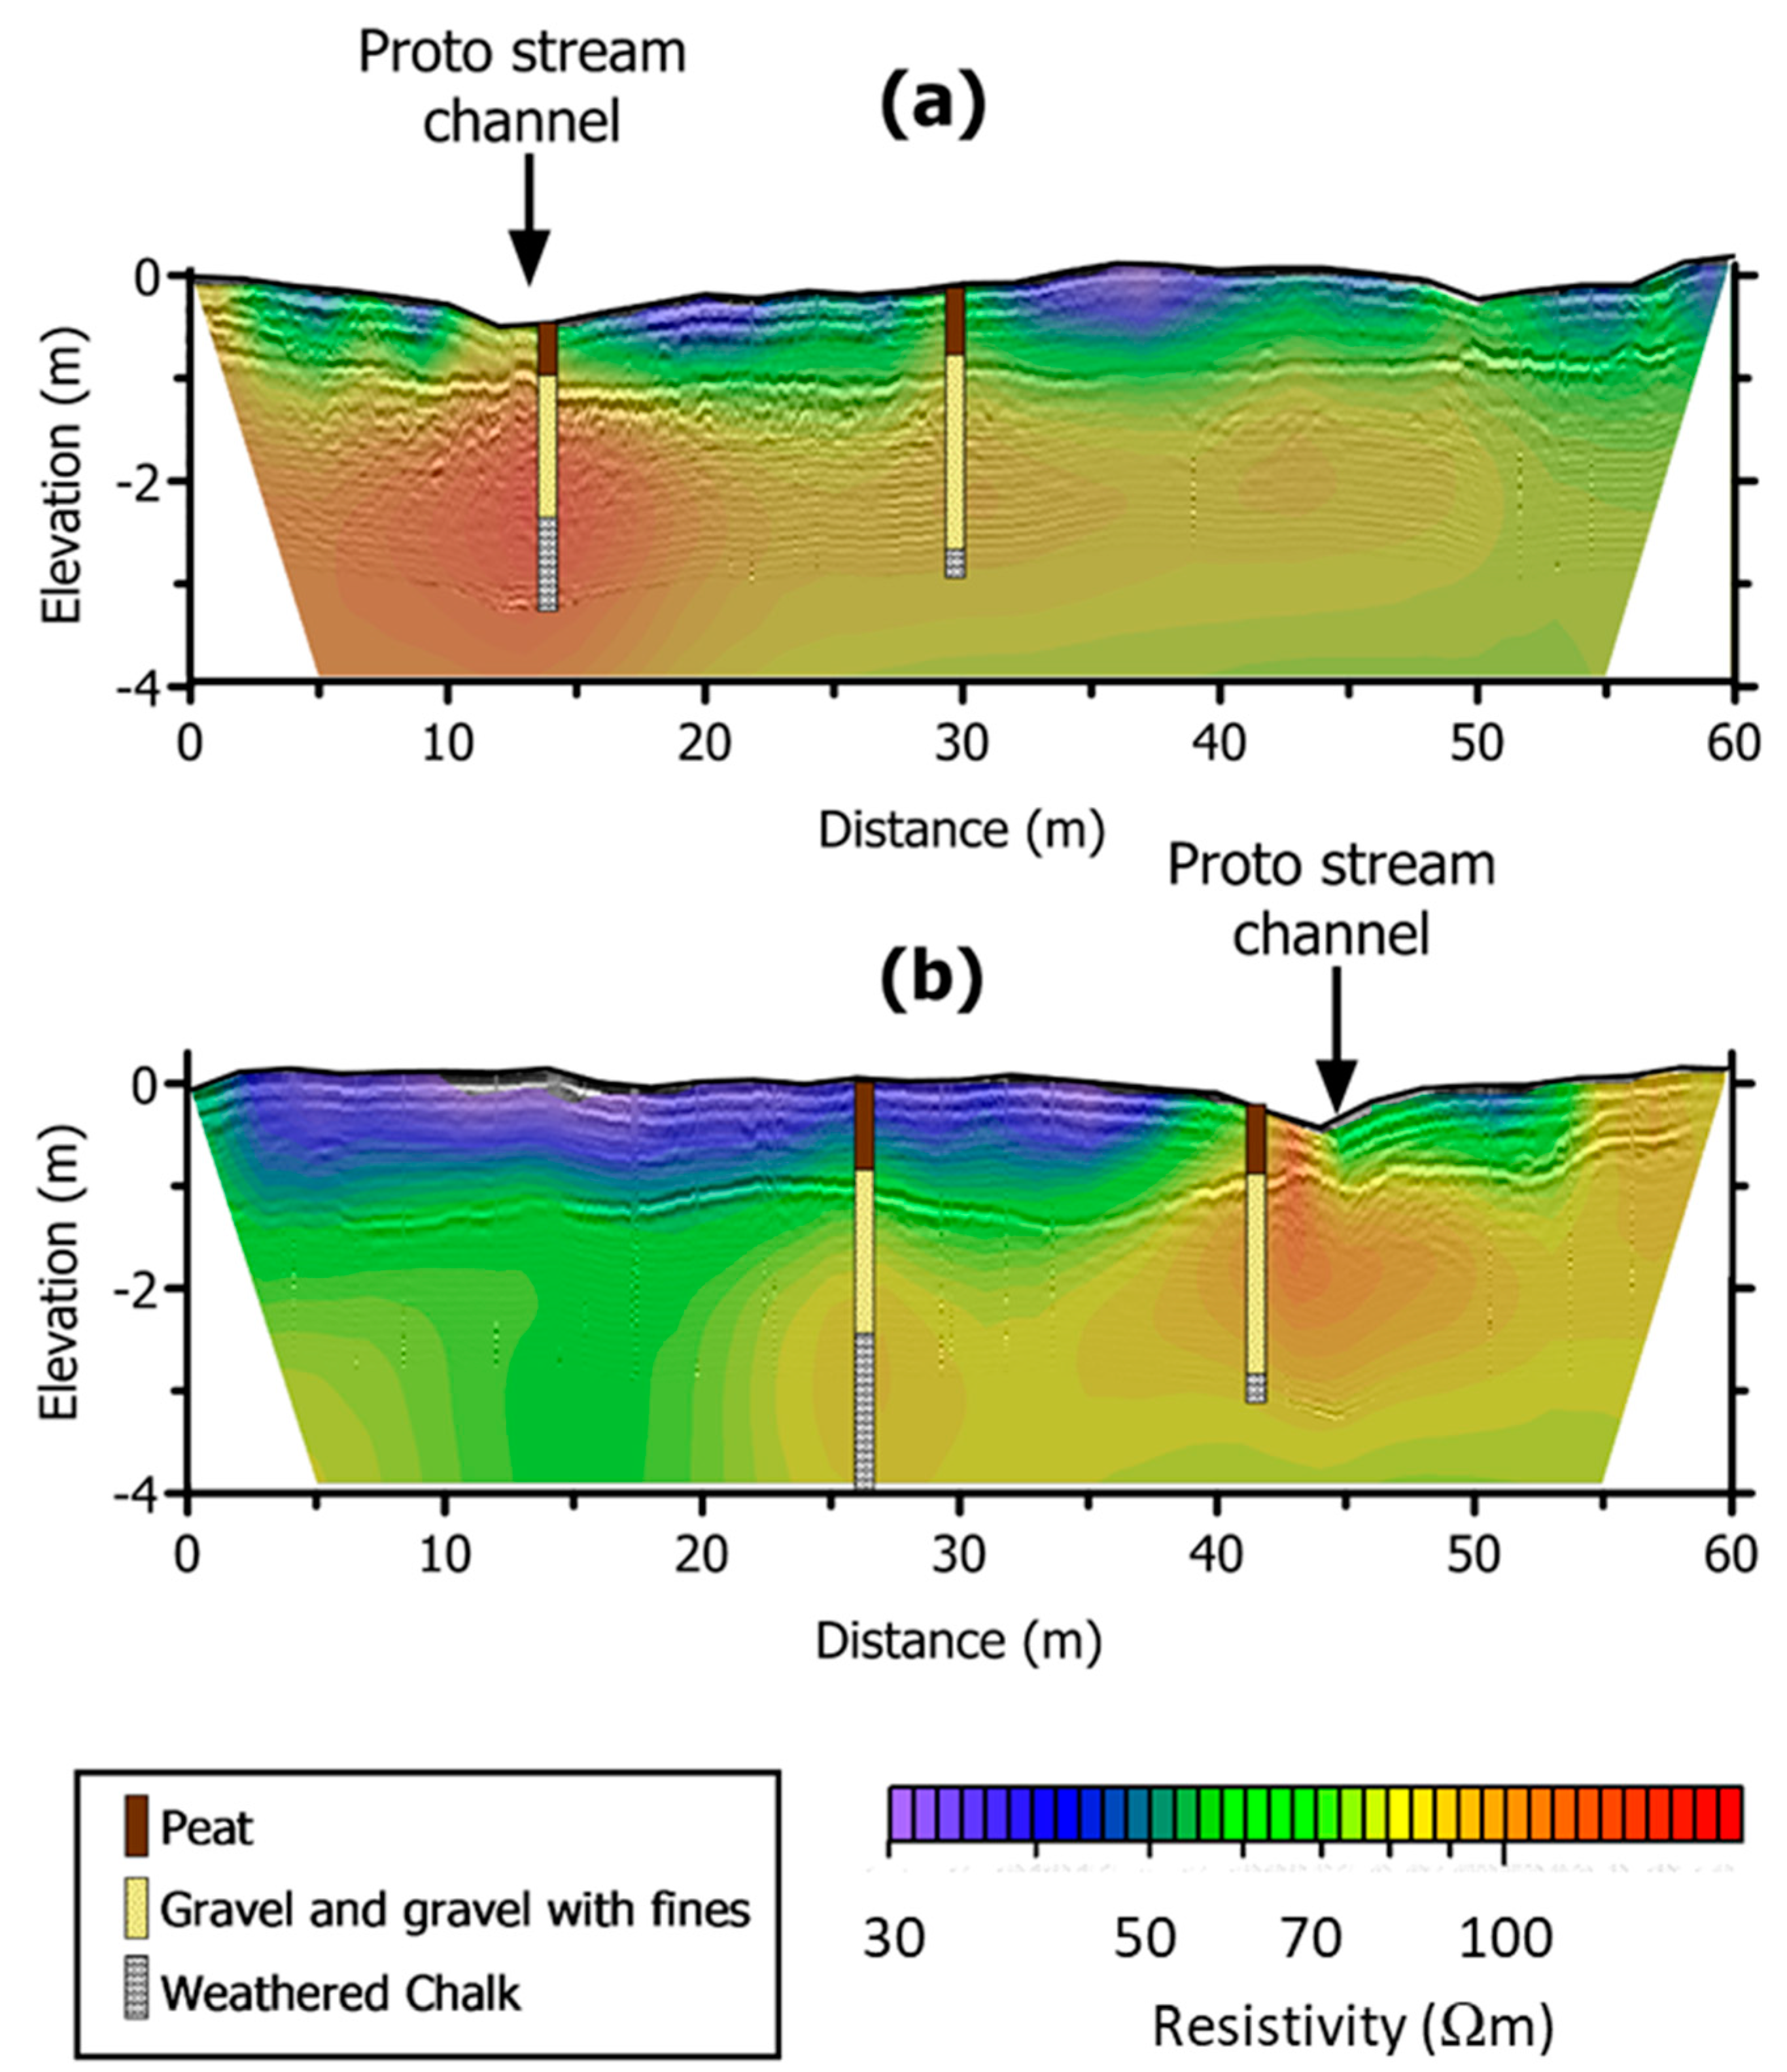
2.3. Characterisation of Subsurface Stratigraphy Using Geophysical Techniques

Geophysics can provide spatial information on the continuity and structure of the wetland subsurface zone [32,48,49,50]. We therefore used electrical resistivity tomography (ERT) and ground penetrating radar (GPR) to characterise the subsurface stratigraphy of the wetland [51]. The geophysical surveys were undertaken at the start of the programme along a number of transects across the site. Figure 2 shows the location of these transects, the results from which are reported here. Electrical resistivity was measured in January 2004 using linear electrode arrays, 2 m spaced, in the Wenner configuration. Data were inverted to a 2-D resistivity image, an Occam’s based inversion [52]. GPR surveys were performed in June 2004 using 200 MHz antennae, with 0.1 m spacing between 0.5 m separation common offset measurements. GPR two-way travel times of reflections were converted to depths using velocities derived from common mid-point (CMP) surveys along the transects.
Example results from the ERT and GPR are presented in Figure 3 and Figure 4, along with results from shallow soil coring. The soil coring revealed a typical sequence of 0.5 to 1 m of alluvium overlying a 1 to 2 m thick gravel layer, which lies above weathered chalk (noted to the 4.5 m maximum depth of the auger profiles).
The ERT images, presented in Figure 4, revealed a shallow (0.5 to 1 m thick) electrically conductive (low resistivity) surface layer, which clearly coincides with the alluvial soil horizon. The ERT images are, by the nature of the method, over-smoothed. However, the GPR provides evidence of a clear continuous reflector that matches the alluvium/gravel boundary. Below this boundary the resistivity increases rapidly to a maximum of between 150 and 200 Ωm at 2 to 3 m depth and then decreases to a relatively uniform 80 Ωm. The transition from gravel to chalk is not seen in the GPR profiles because of (1) high attenuation and (2) scatter resulting from the coarse sediments in the gravel layer.
The geophysical surveys reveal that the thickness of the alluvial soil horizon varies across the site and, in particular, thins near the proto-stream channel. The ERT images show that close to the stream channel the gravel layer is relatively resistive. We attribute this to a greater abundance of coarser, clean gravel noted from soil cores near the channel. The gravels away from the channel were noted to contain much greater fines content, with clear layers of putty chalk, which will lead to a similar low resistivity electrical signature as the underlying chalk. In fact, Musgrave and Binley, through time-lapse monitoring of one ERT transect over one year, revealed evidence of potential groundwater connection to the proto-stream channel through observations of the suppression of subsurface temperature dynamics, attributed to direct connection to stable groundwater temperatures [51].
Note that there is also a coincidence between the composition of the plant community distribution and the ERT survey findings, with much lower resistivity occurring in the area to the NW of the site supporting Tall Herb Fen (NVC M16) than in the SE where Tall Grass Washlands (NVC G18) dominate. Both likely reflect the wetter conditions and thinner layer of alluvial soils in the area of the wetland closest to the proto-stream channel. Thus, the geophysical surveys provide a more detailed discrimination of the surface structure and distribution of hydrological functional zones across the wetland than the HGMU method and appear to reflect the variation of wetland vegetation character across the site.

2.4. Characterisation of the Biogeochemical Functional Zones Using Nutrient Speciation Chemistry, Major Ion Geochemistry and Isotope Geochemistry Analysis Approaches

2.4.1. Site Instrumentation

The decision to continue to use the Boxford wetland for this study was made in part because the wetland geophysical structure and vegetation community are fairly typical of tall herb wetlands in lowland permeable UK catchments, and also because of the location of the wetland at the base of a key dry valley feature. The wetland was instrumented with a 5 × 4 network of nested Teflon porous cup samplers which were installed in the soil matrix at 20, 40 and 60 cm below the wetland surface. Teflon porous cup samplers were selected as they are chemically inert for the purposes of N and P hydrochemistry investigations. These were sampled weekly from 16 September 2003 to 16 January 2005, augmenting earlier sampling and nutrient analysis at the site [5]. Adjacent to each sampler nest, dipwells were installed to the upper surface of the gravels underlying the wetland and used to monitor water level fluctuations across the wetland weekly over the same time period.
Further porous cup samplers were installed along the line of the proto-stream channel, and piezometers were installed into the underlying gravel layer to a depth of 2.0 to 3.5 m below the wetland soil surface at 5 locations. Samples were collected from these additional samplers fortnightly in the final year of study. Access was also arranged to the 30 m deep Boxford borehole adjacent to the wetland (marked X, Figure 2), with samples collected approximately monthly over the period of monitoring. Analyses conducted on these samples confirmed that the groundwater feeding through the wetland was from the underlying chalk aquifer. Finally, in the last 6 months of the study, a fifth line of porous cup samplers were installed along the roadside margin of the site (see Figure 2) and sampled weekly, following the discovery of phosphorus and ammonium enriched water along this margin which might be derived from seepage from a sewage treatment works (STW) located in an adjacent quarry or alternatively from phosphatic rock (5% P2O5) recorded in this same quarry in an earlier study [53].
All of the samplers were surveyed in, relative to Ordnance Datum (OD), so that the absolute elevation of the sampler, the vegetation community with which the sampler was associated, and its relative proximity to the River Lambourn, the proto-stream channel and the road were known. A summary of sampling undertaken at the site is given in Table 1.

2.4.2. Samples Analysis to Determine N Species and P Fraction Concentrations in Porewaters

In order to provide a full assessment of the cycling of nitrogen (N) and phosphorus (P) within and through the wetland, all water samples collected from the wetland soil water, gravels and chalk were analysed to determine the concentrations of dissolved inorganic N (NO3-N, NO2-N, NH4-N), dissolved organic N (DON), and soluble reactive P (SRP, measured as PO4-P), dissolved organic P (DOP), and dissolved organic C (DOC) as Non-Purgeable Organic Carbon (NPOC), using standard operating procedures and quality assurance protocols [23,25]. Samples were collected over a period of 4 h at each sampler nest on a weekly basis and returned to the laboratory at 4 °C in the dark. All samples were analysed within 24 h of collection using a Chemlab System 40 autoanalyser to determine total oxidised N (TON = NO3-N + NO2-N), total ammonium (NH4-N + NH3-N) and SRP as orthophosphate (PO4-P). A second run with modified manifold yielded NO2-N concentrations which, when subtracted from TON generated NO3-N concentrations for each sample. Samples were then digested using a modified method to determine total dissolved N (TDN) and P (TDP) concentrations [23,54]. This procedure oxidises all N in the sample using potassium persulphate (K2S2O8) in a strongly alkaline environment under high temperature and pressure, yielding nitrate with some residual ammonium. The by-product of this reaction simultaneously creates the acidic conditions needed to support the oxidation of P in the presence of K2S2O8 to yield orthophosphate under conditions of high temperature and pressure. The technique uses a CEM MARS-Express Microwave Digestion Unit to create high temperature and pressure under controlled conditions. Sample digests were then analysed to determine TDN as TON and TDP as PO4-P using standard methods. DON was then calculated as TDN minus total inorganic N (TON + NH4-N). DOP was calculated as TDP minus SRP. All sample digests were completed within 48 h of sample collection to minimise sample degradation prior to analysis and analysed within 72 h of collection.

2.4.3. Sample Analysis to Determine Major Element Geochemistry

Major element geochemistry was determined on a subset of these samples. This included samples collected from the soil matrix, gravels and chalk underlying the wetland, and from the adjacent river reach, borehole, and a second borehole array at Westbrook Farm, located 300 m upstream from the wetland, the data from which have been reported in detail in a number of earlier publications [30,37]. These data were collected to help determine, using similarity indices, the likely origins of waters draining through the wetland. As chalk groundwaters are dominantly of Ca-HCO3 type and subject to a greater degree of incongruent dissolution with residence time, greatest separation of trends in sample geochemistry is often best achieved by examining the ratio of base cations, in particular the strontium/calcium (Sr/Ca) and magnesium/calcium (Mg/Ca) ratios. Higher ratios are likely to be indicative of relatively longer residence time of chalk groundwater, whereas lower ratios are more typical of surface water input or rainwater.
Sampling was carried out using a small submersible pump and included on-site measurements of temperature, specific electrical conductance (SEC) and alkalinity (by titration) as well as pH, dissolved oxygen (DO) and redox potential (Eh). The latter parameters were measured in a flow-through cell to minimise contact with the atmosphere. To ensure a representative sample was taken, a minimum of 2–3 well volumes was removed from the piezometers prior to sampling and samples were collected after on-site readings of temperature, conductivity, pH, DO and Eh had stabilised. Samples for major ion chemistry were collected in Nalgene bottles and filtered through 0.45 µm membrane filters. Analysis of major cations and sulphate was carried out by ICP-OES and anions were analysed by automated colorimetry.

2.4.4. Sample Analysis to Determine Isotope Ratios in Soil Water, Alluvial Gravels and Wetland Vegetation

Isotope geochemistry has a wide range of applications in the study of the natural environment, and the study of natural abundance isotopic ratios has become a well- established technique for the investigation of elemental cycling in a wide range of ecosystems. In the study of nutrient cycling and flux in wetland systems, the isotopes commonly studied include the 15N/14N and 18O/16O ratios in nitrate, where the lighter isotopes are preferentially taken up in vegetation over the heavier isotopes. It is also used as an indicator of the denitrification and ammonia volatilisation processes. Because molecular bonds involving 14N are weaker than identical bonds involving 15N, reaction of 14N molecules is kinetically favoured relative to reaction of 15N molecules. As a consequence, in bacterially-mediated processes such as denitrification, the δ15N value of the instantaneously-formed product is lower than the value of the substrate. During denitrification, the residual nitrate becomes enriched in both 15N and 18O, and combined 15N/14N and 18O/16O analysis of nitrate has been shown to be a particularly effective way of identifying denitrification in riparian systems [55,56,57].
Samples of waters entering the wetland at the gravel-alluvial boundary, and accumulated within the soil porewaters of the wetland alluvial soil can be collected as transient indicators of these processes, but a longer term indication of the distribution of N metabolism across a wetland can also be derived by examination of the isotope ratios in non-migratory resident organisms in a wetland, such as the wetland plant community. In the latter case, variation in the stable isotope composition of the plants across the wetland will reflect the dominant processes operating in the subsurface zone. This approach was therefore adopted in this study, with leaf material of plants collected for 15N/14N analysis from a number of sites in the wetland and River Lambourn. Sampling concentrated on a single species, Phalaris arundinacea, to avoid inter-species variability. Water samples were collected for 15N/14N and 18O/16O analysis of nitrate from the Boxford borehole, the Westbrook borehole array, the proto-stream, and a few of the piezometers.
Nitrate in waters was collected on anion exchange resins and processed to silver nitrate [58,59]. Plant samples, comprising the top 4–5 leaves of a plant were dried at 80 °C and homogenised. 15N/14N ratios of the silver nitrate and plants were analysed by combustion in a FlashEA nitrogen and carbon analyser on-line to a Delta Plus XL mass spectrometer (ThermoFinnigan, Bremen, Germany), with ratios calculated as δ15N values versus air (atmospheric N2) by comparison with standards calibrated against the International Atomic Energy Authority IAEA-N-1 and IAEA-N-2 (ammonium sulphate) isotope standards. 18O/16O ratios of the silver nitrate were analysed by thermal conversion to CO gas at 1400 °C in a TC-EA on-line to a Delta Plus XL mass spectrometer (ThermoFinnigan, Bremen, Germany), with ratios calculated as δ18O values versus VSMOW (Vienna Standard Mean Ocean Water) by comparison with the IAEA-NO-3 (potassium nitrate) isotope standard.
Data generated from each of these methods are deposited in the NERC Environmental Information Data Centre (EIDC) LOCAR repository and are publicly available along with subsequent monitoring at the Centre for Ecology and Hydrology (CEH) River Lambourn Observatory at Boxford here: http://eidc.ceh.ac.uk/ and from the lead author.

3. Results

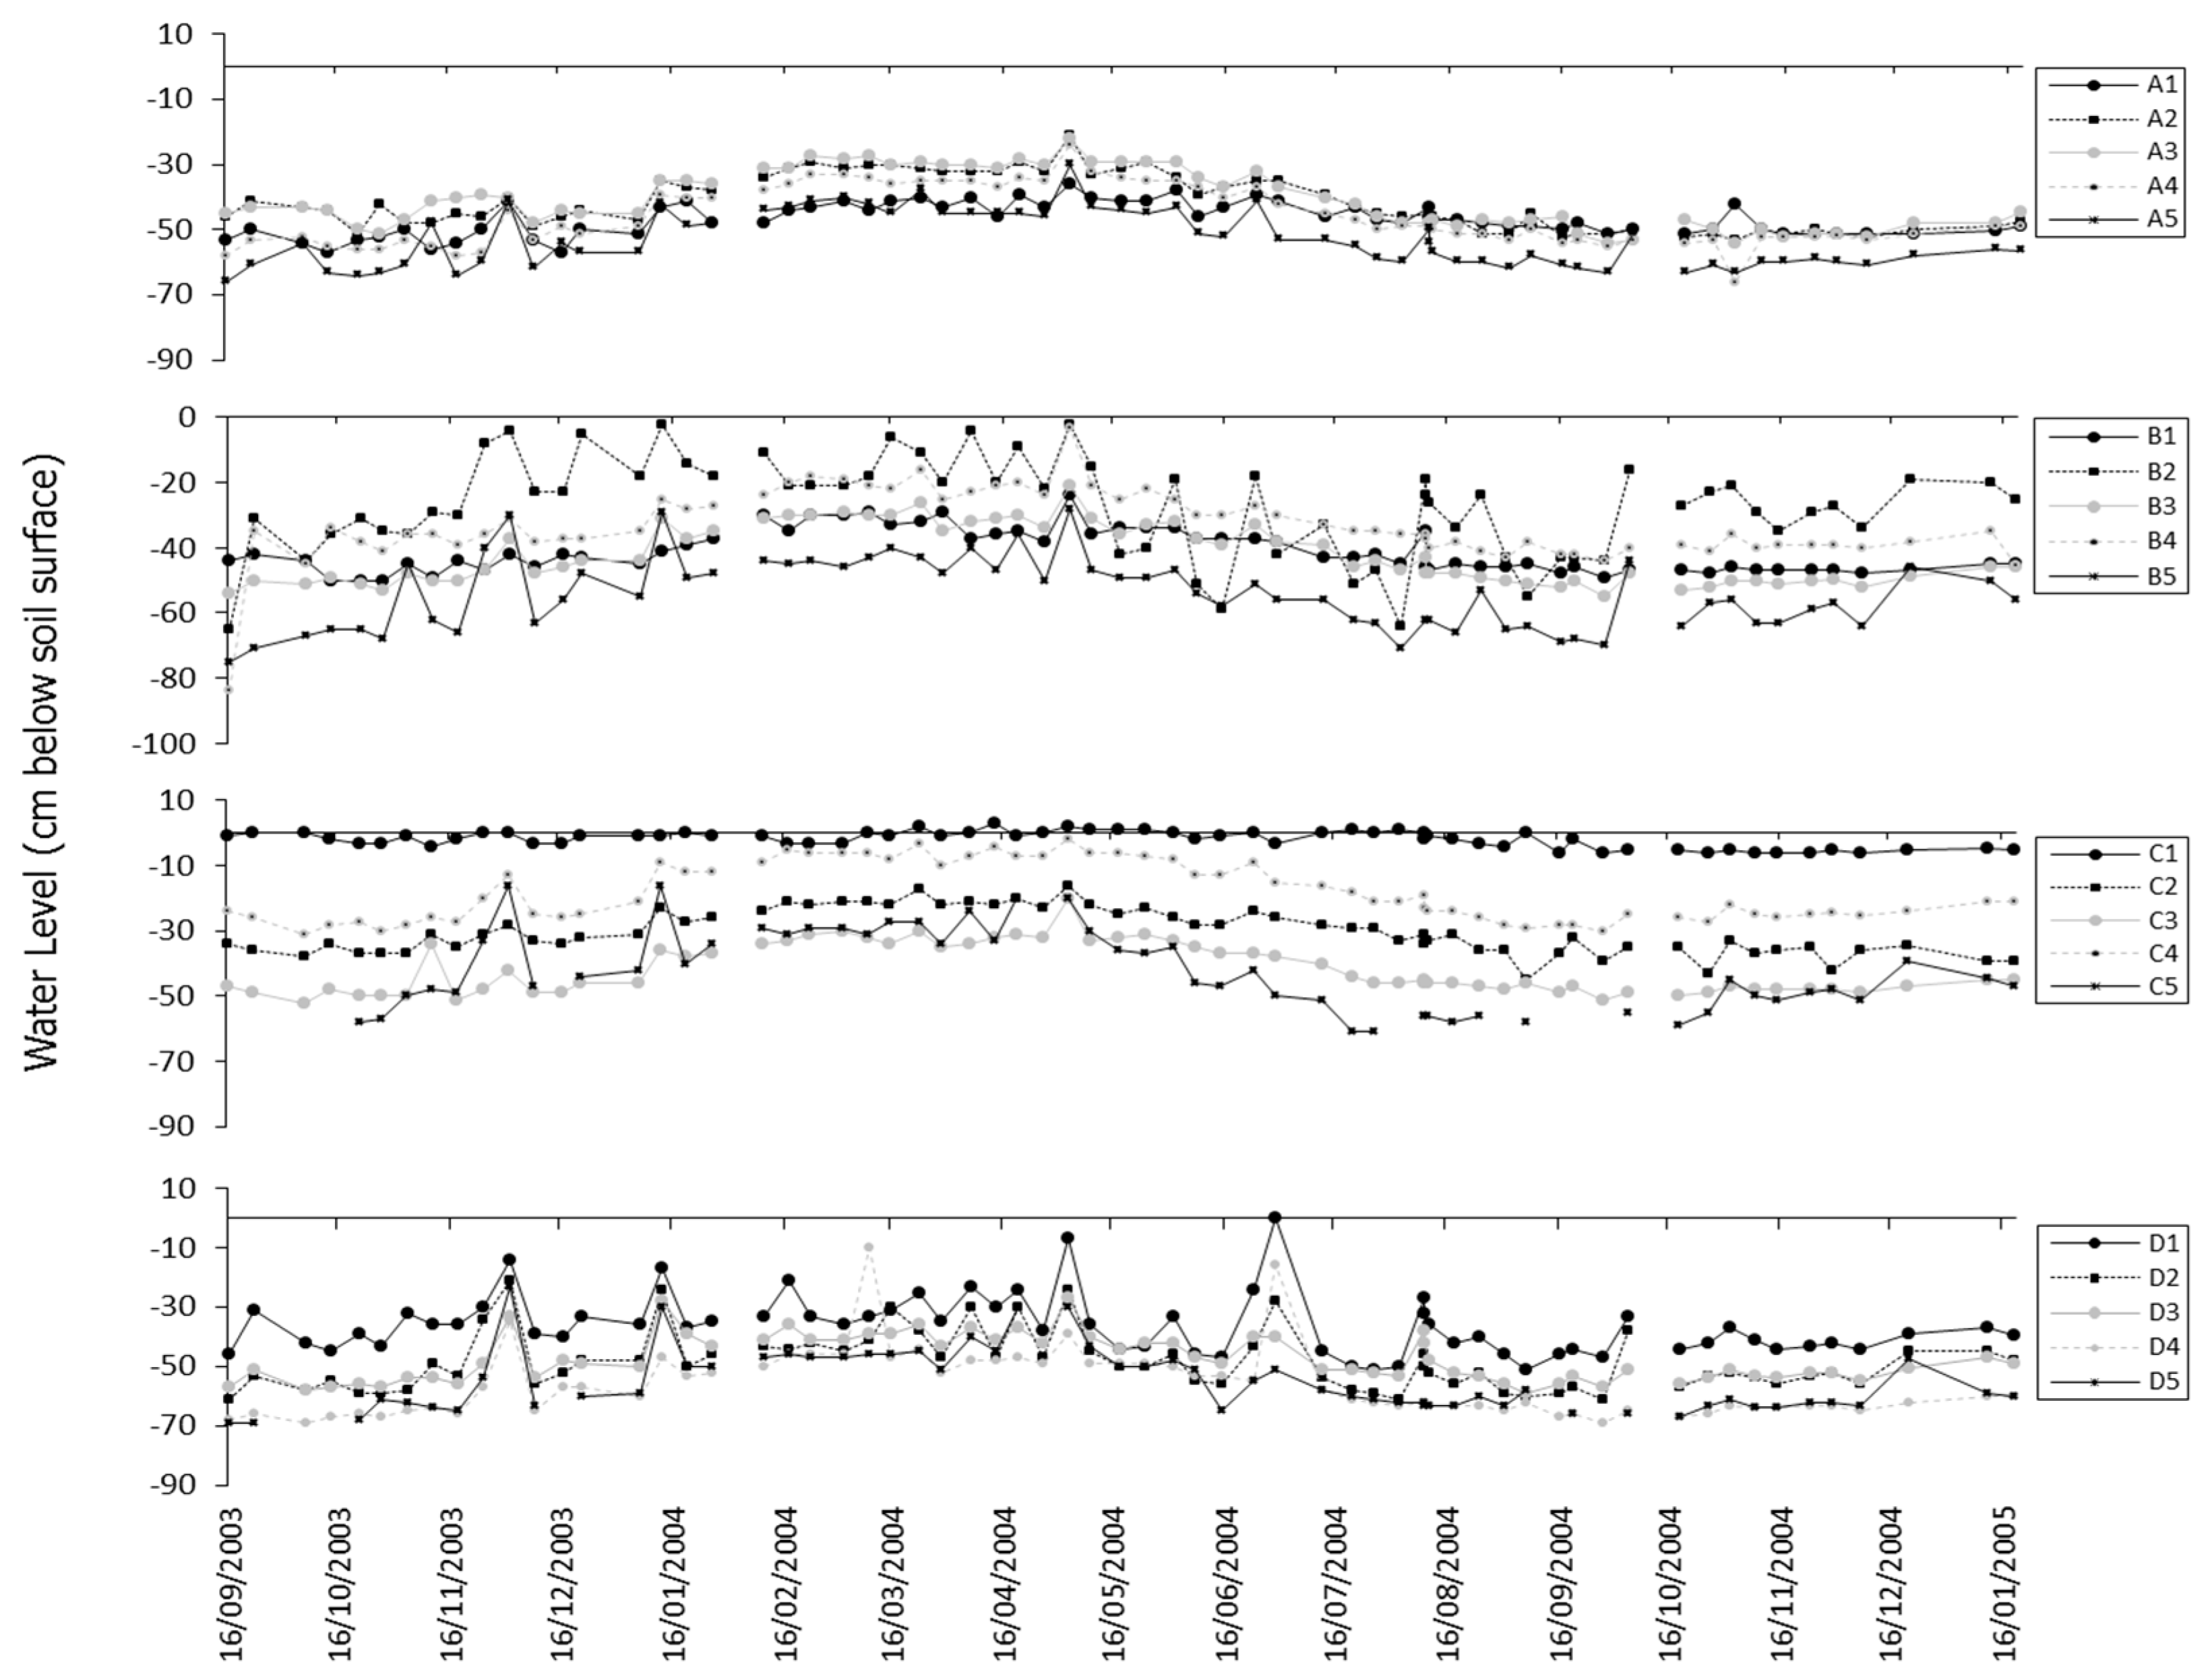
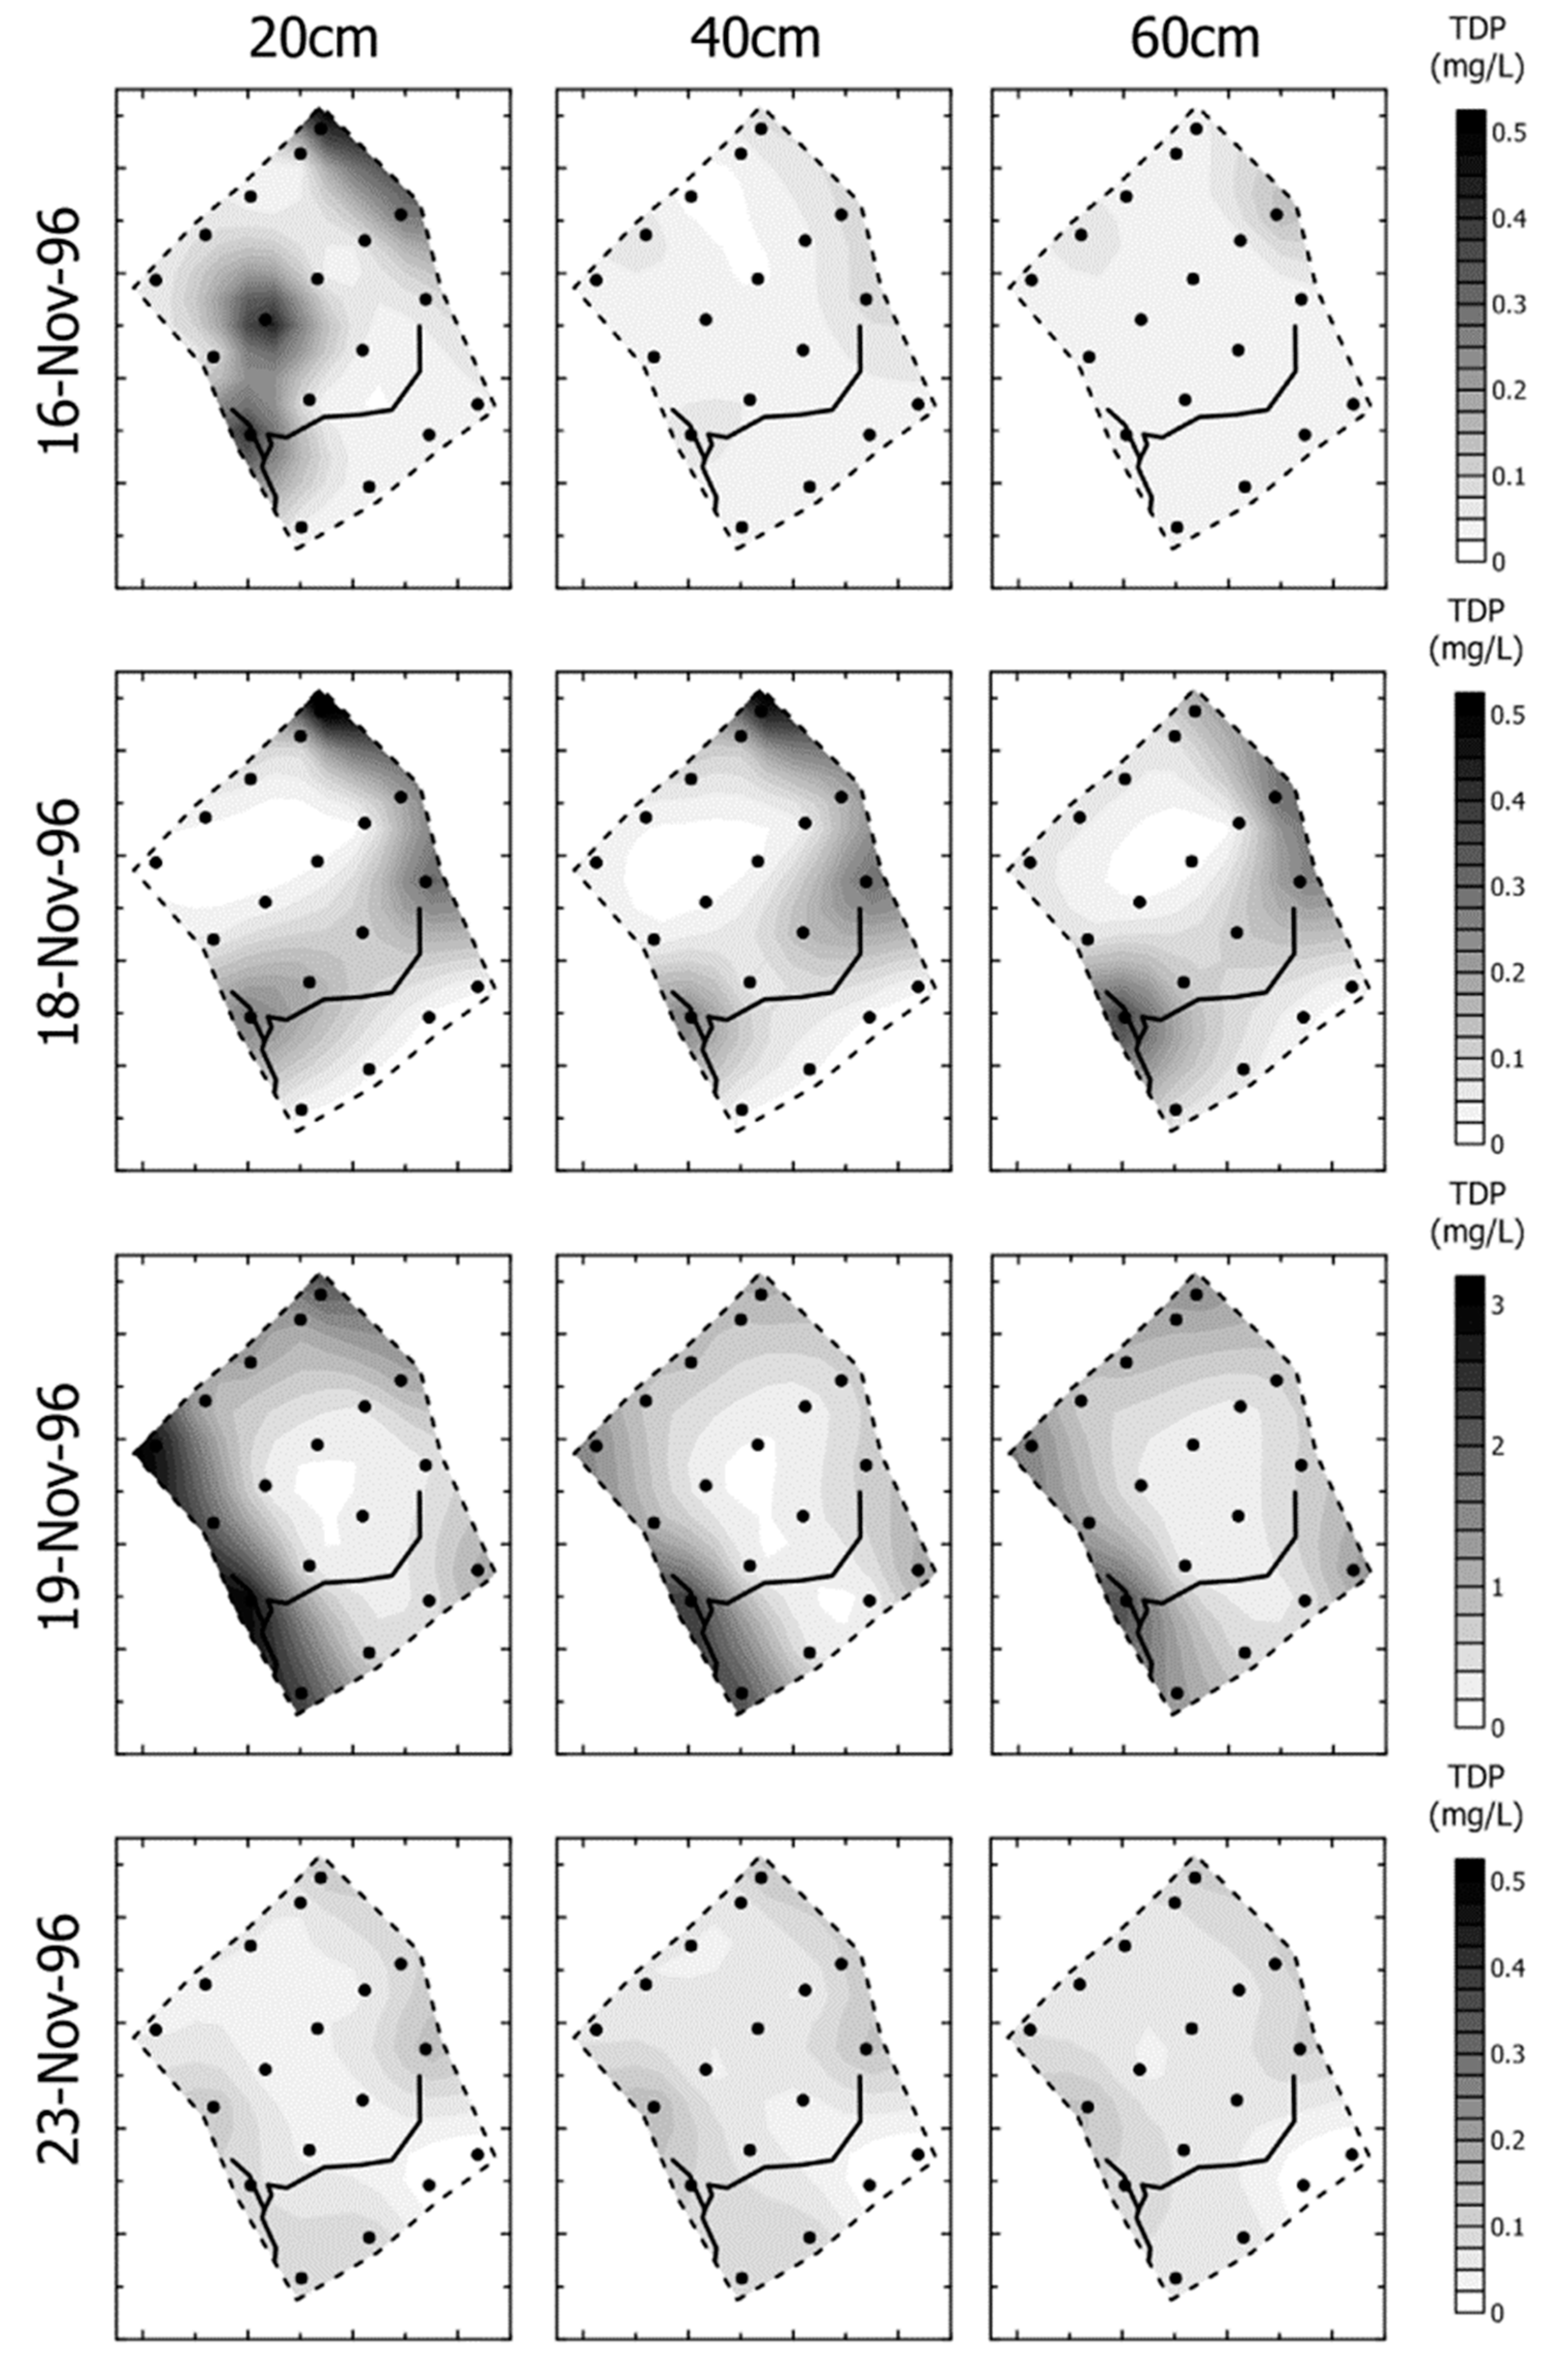
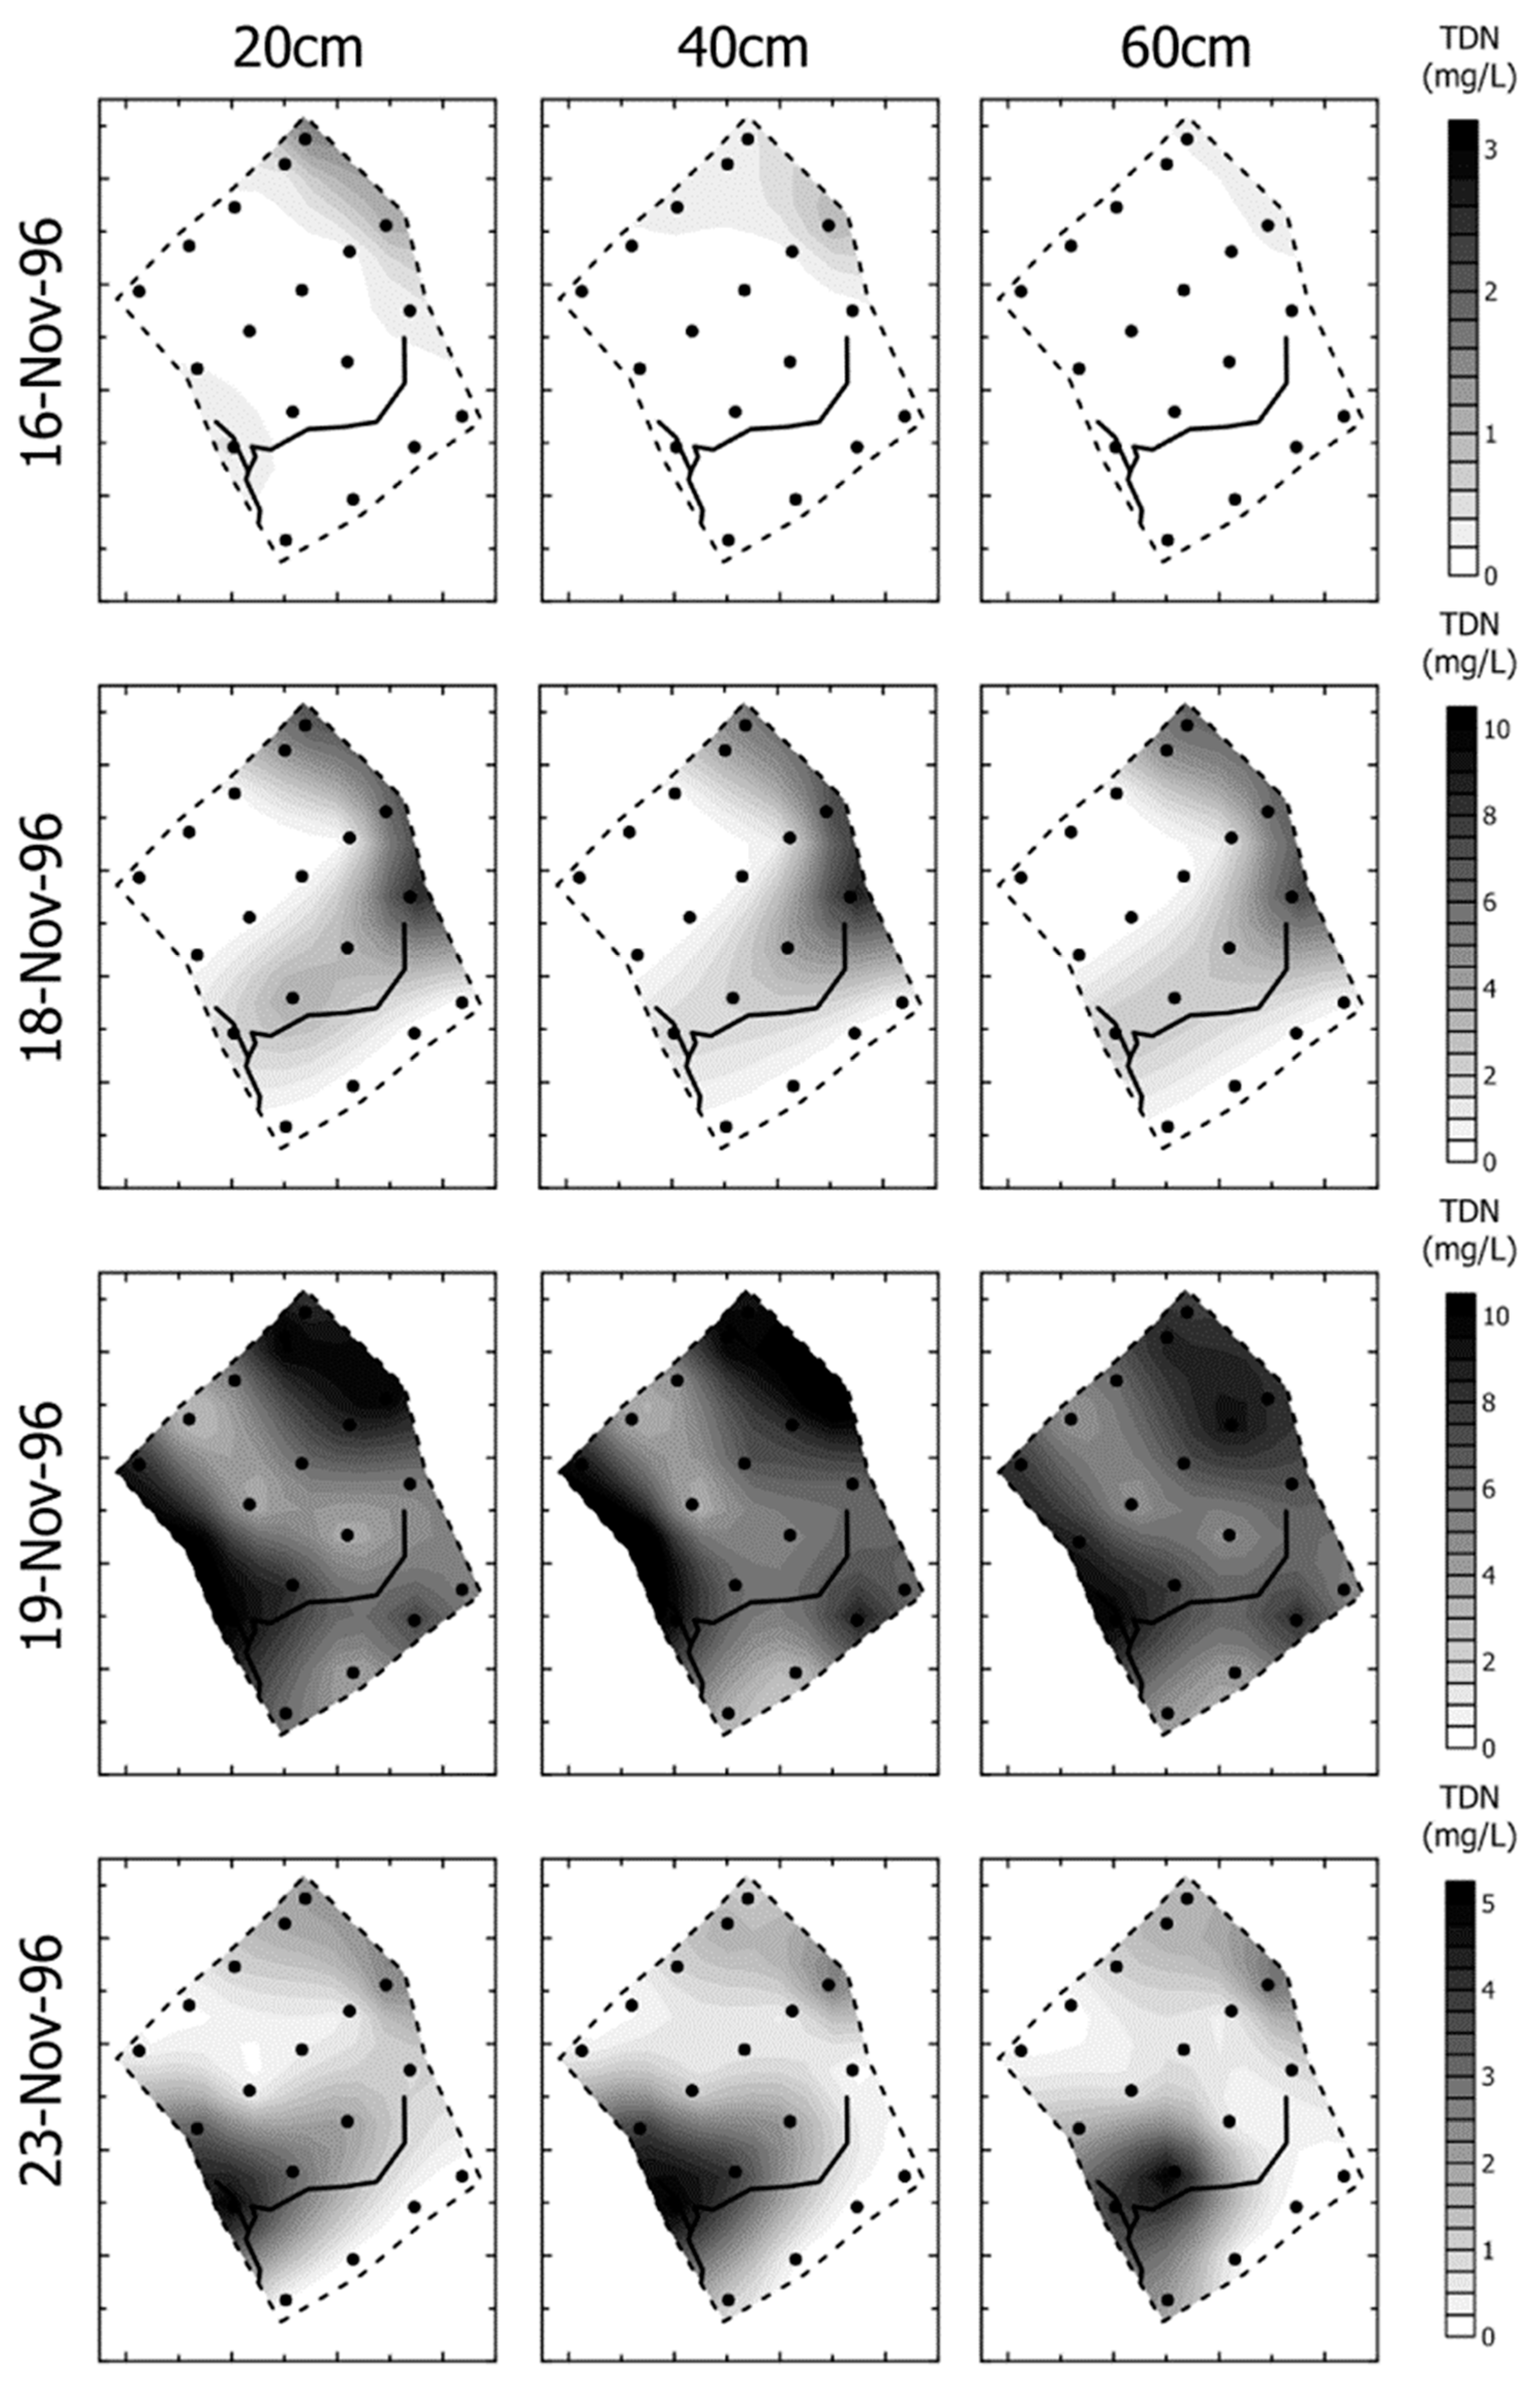
3.1. Characterising Wetland Hydrological Function through Hydrological Monitoring and Geochemical Indices

An indication of the variation in site hydrology over the sampling period is given in Figure 5. Here, water level variations at each sampler nest are presented for the period 16 September 2003 to 16 January 2005. Along each SW–NE transect (A, B, C, D–see Figure 2) maximum water level is recorded in the period March–April, in accordance with observations of water level in the adjacent reach of the Lambourn [5,36]. Minimum water level occurs in the early autumn (September to October) in both years studied.
Groundwater level was typically 30–60 cm below the wetland soil surface along transect A, the closest to the river (Figure 2), indicating that sampler nests installed at 20 cm depth at A1–A5 will have consistently sampled the unsaturated zone of the soil. Samples collected at 20 cm depth along this transect are likely, therefore, to include water stored in both micropores and macropores in the soil matrix. At 40 cm depth the samples collected in the period January to May will have been taken from the saturated soil zone, but for the remainder of the year these will have been taken from the unsaturated soil zone. At 60 cm virtually all samples will have been taken from the saturated soil zone. According to theories of nutrient hydrochemical function derived from the earlier work on the Boxford wetland, the unsaturated zone soil samples are likely to include water stored over a relatively long period of time in the wetland and are therefore likely to exhibit a significantly different (processed) hydrochemistry than that of possible source waters (river water, groundwater) [5]. Conversely, water samples taken from the saturated zone are likely to include substantial contributions of source water, and the chemistry of these waters is likely to show a greater similarity to that of potential contributing source areas.
Water level along transect B, aside from that recorded at B2, is similar to that recorded along transect A. B2 shows a more flashy response in terms of water table fluctuations, as does B5 to a lesser extent. When piezometers were installed at B2, the coring evidence revealed the presence of putty chalk below the wetland at this site, indicating poor connectivity between wetland soil porewaters and groundwater, which is consistent with the geophysical survey findings for the site [51]. The data collected for B2 are likely to show unsaturated zone chemistry typical of a longer hydraulic residence time in the wetland. Of the remainder of the samplers, only those at B5 will have consistently been taken from the saturated zone of the wetland and are therefore likely to show a chemistry consistent with other areas of the wetland well-connected with potential source waters.
Water levels along transect C which runs close and parallel to the proto-stream channel (Figure 6) are variable along the Transect. C1 is located immediately adjacent to the proto-stream channel and the water level data indicate saturated conditions at this site for the whole of the sampling period and at all three sampling depths. The hydrochemistry data for C1 are, therefore, likely to show similarity to the data for proto-stream channel itself and other saturated sites across the wetland. Samplers at C4 are also very close to the proto-stream channel and the water level data indicate that here also the samplers at all 3 depths are likely to have extracted samples from the saturated rather than the unsaturated zone. The nutrient chemistry and geochemistry of these samples would be expected to show similarities with that of the proto-stream channel and other source waters. At C2, C3 and C5 the sampler nests are further away from the proto-stream channel. In all three sites the samplers at 60 cm are likely to be sampling from the saturated zone, with samplers at 20 and 40 cm at C3 and C5 sampling from the unsaturated zone over the period July to February.
Water levels along transect D, adjacent to the road, indicate that few of the samples drawn at 20 cm are likely to have been from the saturated zone. At 40 cm most of the samples collected from 3 September to 2004 July are likely to have been drawn from the saturated zone. At 60 cm all samples are likely to have been drawn from the saturated wetland soils. This is again likely to be reflected in the nutrient chemistry and geochemistry of the samples drawn from these sites and the extent to which this is like that of potential source waters to the wetland.
These variations in the hydrological function, soil wetness and redox are picked up in the geochemistry results produced for the site and presented in Figure 6. Sample transects are shown in Figure 2. A total of 66 elements were determined on samples collected along these two transects running from A2 to D2 and from C1 to C5. Samples were also collected from the proto-stream channel, the Boxford borehole adjacent to the wetland (marked X on Figure 2), and the Westbrook borehole array, 300 m upstream from the wetland. Good separation of trends in sample geochemistry are evident in the Sr/Ca and the Mg/Ca ratios for these samples. Samples from the groundwater boreholes, the proto-stream channel and the three porous cup samplers at C1 show a similar geochemistry, with high Sr/Ca and Mg/Ca ratios. Water samples were collected from samplers in the unsaturated zone of the wetland, at a greater distance from the groundwater, river and proto-stream (A2, B2, C3 and C5) have more depleted Sr/Ca and Mg/Ca ratios, indicative of waters which, if originally derived from groundwater sources, have been subject to modification (e.g., ion exchange) while resident in the wetland soil matrix. The remaining samples, taken from C4, C2, and C2, which are closer to the proto-stream channel than those at A2, B2, C3 and C5, but further from the channel than those at C1, show an intermediate chemistry.
The geochemical survey of the wetland soil waters appears to provide a robust characterisation of the spatial distribution of the major functional zones within this wetland, where there is a distinct signature, providing a relatively simple technique for such systems. It requires far fewer samples in both space and time than the detailed high-resolution sampling and analysis needed to characterise the full range of nutrient species in wetland porewaters as these vary over space and time. Analytical methods to determine major ion chemistry are also more straightforward. This technique is likely to work well in other calcareous wetlands fed by CaCO3-rich groundwater. In wetlands receiving water from complex sources, alternative approaches to characterise subsurface chemical transport and wetland-stream-aquifer interactions under a wider range of conditions would use 222Rn [60,61], 3H/3He tracer techniques [62], or 87Sr/88Sr [63] while analysis for chlorofluorocarbons (CFCs) and sulphur hexafluoride (SF6) have also been shown to be a valuable and relatively inexpensive method for calculating the age of waters in the groundwater-dependent wetlands [64,65].
The geochemical analyses undertaken here appear to support the hypothesis that water stored for longer periods of time in the wetland soil matrix will undergo greater transformation in terms of its chemistry, and water which is more immediately derived from source waters is likely to share similar geochemical characteristics to the source waters. This suggests that the nutrient chemistry and geochemistry of waters within the wetland are likely to vary according to hydraulic residence time. It can also be postulated that waters sampled from the rooting zone of the wetland (typically those taken at 20 cm, with some rooting down to 40 cm in these tall herb fenlands) are likely to show greater depletion in terms of their nutrient concentrations than those from samplers below the rooting zone, and that depletion of inorganic nutrient chemistry and enrichment with dissolved organic nutrient fractions is likely to be most common in the rooting zone. This pattern is evident in the data collected from the porous cup samplers under baseflow conditions. An example of this pattern in the nutrient hydrochemistry of the wetland is given for 3 August 2004 in Figure 7 (N) and Figure 8 (P).
These data were collected in the growing season at the end of the summer period, when plant uptake was likely to be depleting inorganic nutrient concentrations in the rooting zone, and there had been plant uptake and microbial breakdown of dead organic matter in the surface soil layers of the wetland during the warm summer months. The nitrogen chemistry data reflect these controls, with nitrate present only at 60 cm depth, and only at sampler C1, close to the proto-stream channel, reflecting continued input of nitrate rich groundwater to this part of the wetland. Across the remainder of the site there was a substantial build-up of DON, particularly in those areas of the wetland with the longest hydraulic residence time along transects A and B and at site C3. The greatest accumulation of DON occurred in the rooting zone (20 cm). There was some ammonium present in the wetland, notably along transect D, and the proximity of these samplers to potential leakage from the adjacent STW at this site, or the possibility of ammonium volatilisation from the STW and local deposition along this transect is the most likely cause of this pattern, though it could also be due to mineralization of DON in the rooting zone.
The P fractionation data collected on this day showed SRP enrichment along transect D at 60 cm depth. The most likely cause is seepage of SRP rich waters from the adjacent STW, though it is possible that the phosphatic rock present at the top of this exposed chalk section may also be responsible for part of the background P concentrations along this transect [53]. Generally, however, there is <0.02 mg/L PO4-P in the wetland in the rooting zone, and there is some evidence of DOP accumulation at all depths across the site, with the highest concentrations in those areas of the wetland located furthest from the faster flushing proto-stream corridor, where water input from the groundwater aquifer and rainfall has the longest hydraulic residence time.
These patterns are clearly evident in the baseflow N chemistry data presented in Figure 9. For each porous cup sampler, piezometer, the Boxford borehole and the River Lambourn adjacent to the wetland, the mean annual nitrate, DON and ammonium concentrations are presented. The X axis is labelled with samplers at 20 cm labelled ‘a’, 40 cm labelled ‘b’ and 60 cm labelled ‘c’. Thus, the first 5 columns are A1 (20 cm), A2 (20 cm), A3 (20 cm), A4 (20 cm) and A5 (20 cm), where A1a refers to the sampler at transect A, row 1, 20 cm depth.
A number of trends are apparent in this figure:
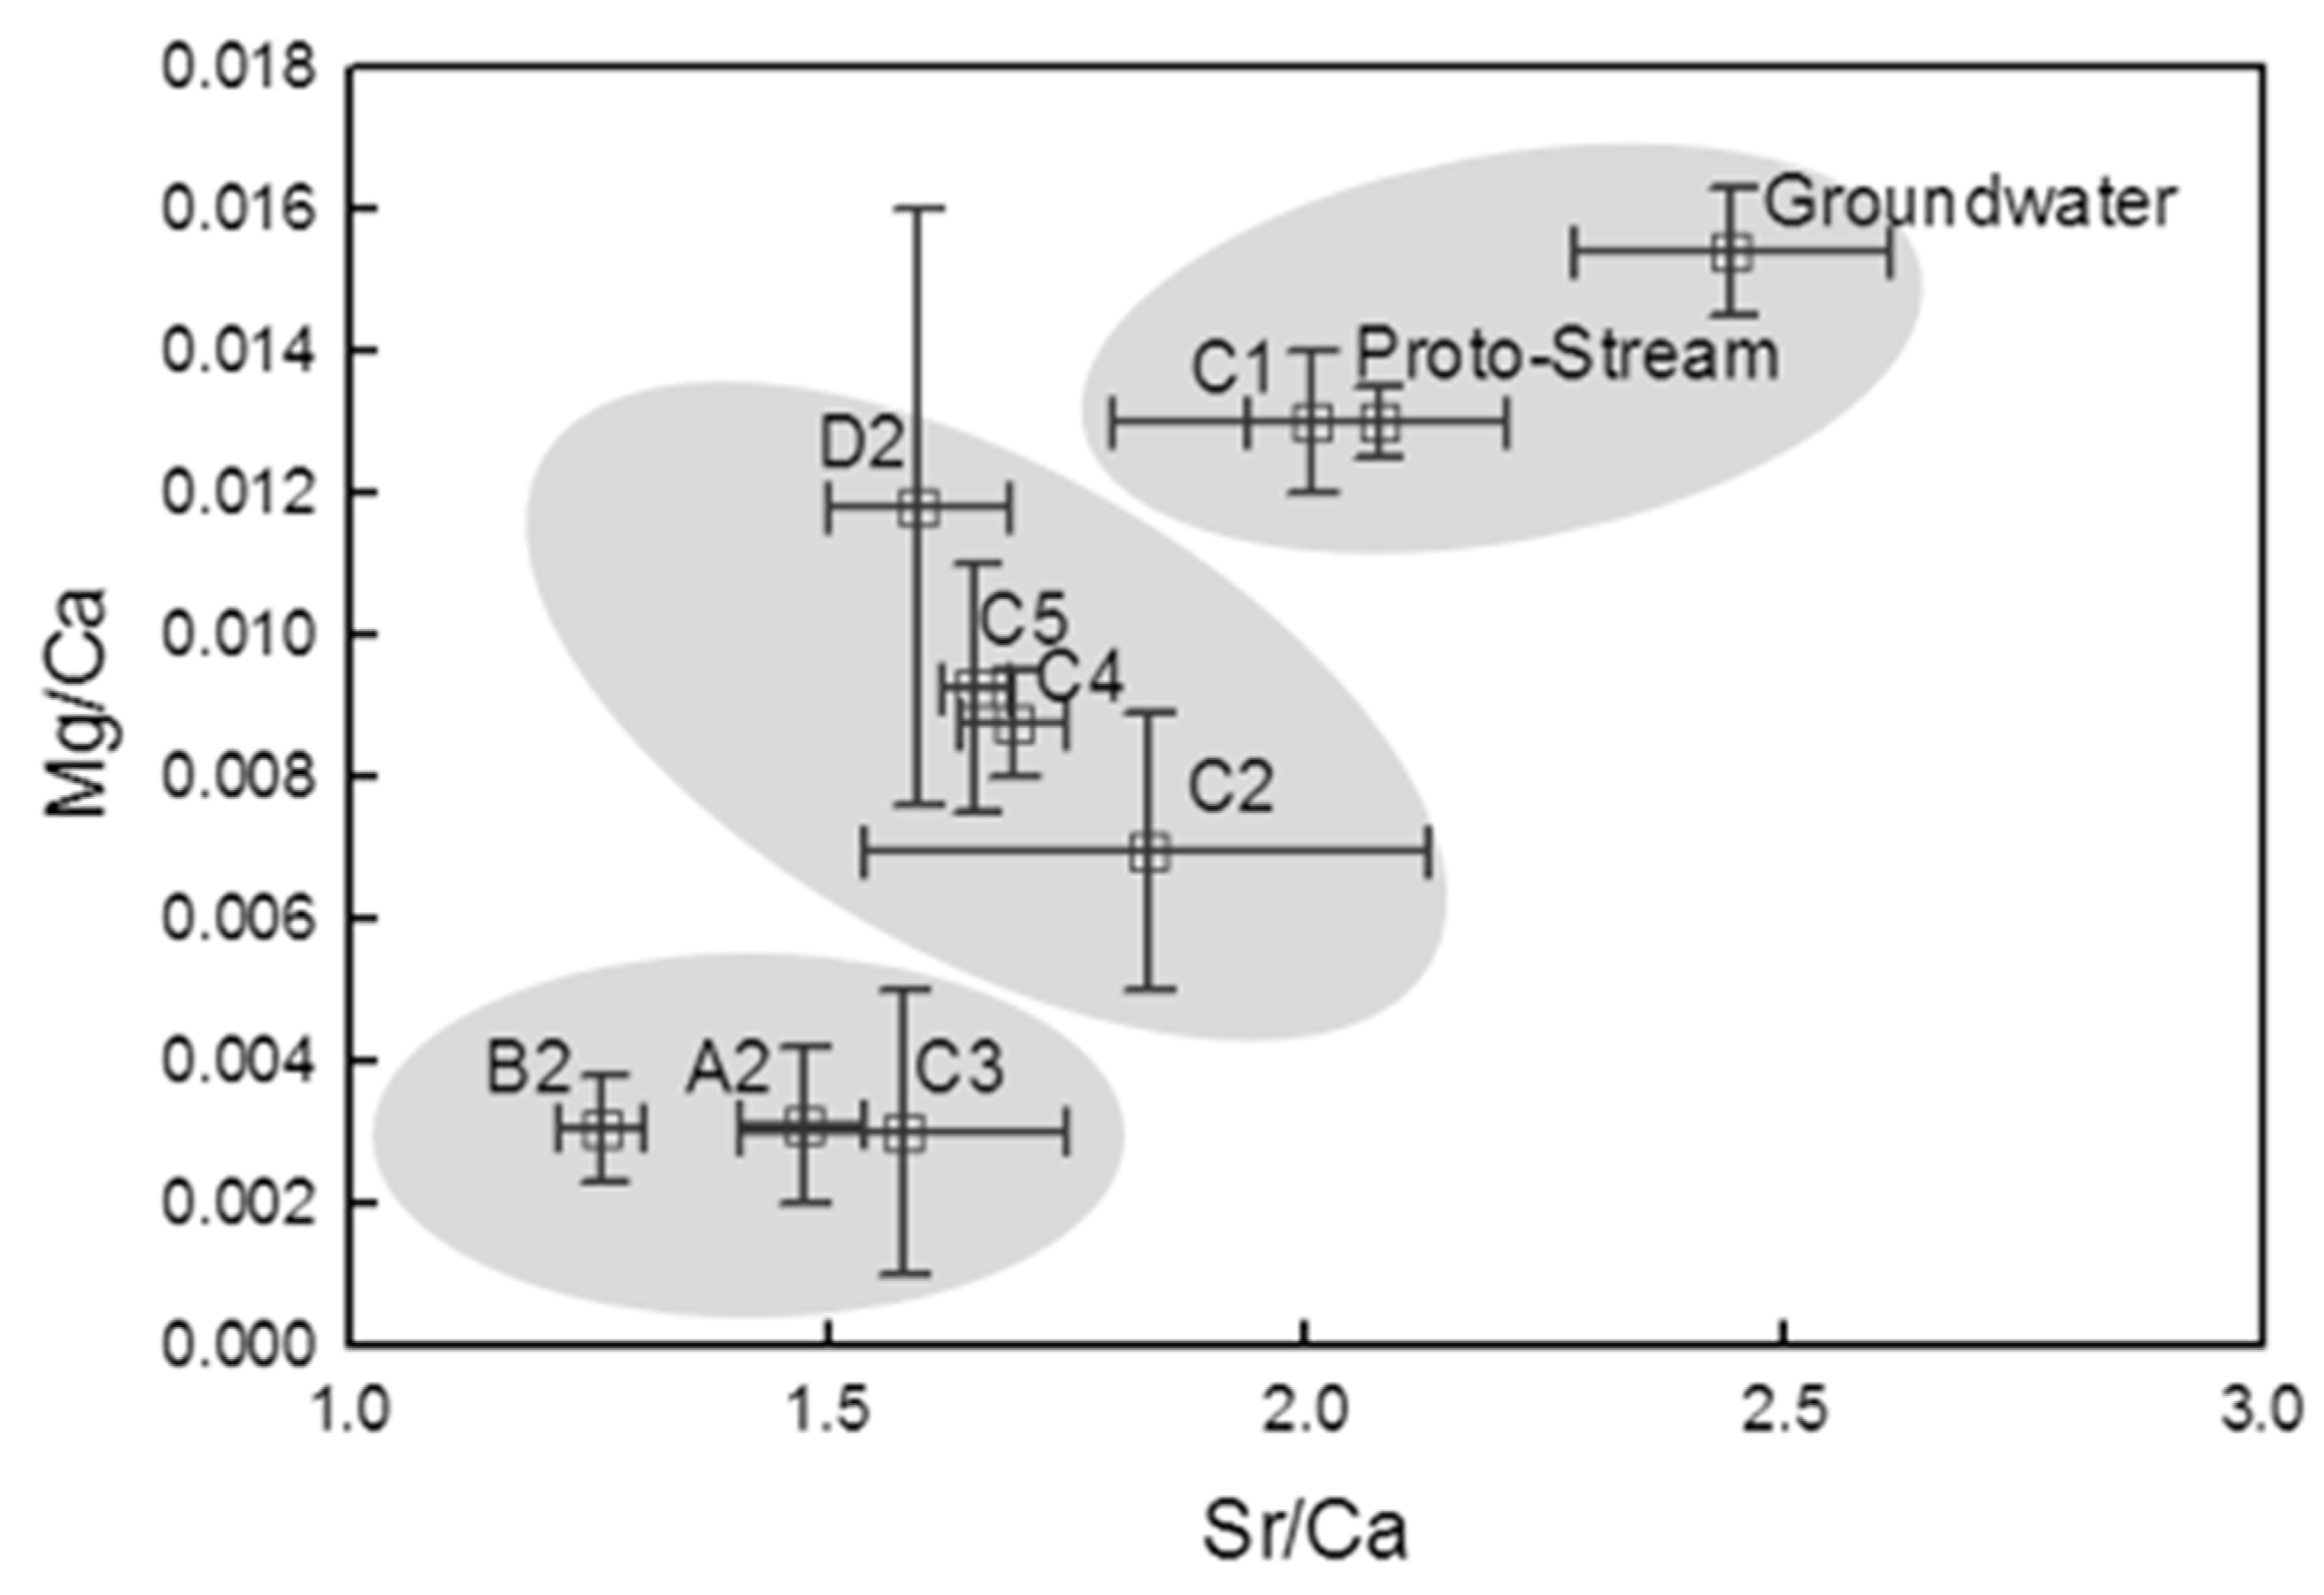
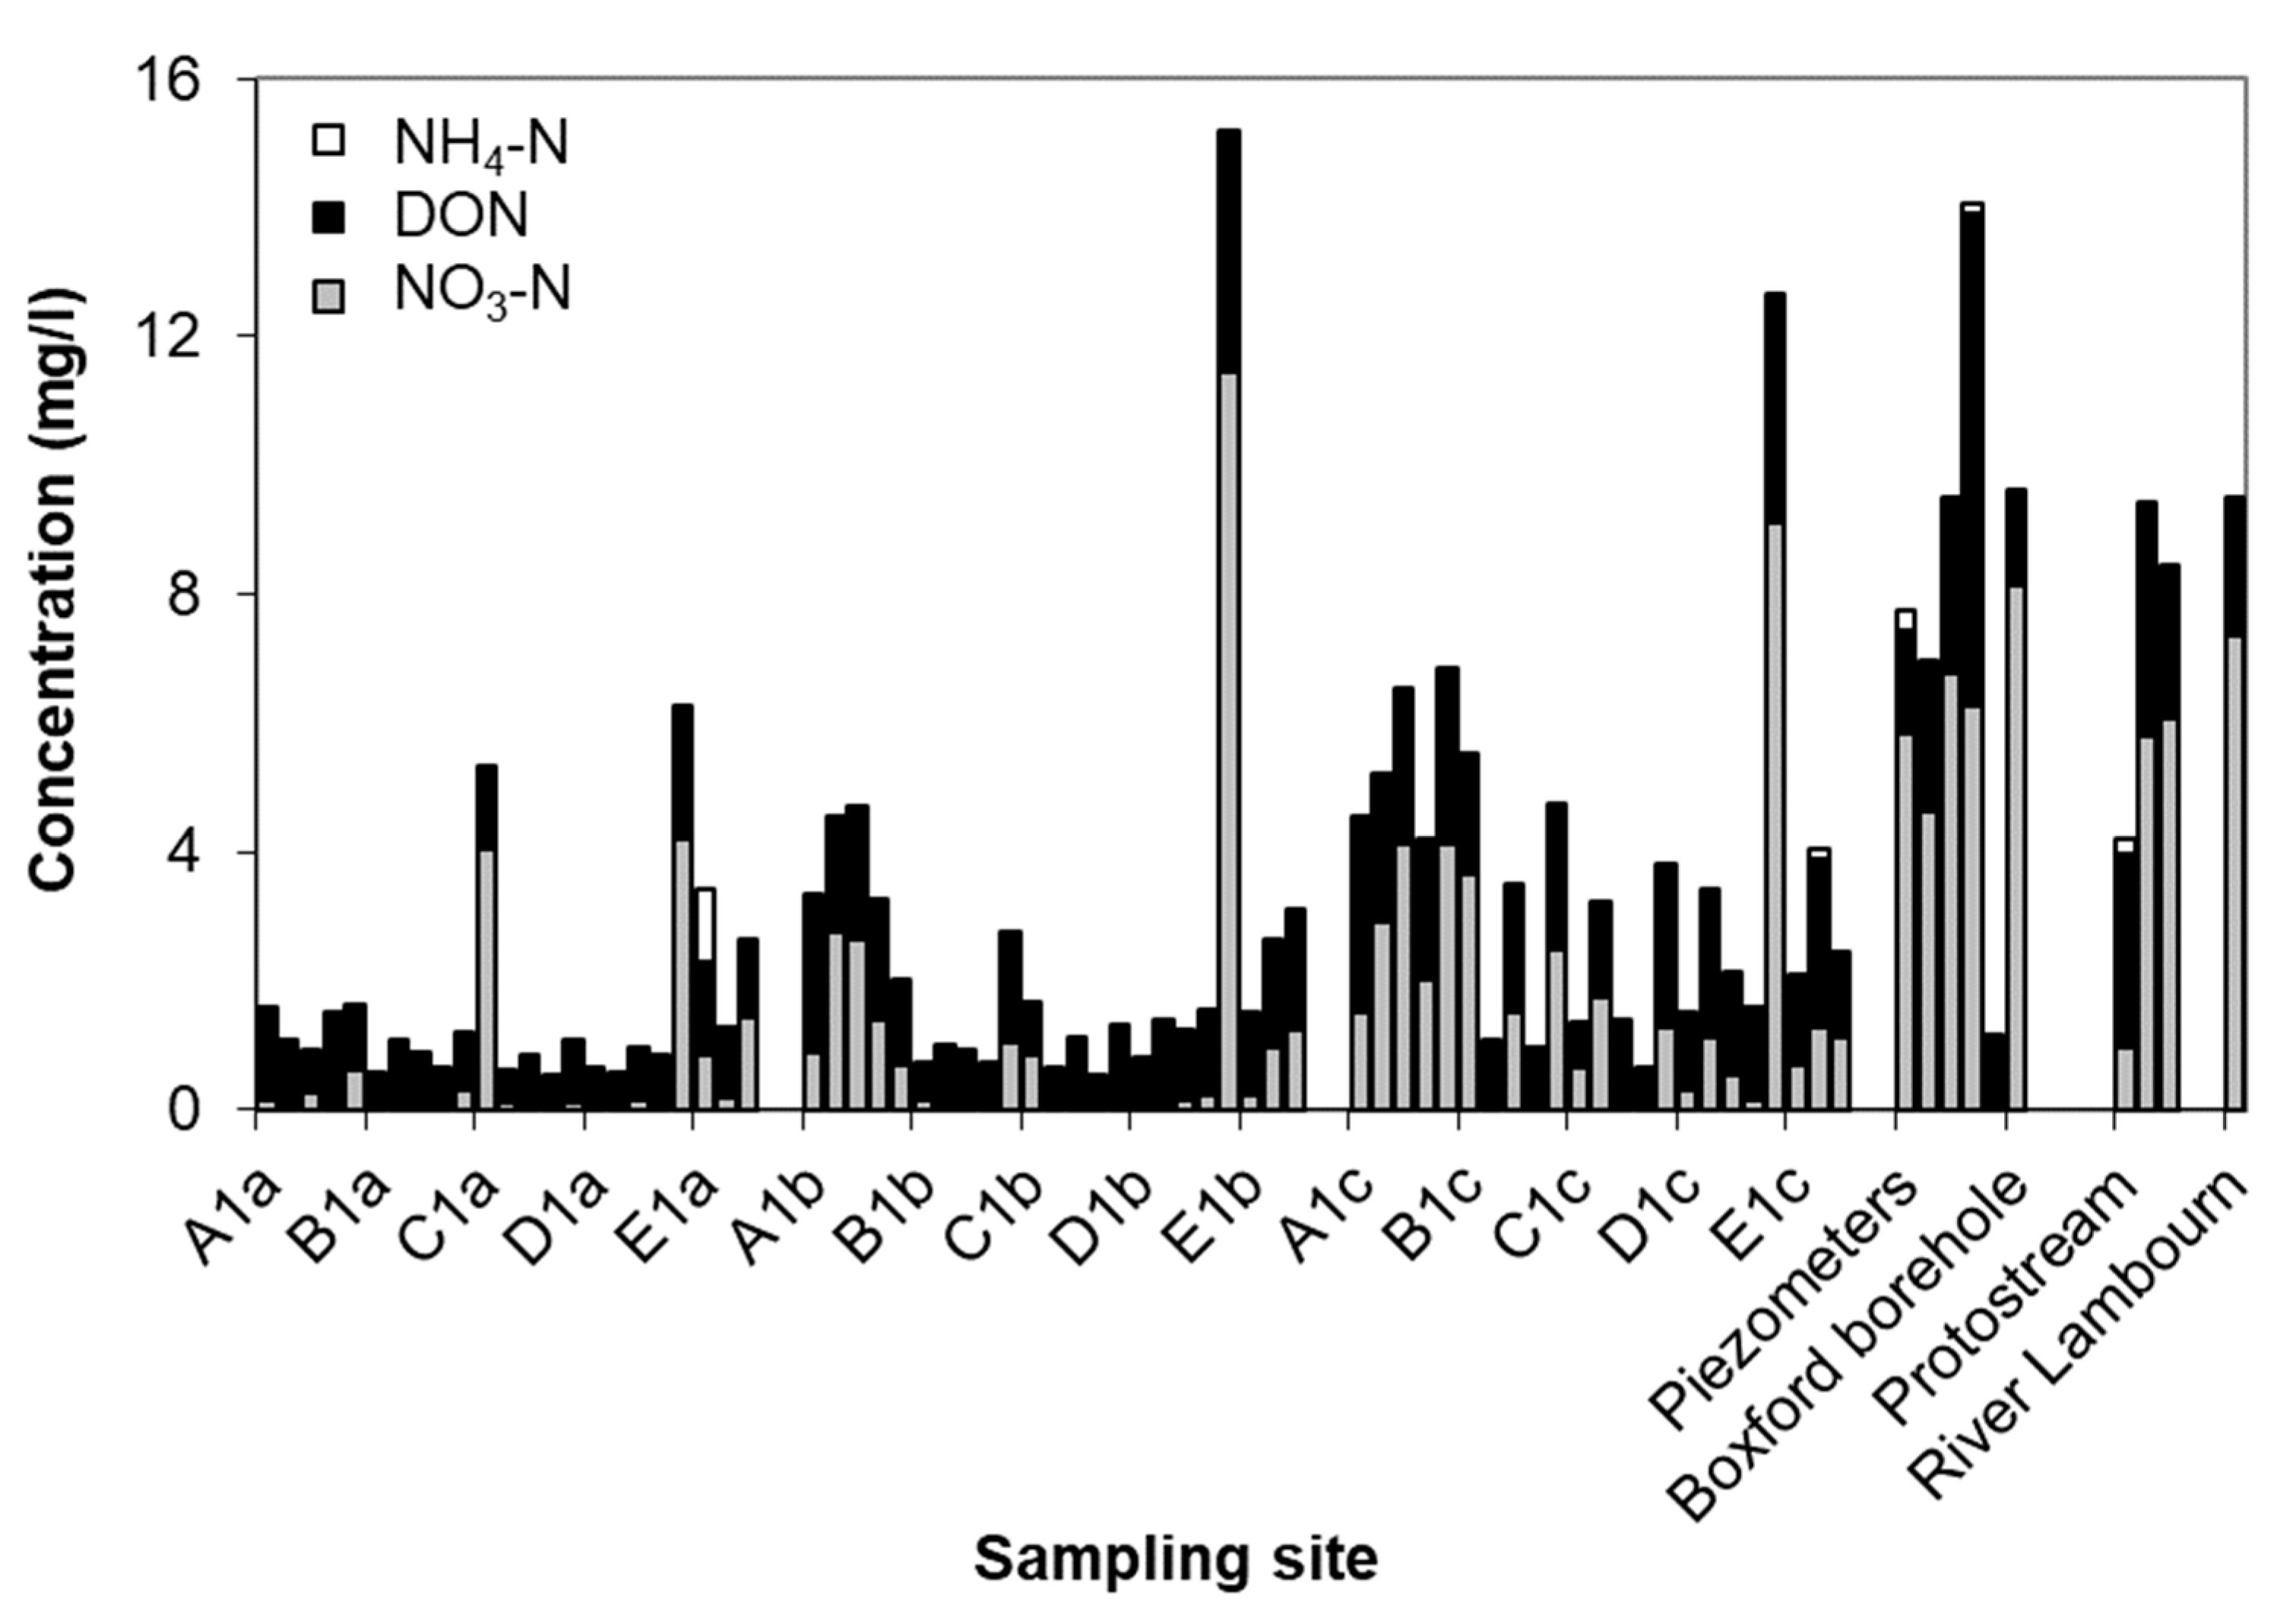
  • Groundwater nutrient chemistry is predominantly in the form of nitrate, with a mean concentration of 9 mg/L nitrate (NO3-N) and 1.5 mg/L DON in the Boxford borehole over the period 16 September 2003 to 16 January 2005. Similar chemistry is evident in the proto-stream, the River Lambourn and the piezometers at 2–3.5 m below the wetland. The data suggest that all of these sites share a similar source, and it is likely that they are all recently derived from groundwater sources.
  • Mean DON concentrations in the River Lambourn, the piezometers and the proto-stream all show some enrichment over the 1.5 mg/L DON recorded at the Boxford borehole adjacent to the wetland, and this is likely to reflect mixing of groundwater with enriched soil porewaters draining from the wetland under baseflow conditions, and/or biogeochemical cycling within the River Lambourn [5,36,37,38].
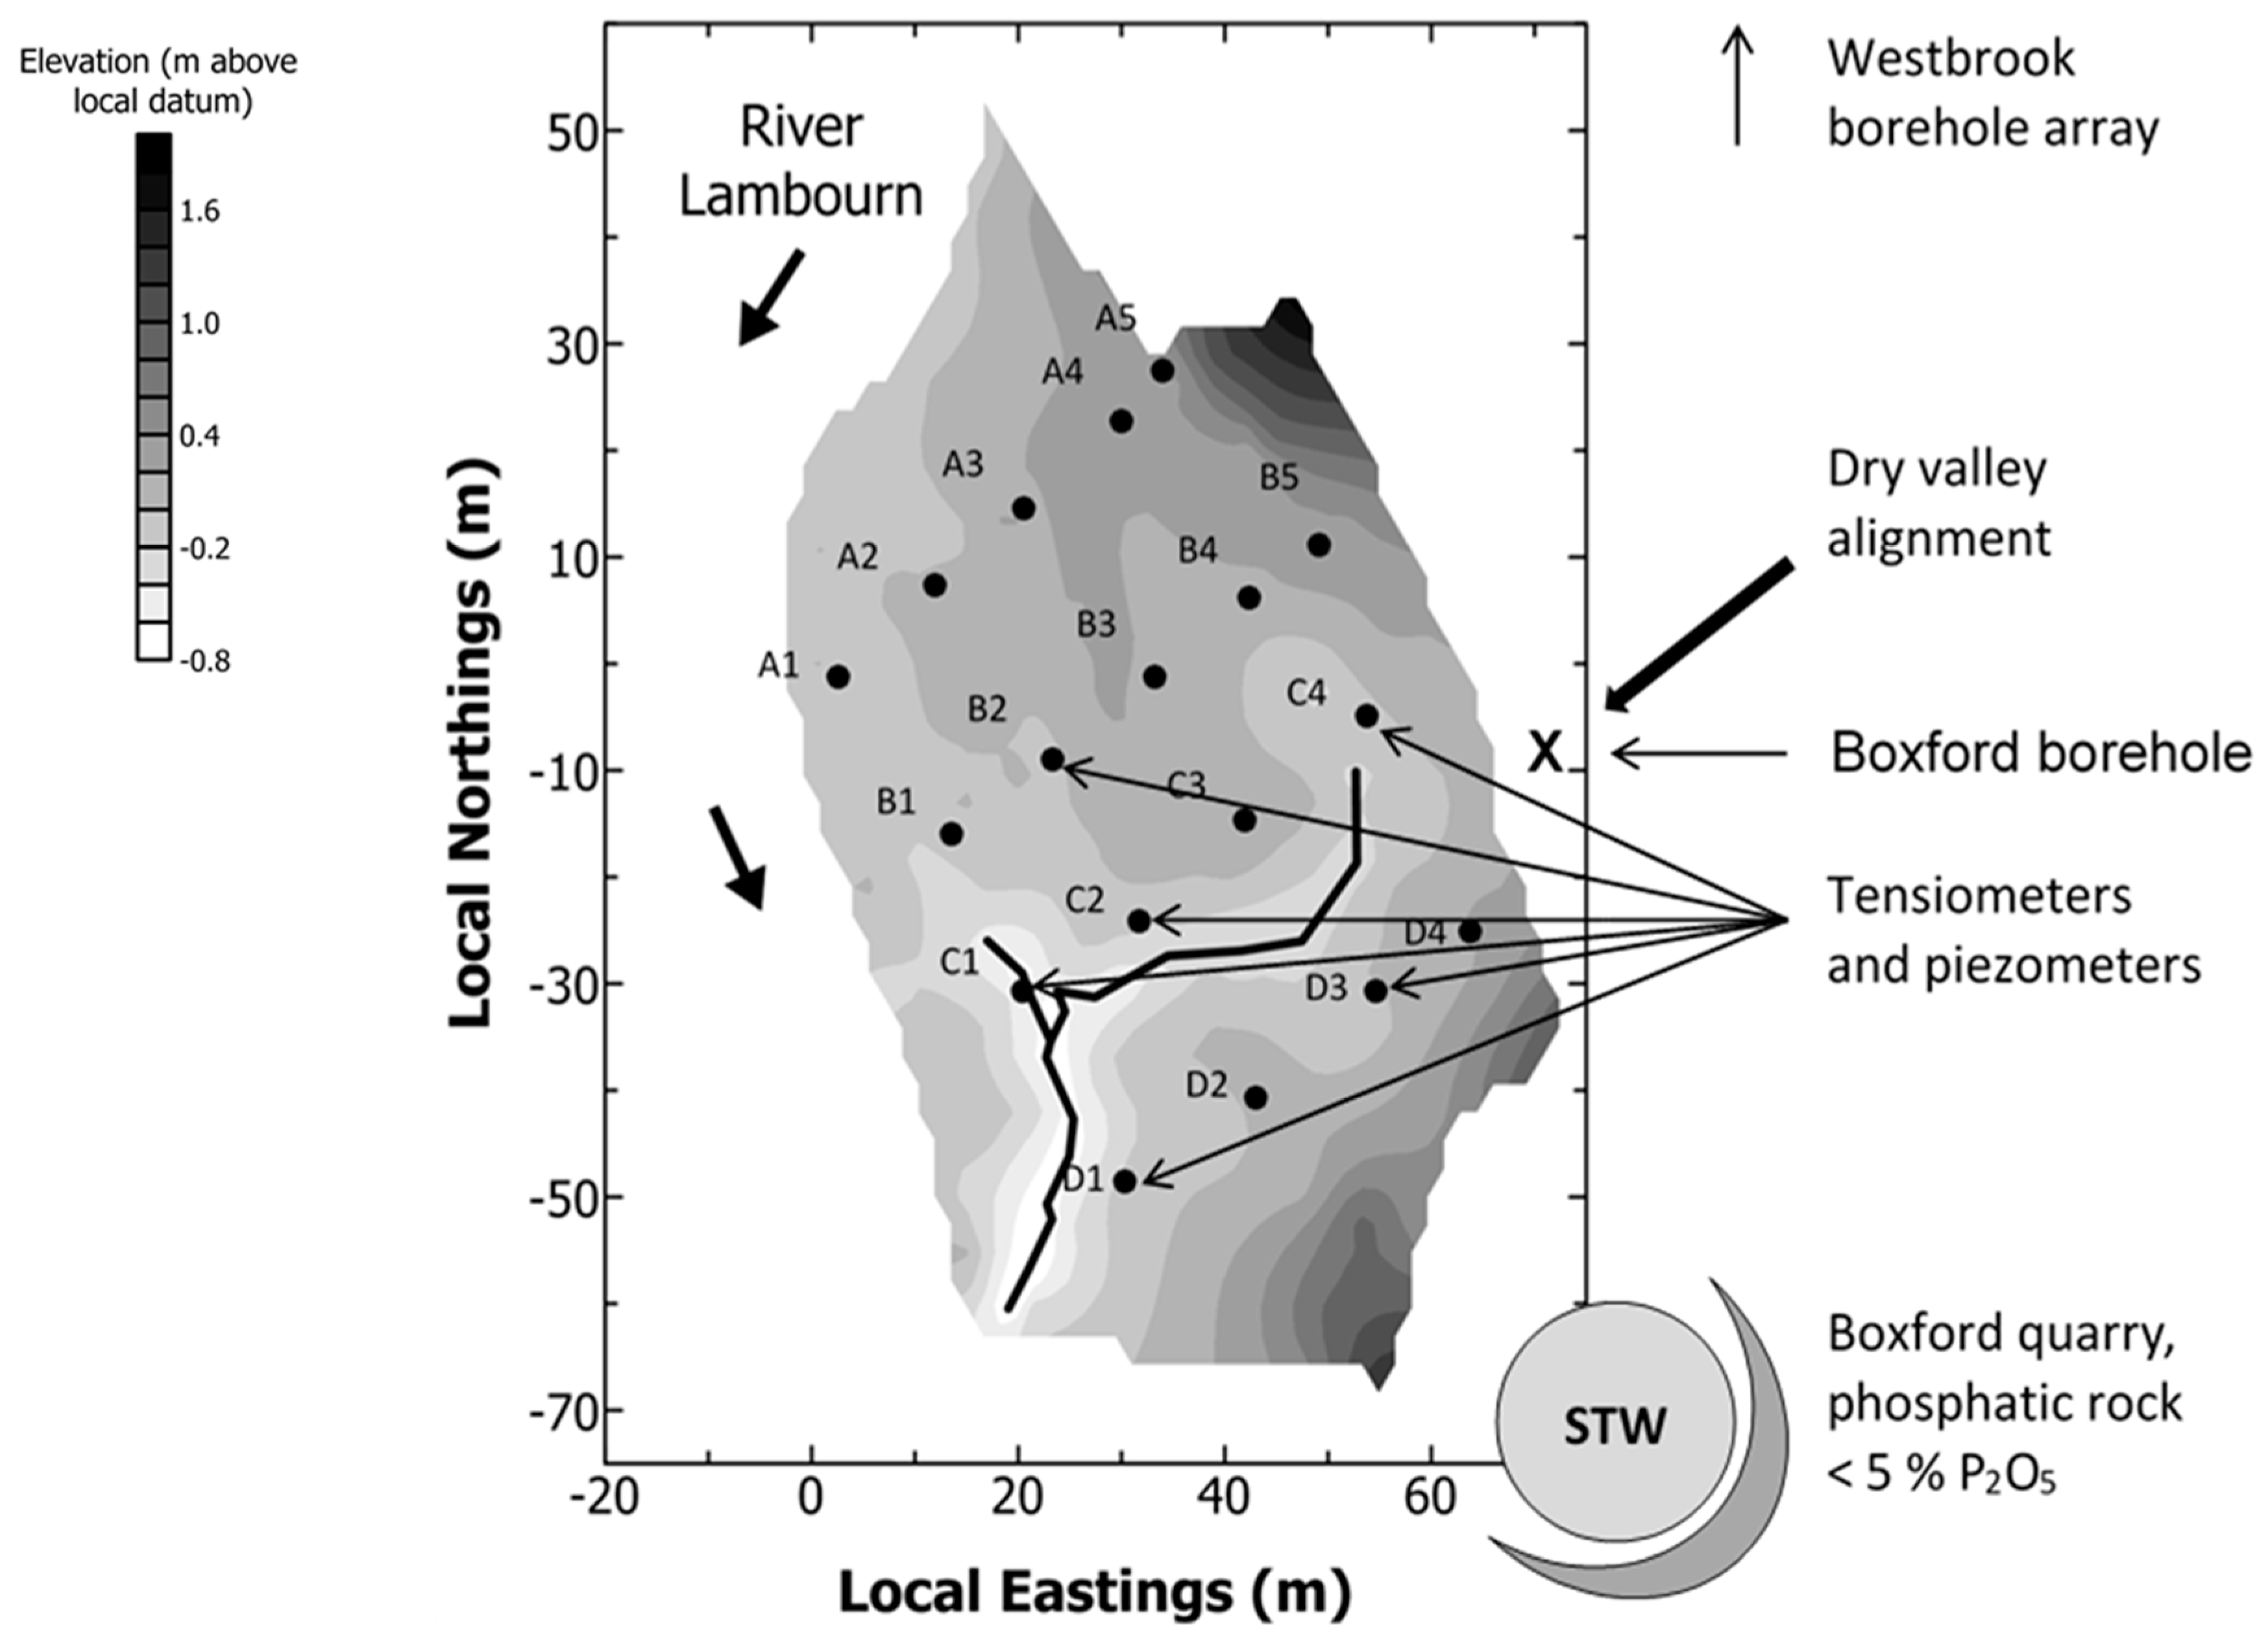
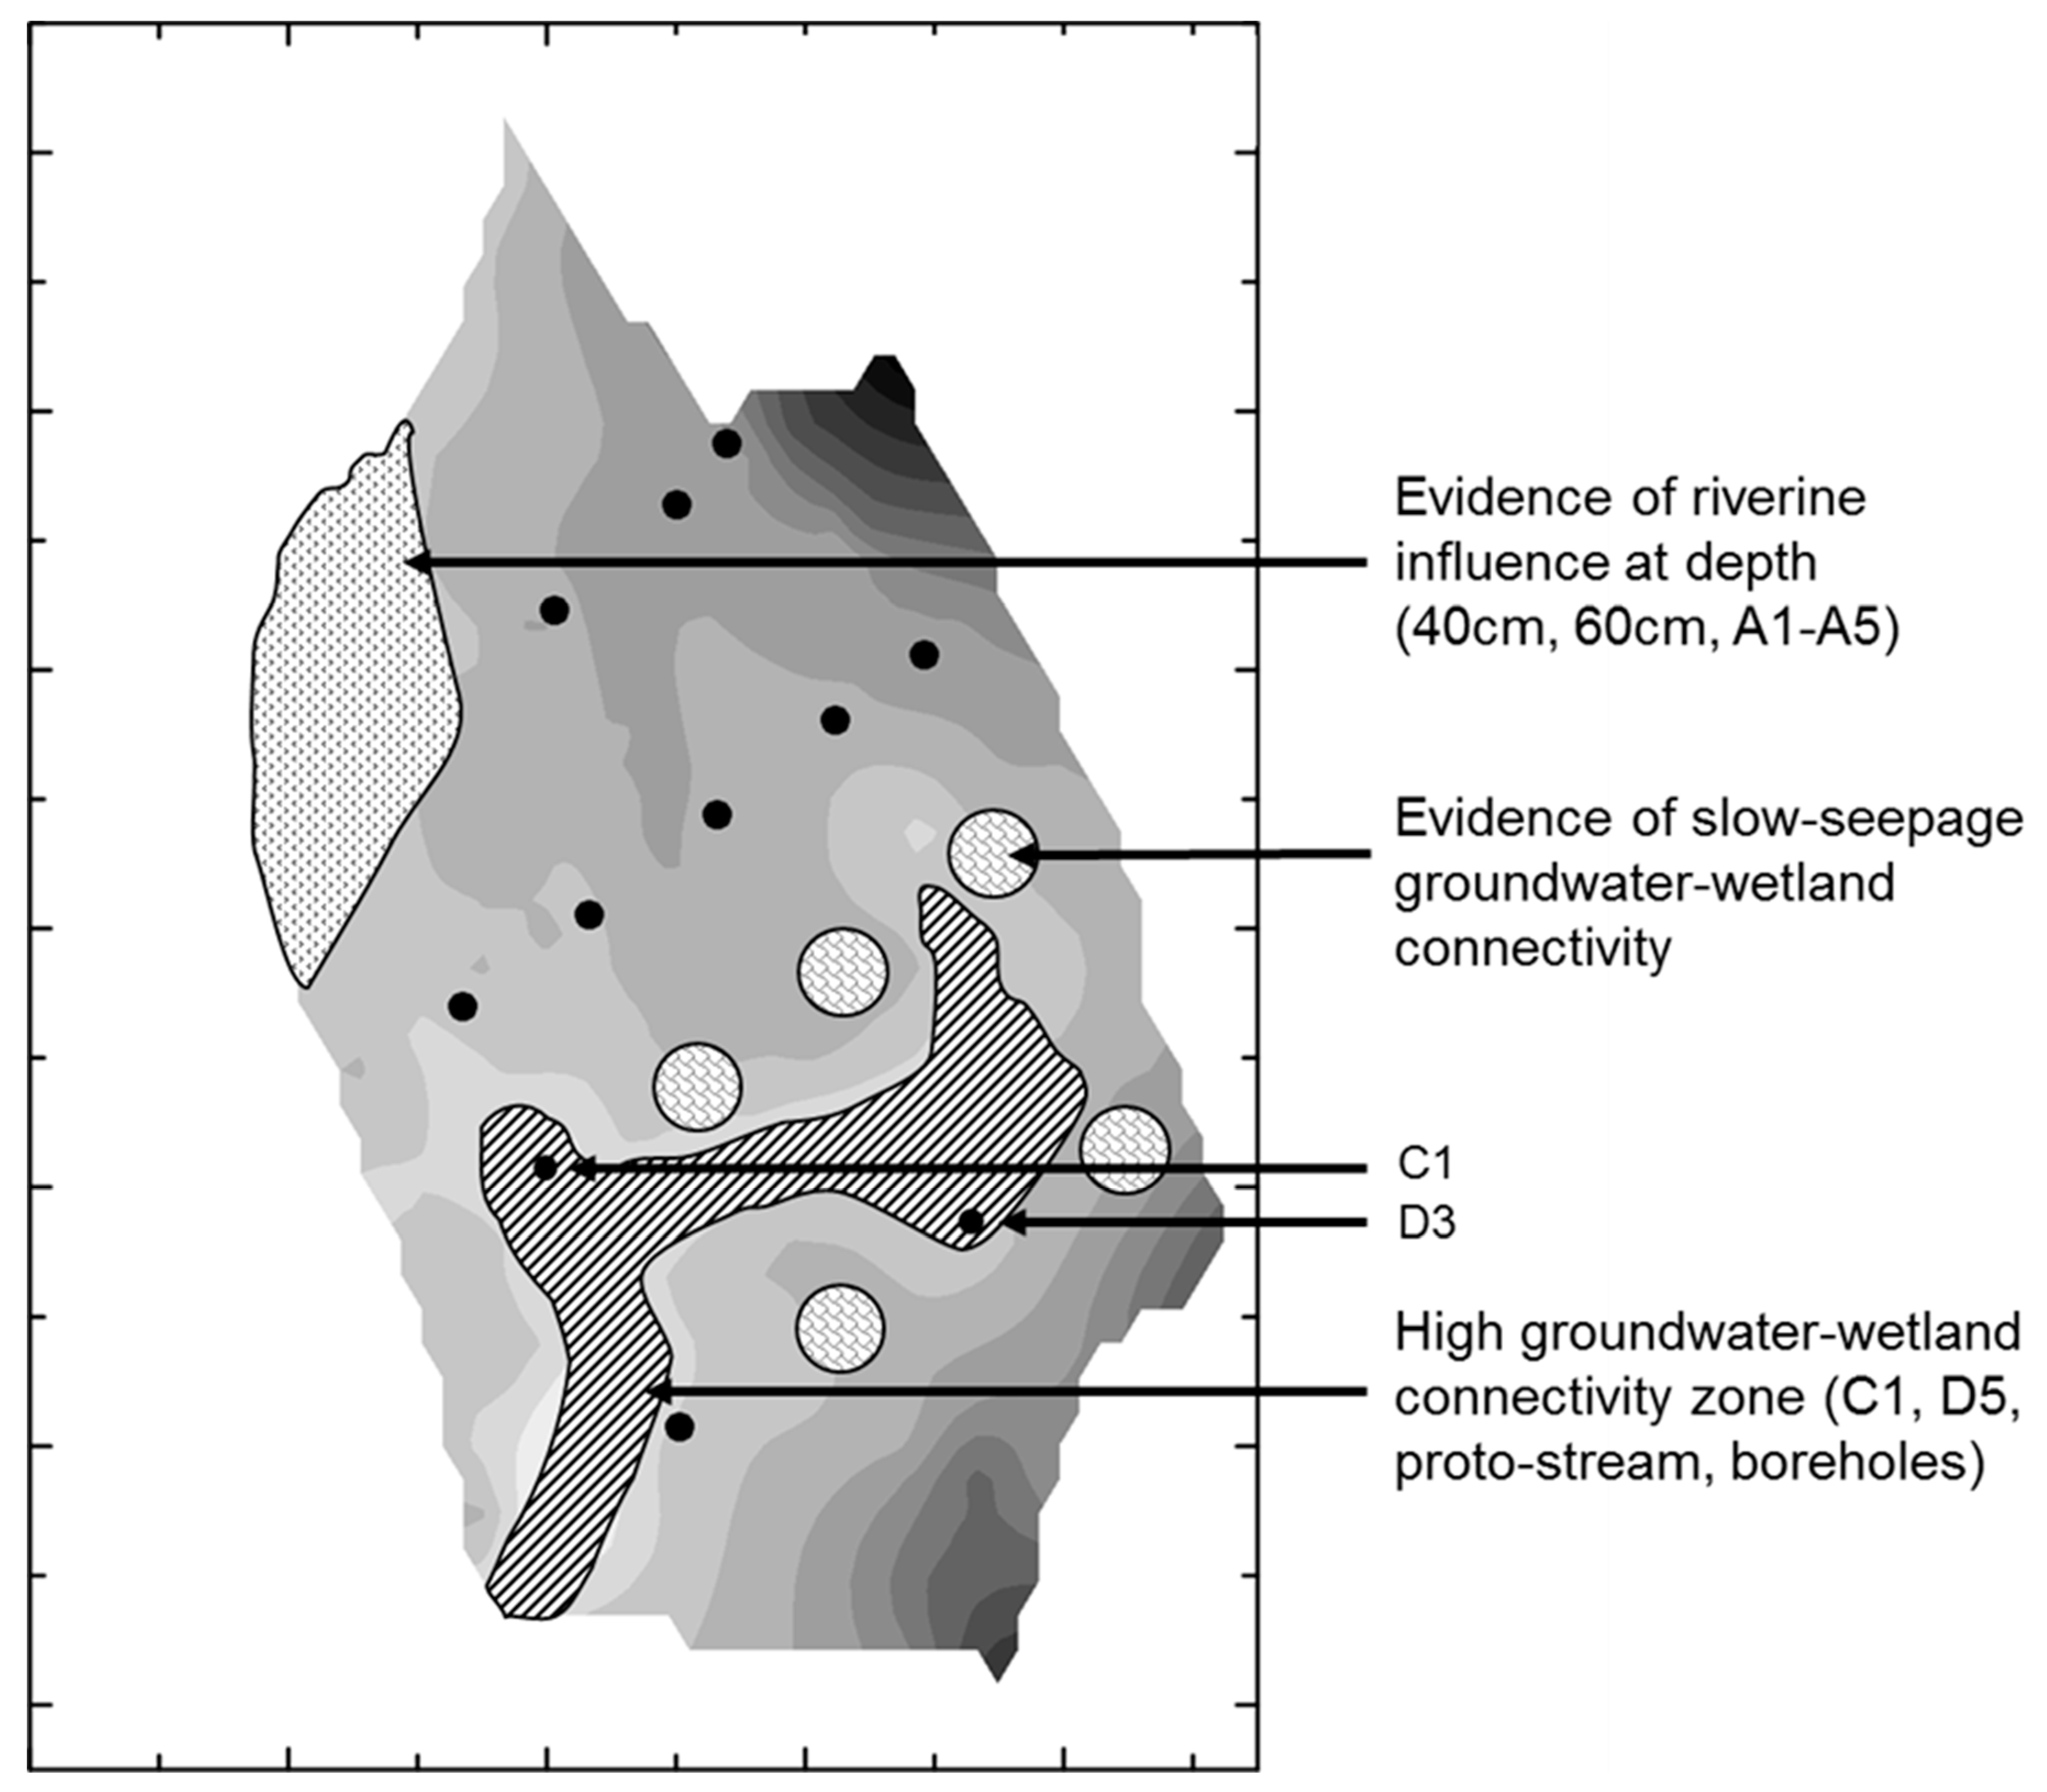
  • Samplers within the wetland soil matrix which are very close to the proto-stream channel also share this chemistry, notably those at C1 (20 cm), and at all three depths at D5. Sampler nest D5 is very close (<5 m) to the Boxford borehole, and lies outside the wetland proper, in the line of blackthorn scrub at the margins of the site. It may be that this indicates shared source water with that sampled from the borehole.
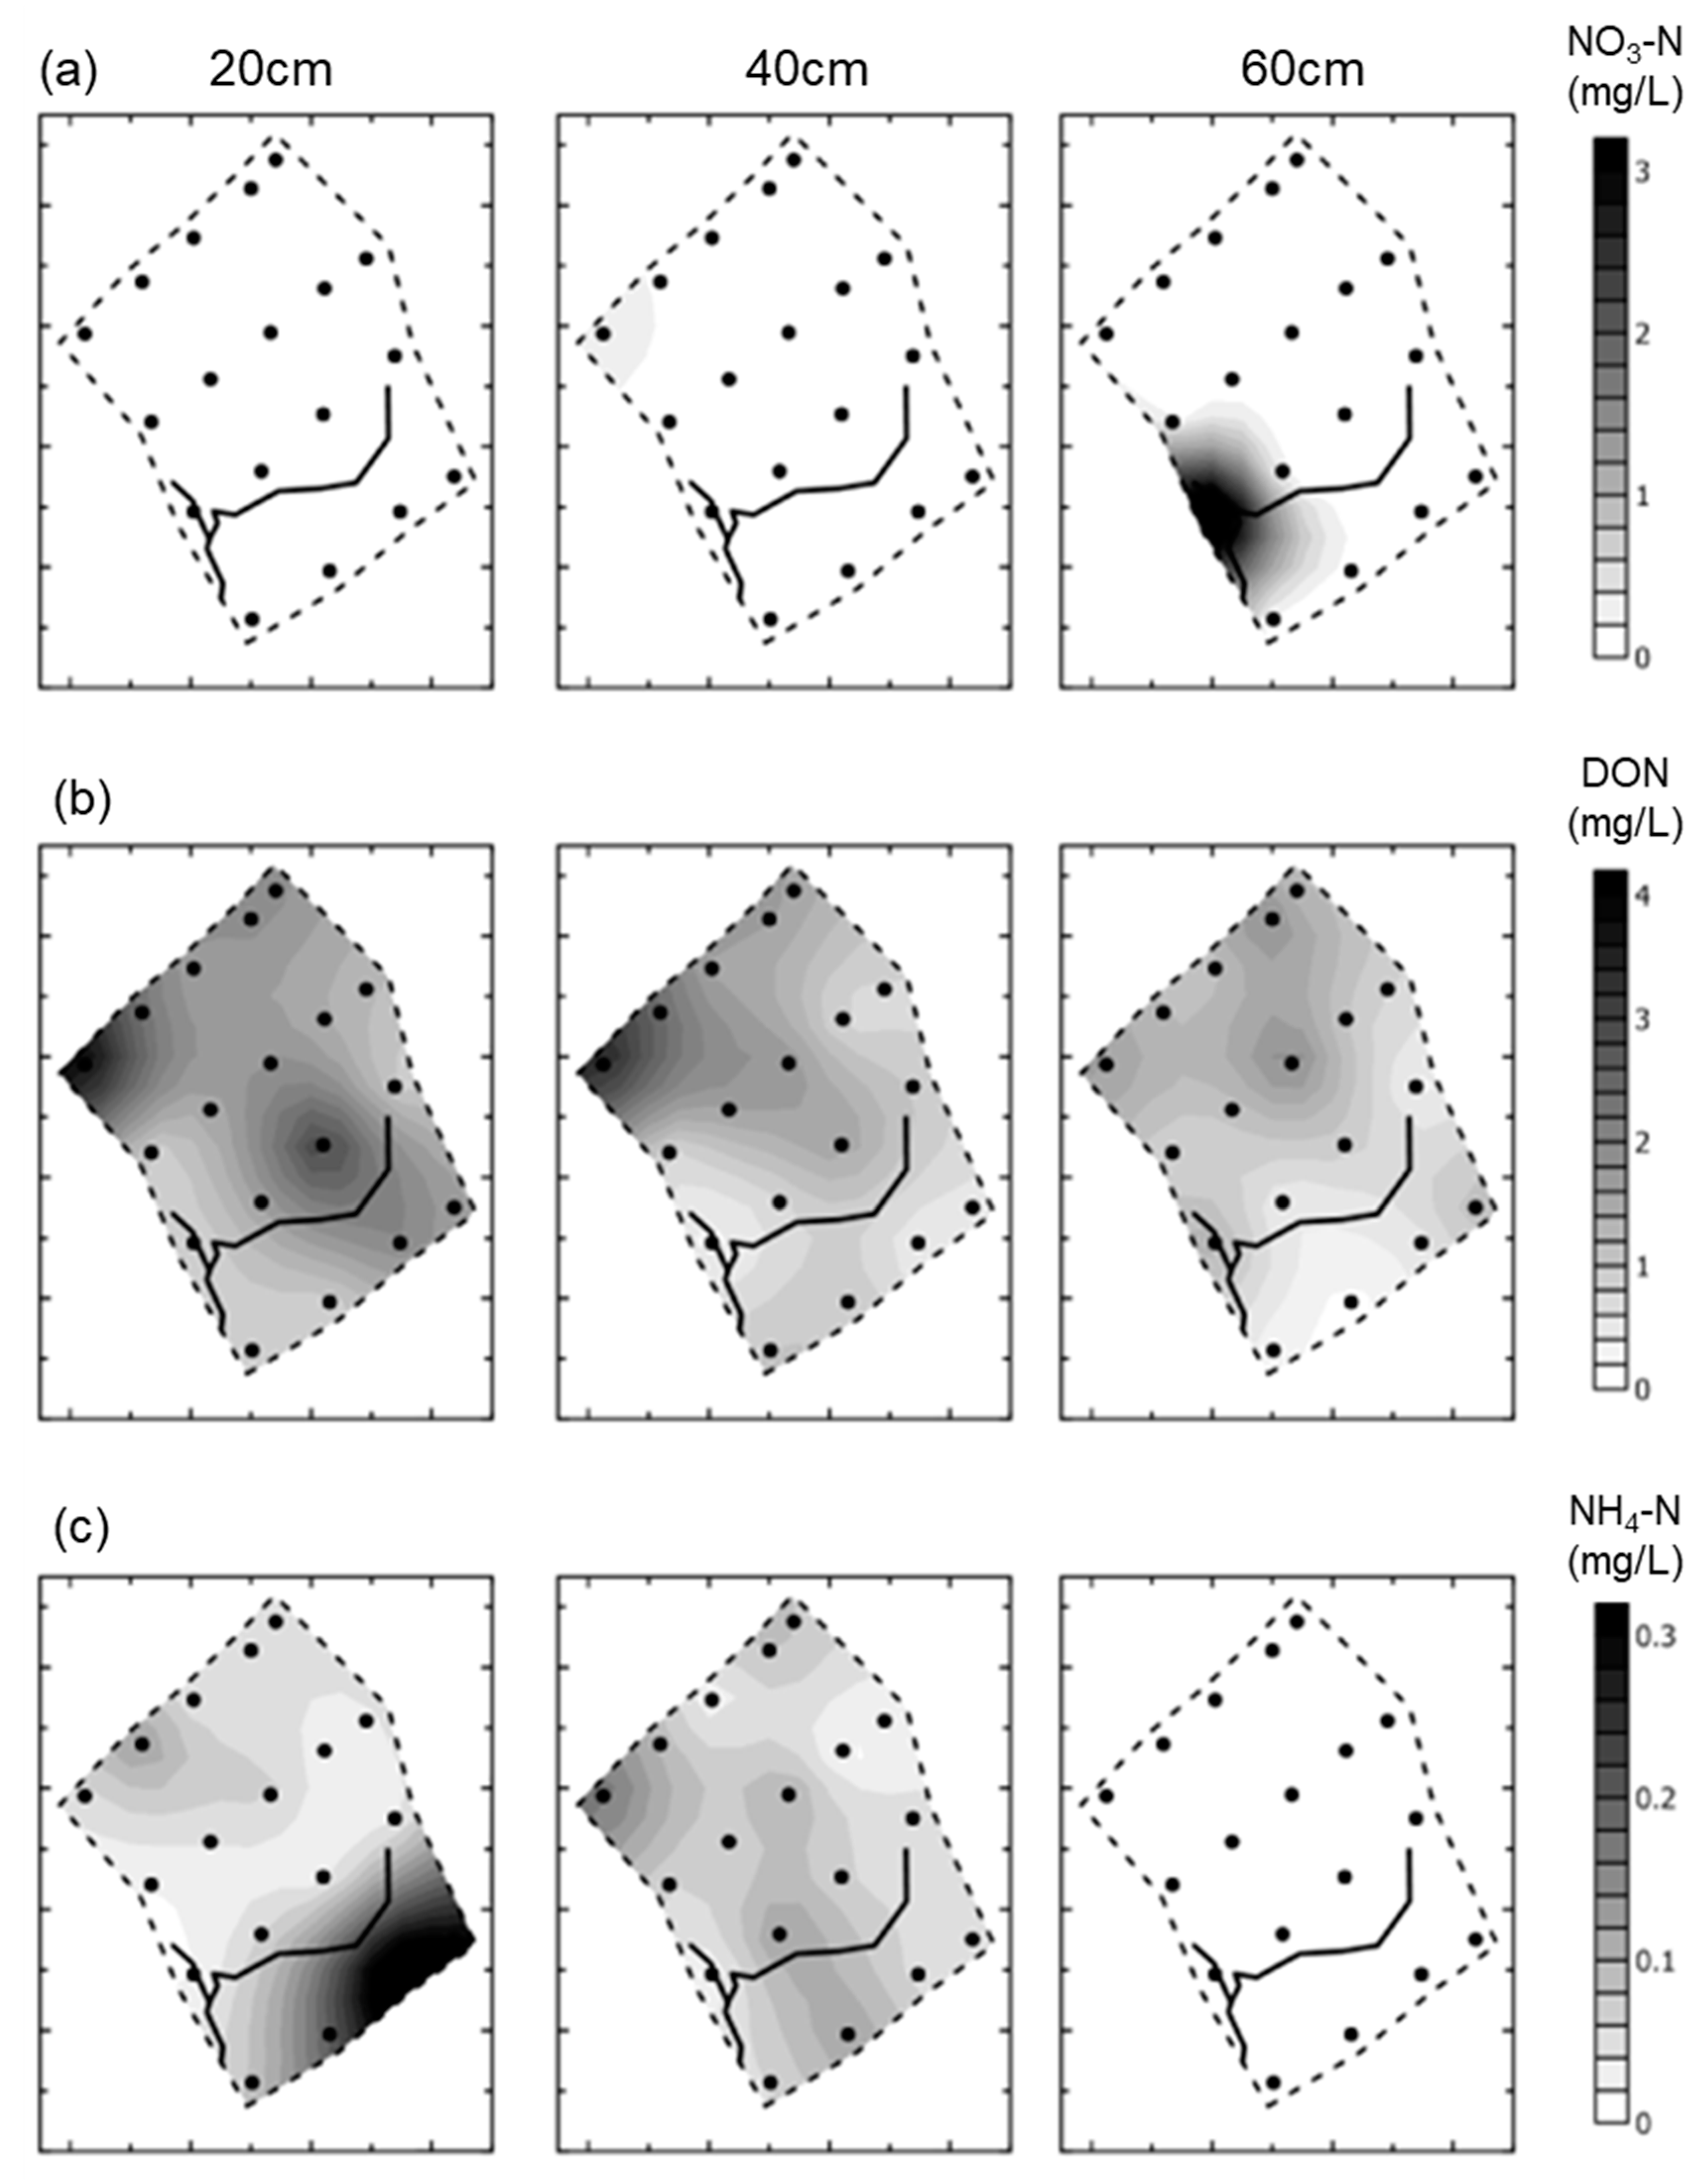
  • Samplers further from the proto-stream channel, with a longer hydraulic residence time, show depletion of inorganic N under baseflow conditions, and this is likely to reflect both plant uptake and gaseous N loss through denitrification.
  • These samples also show enrichment with DON concentrations up to a maximum of 4 mg/L.
  • Samples collected at 60 cm depth along transect A show a chemistry similar to that of the adjacent River Lambourn, with a notable increase in nitrate concentrations from 20 to 60 cm depth at all stations along this transect. This may reflect riverine incursion from the Lambourn.

3.2. Identifying Biogeochemical Cycling Hotspots Using Isotope Geochemical Analysis

The extent to which these patterns could be explained by faster flushing through the proto-stream channel corridor and denitrification in the wetter parts of the wetland was explored using isotope geochemical analysis of wetland soil porewaters, river water and groundwater samples and plant material collected from the site in October 2004. The δ15N and δ18O values for nitrate in water samples are presented in Table 2 and Figure 10. There are no data for the porous cup samplers, where low nitrate concentrations combined with low water volumes resulted in insufficient nitrate for analysis by the silver nitrate method. Future studies employing these types of samples would benefit from using the ‘denitrifier’ method of nitrate analysis, which requires much smaller samples [66].
Water samples from the Westbrook borehole array yielded nitrate with consistent isotope composition averaging δ15N = +4.0 ± 0.2‰ (1 SD) and δ18O = +3 ± 2‰; the Boxford borehole adjacent to the wetland yielded groundwater of identical composition (Table 2). Waters sampled from three piezometers and two positions on the proto-stream also exhibited a consistent isotope composition, δ15N = +4.7 ± 0.2‰ (1 SD) and δ O = +3 ± 1‰ (Table 2). Their δ15N values are therefore only very slightly higher than (and their δ18O values unchanged from) those of the groundwater samples.
The δ15N values for plants are shown in Figure 10. Leaves from three individual Phalaris arundinacea plants were collected at 16 positions across the wetland close to porous cup nests, and at three sites along the margins of the river. Values were again consistent, with no evidence of any spatial pattern across the wetland (Figure 10), and no significant difference between the wetland (average δ15N = +5.9 ± 1.0‰ (1 SD)) and river margin (average δ15N = +5.4 ± 2.1‰).
The δ15N values of the groundwater are within the range typical for non-denitrified nitrate in chalk aquifers [67] and Heaton, unpublished data. The δ18O values are also what would be expected for unmodified nitrate originating from bacterial nitrification in soils through which the waters recharge [68]. Thus, if the stoichiometry of nitrate formation derives two thirds of the oxygen from H2O (average δ18O value of water in the Westbrook borehole array = −7.2‰ and one third from atmospheric O218O = +24‰ [69], we expect a nitrate δ18O value of (⅔× −7.2‰) + (⅓ × +24‰) = +3‰; which is the same as the average measured value for groundwater nitrate in Table 2. Given the consistency of the isotope composition of the groundwater nitrate samples in Table 2, and the relatively homogeneous nature and long residence time of groundwater, we assume that δ15N = +4.0‰ and δ18O = +3‰ are representative of the values for groundwater nitrate input to the wetland over the study period. The wetland piezometer and proto-stream waters analysed had essentially identical δ18O values, and δ15N values only 0.7‰ higher, suggesting that these were derived from proximal groundwater sources, rather than biogeochemically processed wetland or riverine waters.
During denitrification the reaction of nitrate molecules containing the lighter isotopes 14N and 16O, is kinetically favoured, resulting in the remaining nitrate becoming enriched in the heavier isotopes. In a well-mixed system, therefore, denitrification results in the δ15N and δ18O values of the remaining nitrate increasing above the values of the initial nitrate, and such patterns have formed the basis for identifying denitrification in a wide variety of studies [68,70,71].
In vivo estimates of isotope fractionation for nitrogen (εN2 NO3 ≈ δ15NN2−δ15NNO3) typically range from −25‰ to −5‰ [72]. From the relationship:
δ15NNO3 = δ15N0 + εN2 NO3 × ln (f)
where δ15NNO3 and δ15N0 are the δ15N values of the remaining and initial nitrate, and f is the fraction of remaining nitrate, it can be shown that loss of only 13% of nitrate by denitrification (i.e., f = 0.87) would lead to an increase in the δ15N of the remaining nitrate by +0.7‰ (εN2 NO3 = −5‰) to +3.5‰ (εN2 NO3 = −25‰). As εN2 NO3 is very rarely less than −5‰ (in terms of its absolute value), the 0.7‰ difference between the δ15N value of nitrate in the groundwater and the wetland samples, if it was due to denitrification, would imply that the amount of denitrification was not more than 13%.
Because the isotope data for wetland nitrate was based on relatively few samples, δ15N analyses of Phalaris arundinacea were used as a proxy indicator of the pattern of nitrate δ15N over a wider area of the wetland. While some isotope fractionation may occur during the uptake of nitrogen, it is probably small in an environment where N is somewhat limited [73]. The uniformity of Phalaris arundinacea δ15N values across the wetland therefore suggests that the isotope composition of nitrate is also relatively uniform, with no evidence for regions of higher δ15N which might be indicative of denitrification. It must of course be born in mind that these plant δ15N values will reflect those of the water at the rooting depth only and, especially important, the values are an integration of the δ15N values of those waters over the period of growth of the plant’s uppermost leaves and are, therefore, reflective of conditions in the rooting zone over the full growing season. In this sense, they provide a simpler and more integrated assessment of denitrification in the rooting zone than if samples had been infrequently collected directly from the soil water pool.
Thus, the isotope characterisation approach indicated that δ15N and δ18O values of nitrate from a small number of wetland water samples were very similar to those of the local groundwater, with δ15N suggesting that any denitrification would have been minor (≤13%). This may be a function of short residence times of oxidising groundwater as it discharges through the soil zone. Plant δ15N also showed no evidence for significant denitrification over the course of the growing season, providing an integrated assessment of this process that was less time consuming, less costly and less invasive than an analysis of high-frequency samples collected from porous cup samplers across the wetland. However, these conclusions must be tempered by realisation that episodic denitrification would not have been detected using this approach.

3.3. Developing a Conceptual Model of Wetland Biogeochemical Function under Baseflow versus Stormflow Conditions

A range of sources of information can be drawn together to interpret the trends in this analysis of hydrochemical wetland function under baseflow conditions. These include the baseflow geochemistry and nutrient hydrochemistry data, the known nutrient uptake behaviour of the wetland plant community, the geophysical data providing a structural framework, and the observations of water level fluctuations across the site. Taken together it is possible to generate a conceptual model of the sources of water draining through the wetland under baseflow conditions. This is outlined in Figure 11.
Under baseflow conditions this study suggests that the wetland is largely groundwater fed, with a significant proportion of groundwater bypassing the biogeochemically active wetland soil matrix and running NE to SW through the proto-stream channel to discharge to the River Lambourn. The proto-stream channel chemistry and isotope geochemistry suggests that under baseflow conditions there is only slight transformation of groundwater geochemistry and nutrient chemistry along this preferential flow pathway, resulting from the drainage of DON and DOP rich porewaters from the rest of the wetland site to this channel and/or the hyporheic zone beneath the wetland. This is most likely to be due to the short residence time of groundwater in the soil as it discharges to the proto-stream. This may also be enhanced by the large areas of unsaturated soils away from the proto-stream where nitrate will remain stable in the presence of oxygen.
The porous cup sampler chemistry from sites with a higher hydraulic residence time indicate that the wetland has the capacity to transform the inorganic nutrient chemistry and geochemistry of source waters (groundwater), with depletion of inorganic N and SRP fractions. However, it is also apparent that these fractions are not simply lost from the system. Rather, there is substantial evidence of reduction in nitrate concentrations resulting from assimilation and uptake by the plant community and release back to the porewaters under baseflow conditions in the form of DON, following microbial decomposition of DOM within the rooting zone. The SRP is similarly cycled, transformed and stored within the micro and macropores in the form of DOP.
These conclusions can be drawn for the site under baseflow conditions. However, as site hydrology is clearly important in influencing these trends, it can be postulated that as the site undergoes rapid hydrological fluctuations under extreme flow conditions the proportion of water entering the various wetland zones can be expected to vary, soil redox status is likely to change, and this is likely, in turn, to affect the nutrient cycling processes operating within the wetland and the speciation of the nutrient load, compromising the nutrient storage capacity of the wetland soil zone. This is illustrated in Figure 12 and Figure 13 which illustrate the rapid flushing of accumulated dissolved organic-rich N and P from porewaters under high flow (storm) conditions, with riverine discharge in the Lambourn increasing from 0.9 to over 1.5 m3/s over the course of the event [5].
These data represent the nutrient flushing response of the wetland to an intense and prolonged storm event sampled under wet and cold antecedent conditions, in the absence of active plant uptake, at the end of the autumn period (from 16 November 1996 to 23 November 1996). The storm event drove an increased flow into and through the wetland, with no over-bank inundation of the site, this being a rare occurrence in permeable lowland catchments in the UK with a high baseflow index (BFI). The River Lambourn had a BFI of 0.98 at Boxford during the period of study [36].
TDP concentrations (DOP + SRP) rose fourfold across the site from a maximum of 0.7 mg/L at the start of the storm to over 3.0 mg/L at the height of the flushing event on 19 November 96 (Figure 12). There is evidence that the highest concentrations of TDP were observed moving along the line of the proto-stream channel with the highest concentrations observed in the 20–40 cm samplers, largely in the form of DOP (data not presented). TDN concentrations (TON + NH4-N + DON) presented in Figure 13 showed a clearer pattern, with concentrations rising fivefold from a maximum of 3 mg/L N to over 16 mg/L N at the peak of the flushing event (19 November 1996). Over 90% of the flux was in the form of DON (data not presented). Note that the scale changes on the plots over the duration of the event. A clear pattern emerges from these data, with nitrate rich water entering the site along the alignment of the dry valley, and DON enriched water flushing from the site to the River Lambourn along the line of the proto-stream channel.
These data, and other data collected from the site under a range of storm flow conditions in the spring and autumn period, 2004 (not presented here) confirm the conclusions reached in the earlier study at this site regarding the source/sink function of these lowland permeable wetlands [5]. Under baseflow conditions the wetland is groundwater fed, with most of the water bypassing the nutrient transformation function of the site by flowing along preferential flow pathways including the proto-stream channel. For groundwater entering the wetland soil matrix, there is evidence of rapid transformation and storage of both nitrate and SRP in the plant biomass, in particulate form, and in the form of DON and DOP in the wetland soil micropores and macropores following microbial decomposition of dead organic matter from the plant and animal biomass in the wetland. Some nitrate is ‘lost’ from the wetland through the process of denitrification, as proposed in other studies on riparian wetlands, but by no means all of this load is ‘lost’. Rather, the wetland acts to attenuate the delivery of both N and P from the catchment to the river through transformation, uptake and storage in the biomass, soil and porewaters, at least for the waters which drain through the soil matrix. Under high flow events, however, particularly in the autumn and early spring, and under wet antecedent conditions, the wetland flushes these accumulated nutrient stores from the porewaters, and this is routed either vertically to the gravel layer, or laterally to the proto-stream channel and thence to the Lambourn where it contributes to the increased N and P concentrations instream reported previously [5,36,37,38].

4. Discussion

Wetlands in permeable catchments clearly act as biogeochemical cycling hotspots, zones of pollutant and flow attenuation, and temporary stores for nutrients exported from diffuse agricultural sources in the wider catchment. Placed at the base of the dry valleys and hillslopes as they are within the Lambourn catchment (and elsewhere across permeable landscapes of NW Europe), it is likely that they play an important role in regulating the rates, timing and speciation of the nutrient load delivered to the River Lambourn from its catchment. This is pertinent in many permeable catchments, where high nitrate concentrations in the unsaturated zone and groundwater will provide a legacy of nitrate inputs to surface waters for some time to come. However, the evidence from storm sampling of these systems must also be considered, notably the importance of residence time and connectivity in regulating the amount of groundwater flow which actually passes through these biogeochemical cycling hotspots. Similarly, the full range of nutrient species studied here demonstrates the importance in assessing all forms of N and P in these biogeochemically active systems. The evidence is clear that very little nitrate is actually ‘lost’ or ‘removed’ over the annual cycle. Rather, once the dissolved organic nutrient fractions are factored in, it is clear that the wetland acts to assimilate, breakdown and re-release inorganic nutrient fractions in the form of DOM, which is then flushed out to adjacent waters during high flow events. The process is one of transformation and attenuation, rather than removal or ‘loss’.
In interpreting these findings, it is clear that the combination of geophysical survey, and low-resolution sampling of porewater geochemistry, in combination with targeted isotope analysis of plant material in the wetland was able to clearly distinguish the key functional zones within the wetland. A separation of those wetter areas of the wetland likely to support denitrification, versus those with a longer contact time between nutrient load and the plant and microbial communities was clearly achieved. The findings map closely onto the key trends evident in the nutrient speciation data collected for the site under baseflow conditions. We argue, here, that this combination of approaches was able to diagnose the likely nutrient cycling, retention and export behaviour of the wetland, presenting a cost-effective method for catchment managers contemplating the use of riparian wetlands to ameliorate or transform nutrient flux from land to water.
It is also worth noting that the placement of the wetland systems within the wider hydrogeological framework of lowland permeable catchments must be born in mind when contemplating their potential role in catchments. This is illustrated in Figure 14.
While it is clear that they have the capacity to transform inorganic nutrient inputs to dissolved organic nutrient fractions stored within the wetland porewaters, this function only applies to that water which passes through the wetland soil matrix, primarily that passing through the rooting zone where assimilation is the dominant process. In reality, in permeable catchments much of the flow from the saturated groundwater zone to the river is likely to bypass these wetland systems, upwelling directly through the hyporheic zone to the bed of the river without passing through the wetland soil matrix. If this is the case then wetlands, despite their potential to transform and attenuate the nutrient chemistry and geochemistry signal from the catchment, may not realise this potential and may therefore play little part in the modification of nutrient flux from land to stream in permeable catchments. The Boxford wetland is a good exemplar for wetlands typically found in permeable catchments, and the findings from this programme provide a useful indication of the likely function of similar wetlands in other permeable catchments. However, further wetland research is needed at this scale in other geoclimatic regions to determine the extent to which this sporadic and spatially confined functionality is common to all or some wetland types.
The importance, then, of being able to identify subsurface architecture and its probable impact on wetland hydrological function and, in particular, to have tools capable of identifying dominant flushing behaviours through structures such as the proto-stream channel in the Boxford wetland is key to providing the capacity to upscale knowledge acquired from such in-depth research to larger tracts of wetland, or multiple wetlands within catchments. One approach to upscaling knowledge is through the development of coupled hydrological and biogeochemical models at the catchment scale, building the nutrient and flow attenuation properties of wetlands studied in detail into a wider system scale model. Once this is complete, it will be possible to simulate the hydrological and coupled hydrochemical function of these permeable wetlands and to test their significance by building them into catchment scale coupled surface-groundwater models.
An alternative approach is to evaluate the range of methods adopted in this study by comparing the information they yield against information gained from the high frequency sampling programme implemented at the site. Of the approaches tested, the HGMU method was the least sensitive, lumping the whole wetland zone into a single functional unit. The NVC vegetation mapping was more subtle, dividing the wetland proper into two zones representing plant communities with differing affinities to water logging. However, this too did not distinguish those areas of the wetland where soil redox status supported denitrification, from those where longer residence time supported the uptake, storage, breakdown and release of inorganic nutrient loads export from the wetland in the form of dissolved organic nutrient flux. The geophysical techniques adopted were useful in identifying an anomaly at the B2 sampler nest, later confirmed as a lens of putty chalk through the installation of a piezometer at that leading to a locally perched water table. It also identified the variable depth of the alluvial gravels across the site previously confirmed as an important feature supporting lateral and downstream transfer of water and its associated chemical load [39]. Perhaps more significantly, the geophysical survey methodology also confirmed the existence of the proto-stream channel morphometry as a feature of the subsurface architecture likely to promote preferential flow from land to stream through the wetland, assisting in the interpretation of nutrient flux behaviours both in terms of spatial variations across the wetland under baseflow conditions and flushing under storm flow conditions.
The geochemical characterisation of the site, in association with work on stable isotope ratios in plant, river, groundwater and waters sampled from the gravels underlying the wetland provided further detail. The determination of selected geochemical ratios helped to characterise the signature of the differing source areas contributing water to the wetland soil matrix, confirming the conceptual model of biogeochemical functional zones within the wetland derived from the high-frequency sampling and nutrient analysis programme, providing the potential to use a lower intensity of nutrient sampling in combination with geochemical analyses to derive a robust conceptual model of biogeochemical functioning for less well-resourced or multiple site investigations into wetland biogeochemical function in future. Finally, the isotope work was invaluable in providing, at a seasonally averaged scale, the evidence for the distribution of the denitrification function across the wetland, and in identifying the limited spatial extent of this function, at least for the period studied in this programme. Future studies, bringing together initial site assessment using a combination of geophysical, geochemical and isotopic characterisation are likely to be able to derive an initial conceptual model of biogeochemical and hydrological functional zones within complex wetlands, significantly reducing the need for costly and invasive high-frequency nutrient flux monitoring.
Such studies must consider the wider environmental and historical context for any site. Historical changes in land use may have impacted on the spatial extent of riparian wetlands along river channels, affecting the catchments ability to attenuate and transform nutrient export to rivers. Climate variability and change may also reduce wetland area and limit these natural attenuation processes, as demonstrated in this study in the differing functional behaviours of the wetland under baseflow versus stormflow conditions, and in the earlier work on the differing stormflow responses generated under wet versus dry, and cold versus warm antecedent conditions [5]. Certainly, there is no single and uniformly dominant wetland biogeochemical function across whole wetland systems. This will vary from wet to dry year, over the seasons, in relation to the history of nutrient enrichment of the site, and from year to year in response to climatic and groundwater flow variations. Careful consideration should be given to management options that consider rehabilitation of wetland areas, particularly considering the legacy of historical anthropogenic inputs of nutrients, much of which is still present in the unsaturated zone of aquifers, and in soil stores throughout catchments.

5. Conclusions

The combination of approaches adopted in this investigation of wetland biogeochemical function allowed an unusually detailed assessment for the Boxford experimental wetland. Key conclusions are as follows:
  • Attenuation of pollutant delivery from land to stream appears to occur both within the hyporheic zone and the adjacent riparian wetland ecosystem.
  • The primary pathway for modification of the nutrient speciation of inflowing waters is through plant uptake of inorganic nutrient species and microbiological breakdown of DOM to release DON and DOP compounds to soil porewaters.
  • The reciprocity in inorganic and organic nutrient fraction concentrations across the wetland suggests no net storage of nutrients within the soil porewaters, nor substantial net export of nitrogen to atmospheric sources through denitrification.
  • The primary mechanism for the export of nutrients accumulated in soil porewaters appears to be flushing of the macropores and micropores during storm events, with nutrient-rich waters exported primarily via the proto-stream channel, but also through lateral flow to the Lambourn and vertical exchange with groundwater through the alluvial gravels.
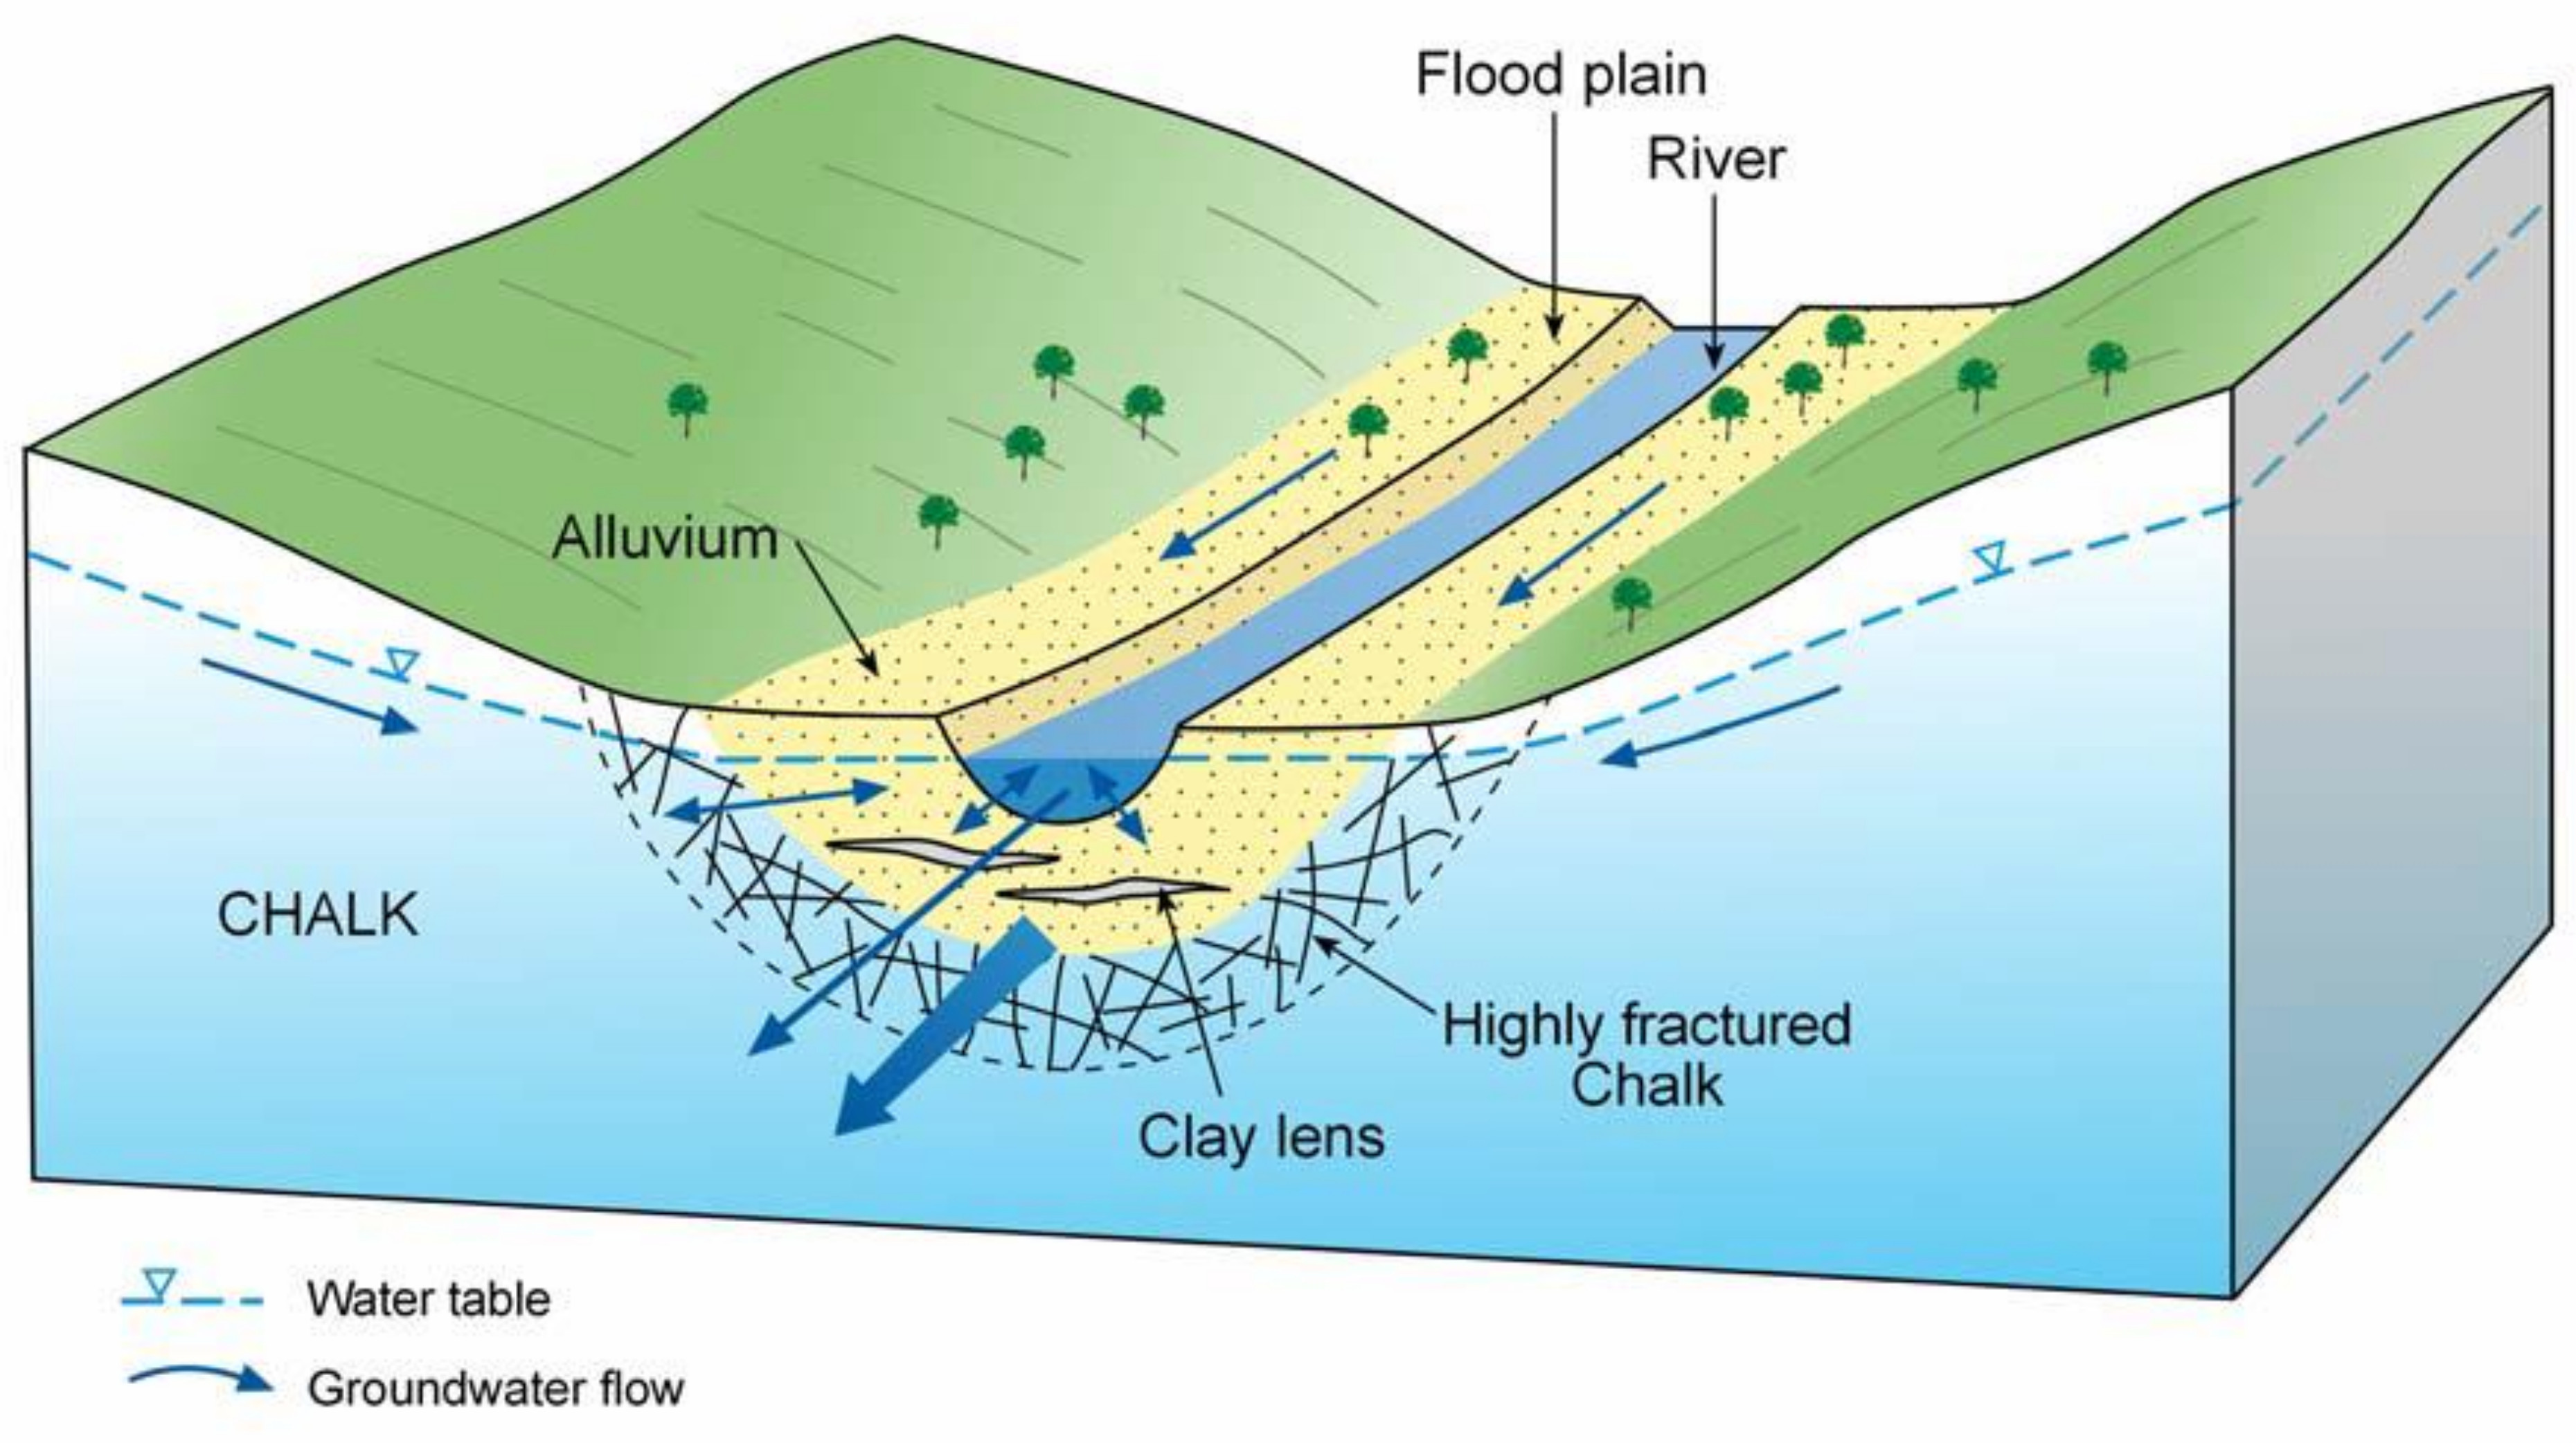
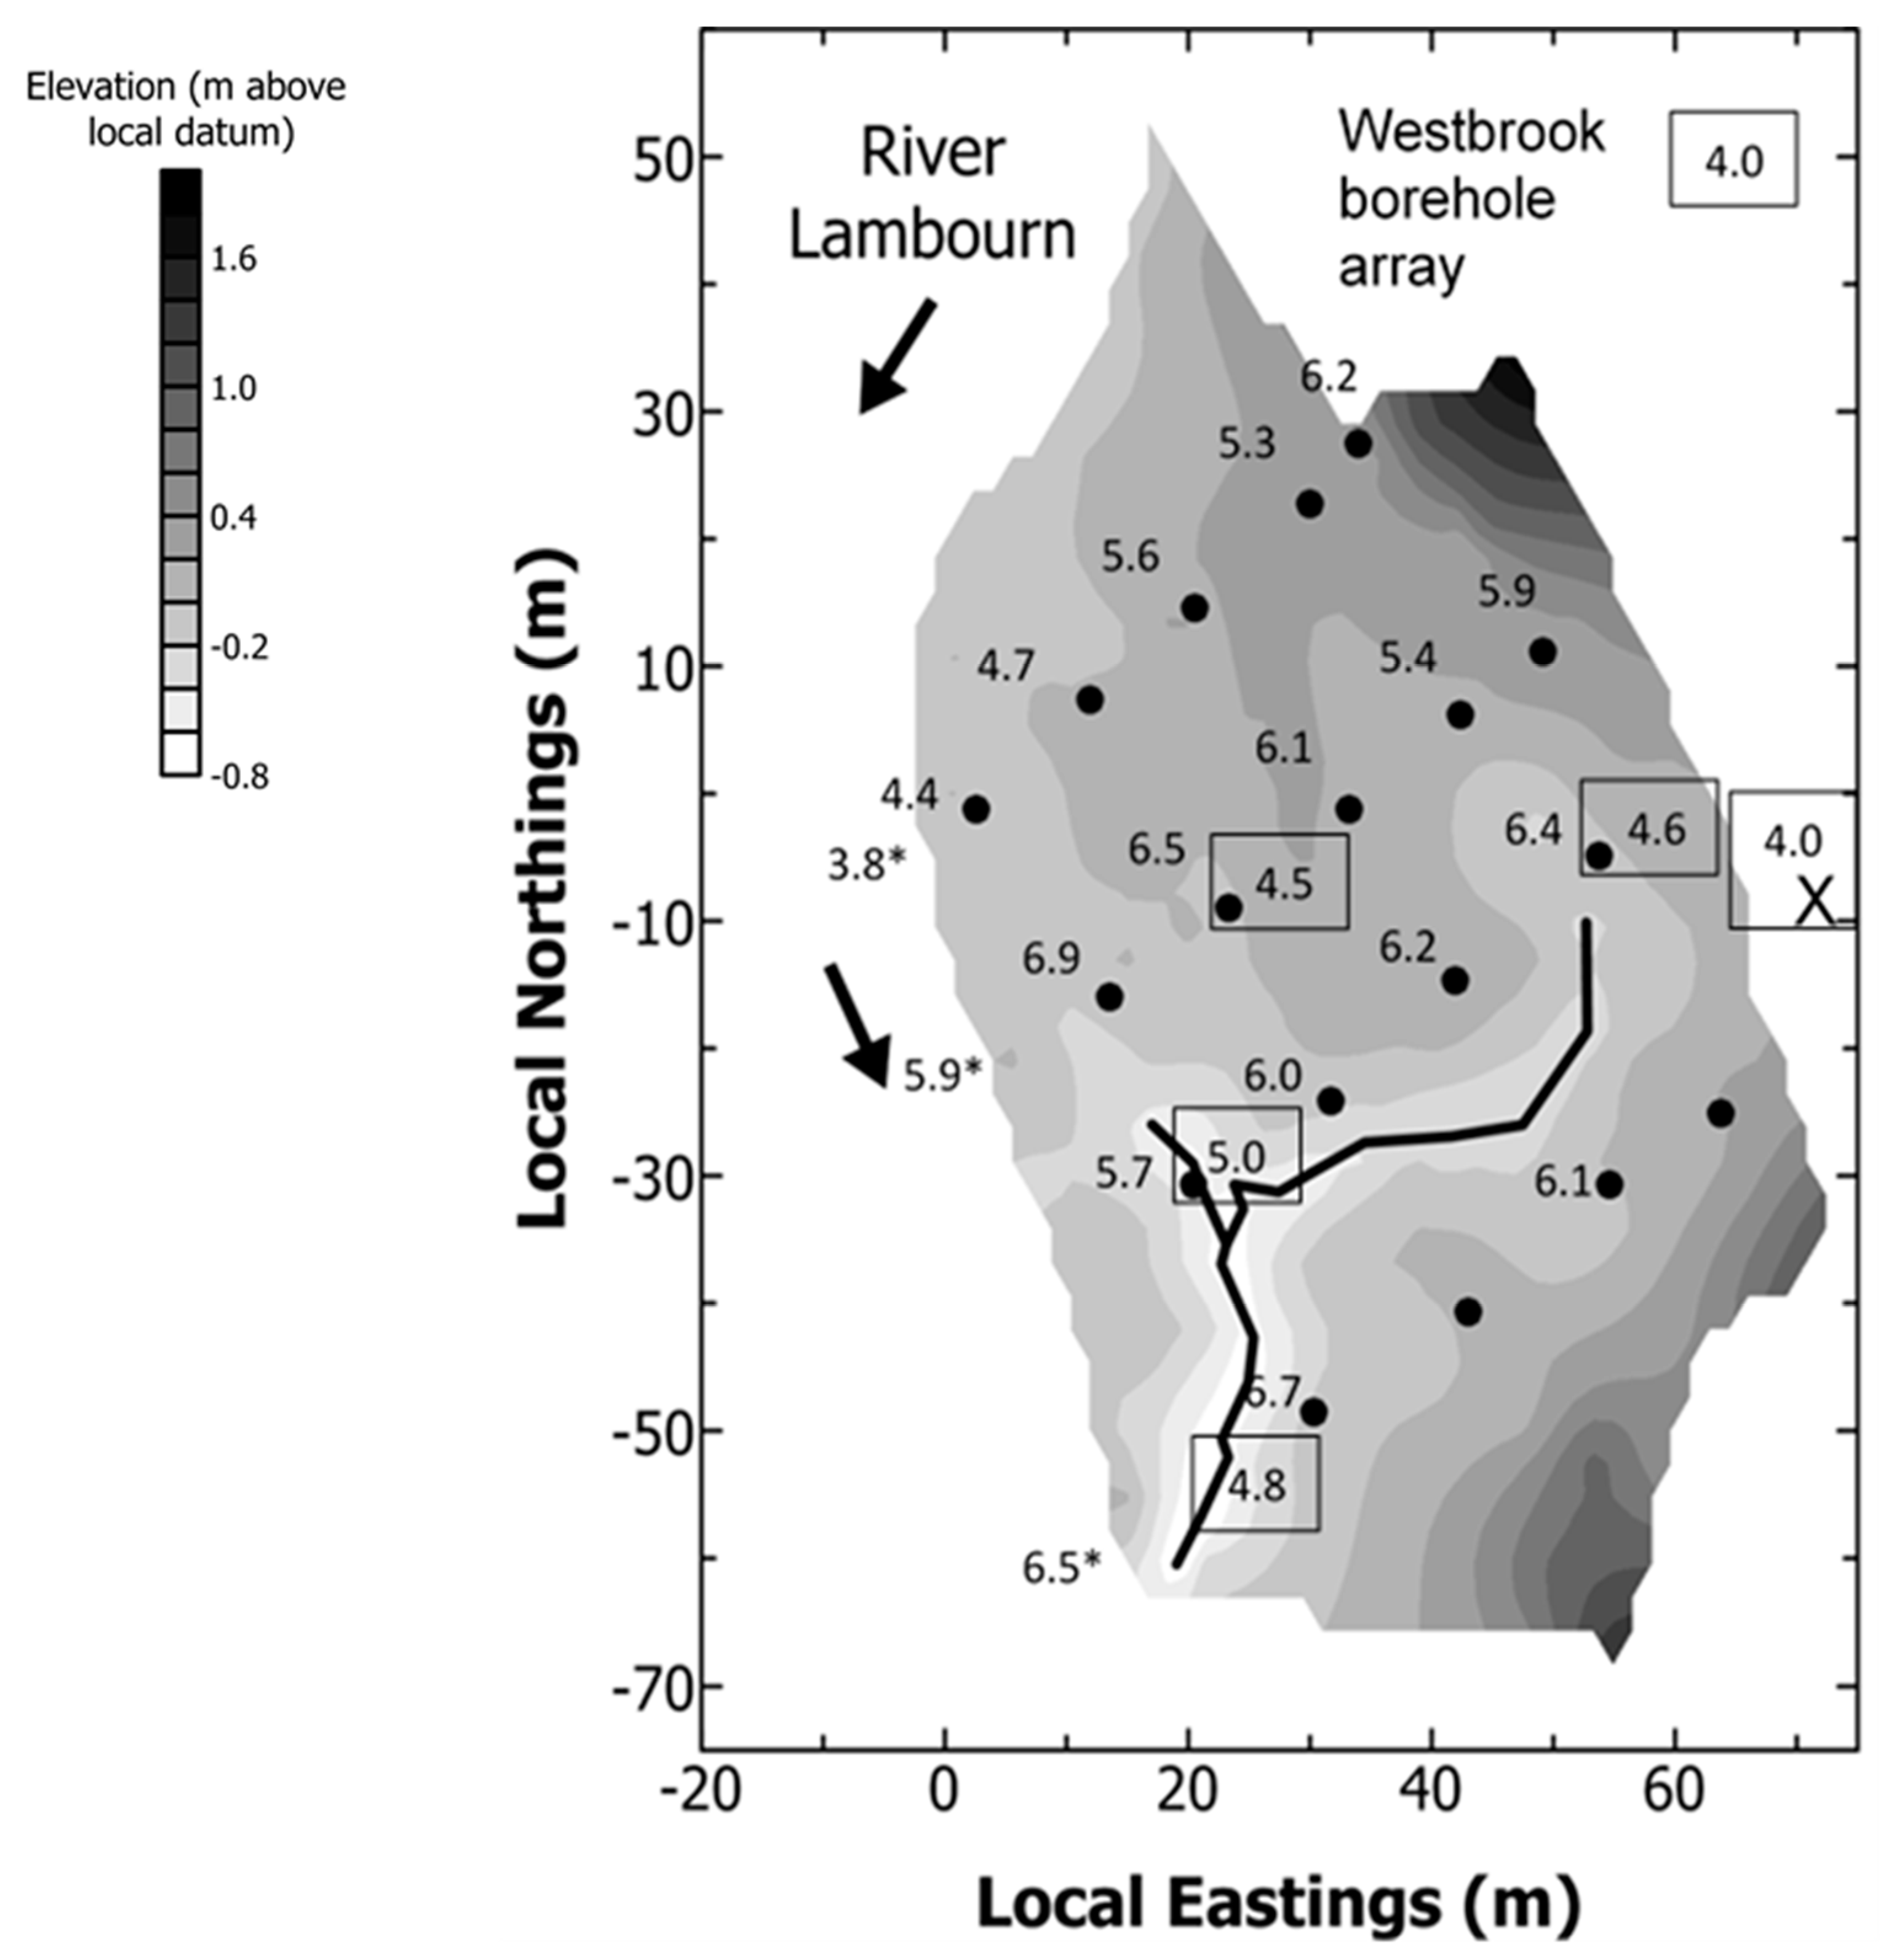
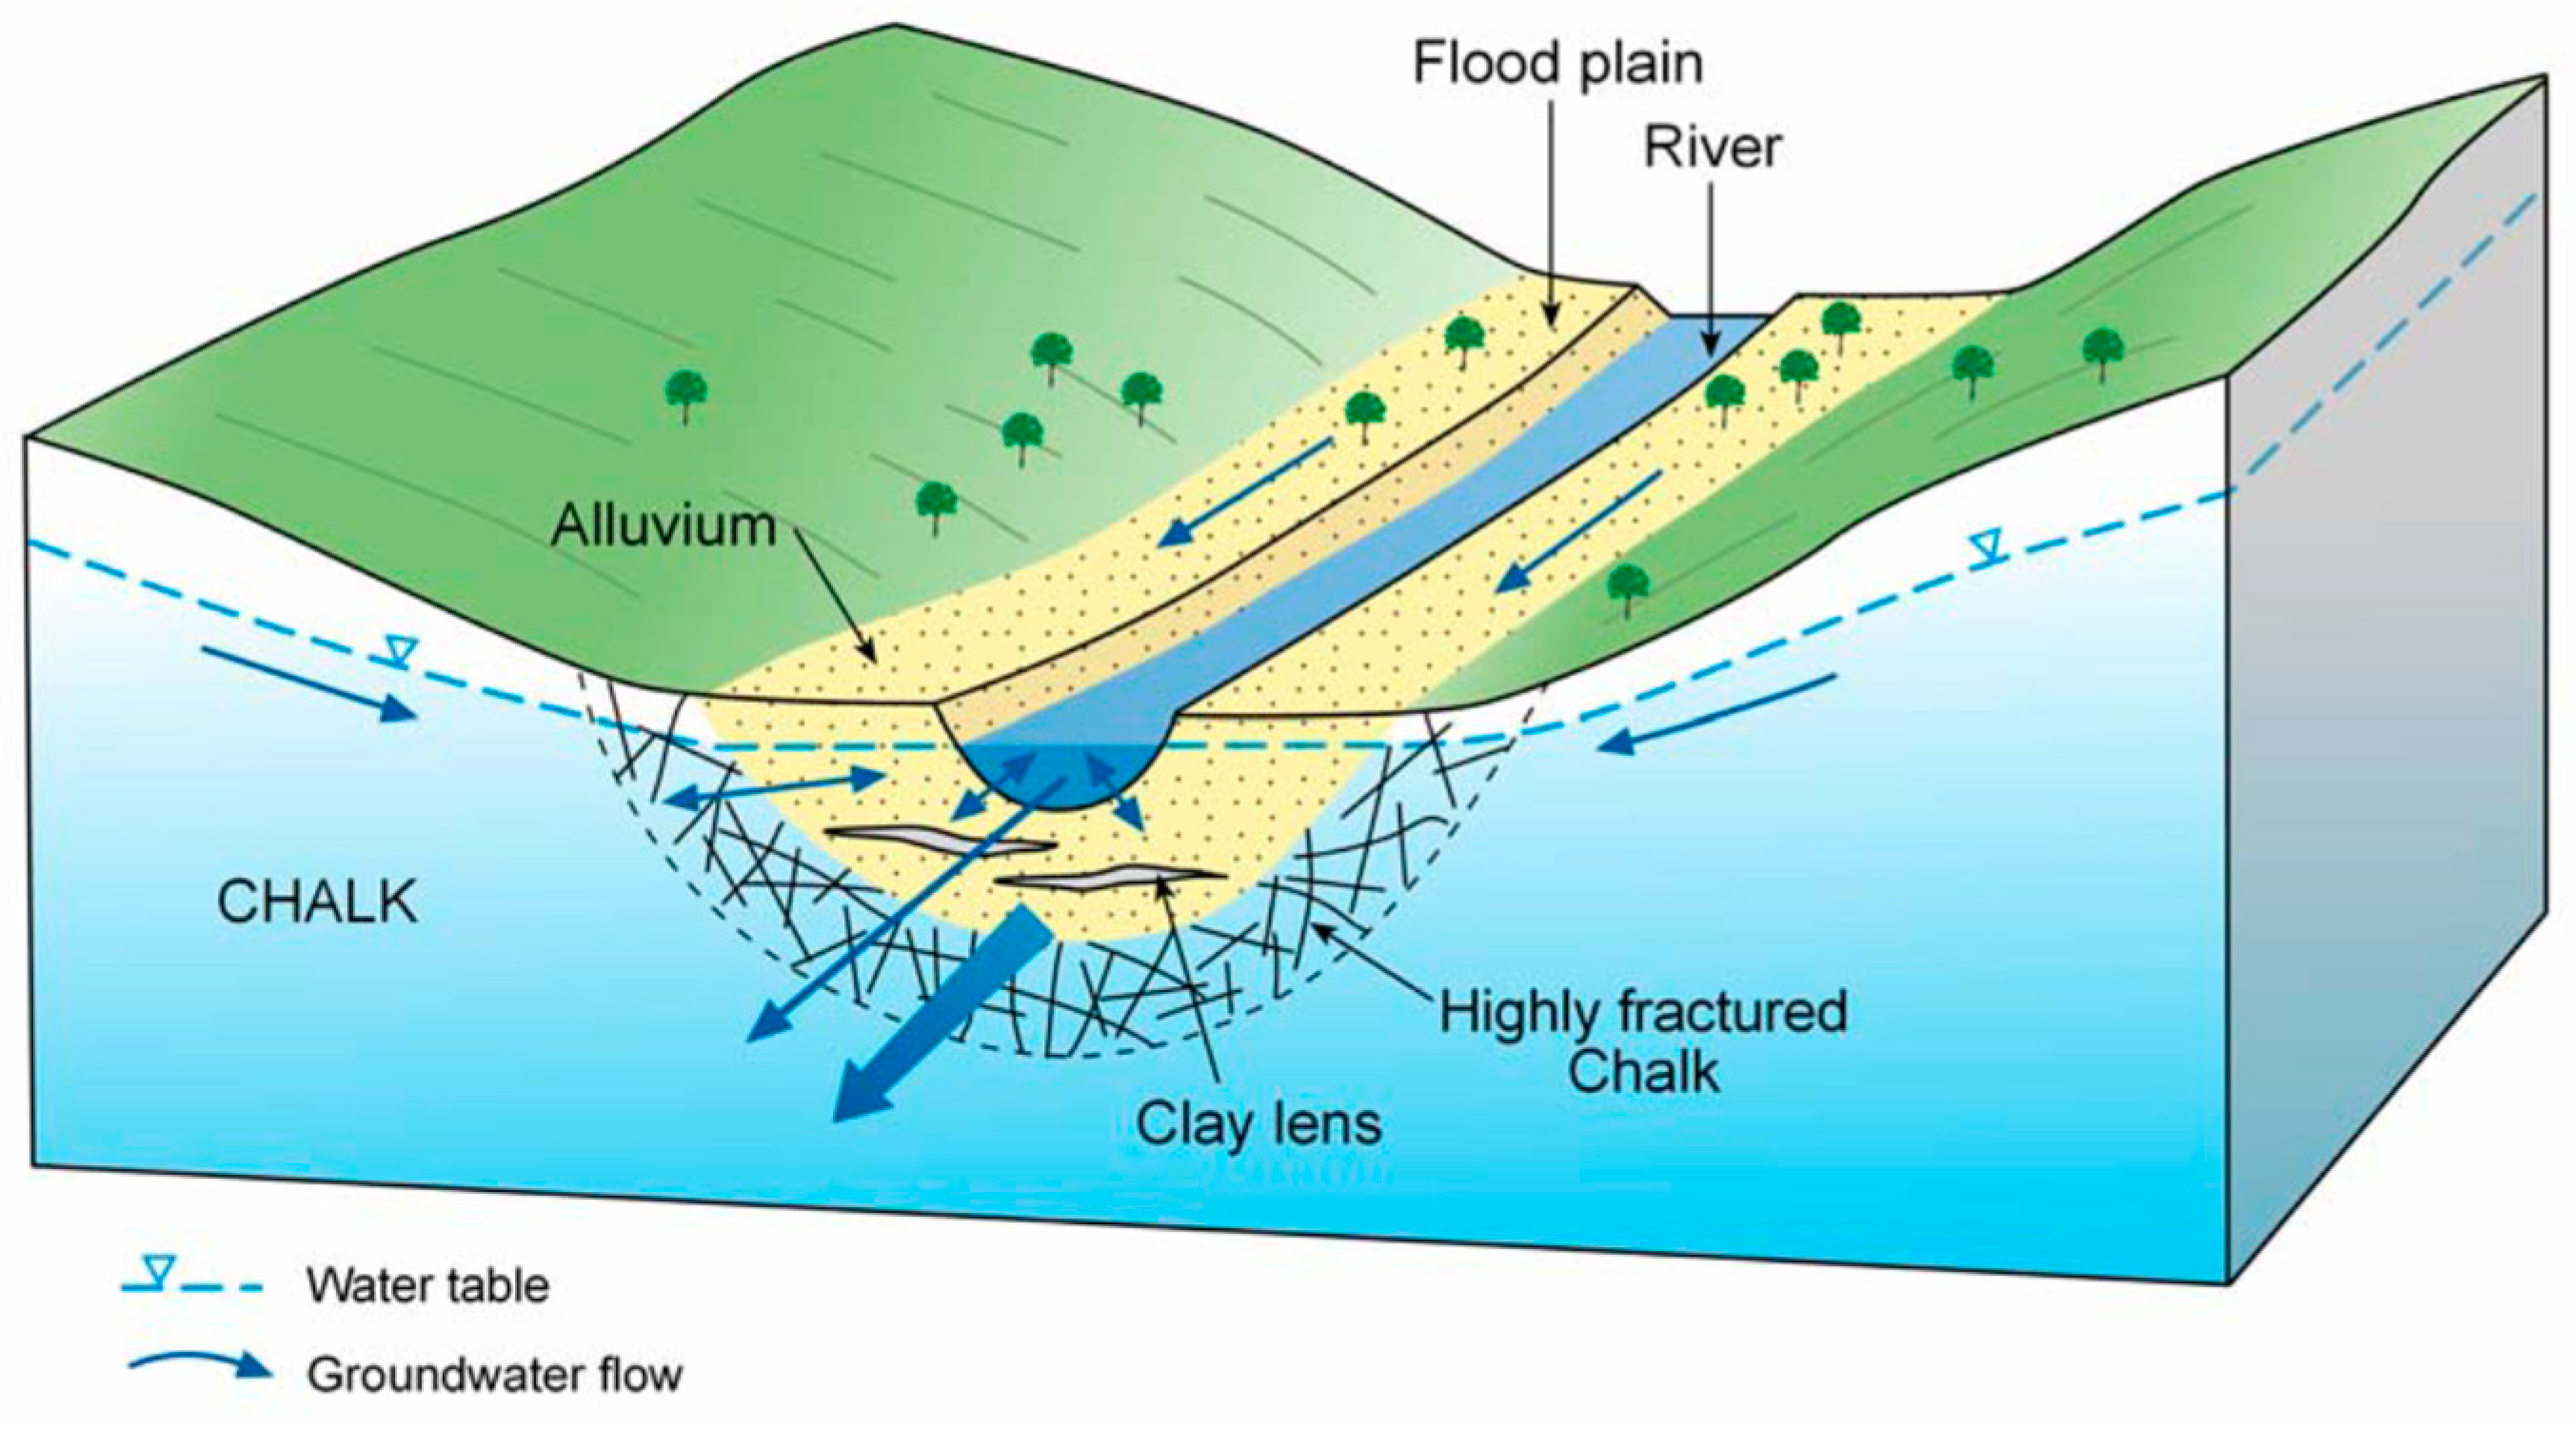
  • The findings from the geochemical analyses of soil porewaters and source waters suggest that the wetland is groundwater fed, with flows likely to be delivered from the major dry valley feature which appears, topographically, to be aligned upslope with the line of the wetland proto-stream channel.
  • The extent to which nutrient chemistry of inflowing waters is modified by wetland biogeochemical cycling depends on the residence time for the water within the wetland
  • Well-drained areas of the wetland with a short hydraulic residence time exhibit soil porewater nutrient chemistry and major and trace element geochemistry comparable to chalk groundwater, suggesting little transformation of the nutrient load moving along these flow pathways.
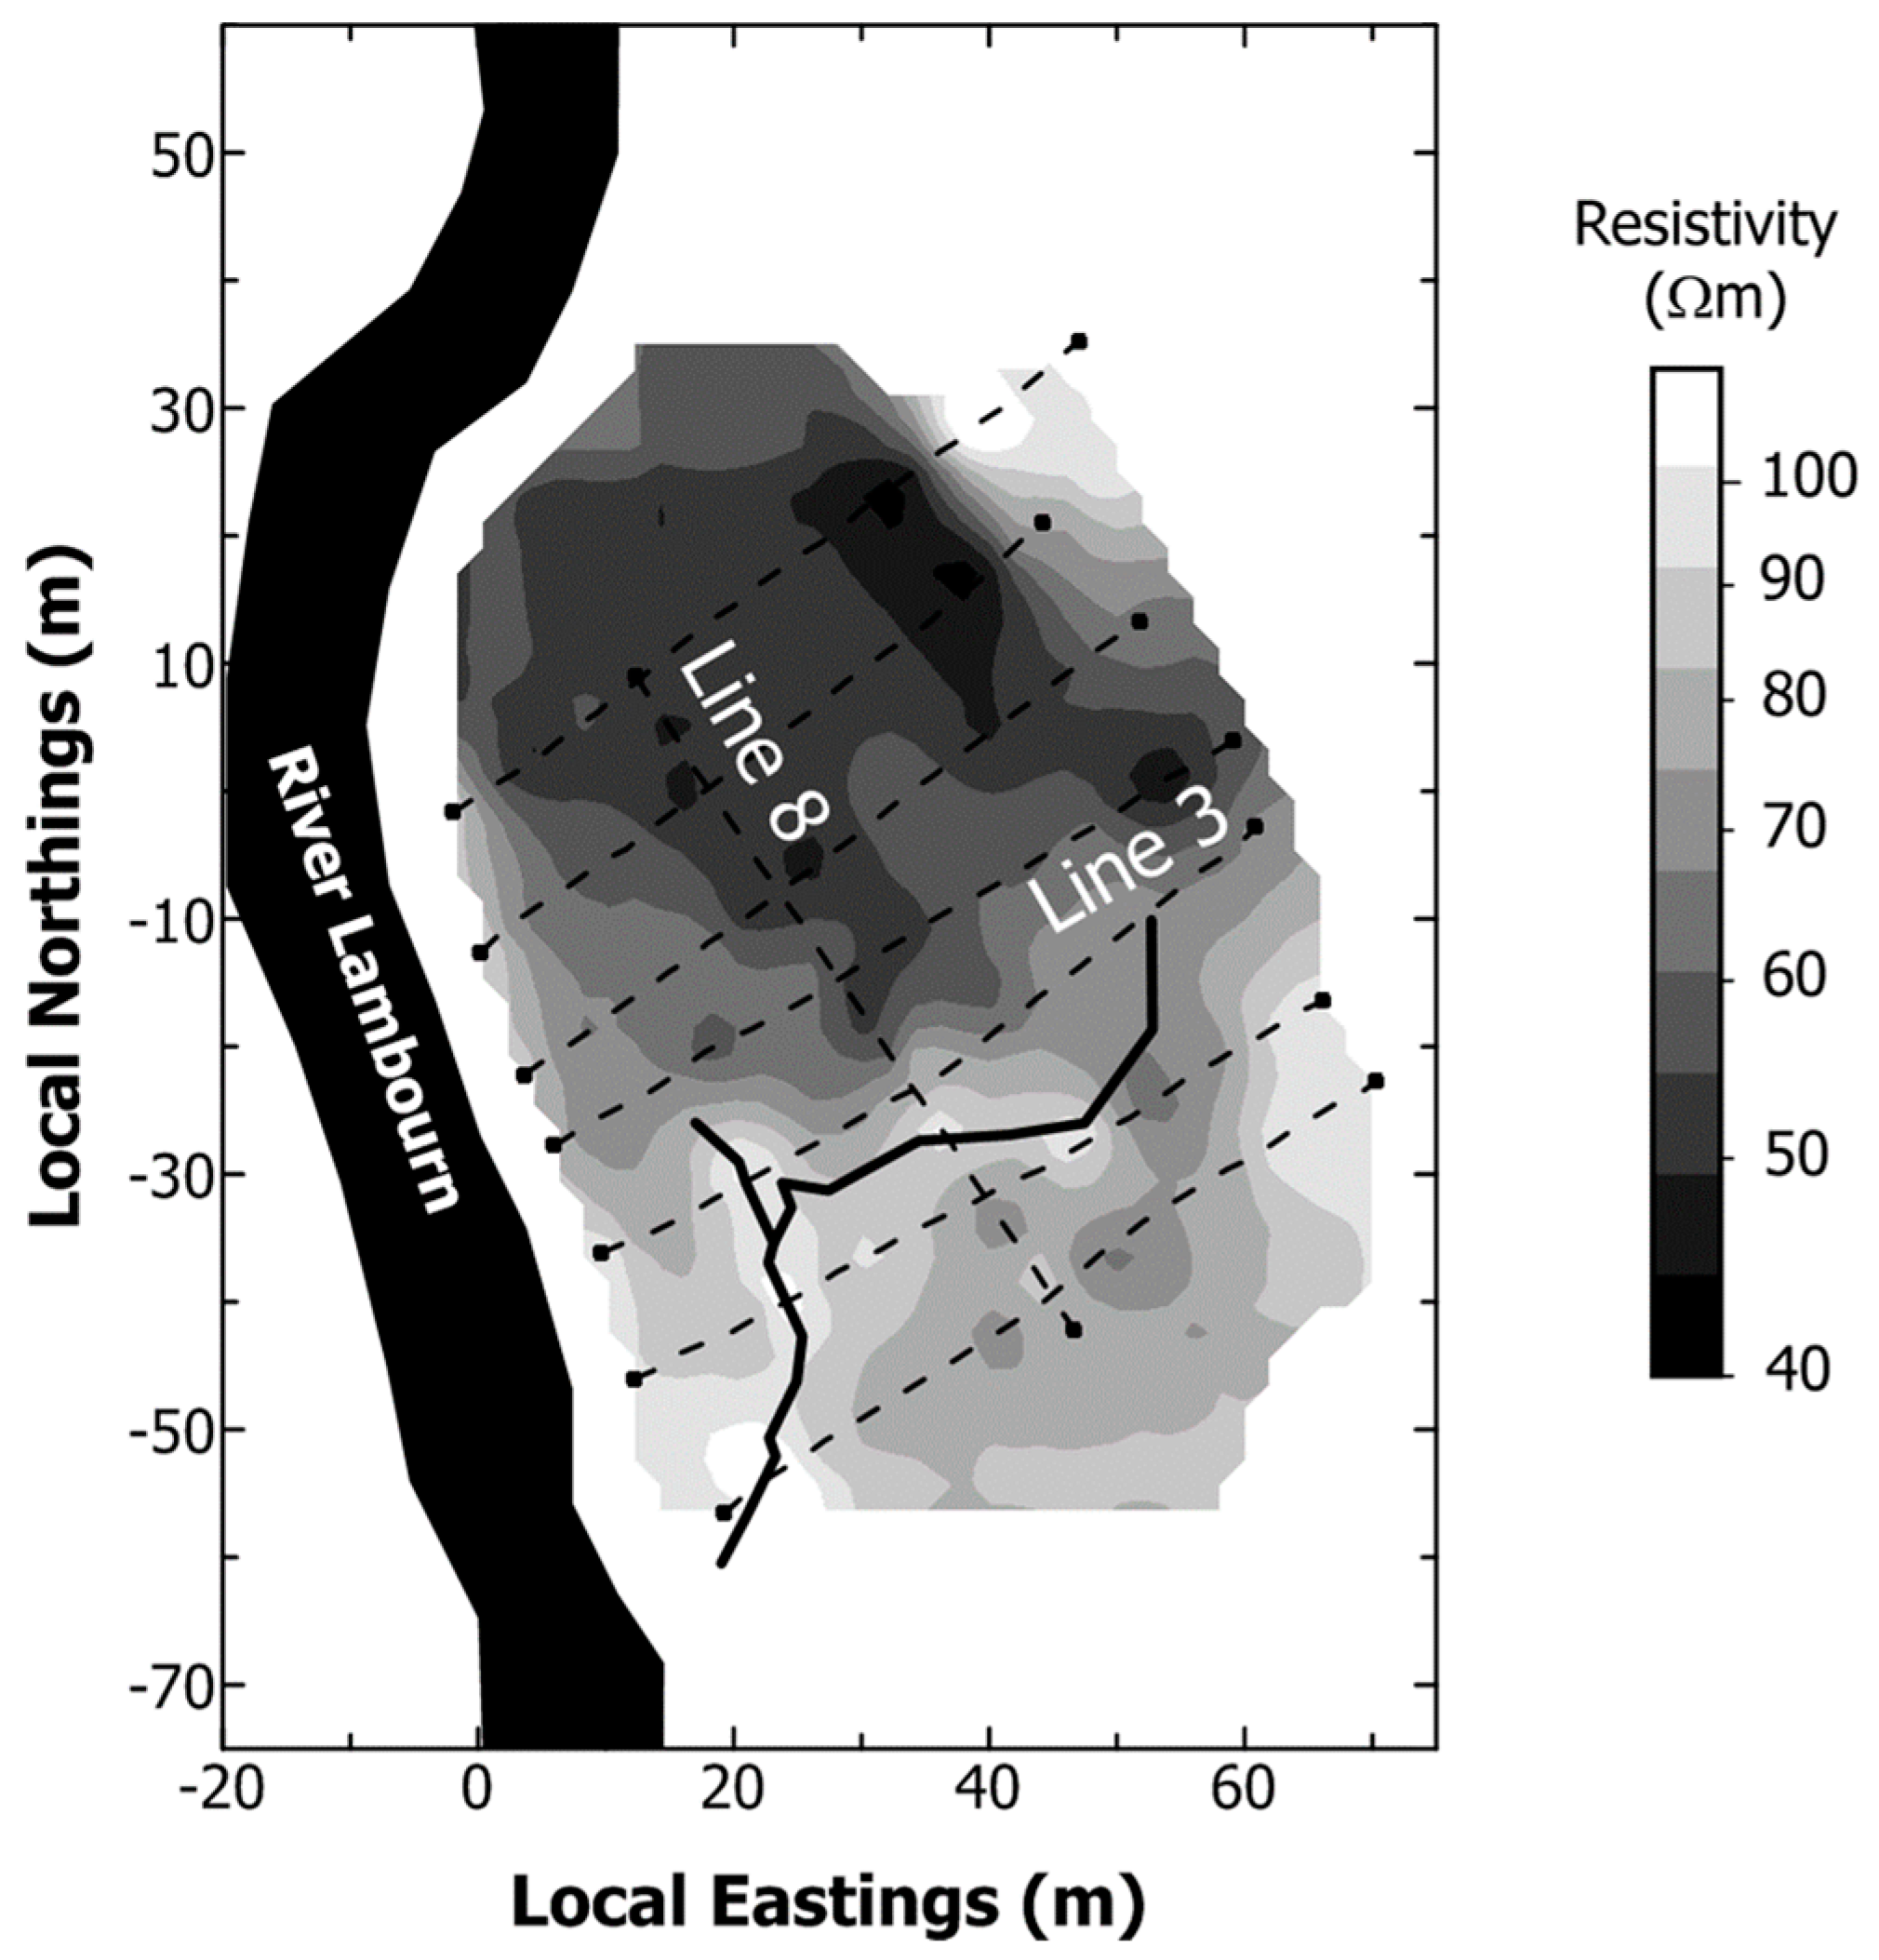
  • Surface and subsurface features identified through the site topographic and geophysical surveys, supplemented by soil coring, such as the existence and extent of the proto-stream channel, the depth of the alluvial gravels, and the presence of putty chalk lenses, are also critical in defining the hydrological function of wetland systems and the likely role any wetland may play in the transport and transformation of nutrient loads exported from land to stream.
  • Geophysical methods, in association with limited site characterisation through geochemical, isotope and nutrient hydrochemical techniques may be useful in future studies to indicate the likely role played by wetlands in the nutrient hydrochemical function of permeable catchments, allowing them to be built into catchment scale models of biogeochemical function.
  • This combination of techniques, building on recent advances in geophysical, geochemical and isotope characterisation provides a novel approach for improved understanding of biogeochemical function in permeable wetlands. Perhaps more importantly, no single technique on its own would have given an unambiguous representation of the hydrological and biogeochemical function of the wetland, and a toolkit comprising a range of complementary methods will provide a more complete and robust indication of wetland function at a process scale.
Overall, the multi-proxy approach adopted in this study has highlighted the important role that wetlands play in modifying the nutrient chemistry of waters draining through them in permeable catchments, and their role in the transient storage of waters under baseflow conditions, in the transformation of nutrient chemistry during these periods, and in the flushing of these accumulated nutrient stores in the form of DON and DOP under high flow conditions. However, the wetland is rarely ‘wet’, a common characteristic in permeable wetlands, and apart from the zone of the proto-stream channel, water level rarely reaches 20 cm below the wetland surface, suggesting that the majority of groundwater flow does not pass through these functions. At catchment scale, their significance in terms of attenuation or modification of the nutrient enrichment of surface waters from land-based sources in their catchments may be very limited under present land-use and climate scenarios.

Author Contributions

P.J.J. was PI on both grants and designed and executed the nutrient hydrochemistry sampling, analysis and interpretation with H.P. and M.P.K.; A.B. led, designed and conducted the geophysical survey component with support from Heather Musgrave, in collaboration with P.J.J. and M.P.K.; P.S. and D.C.G. designed and executed the wetland geochemistry sampling and analysis in collaboration with P.J.J. and provided access to British Geological Survey data and borehole assets, T.H.E.H. collaborated with P.J.J. and M.P.K. to design and execute the sample collection and isotope analysis component. All authors contributed to the writing of the manuscript, preparation of data for presentation, and data analysis. The project was conducted in collaboration with a wide range of other researchers funded under the £10m NERC LOCAR programme. All authors have read and agreed to the published version of the manuscript.

Funding

This research was funded under the NERC DOMAINE programme (NE/K010689/1); NERC LOCAR programme (NER/F3/G13/17/41; NER/T/S/2001/00942), jointly funded by the Environment Agency); a NERC Isotope Geoscience Facility grant (NER/IP/779/0902); and a NERC studentship for Hannah Prior (GT4/94/402), jointly funded by English Nature. We also acknowledge the immense field support from Nigel Crook, supported under a NERC LOCAR grant NER/T/S/2001/00948, and Heather Musgrave, funded through a further NERC studentship NER/S/A/2003/11344.

Acknowledgments

D.C.G. publishes with the permission of the Director, British Geological Survey (NERC). We gratefully acknowledge the support of Heather Musgrave and Nigel Crook in particular, and our wider team of colleagues under the NERC LOCAR programme.

Conflicts of Interest

The authors declare no conflict of interest

References

  1. Peterjohn, W.T.; Correll, D.L. Nutrient dynamics in an agricultural watershed: Observations on the role of a riparian forest. Ecology 1984, 65, 1466–1475. [Google Scholar] [CrossRef]
  2. Seitzinger, S.P. Linkages between organic matter mineralization and denitrification in 8 riparian wetlands. Biogeochemistry 1994, 25, 19–39. [Google Scholar] [CrossRef]
  3. Hill, A.R. Nitrate removal in stream riparian zones. J. Environ. Qual. 1996, 25, 743–755. [Google Scholar] [CrossRef]
  4. Kuusemets, V.; Mander, U.; Lohmus, K.; Ivask, M. Nitrogen and phosphorus variation in shallow groundwater and assimilation in plants in complex riparian buffer zones. Water Sci. Technol. 2001, 44, 615–622. [Google Scholar] [CrossRef]
  5. Prior, H.; Johnes, P.J. Regulation of surface water quality in a Chalk catchment, UK: An assessment of the relative importance of instream and wetland processes. Sci. Total Environ. 2002, 282–283, 159–174. [Google Scholar] [CrossRef]
  6. Revsbech, N.P.; Jacobsen, J.P.; Nielsen, L.P. Nitrogen transformations in microenvironments of river beds and riparian zones. Ecol. Eng. 2005, 24, 447–455. [Google Scholar] [CrossRef]
  7. Burgin, A.J.; Groffman, P.M. Soil O2 controls denitrification rates and N2O yield in a riparian wetland. J. Geophys. Res. 2012, 117, G01010. [Google Scholar] [CrossRef] [Green Version]
  8. Arheimer, B.; Pers, B.C. Lessons learned? Effects of nutrient reductions from constructing wetlands in 1996–2006 across Sweden. Ecol. Eng. 2017, 103, 404–414. [Google Scholar] [CrossRef] [Green Version]
  9. Mander, U.; Tournebize, J.; Sauvage, S.; Sanchez-Perez, J.M. Wetlands and buffer zones in watershed management. Ecol. Eng. 2017, 103, 289–295. [Google Scholar] [CrossRef]
  10. Neilen, A.D.; Chen, C.R.; Parker, B.M.; Faggotter, S.J.; Burford, M.A. Differences in nitrate and phosphorus export between wooded and grassed riparian zones from farmland to receiving waterways under varying rainfall conditions. Sci. Total Environ. 2017, 598, 188–197. [Google Scholar] [CrossRef]
  11. Bernard-Jannin, L.; Sun, X.; Teissier, S.; Sauvage, S.; Sánchez-Pérez, J.M. Spatio-temporal analysis of factors controlling nitrate dynamics and potential denitrification hot spots and hot moments in groundwater of an alluvial floodplain. Ecol. Eng. 2017, 103, 272–284. [Google Scholar] [CrossRef] [Green Version]
  12. Peralta-Maraver, I.; Reiss, J.; Robertson, A.L. Interplay of hydrology, community ecology and pollutant attenuation in the hyporheic zone. Sci. Total Environ. 2018, 610–611, 267–275. [Google Scholar] [CrossRef] [PubMed] [Green Version]
  13. Scheliga, B.; Tetzlaff, D.; Nuetzmann, G.; Soulsby, C. Groundwater dynamics at the hillslope–riparian interface in a year with extreme winter rainfall. J. Hydrol. 2018, 564, 509–528. [Google Scholar] [CrossRef] [Green Version]
  14. Old, G.H.; Naden, P.S.; Rameshwaran, P.; Acreman, M.C.; Baker, S.; Edwards, F.K.; Sorensen, J.P.R.; Mountford, O.; Gooddy, D.C.; Stratford, C.J.; et al. Instream and riparian implications of weed cutting in a chalk river. Ecol. Eng. 2014, 71, 290–300. [Google Scholar] [CrossRef] [Green Version]
  15. Shabaga, J.A.; Hill, A.R. Groundwater-fed surface flow path hydrodynamics and nitrate removal in three riparian zones in southern Ontario, Canada. J. Hydrol. 2010, 388, 52–64. [Google Scholar] [CrossRef]
  16. Balestrini, R.; Sacchi, E.; Tidilia, D.; Deconte, C.A.; Buffagni, A. Factors affecting agricultural nitrogen removal in riparian strips: Examples from groundwater-dependent ecosystems of the Po Valley (Northern Italy). Agric. Ecosyst. Environ. 2016, 221, 132–144. [Google Scholar] [CrossRef]
  17. Pinay, G.; Decamps, H. The role of riparian woods in regulating nitrogen fluxes between the alluvial aquifer and surface water: A conceptual model. Regul. Rivers Res. Manag. 1988, 2, 507–516. [Google Scholar] [CrossRef]
  18. Hefting, M.M.; Bobbink, R.; de Caluwe, H. Nitrous oxide emission and denitrification in chronically nitrate-loaded riparian buffer zones. J. Environ. Qual. 2003, 32, 1194–1203. [Google Scholar] [CrossRef]
  19. Weyer, C.; Peiffer, S.; Lischeid, G. Stream water quality affected by interacting hydrological and biogeochemical processes in a riparian wetland. J. Hydrol. 2018, 563, 260–272. [Google Scholar] [CrossRef]
  20. Frei, S.; Peiffer, S. Exposure times rather than residence times control redox transformation efficiencies in riparian wetlands. J. Hydrol. 2016, 543, 182–196. [Google Scholar] [CrossRef]
  21. De Sosa, L.L.; Glanville, H.C.; Marshall, M.R.; Williams, P.; Abadie, M.; Clark, I.M.; Blaud, A.; Jones, D.L. Spatial zoning of microbial functions and plant-soil nitrogen dynamics across a riparian area in an extensively grazed livestock system. Soil Biol. Biochem. 2018, 120, 153–164. [Google Scholar] [CrossRef]
  22. Gutknecht, J.L.M.; Goodman, R.M.; Balser, T.C. Linking soil process and microbial ecology in freshwater wetland ecosystem. Plant Soil 2006, 289, 17–34. [Google Scholar] [CrossRef]
  23. Yates, C.A.; Johnes, P.J.; Spencer, R.G.M. Assessing the controls on dissolved organic matter export from two contrasting lowland catchments. Sci. Total Environ. 2016, 569–570, 1330–1340. [Google Scholar] [CrossRef] [PubMed] [Green Version]
  24. Lloyd, C.E.M.; Johnes, P.J.; Freer, J.E.; Carswell, A.; Jones, J.I.; Stirling, M.W.; Hodgkinson, R.A.; Richmond, C.; Collins, A.C. Determining the origins of nutrient flux to waters in catchments: Examining the nutrient speciation balance to inform the targeting of mitigation measures. Sci. Total Environ. 2019, 648, 1179–1200. [Google Scholar] [CrossRef] [PubMed]
  25. Yates, C.A.; Johnes, P.J.; Owen, A.T.; Brailsford, F.L.; Glanville, H.C.; Evans, C.D.; Marshall, M.R.; Jones, D.L.; Lloyd, C.E.M.; Jickells, T.; et al. Variation in dissolved organic matter (DOM) stoichiometry in freshwaters: Assessing the influence of land cover and soil C:N ratio on DOM composition. Limnol. Oceanogr. 2019, 9999, 1–13. [Google Scholar] [CrossRef] [Green Version]
  26. Mander, U.; Kuusemets, V.; Ivask, M. Nutrient dynamics of riparian ecotones – a case study from the Porijogi River catchment, Estonia. Landsc. Urban Plan. 1995, 31, 333–348. [Google Scholar] [CrossRef]
  27. Kull, A.; Kull, A.; Jaagus, J.; Kuusemets, V.; Mander, U. The effects of fluctuating climatic conditions and weather events on nutrient dynamics in a narrow mosaic riparian peatland. Boreal Environ. Res. 2008, 13, 243–263. [Google Scholar]
  28. Newell, A.J.; Vane, C.H.; Sorensen, J.P.R.; Moss-Hayes, V.; Gooddy, D.C. Long-term Holocene groundwater fluctuations in a chalk catchment: Evidence from Rock-Eval pyrolysis of riparian peats. Hydrol. Process. 2016, 30, 4556–4567. [Google Scholar] [CrossRef] [Green Version]
  29. Brinson, M.M. A Hydrogeomorphic Classification for Wetlands; Wetlands Research Program Technical Report WRP-DE-4; US Army Corps of Engineers Waterways Experiment Station: Vicksburg, MS, USA, 1993. [Google Scholar]
  30. Allen, D.J.; Darling, W.G.; Gooddy, D.C.; Lapworth, D.J.; Newell, A.J.; Williams, A.T.; Allen, D.; Abesser, C. Interaction between groundwater, surface water and the hyporheic zone in a chalk stream. Hydrogeol. J. 2010, 18, 1125–1141. [Google Scholar] [CrossRef] [Green Version]
  31. Binley, A.; Hubbard, S.S.; Huisman, J.A.; Revil, A.; Robinson, D.A.; Singha, K.; Slater, L.D. The emergence of hydrogeophysics for improved understanding of subsurface processes over multiple scales. Water Resour. Res. 2015, 51, 3837–3866. [Google Scholar] [CrossRef] [Green Version]
  32. Uhlemann, S.S.; Sorensen, J.P.R.; House, A.R.; Wilkinson, P.B.; Roberts, C.; Gooddy, D.C.; Binley, A.; Chambers, J.E. Integrated time-lapse geoelectrical imaging of wetland hydrological processes. Water Resour. Res. 2016, 52, 1607–1625. [Google Scholar] [CrossRef] [Green Version]
  33. House, A.R.; Sorensen, J.P.R.; Gooddy, D.C.; Newell, A.J.; Marchant, B.; Mountford, J.O.; Scarlett, P.; Williams, P.J.; Old, G.H. Discrete wetland groundwater discharges revealed with a three-dimensional temperature model and botanical indicators (Boxford, UK). Hydrogeol. J. 2015, 23, 775–787. [Google Scholar] [CrossRef] [Green Version]
  34. Wheater, H.S.; Peach, D. Developing interdisciplinary science for integrated catchment management: The UK Lowland Catchment Research (LOCAR) programme. Int. J. Water Resour. Dev. 2004, 20, 369–385. [Google Scholar] [CrossRef] [Green Version]
  35. Wheater, H.; Peach, D.; Binley, A. Characterising groundwater-dominated lowland catchments: The UK Lowland Catchment Research Programme (LOCAR). Hydrol. Earth Syst. Sci. 2007, 11, 108–124. [Google Scholar] [CrossRef]
  36. Evans, D.J.; Johnes, P.J.; Lawrence, D.S. Sediment Transport in Lowland Streams—Storm Integrated Monitoring; IAHS Publication: Wallingford, UK, 2003; Volume 283, pp. 103–110. [Google Scholar]
  37. Evans, D.J.; Johnes, P.J. Physico-chemical controls on phosphorus cycling in two lowland streams: I—Water column. Sci. Total Environ. 2004, 329, 145–163. [Google Scholar] [CrossRef] [PubMed]
  38. Evans, D.J.; Johnes, P.J.; Lawrence, D. Physico-chemical controls on phosphorus cycling in two lowland streams: II—Bed sediment. Sci. Total Environ. 2004, 329, 165–182. [Google Scholar] [CrossRef] [PubMed]
  39. Lapworth, D.J.; Gooddy, D.C.; Allen, D.; Old, G.H. Understanding groundwater, surface water, and hyporheic zone biogeochemical processes in a Chalk catchment using fluorescence properties of dissolved and colloidal organic matter. J. Geophys. Res. 2009, 114, G00F02. [Google Scholar] [CrossRef] [Green Version]
  40. Grapes, T.R.; Bradley, C.; Petts, G.E. Dynamics of river-aquifer interaction along a Chalk stream: The River Lambourn, UK. Hydrol. Process. 2005, 19, 2035–2053. [Google Scholar] [CrossRef]
  41. Griffiths, J.; Binley, A.; Crook, N.; Nutter, J.; Young, A.; Fletcher, S. Streamflow generation in the Pang and Lambourn catchments, Berkshire, UK. J. Hydrol. 2006, 330, 71–83. [Google Scholar] [CrossRef]
  42. Newell, A.J.; Sorensen, J.P.R.; Chambers, J.E.; Wilkinson, P.B.; Uhleman, S.; Roberts, C.; Gooddy, D.C.; Vane, C.H.; Binley, A. Fluvial response to Late Pleistocene and Holocene environmental change in a Thames chalkland headwater: The Lambourn of southern England. Proc. Geol. Assoc. 2015, 126, 683–697. [Google Scholar] [CrossRef] [Green Version]
  43. Johnes, P.J.; Foy, R.; Butterfield, D.; Haygarth, P.M. Land use scenarios for England and Wales: Evaluation of management options to support ‘good ecological status’ in surface freshwaters. Soil Use Manag. 2007, 23, 176–194. [Google Scholar] [CrossRef]
  44. Pretty, J.L.; Hildrew, A.G.; Trimmer, M. Nutrient dynamics in relation to surface–subsurface hydrological exchange in a groundwater fed Chalk stream. J. Hydrol. 2006, 330, 84–100. [Google Scholar] [CrossRef]
  45. Lapworth, D.J.; Gooddy, D.C.; Jarvie, H.P. Understanding phosphorus mobility and bioavailability in the hyporheic zone of a chalk stream. Water Air Soil Pollut. 2011, 218, 213–226. [Google Scholar] [CrossRef]
  46. Aldiss, D.T.; Royse, K.T. The geology of the Pang-Lambourn catchment, Berkshire: British Geological Survey Report CR/20/289N; British Geological Survey: Keyworth, Nottingham, UK, 2002; p. 38. [Google Scholar]
  47. Rodwell, J.S. National Vegetation Classification: Users’ Handbook; Joint Nature Conservation Committee: Peterborough, UK, 2006.
  48. Kettridge, N.; Comas, X.; Baird, A.; Slater, L.; Strack, M.; Thompson, D.; Jol, H.; Binley, A. Ecohydrologically important subsurface structures in peatlands revealed by ground-penetrating radar and complex conductivity surveys. J. Geophys. Res. 2008, 113, G04030. [Google Scholar] [CrossRef] [Green Version]
  49. Robinson, D.A.; Binley, A.; Crook, N.; Day-Lewis, F.; Ferré, P.T.; Grauch, V.J.S.; Knight, R.; Knoll, M.; Lakshmi, V.; Miller, R.; et al. Advancing process-based watershed hydrological research using near-surface geophysics: A vision for, and review of, electrical and magnetic geophysical methods. Hydrol. Process. 2008, 22, 3604–3635. [Google Scholar] [CrossRef]
  50. McLachlan, P.J.; Chambers, J.E.; Uhlemann, S.S.; Binley, A. Geophysical characterisation of the groundwater—Surface water interface. Adv. Water Resour. 2017, 109, 302–319. [Google Scholar] [CrossRef] [Green Version]
  51. Musgrave, H.; Binley, A. Revealing the temporal dynamics of subsurface temperature in a wetland using time-lapse geophysics. J. Hydrol. 2011, 396, 258–266. [Google Scholar] [CrossRef]
  52. Binley, A.; Kemna, A. DC Resistivity and Induced Polarization Methods. In Hydrogeophysics; Rubin, Y., Hubbard, S.S., Eds.; Springer: New York, NY, USA, 2005; pp. 129–156. [Google Scholar]
  53. Jarvis, I.; Woodruff, P. The phosphatic chalks and hardgrounds of Boxford and Winterbourne, Berkshire—Two tectonically controlled facies in the late Coniacian to early Campanian (Cretaceous) of southern England. Geol. Mag. 1981, 118, 175–187. [Google Scholar] [CrossRef]
  54. Johnes, P.J.; Heathwaite, A.L. A procedure for the simultaneous determination of total nitrogen and total phosphorus in freshwater samples using persulphate microwave digestion. Water Res. 1992, 26, 1281–1287. [Google Scholar] [CrossRef]
  55. Cey, E.E.; Rudolph, D.L.; Aravena, R.; Parkin, G. Role of the riparian zone in controlling the distribution and fate of agricultural nitrogen near a small stream in southern Ontario. J. Contam. Hydrol. 1999, 37, 45–67. [Google Scholar] [CrossRef]
  56. Mengis, M.; Schiff, S.L.; Haris, M.; English, M.C.; Aravena, R.; Elgood, R.J.; MacLean, A. Multiple geochemical and isotopic approaches for assessing ground water NO3 elimination in a riparian zone. Groundwater 1999, 37, 448–457. [Google Scholar] [CrossRef]
  57. Devito, K.J.; Fitzgerald, D.; Hill, A.R.; Aravena, R. Nitrate dynamics in relation to lithology and hydrologic flow path in a river riparian zone. J. Environ. Qual. 2000, 29, 1075–1084. [Google Scholar] [CrossRef]
  58. Chang, C.C.Y.; Langston, J.; Riggs, M.; Campbell, D.H.; Silva, S.R.; Kendall, C. A method for nitrate collection for δ15N and δ18O analysis from waters with low nitrate concentrations. Can. J. Fish. Aquat. Sci. 1999, 56, 1856–1864. [Google Scholar] [CrossRef]
  59. Heaton, T.H.E.; Wynn, P.; Tye, A. Low 15N/14N ratios for nitrate in snow in the High Arctic (79o N). Atmos. Environ. 2004, 38, 5611–5621. [Google Scholar] [CrossRef]
  60. Mullinger, N.J.; Pates, J.M.; Binley, A.; Crook, N.P. Controls on the spatial and temporal variability of 222Rn-in riparian groundwater in a lowland Chalk catchment. J. Hydrol. 2009, 376, 58–69. [Google Scholar] [CrossRef] [Green Version]
  61. Cook, P.G.; Wood, C.; White, T.; Simmons, C.T.; Fass, T.; Brunner, P. Groundwater inflow to a shallow, poorly mixed wetland estimated from a mass balance of radon. J. Hydrol. 2008, 354, 213–226. [Google Scholar] [CrossRef]
  62. Massmann, G.; Sultenfuss, J.; Dunnbier, U.; Knappe, A.; Taute, T.; Pekdeger, A. Investigation of groundwater residence times during bank filtration in Berlin: A multi-tracer approach. Hydrol. Process. 2008, 22, 788–801. [Google Scholar] [CrossRef]
  63. Christensen, J.N.; Dafflon, B.; Shiel, A.E.; Tokunaga, T.K.; Wan, J.; Faybishenko, B.; Dong, W.; Williams, K.H.; Hobson, C.; Brown, S.T.; et al. Using strontium isotopes to evaluate the spatial variation of groundwater recharge. Sci. Total Environ. 2018, 637–638, 672–685. [Google Scholar] [CrossRef] [Green Version]
  64. Gooddy, D.C.; Darling, W.G.; Abesser, C.; Lapworth, D.J. Using chlorofluorocarbons (CFCs) and sulphur hexafluoride (SF6) to characterise groundwater movement and residence time in a lowland chalk catchment. J. Hydrol. 2006, 330, 44–52. [Google Scholar] [CrossRef] [Green Version]
  65. Chambers, D.; Gooddy, D.C.; Binley, A. Use and application of CFC-11, CFC-12, CFC-113 and SF6 as environmental tracers of groundwater residence time: A review. Geosci. Front. 2019, 10, 1643–1652. [Google Scholar] [CrossRef]
  66. Sigman, D.M.; Casciotti, K.L.; Andreani, M.; Barford, C.; Galanter, M.; Böhlke, J.K. A bacterial method for the nitrogen isotopic analysis of nitrate in seawater and freshwater. Anal. Chem. 2001, 73, 4145–4153. [Google Scholar] [CrossRef] [PubMed]
  67. Feast, N.A.; Hiscock, K.M.; Dennis, P.F.; Andrews, J.N. Nitrogen isotope hydrochemistry and denitrification within the chalk aquifer system of north Norfolk, UK. J. Hydrol. 1998, 211, 233–252. [Google Scholar] [CrossRef]
  68. Kendall, C.; Elliott, E.M.; Wankel, S.D. Tracing anthropogenic inputs of nitrogen to ecosystems. In Stable Isotopes in Ecology and Environmental Science; Michener, R., Lajtha, K., Eds.; Blackwell Publishing: Oxford, UK, 2007; pp. 375–449. [Google Scholar]
  69. Luz, B.; Barkan, E. The isotopic composition of atmospheric oxygen. Glob. Biogeochem. Cycles 2011, 25, GB4006. [Google Scholar] [CrossRef]
  70. Chen, D.J.Z.; Macquarrie, K.T.B. Correlation of δ15N and δ18O in NO3 during denitrification in groundwater. J. Environ. Eng. Sci. 2005, 4, 221–226. [Google Scholar] [CrossRef]
  71. Heaton, T.H.E.; Stuart, M.E.; Sapiano, M.; Micallef Sultana, M. An isotope study of the sources of nitrate in Malta’s groundwater. J. Hydrol. 2012, 414–415, 244–254. [Google Scholar] [CrossRef]
  72. Green, C.T.; Böhlke, J.K.; Bekins, B.A.; Phillips, S.P. Mixing effects on apparent reaction rates and isotope fractionation during denitrification in a heterogeneous aquifer. Water Resour. Res. 2010, 46, W08525. [Google Scholar] [CrossRef]
  73. Evans, R.D. Physiological mechanisms influencing plant nitrogen isotope composition. Trends Plant Sci. 2001, 6, 122–126. [Google Scholar] [CrossRef]
Figure 1. Dry valley features of the Lambourn catchment. The location of the Boxford wetland is marked with a red circle. The dry valley surface topographic catchment is shown shaded to the north of the wetland. Figure reproduced with permission of the British Geological Survey.
Water 12 00167 g001
Figure 2. Instrumentation, showing the location of the porous cup sampler nests, piezometers, and Boxford borehole. Shading shows topographic variation across the site.
Water 12 00167 g002
Figure 3. Variation across the site (between 0.65 m and 1.0 m below ground level) determined from resistivity images computed from electrical resistivity tomography (ERT) surveys along the eight transects (locations shown as broken lines).
Water 12 00167 g003
Figure 4. Resistivity tomography (ERT) and ground penetrating radar (GPR) results along (a) Line 3 and (b) Line 8 (see Figure 3 for location of lines). Also shown are soil core logs taken along the two transects.
Water 12 00167 g004
Figure 5. Level fluctuations across the Boxford wetland relative to soil surface (cm). Sampler nest locations are shown in Figure 2.
Water 12 00167 g005
Figure 6. Wetland porewater and source water geochemical analyses. Mg and Ca measured in mg/L; Sr measured in µg/L. Error bars show mean ± SEM.
Water 12 00167 g006
Figure 7. Soil porewater N speciation under baseflow conditions (3 August 2004). Sampler locations are shown as black dots, as detailed in Figure 2. (a) shows NO3-N concentrations across the wetland at 20, 40 and 60 cm depth, while (b) shows DON concentrations, and (c) shows NH4-N concentrations across the site at these same depths.
Water 12 00167 g007
Figure 8. Soil porewater P fractionation under baseflow conditions (3 August 2004). Sampler locations are shown as black dots, as detailed in Figure 2. (a) shows PO4-P concentrations across the wetland at 20, 40 and 60 cm depth, while (b) shows DOP concentrations across the site at these same depths.
Water 12 00167 g008
Figure 9. Baseflow N chemistry in the Boxford wetland, 16 September 2003 to 16 January 2005.
Water 12 00167 g009
Figure 10. δ15N values in the Boxford wetland. Data in boxes refer to δ15N of nitrate in boreholes, piezometers and the proto-stream. Data without boxes refer to average δ15N of the top 4–5 leaves of three individual Phalaris arundinacea plants. Numbers next to closed circles are for samples collected close to ceramic cup samplers; numbers marked with an asterisk* are for plants sampled from the river bank.
Water 12 00167 g010
Figure 11. Conceptual model of baseflow wetland hydraulic connectivity at Boxford.
Water 12 00167 g011
Figure 12. Total dissolved P (TDP) dynamics under storm conditions, 16 November 1996 to 23 November 1996. Note that the scale varies the over course of the event.
Water 12 00167 g012
Figure 13. Total dissolved N (TDN) dynamics under storm conditions, 16 November 1996 to 23 November 1996. Note that the scale varies over the course of the event.
Water 12 00167 g013
Figure 14. Wetland biogeochemical cycling hotspots: their role in lowland permeable catchment hydrochemical function. Figure provided by British Geological Survey.
Water 12 00167 g014
Table 1. Sampling programme details.
Sampling ProgrammeDates
Weekly Water Sampling:
Water level at dipwells16 September 2003–16 January 2005
Soil porewaters in wetland alluvial soils, 23 nests, 20, 40, 60 cm 16 September 2003–16 January 2005
Water levels in wetland alluvial soils, 23 dipwells, 7 January 2004–16 January 2005
Proto-stream surface water, 3 sites, 7 January 2004–16 July 2004
Boxford borehole, 30 m depth1 December 2004–16 January 2005
Piezometers in gravels, 5 sites, 2 m, 3 m depth1 July 2004–16 January 2005
Puncture tensiometers in wetland alluvial soils 1 September 2004–16 January 2005
Plant Sampling:
Plant species list April 2004, June 2004
Biomass sampling, single and mixed species stands, monthlyMonthly
Structural measurements, including canopy height, stem density per unit area, average stem diameter recorded monthlyMonthly
Plant health monitored monthly using fluorimeterMonthly
Wetland Soil Porewater and Source Water Geochemistry:
Soil porewaters, piezometers, river and groundwater sampled twice and analysed to determine geochemical signature.July 2004, December 2004
Isotopic Signatures of Wetland Biogeochemical Function:
15N/14N and 18O/16O determined on water samples collected from porous cup samplers along transects, piezometers, borehole, river October 2004
15N/14N determined on vegetation samples collected along transectsOctober 2004
Table 2. 15N/14N and 18O/16O composition of nitrate in water samples. Boxford borehole is marked X on Figure 2. The Westbrook array is 300 m upstream from piezometer A5 on Figure 2.
 Sites Sampledδ15N
(‰ vs. AIR)
δ18O
(‰ vs. SMOW)
NO3-N
mg/L
Boreholes
 Westbrook array
   PL26 D-1, SO4-01126+3.9+25.84
   PL26 D-2, SO4-01127+4.0+66.29
   PL26 N-4, SO4-01131+4.3+16.87
   PL26 H-2, SO4-01134+3.9+56.09
   PL26 E-2, SO4-01138+4.1+36.05
 Boxford borehole (sampled 02-October-2004)+4.0+3
Boxford wetland (sampled 27-October-2004)
 B2 ‘short’ piezometer+4.5+25.76
 C1 piezometer +44.70
 C1 proto-stream lower+5.0+35.58
 C5 piezometer+4.6+36.67
 D1 proto-stream main+4.8+15.60

