GIS-Based Geomorphological Map of the Calore River Floodplain Near Benevento (Southern Italy) Overflooded by the 15th October 2015 Event

Department of Sciences and Technologies, University of Sannio, Via F. De Sanctis s.n.c., 82100 Benevento, Italy
*
Author to whom correspondence should be addressed.
Water 2020, 12(1), 148; https://doi.org/10.3390/w12010148
Submission received: 29 November 2019
/
Revised: 27 December 2019
/
Accepted: 30 December 2019
/
Published: 3 January 2020
(This article belongs to the Special Issue GIS Application in Fluvial Geomorphology and Landscape Changes)
Abstract
:On 15 October 2015, the floodplain of the Calore River underwent a destructive flood, with a stream stage increase up to 10 m. In this paper, we describe the GIS-based, object-oriented geomorphological map of the overflooded sectors of the Calore River floodplain near Benevento. The map graphically represents the field-checked results of a detailed geomorphological study carried out by means of GIS analysis of historical and topographic maps and orthophotos. Particular attention was devoted to the analysis of the channel adjustments experienced by the Calore River since the end of the 19th century, which shaped most of the landforms in the floodplain. The results showed that the investigated floodplain is characterized by abandoned channels, anthropogenic landforms, and five orders of recent river terraces separated by gently-sloping inactive fluvial scarps, less than 2 m high. On the oldest and/or more distal sectors of the floodplain, landforms are badly preserved, probably due to the more prolonged reshaping by natural erosional processes and anthropogenic activities, and to the high erodibility of the loose sediments in which they are shaped. The proposed map could be a key tool for a correct flood hazard assessment in the Benevento area, permitting thematic maps that avoid or reduce the negative effects of events similar to the 15 October 2015 flood.
1. Introduction
In the last decades, the need to strengthen the role of geomorphological mapping in territorial and environmental studies has prompted researchers to look for new operating standards [1,2,3], also due to advances in information technology and in aerial and satellite technology [4,5,6]. The new operating standards are required to contribute effectively to territorial planning and management [7,8]. The contribution by geomorphologists becomes crucial, especially where the geomorphological processes determine risks for the natural and anthropogenic systems. In setting these standards, it cannot be ignored the need to adopt interdisciplinary, integrated and interoperable approaches and criteria [2,9,10,11,12]. GIS technology meets these criteria, since it is able to store and process large amounts of spatial data, as well as extracting simultaneously earth surface information of different types and, therefore, compile maps in a very rapid and effective way [13]. This possibility is inherent in the structure of GIS technology, which selects and organizes information on different geo-referenced levels or layers [2,3]. Thus, it allows managing patterns of spatial information, overlaying and comparing them, even when attributable to different periods. Therefore, it is possible to produce “dynamic” and updatable cartographic representations, which also achieve the objective of being easily understandable to both editors and users.
For this purpose, the new operating standards based on the GIS procedures help the geomorphologists improve the representation of the physical landscape (in terms of processes, forms, and evolution) at different scales [2]. In practice, the improvement consists essentially of the use of full coverage representation and revision of the geomorphological legend. Both of them are based on the principle that every landscape, despite its complexity, is recognizable in a hierarchical order from which defines a legend, which is appropriate to display specific themes, for the purpose of the analysis and/or data resolution. In particular, each geomorphic system can be unbundled into sub-systems with a consequent increase of the cognitive detail; subsequently, also the legend will have a hierarchical and nested scheme [14], according to the requested detail and, thus, to the adopted scale (object-oriented analysis). An approach useful to fully understand the procedure described above derives from the experience of the Salerno University, which stresses the relationships between the working scale and the taxonomy of the geomorphic entities [9,15,16,17].
In full coverage geomorphological mapping, space is described by a series of “objects”. They are discretized as points, lines or polygons, and then defined in terms of characteristics such as location, topology and quantitative or qualitative attributes [2,3,16,18,19]. The various objects within the database can be grouped into classes according to the characteristics of the system. Hierarchies can be established because objects of the lower classes inherit properties defined in the upper ones. Each object is classified and cannot fall into more than one class. Therefore, the landforms observed in a given landscape can be connected to specific geomorphic processes acting over time on specific geomorphological units. The following spatial analysis and modelling can be carried out at class or object level [19,20,21]. Additional landform attributes, both qualitative and quantitative, can further improve the characterization and the state of activity of the process. Worthy to note is the fact that the object-based representation can produce classifications to any desired level of scale and/or detail. Any landform in any possible decompositions will be appropriately described depending on the scale, and then the specific field of application [9,15,16].
Object features obtained from field survey, aerial photos interpretation or map analysis are synthesized in the legend of the geomorphological map. In recent years, the increasing trend to describe in great detail the distribution of each landform regardless of the adopted scale, also highlighting exogenous and endogenous morphogenetic agents, made often difficult the comprehension of the map, especially for applicative purposes. The object-based representation required a revision of the geomorphological legend, also separating descriptive from interpretative information. To avoid different conclusions between the reader and the authors of the map, the legend should be purely descriptive [22]. In addition, it should highlight the spatial relationships of each landform with the adjacent ones and associated morphogenetic processes. In the legend review, two different approaches are possible: (a) the use of complete patterns [23] and/or of symbols, even if modified and adapted to GIS [10]; or (b) stressing the connections between each land surface discretized by GIS software and its morphogenetic process [16,24,25]. In the first approach, the legend combines lines, hatches, symbols and letters/figures with colors. More precisely, the symbols and hatchings are used to indicate hydrography, morphometry, lithology and structure, while color variations are used to highlight morphogenetic processes and geological age. Such an approach allows the inclusion of a broader range of parameters than previous geomorphological mapping systems. Thus, an area is described completely with its spatial mutual, chronological and genetic relationships between geomorphological features.
In the second approach, symbols are not used, except for the early stages of the work (e.g., field mapping). In this case, the legend uses different colors for the different types of landforms recognized from the object-based analysis, e.g., green for the river terraces, blue for channels, red for escarpments, neutral colors for the bars [26]. In the following decomposition aimed at producing a larger-scale map, i.e., in highlighting the spatial distribution of other attributes (age, grain size, etc.), different shades of the same color are used [4,25].
The application of this revision procedure, to be carried out in a GIS environment [12], allows building an easily readable geomorphological map of easy comprehension, with a large amount of qualitative and quantitative information that can be used at different scales. The attributes are stored in a GIS database associated with the mapping system that allows easy data processing and versatility in the representation. Obviously, detailed geomorphological knowledge of a given area (e.g., an alluvial plain) [24,25,27,28] cannot be overlooked. This knowledge could derive and/or can be strengthened by means of historical and topographic maps analysis, aerial photo interpretations and field surveys, as well as remotely sensed images of a given area during or after particular events [29]. The final geomorphological mapping enables representing the landscape in a clear and unequivocal way. In addition, it gives the opportunity to provide information about the types of future events (e.g., floods) [29,30,31] and, therefore, allows the assessment and prevention of natural hazards and risks [4,19,32,33,34,35]. GIS-based geomorphological mapping proved to be fundamental in evaluating hydrological and hydraulic models associated with floods [36]. In fact, integrated GIS-based hydro-geomorphic approaches allow overcoming difficulties and uncertainties in simulating flood hydrographs and flooded areas, such as the specific space-time scales of flood events, the lack or scarcity of rainfall and streamflow data and the short lag-time [37]. GIS is also widely used in monitoring river channel dynamics, which is helpful in the prevention and mitigation of floods [38], as they provide excellent tools for river channel spatial data extraction, processing, storage, visualization, and analysis [39]. As a final result, the prediction of the flooded areas for different return periods and the mapping of flooded zones can be achieved, so decision-makers can intervene effectively to protect areas with risk and reduce the impact of floods in the future [40].
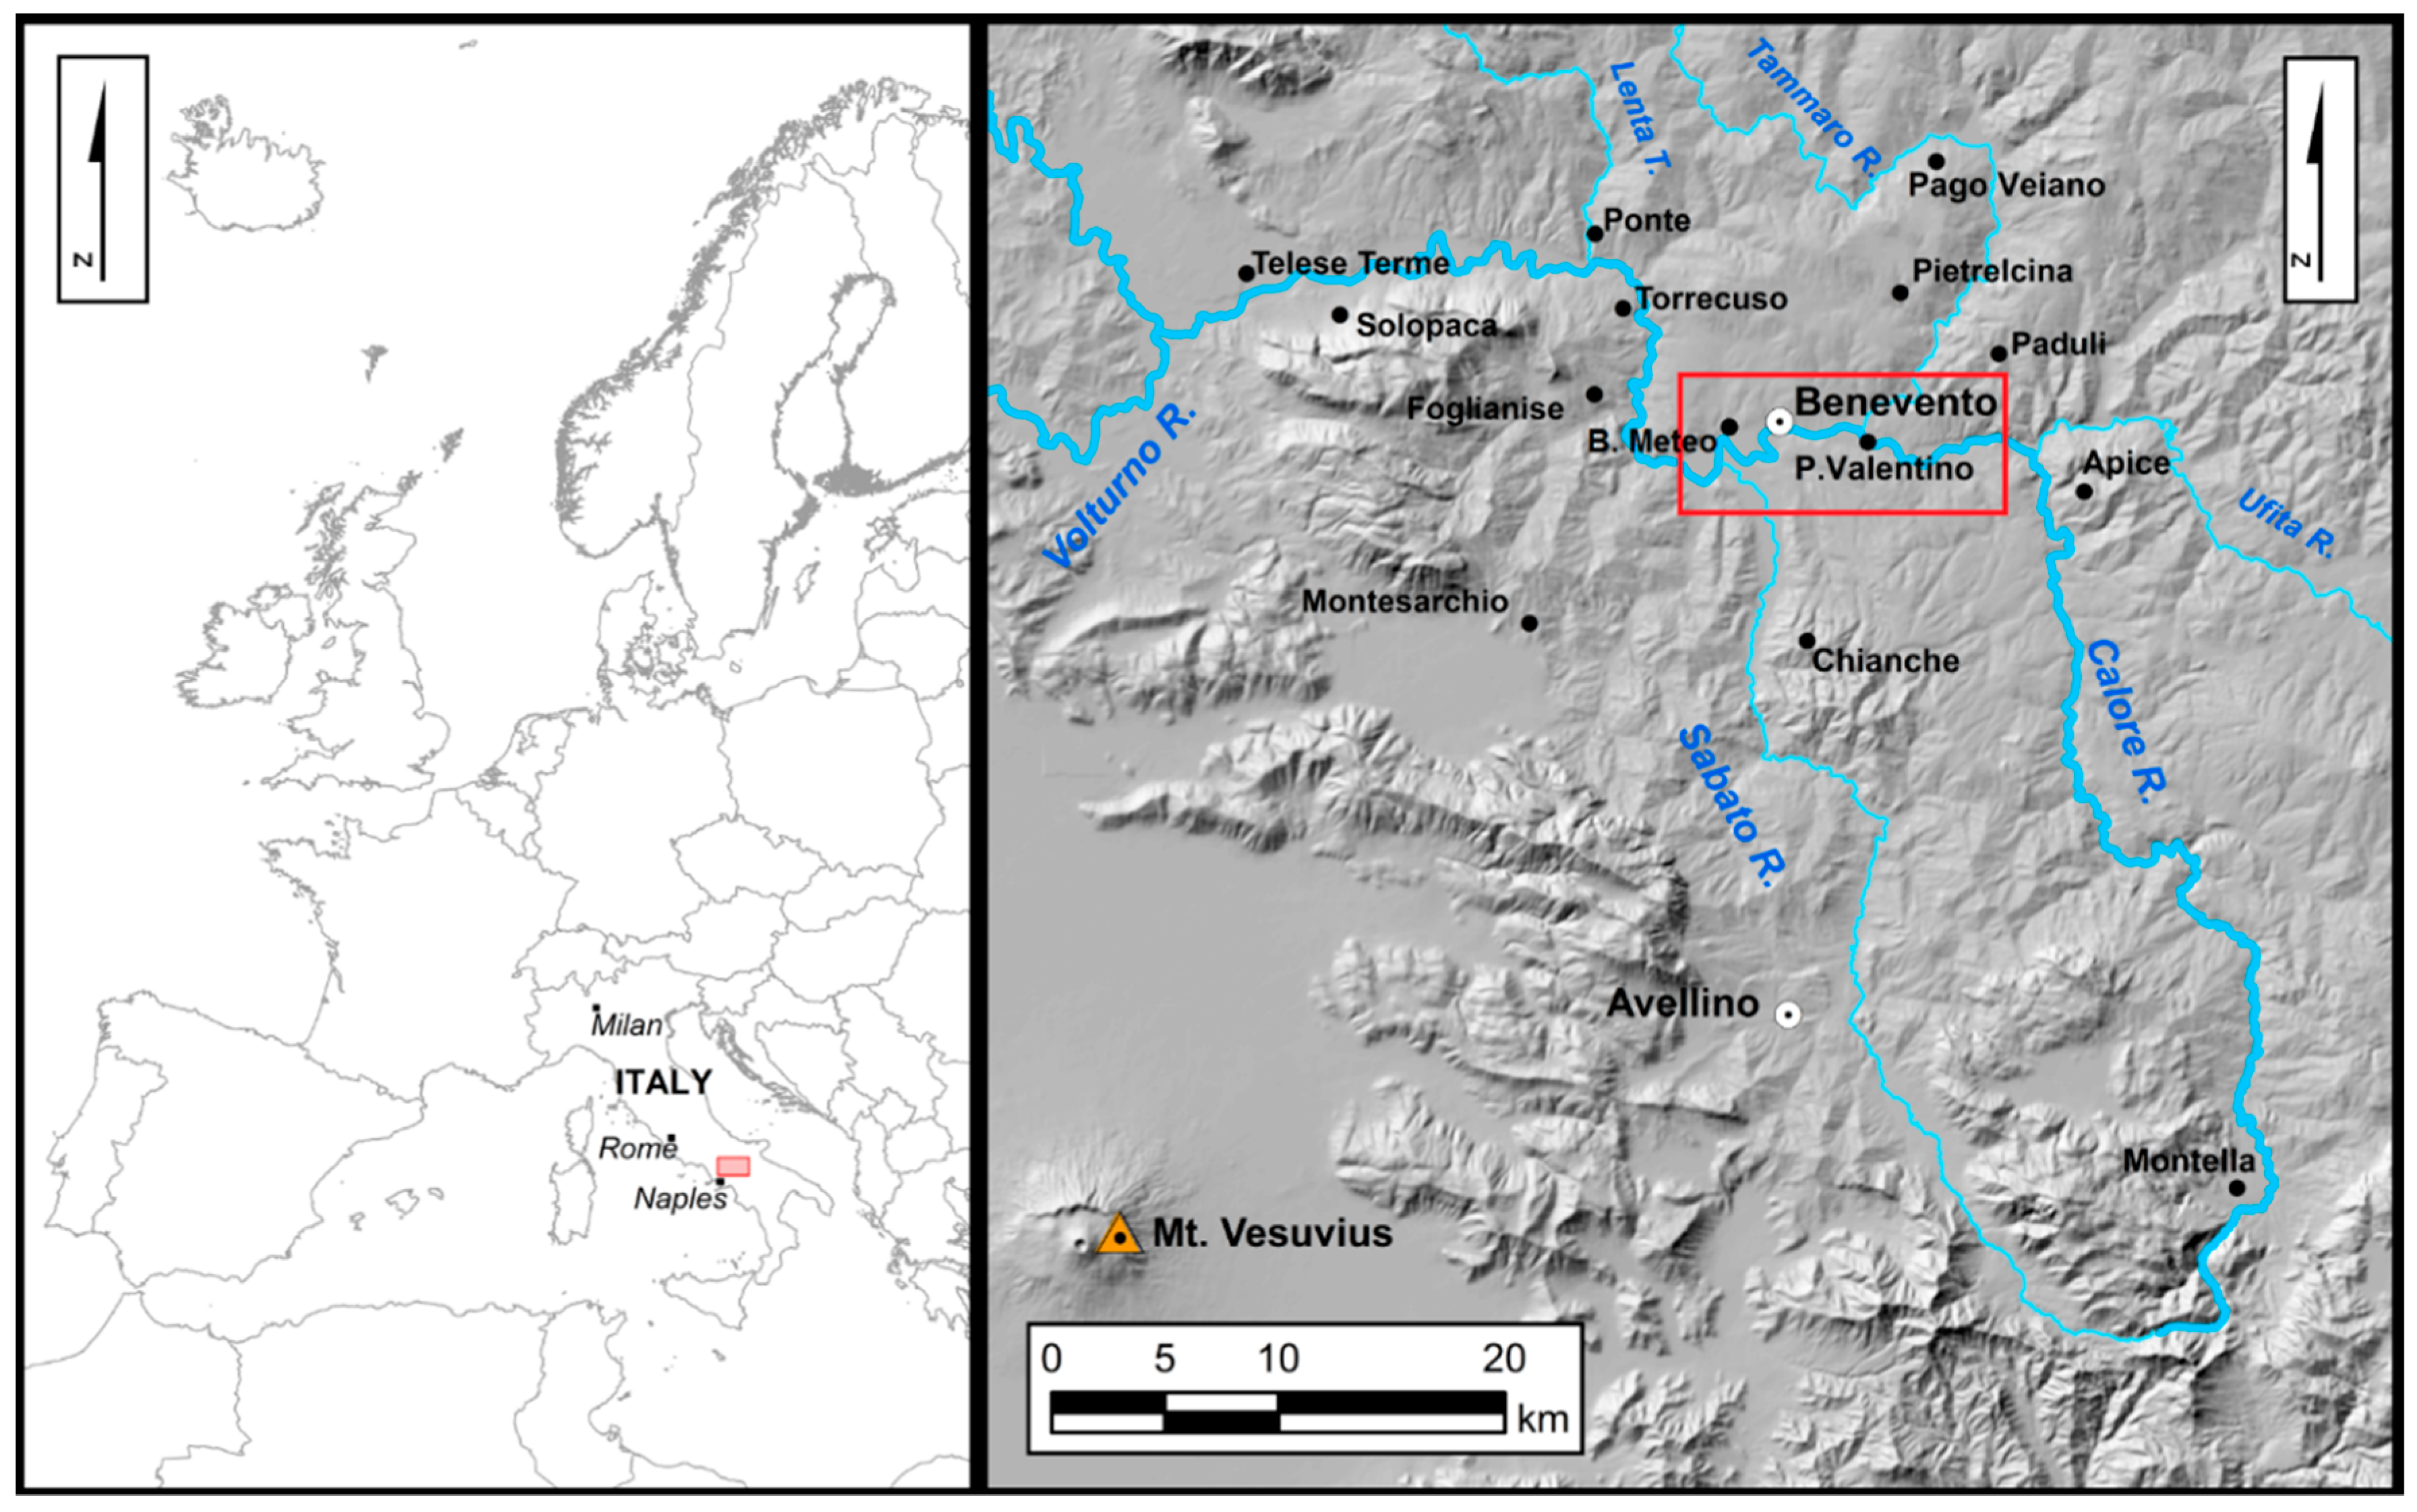
In this study, a GIS-based, object-oriented geomorphological map of the Calore River floodplain in the surroundings of Benevento (southern Italy; Figure 1), overflooded by the 15 October 2015 destructive flood [41] is presented.
Study Area
The Calore River is one of the major rivers of Southern Italy. It starts from the Accellica Mount, in the Avellino Province, and then crosses the Province and the town of Benevento before joining the Volturno River (Figure 1). The total length is approximately 110 km and the mean annual flow discharge, measured just upstream from the confluence into the Volturno River, is ~30 m3/s. In the second half of the 20th Century, the Calore River underwent remarkable channel adjustments, partly induced by anthropogenic disturbances. They consisted of a mean narrowing by 66%, with a peak of 86%, an increase in channel length and sinuosity, and a riverbed lowering of 3–4 m; these changes led the channel morphology to change from transitional to single-thread [42].
The Calore River basin is about 3050 km2-wide and is located within the axis of the Campanian sector of the Southern Apennines fold-and-thrust belt, which is the result of compressional tectonics mainly active during Tertiary [43]. The valley pattern of the Calore River is strongly controlled by tectonics, as highlighted by the four subsequent segments forming 90° angles with each other described by the river [44] (Figure 1).
The study area corresponds to the portion of the Calore River floodplain comprised between 41°07′ N and 41°09′ N latitude and 14°44′ E and 14°51′ E longitude (Figure 1).
From a lithological standpoint, the pre-Quaternary substratum of the study area consists of multi-colored claystone, marl and clayey-marl of the “Argille Varicolori” Fm., Upper Oligocene to Burdigalian in age, on which yellowish sands and sandstone, laterally passing to greyish siltstone and belonging to the Baronia Fm., Upper Zanclean to Piacenzian in age, unconformably rest [45]. This pre-Quaternary substratum was tectonically deformed since Pliocene and a depression named “Benevento basin”, was produced [46,47]. The basin was infilled by Quaternary alluvial and, subordinately, fluvio-lacustrine deposits, consisting of polygenetic and heterometric gravels, locally with sandy and silty intercalations, and belonging to the sub-sinthems of Castello del Lago (Middle Pleistocene in age), Capodimonte (Middle Pleistocene), Benevento (Middle-Upper Pleistocene), and Fiume Ufita (Upper Pleistocene-Holocene) [45]. The lithological framework of the study area is completed by a few meters of current alluvial deposits of the Calore River, unconformably resting on the older ones and consisting of loose gravels, sands and pelites.
From a geomorphological point of view, in the Benevento basin, at least four orders of land surfaces, interpreted as remnants of depositional glacis [47], shaped in the alluvial and fluvio-lacustrine deposits described above, whose ages range from Middle Pleistocene to Holocene, are present. The oldest land surfaces are geomorphologically connected upslope with remnants of a glacis, i.e., a long, gently-sloping land surface of erosional origin, locally tectonically uplifted [47]. In turn, the remnants of the erosional glacis are connected upslope with the border relieves through concave depositional land surfaces. The hydrographic network is currently downcutting and shapes the relict land surfaces described above into isolated remnants. The hydrographic network is dominated by the Tammaro and Sabato Rivers, which are the main tributaries of the Calore River (Figure 1), and also consists of a number of streams with a torrential regime. Along the slopes of the tributary valleys, evidence of water and mass soil erosion are clearly observable [47].
The climate in the study area is of a Mediterranean type. The mean annual rainfall is approximately 990 mm. November is the rainiest month, while July is the driest. Rainfall induced several flood events along the Calore River and its tributaries. The most destructive one occurred on 2 October 1949 and was characterized by a peak in the flow discharge of more than 3000 m3/s, causing 17 casualties, 300 missing, 25 injured people, 1500 homeless, and more than 10,000 ha of arable lands overflooded and damaged [48]. Other recent destructive floods of the Calore River in the surroundings of Benevento occurred on 26 September 1951, 16 December 1952 and, finally, between 17 and 20 December 1968 (this latter with a peak in the flow discharge of ~2500 m3/s). These data confirm that the study area is characterized by one of the highest flood hazard risks in southern Italy [48].
2. Materials and Methods
The GIS-based, object-oriented geomorphological map described in this paper is the result of a detailed geomorphological analysis, which consisted of topographic maps and air-photos interpretation, integrated with a multi-temporal and morphometric analysis of the Calore River channel performed in a GIS environment, and geomorphological field mapping.
As stated by several authors [3,10,15,17], a universally accepted legend for GIS-based object-oriented geomorphological maps still does not exist. In the geomorphological map presented here, all the detected landforms were represented as polygons. Different colors were used for different types of landforms [25,26,49]: green for river terraces; blue for channels; “warm” colors for scarps; and neutral colors for anthropogenic landforms. Different shades of the same color were used providing information about the age of each landform. Symbols inside polygons were used only when they enhanced the readability of the map. When this was the case, both the symbols type and color were changed to allow distinguishing landforms of the same origin, but of different age (e.g., different orders of river terraces).
Because the geomorphology of a floodplain is almost totally dominated by fluvial landforms that are mainly shaped by recent channel adjustments, the multi-temporal and morphometric analysis of the Calore River channel in the last 140 years was the first step that led producing the final geomorphological map. The analysis of the channel adjustments was mainly performed using the ESRI ArcGIS 10.4 software. Topographic maps, provided by the Italian Geographic Military Institute (IGMI), and orthophotos, provided by Regione Campania authority, were used (Table 1). In particular, the analysis was based on: (1) three 1:50,000-scale topographic historical map sheets dated back to 1870, 1909, and 1936, respectively, based on the Sanson Flamsteed projection (datum: Roma 40 system and Bessel Ellipsoid-Genoa oriented international spheroid); (2) a 1:25,000-scale topographic map dated back to 1955 (Gauss Boaga—Transverse Mercator conformal projection; datum: ED 50—European Geodetic Reference System); and (3) 1:10,000 and 1:5000-nominal scale color orthophotos dated back to 1998 and 2011, respectively, for which the projection and datum were the same of 1:25,000-scale topographic maps. All the topographic maps were scanned at 8 bit, in grey-scale, at a resolution ranging from 300 to 1200 dpi, rectified and georeferenced in a GIS environment (ArcGIS 10.4 software, provided by ESRI, Redlands, CA, USA), in the UTM33 WGS84 coordinate system, Transverse Mercator projection. A number of 22 Ground Control Points, mainly located in the proximity of the river channel, was used. First-order polynomial transformations were applied to topographic maps from 1870, 1909, and 1936, while a second-order polynomial transformation was applied to maps from 1955. The orthophotos were provided already georeferenced by the issuer.
For each year of production of the used materials (Table 1), the fluvial erosional scarps (i.e., steep scarps bordering the active channel, shaped during phases of channel incision), the bars (i.e., sedimentary bodies within the active channel) and the low-flow channels (i.e., the channels during low-flow stages) were manually digitized in a GIS environment. This also allowed obtaining data about the changing, in the last 140 years, in the channel mean width, sinuosity and morphology. Channel mean width was calculated by dividing the channel area by the centerline length, while sinuosity was calculated by dividing the channel length by the valley axis length [50]. The ratio between the fluvial bars area (BA) and the active channel area (CA) was also calculated and expressed in percent (hereinafter, BA/CA index). The variations in the considered parameters (mean width, sinuosity, BA/CA index) were expressed by calculating differences in the considered parameter values between two consecutive years of topographic maps and/or aerial photo production (e.g., 1870–1909; 1909–1936; and so on). Each calculated difference was then divided by the value of the considered parameter on the older map/aerial photo. The result was finally expressed in percent.
The digitized active channels were then overlaid and intersected to create a “base-map” to be integrated, checked, and completed by further aerial photos and topographic maps interpretations and field-surveyed data. The polygons digitized on the older and smaller-scale maps were overlaid to both larger-scale (1:25,000) topographic maps and color orthophotos (at 1:10,000 and 1:5000 nominal scale; Table 1), with the aim to refine their boundaries and position, also according to changes in tone, texture, pattern and/or color detected on the aerial photos.
All the landforms digitized as polygons in the preliminary GIS-analysis described above were then checked in the field. The geomorphological mapping was carried out at 1:10,000 scale. Particular attention was devoted to the survey of abandoned channels (i.e., linear, smooth depressions representing remnants of older and currently inactive river channels), inactive fluvial scarps (i.e., formerly active fluvial scarps that were degraded by erosional agents after channel abandonment) and river terraces (i.e., remnants of former and currently inactive floodplains). The exact locations of most of these geomorphological features were determined using a GPS; this further contributed to reducing the positional errors of the landforms mapped on the oldest and less detailed topographic maps. The mapping was carried out taking into account the existing literature concerning methods of geomorphological mapping of rivers and floodplains [11,50,51]. Floodplain landforms such as active and abandoned channels, river terraces, degraded fluvial scarps, active bars and anthropogenic landforms (e.g., sediment extraction sites and urbanized areas) were surveyed. Their surface area was automatically calculated by the software. Simultaneously, a geodatabase was constantly updated with attributes regarding the type, the age, and the surface area of each landform.
Finally, the brief hydrometric and rainfall characterization of the 15 October 2015 event (Table 2) was carried out: (1) by downloading and processing water level data of the Calore River recorded and provided by Protezione Civile Regione Campania, freely-available at the website http://centrofunzionale.regione.campania.it; (2) by processing 10-min rainfall data, recorded and provided by Regione Campania authority.
3. Results
3.1. The 15 October 2015 Event: A Brief Outline
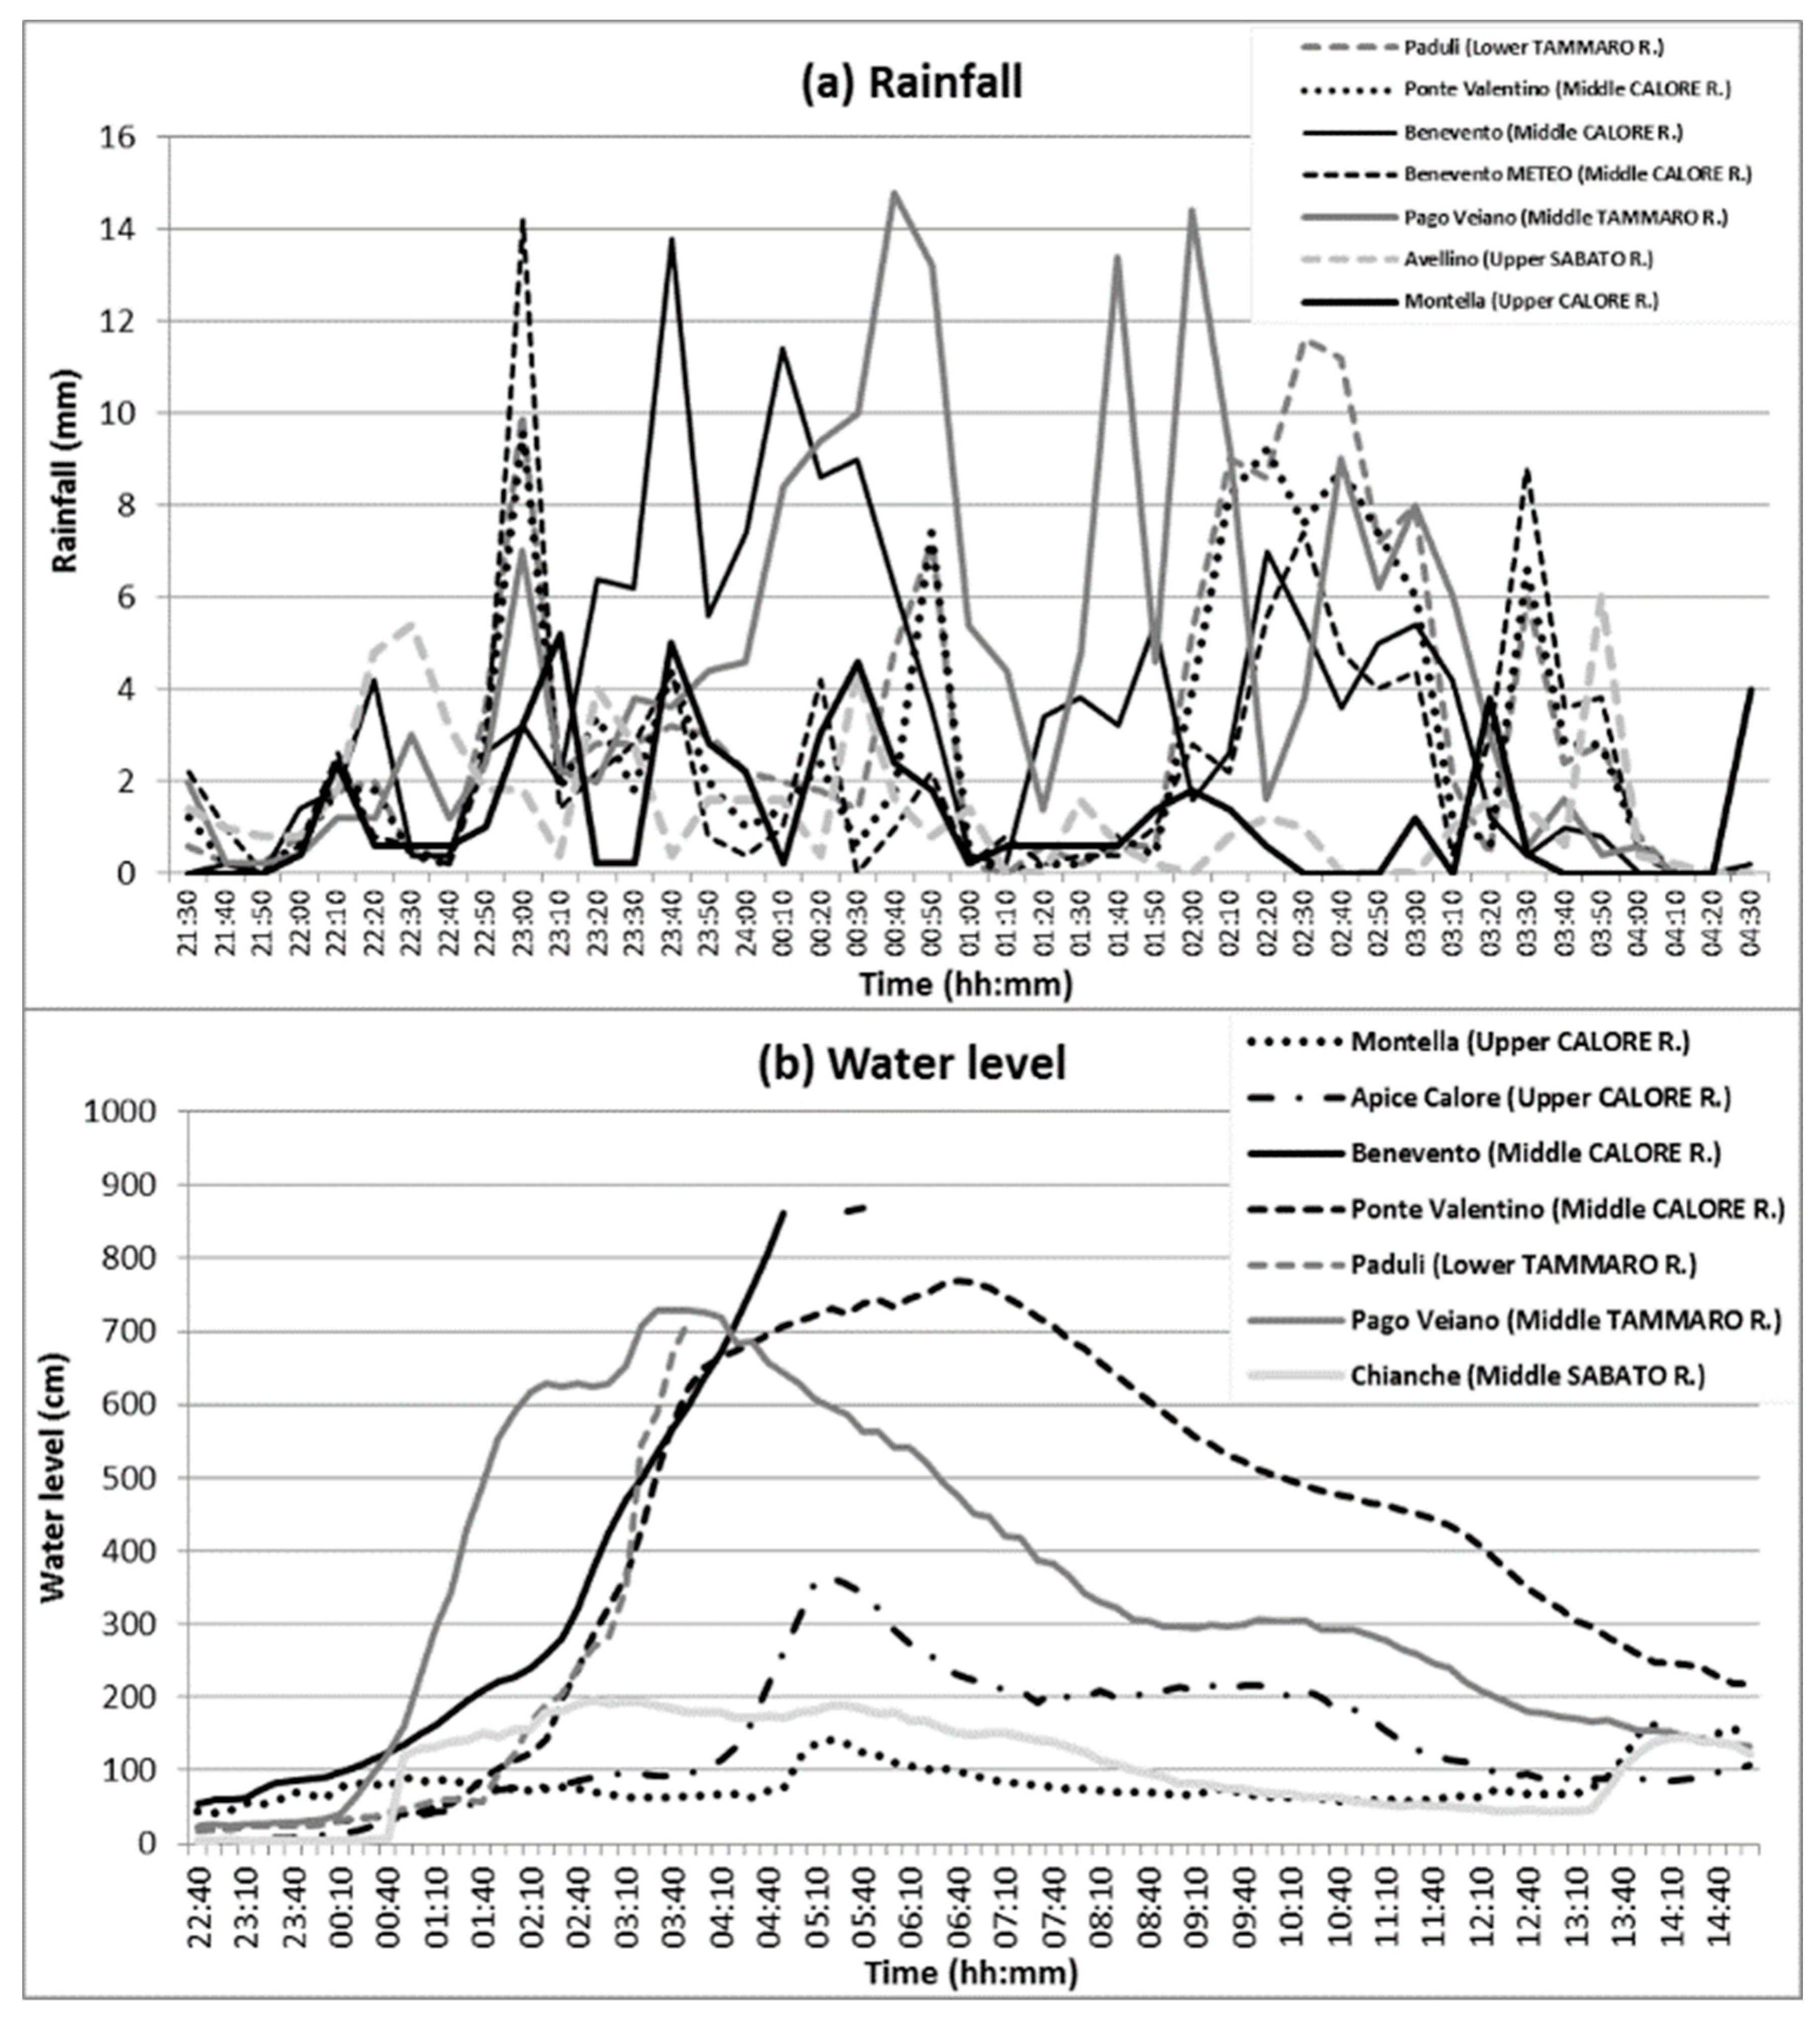
The main rainfall features of the 15 October event, which led to the overflooding of the area investigated in this study, are reported in Figure 2a and Table 2. The location of the rain-gauge stations is shown in Figure 1.
The event hit a relatively small area, i.e., the surroundings of Benevento and the middle-lower Tammaro River basin, as highlighted by the low rainfall values recorded both in the upper part of the Calore River basin (namely, at the Montella rain-gauge station) and in the neighboring Sabato River basin (see Avellino rain-gauge station; Figure 2a).
After several tens of minutes of light rain, the event started approximately at 22:40 p.m. (Figure 2a) and was recorded simultaneously in the Benevento Meteo, Benevento, Ponte Valentino, Paduli and Pago Veiano rain-gauge stations (see Figure 1 for locations). In the Benevento Meteo station, 14.2 mm of rain fell in less than 10 min. In the Benevento area, the event was particularly intense till 01:00 p.m. From 0:10 a.m., it mainly affected the middle Tammaro River basin, as highlighted by the high rainfall peaks recorded at the Pago Veiano rain-gauge station (Figure 2a). From 01:50 p.m., the lower Tammaro River basin (Paduli rain-gauge station) was also severely hit by heavy rain. The event progressively decreased in intensity and ended approximately at 04:10 a.m. in all the considered stations (Figure 2a).
The effects of the rainfall event described above on the stream stages of the main rivers flowing through the study area are reported in Figure 2b. The flood firstly affected the Tammaro River and started to be recorded at 0:10 a.m. at the Pago Veiano stream gauge and at 01:40 a.m.at the Paduli stream gauge (Figure 2b), the latter was located downstream from Pago Veiano and very close to the confluence into the Calore River (Figure 1).
The maximum increase of the stream stage of the Tammaro River at Pago Veiano was of 7.28 m above the riverbed height in the considered section and was recorded at 03:30 a.m., while the Paduli stream gauge was irreversibly damaged by the flood at 03:50 a.m. when the stream stage was at 7.15 m above the riverbed height. The flood wave of the Tammaro River joined the Calore River at 02:20 a.m. (Ponte Valentino stream gauge). The highest stream stage of the Calore River was recorded at the Benevento streamgauge at 05:40 a.m., just before the stream gauge was destroyed by the flood, and was at 8.70 m above the riverbed height. However, land surfaces located ~10 m above zero-level were completely submerged, thus the stream stage was higher than that recorded by the stream gauge before it was destroyed. A secondary and less important flood wave of the Calore River (stream stage <4.0 m) was recorded later (i.e., from 04:00 a.m.; Figure 2b) at the Apice stream gauge, located upstream from the confluence of the Tammaro River into the Calore River, i.e., outside the study area (Figure 1), thus this flood wave was not fed by the Tammaro River flood. Finally, the Sabato River did not undergo significant flood events, as highlighted by the stream stages measured at the Chianche stream gauge (Figure 2b).
Recent studies [41] found that the flood covered an overall area of about 30 km2 of the entire Calore River floodplain and reached a maximum river stage of ∼9.8 m at the Solopaca stream gauge station, located a few tens of kilometers downstream from the study area (Figure 1). A very similar stage of ∼9.5 m was also estimated in Benevento [41]. As previously stated, an event similar to the flood described in this paper occurred in 1949. A mark of the water level that was reached during the 1949 flood is sculpted on the far northwestern pile of the Maria Cristina Bridge, built up in 1835 in proximity to Solopaca (Figure 1). It shows that during the 1949 flood, the river stage was more than 10 m higher than the riverbed height. Thus, it was slightly higher than the river stage during the 2015 flood (i.e., 9.8 m). During the 1949 flood, a peak of the flow discharge was measured at the “Ponte di Annibale” stream gauge station, located just downstream from the confluence of the Calore River into the Volturno River (Figure 1). The peak in the flow discharge was at 3200 m3/s. Even if no precise measurements of the Calore River flow discharge during the 2015 flood were available, given the similar river stages during the two considered floods, the peak in the flow discharge during the 2015 event was probably not so far from the one measured in 1949. Unfortunately, no data about other destructive floods of the Calore River (e.g., 1951, 1952 and 1968 floods) are currently available, in terms of both river stages and flow discharges.
With regard to the landform processes, the 2015 flood was particularly destructive in the river stretches that were not confined by walls, such as those located within the town of Benevento, where the walls are more than 10 m high. The unprotected floodplain sectors were completely overflooded for several days. At the confluence with the main tributaries, i.e., the Tammaro River on the northern side of the valley and the Sabato River on the southern side (Figure 1), the magnitude of the flood was particularly high and the effects were numerous [52]. In particular, in the industrial area of Benevento, located at the confluence of the Tammaro River into the Calore River (Figure 1), all of the factories were damaged or completely destroyed. In addition, the high-quality vineyards widely diffused in the floodplain were severely damaged by the flood. Here, the mud covered the basal portion of the vines for a long time after the event. Several years after the flood, the trees of the riparian vegetation are still bent in the direction of the flood-flow. It was estimated that the flood caused about €1 billion worth of damage to local agriculture [25]. Moreover, several riverbank collapses and evidence of other erosional processes were recognizable. Floodplain accretion was widespread. Locally, sedimentary accumulations, even with blocks of a few tens of centimeters, were observed, in particular, where deeply-incised and very steep tributary channels met the alluvial plain. Such high sediment load was due to the intense erosion caused by these tributaries on the poorly cemented deposits in which their banks are shaped [52] and, moreover, by the severe water erosion processes (i.e., sheet, rill and gully erosion) and landslides of different type and size that diffusely affected the basin slopes.
3.2. The GIS-Based Geomorphological Map
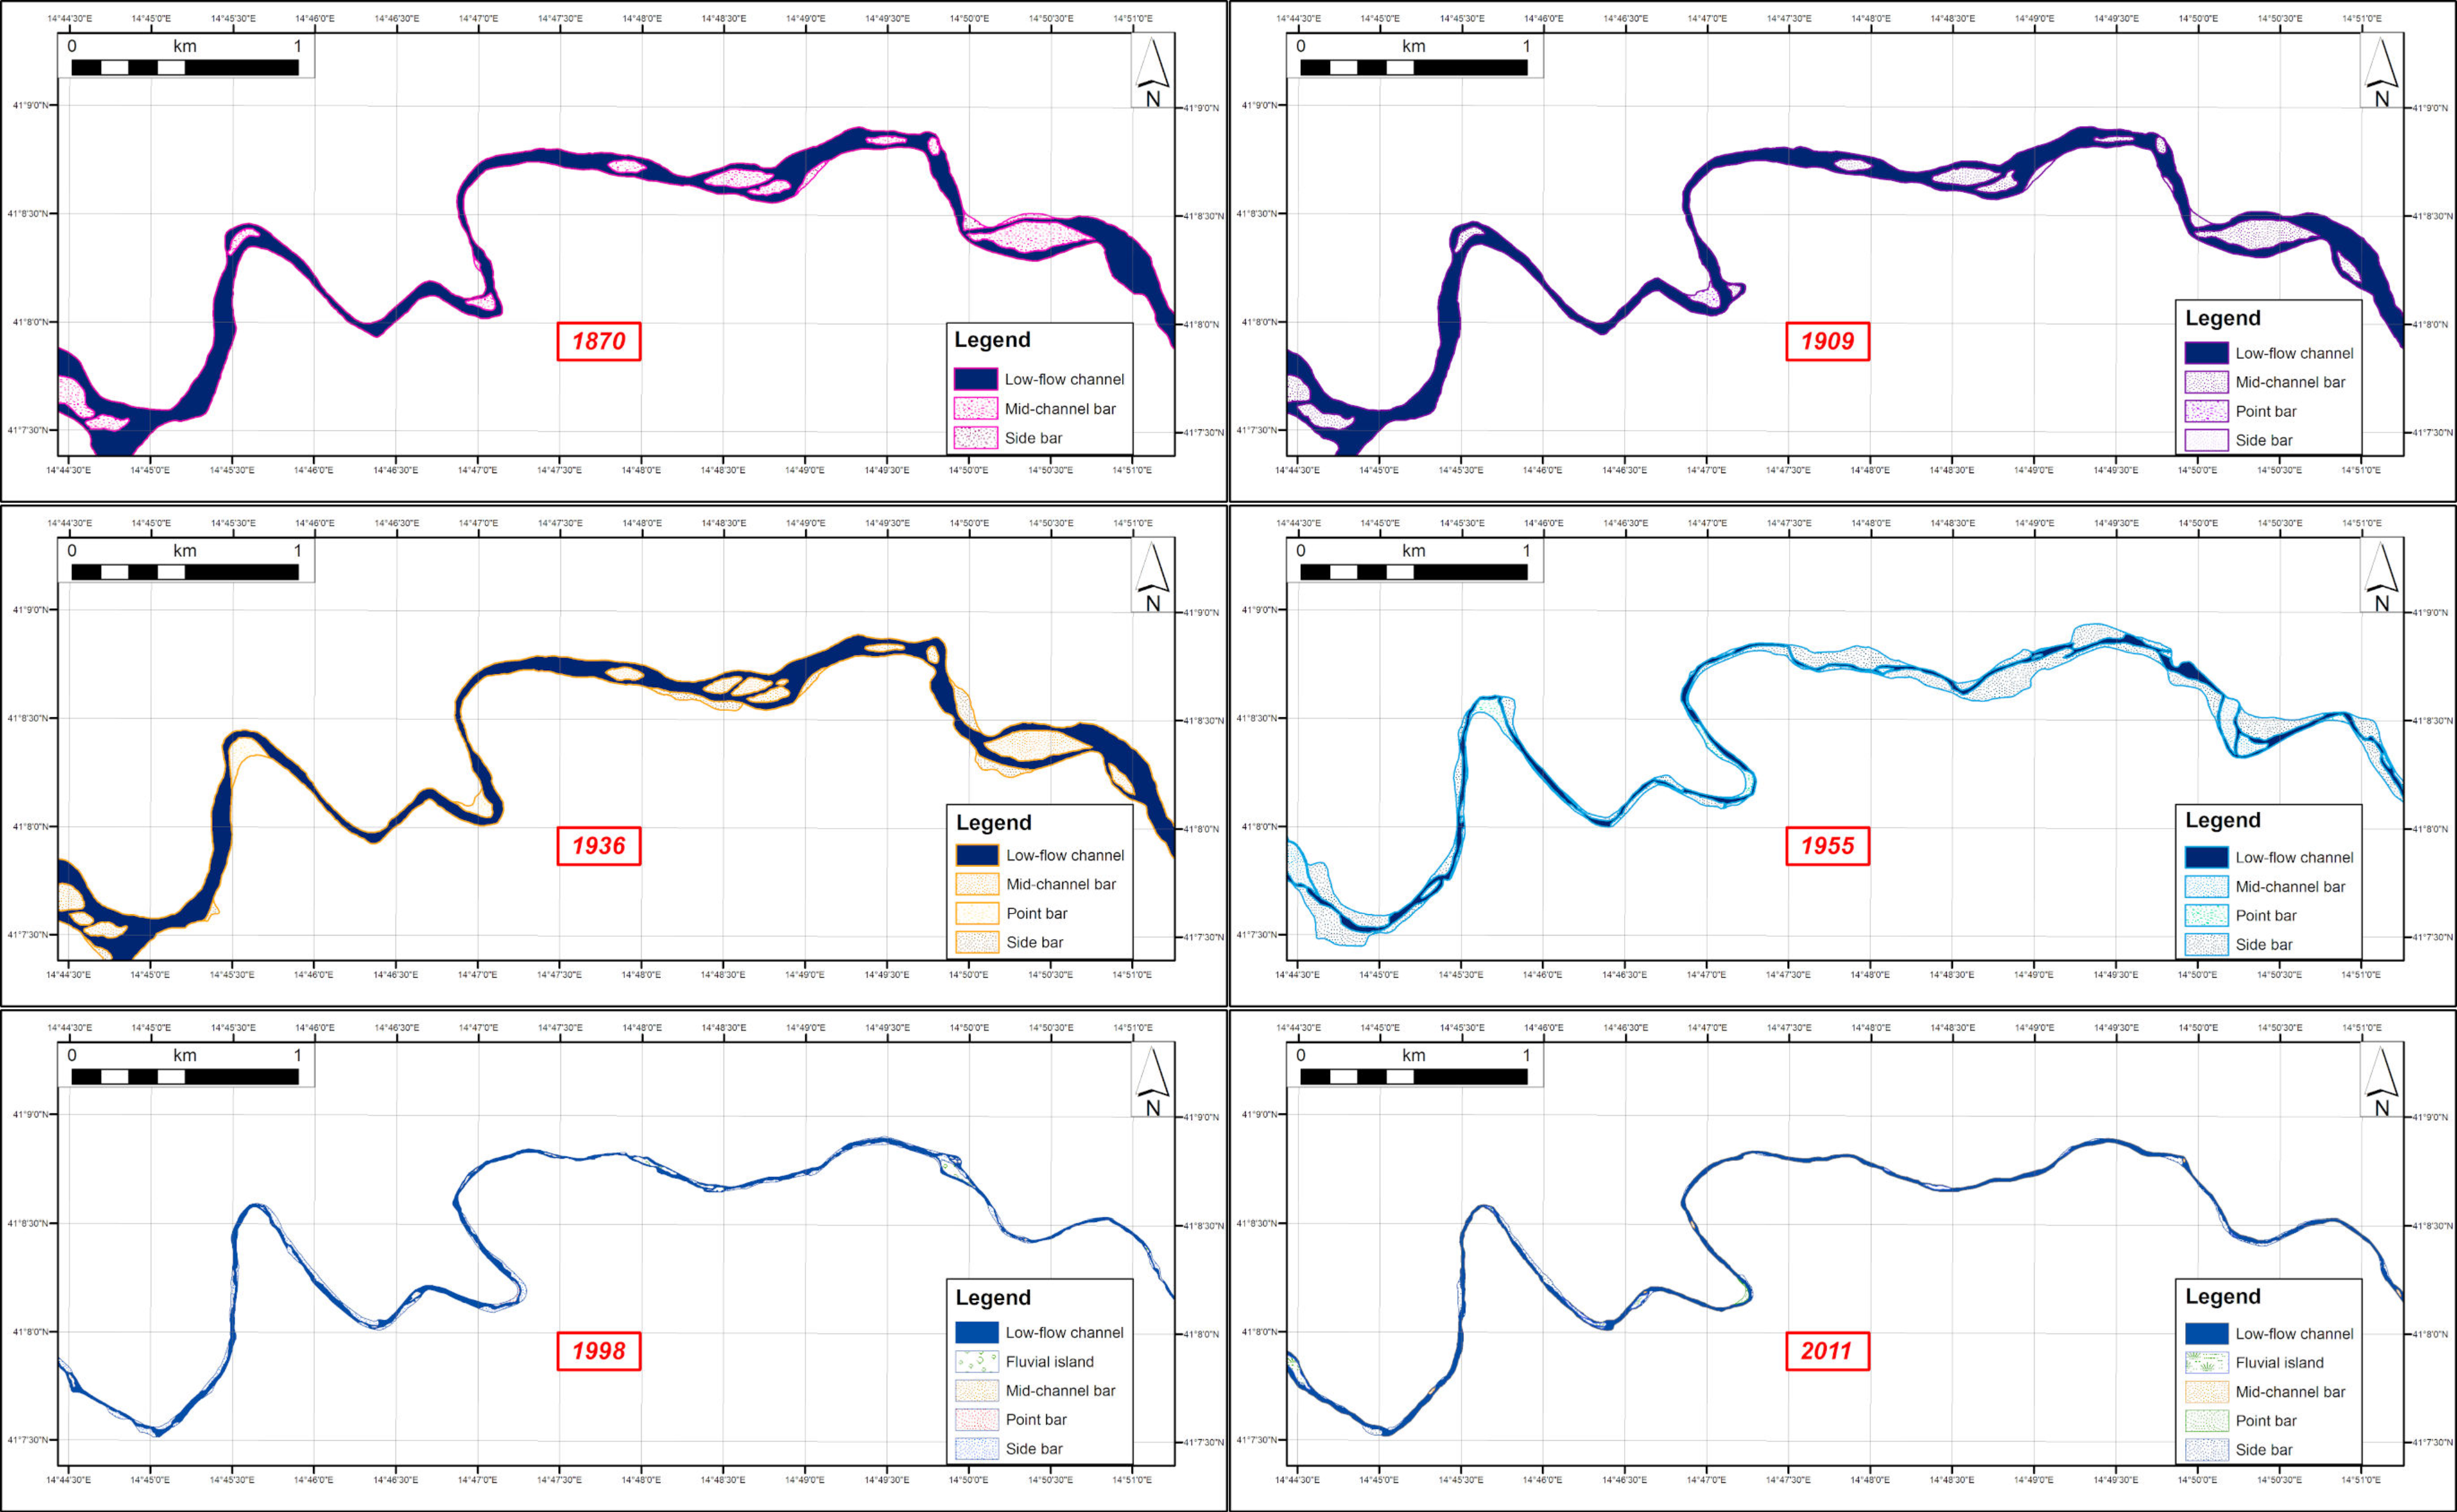
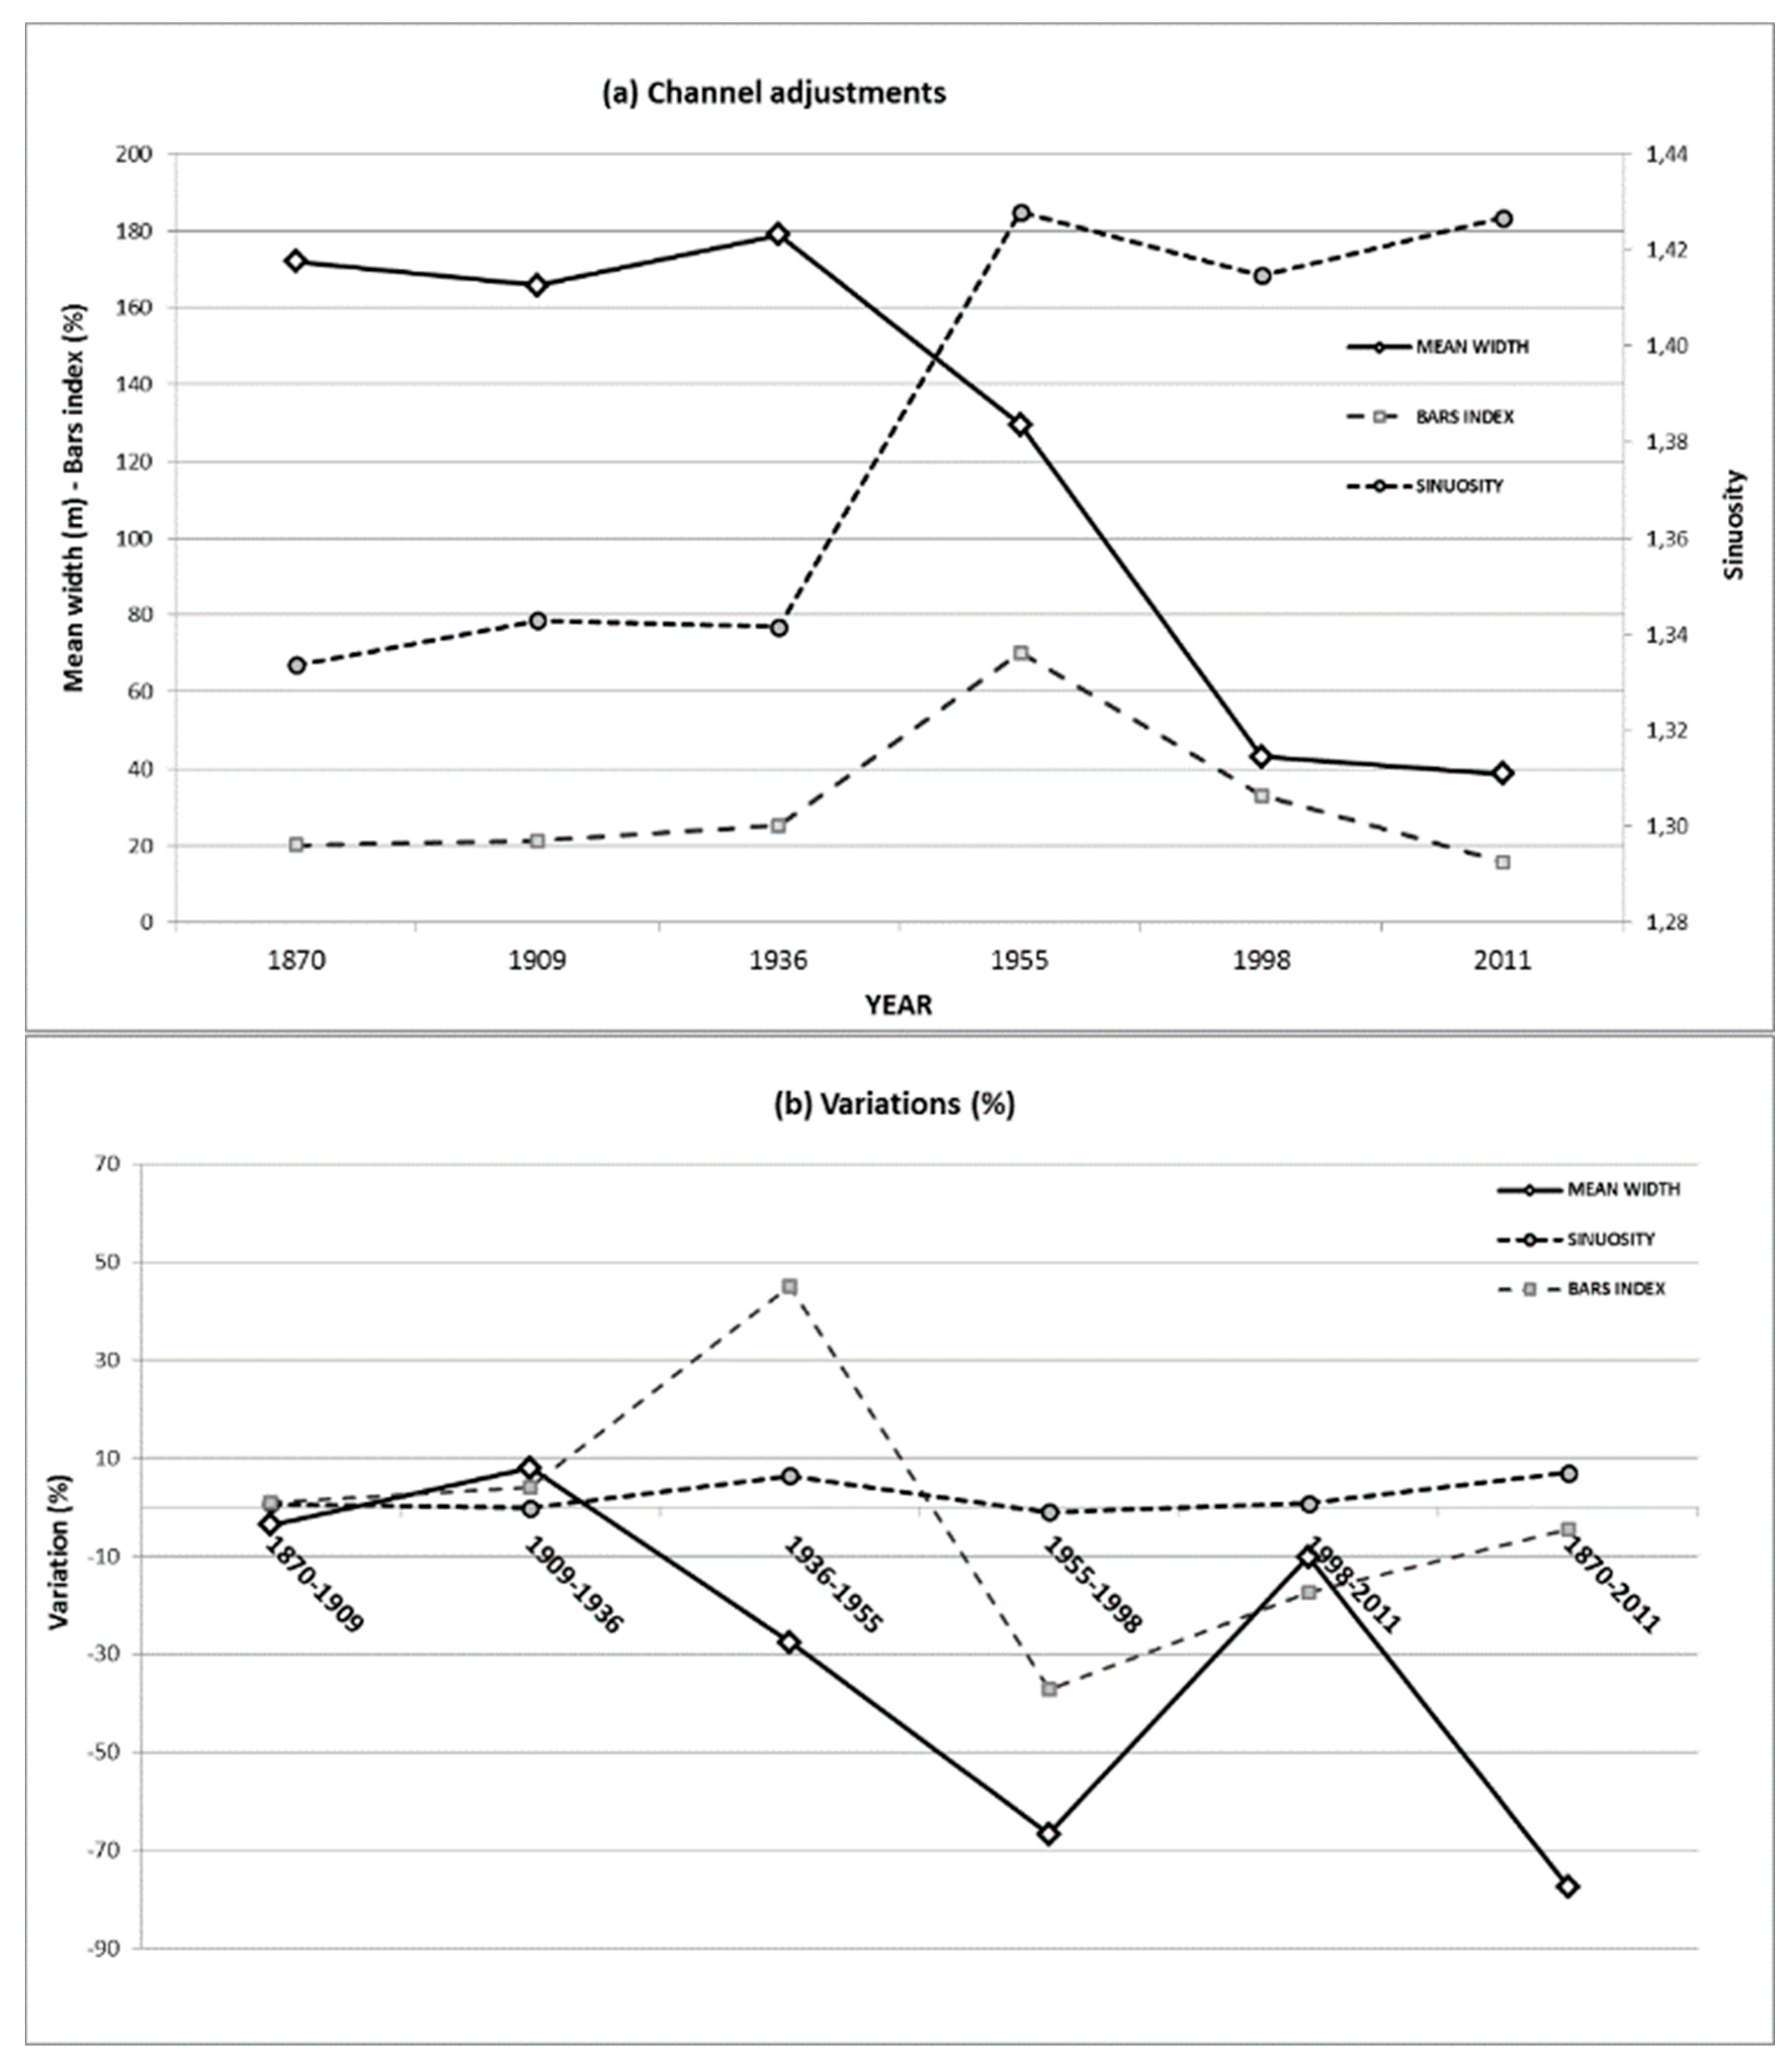
As underlined in the “Materials and Methods” section, because most of the landforms occurring in a floodplain are produced by channel adjustments, the multi-temporal and morphometric analysis of the channel adjustments experienced by the Calore River in the studied area in the last 140 years was the first step in the compilation of the GIS-based, object-oriented geomorphological map. The main results of such analysis are reported in Figure 3 and Figure 4.
Figure 3 shows the changes in channel morphology experienced by the investigated segment of the Calore River. Between 1870 and 1936, the channel was mainly single-thread, with large-sized bars and fluvial islands. Most of the mid-channel bars and islands were dissected mainly between 1909 and 1936, while others joined the riverbanks and became point or side-bars or, later, river terraces. Figure 4 shows that, during the period 1870–1936, no significant changes affected the channel, which was much larger than today (Figure 4a). Between 1936 and 1955, the percent of the channel area consisting of bars (“Bars index”) drastically increased (Figure 4b) and the channel morphology changed from single-thread to transitional (Figure 3). The channel mean width decreased by 28% (i.e., from 179 to 129 m), while the sinuosity increased (Figure 4b). Between 1955 and 1998, the channel narrowing was the highest, i.e,. from 129 to 43 m (67%). The “Bars index” reduced and the channel morphology became single-thread, locally with alternate bars. In this time span, a riverbed degradation up to 3–4 m occurred [42]. Between 1998 and 2011, slight channel adjustments occurred. They consisted of a channel widening by ~10%, a slight increase in sinuosity and a decrease of 17% of the “Bars index”. In the whole investigated period (i.e., between 1870 and 2011), the channel mean width decreased by 78% (Figure 4b).
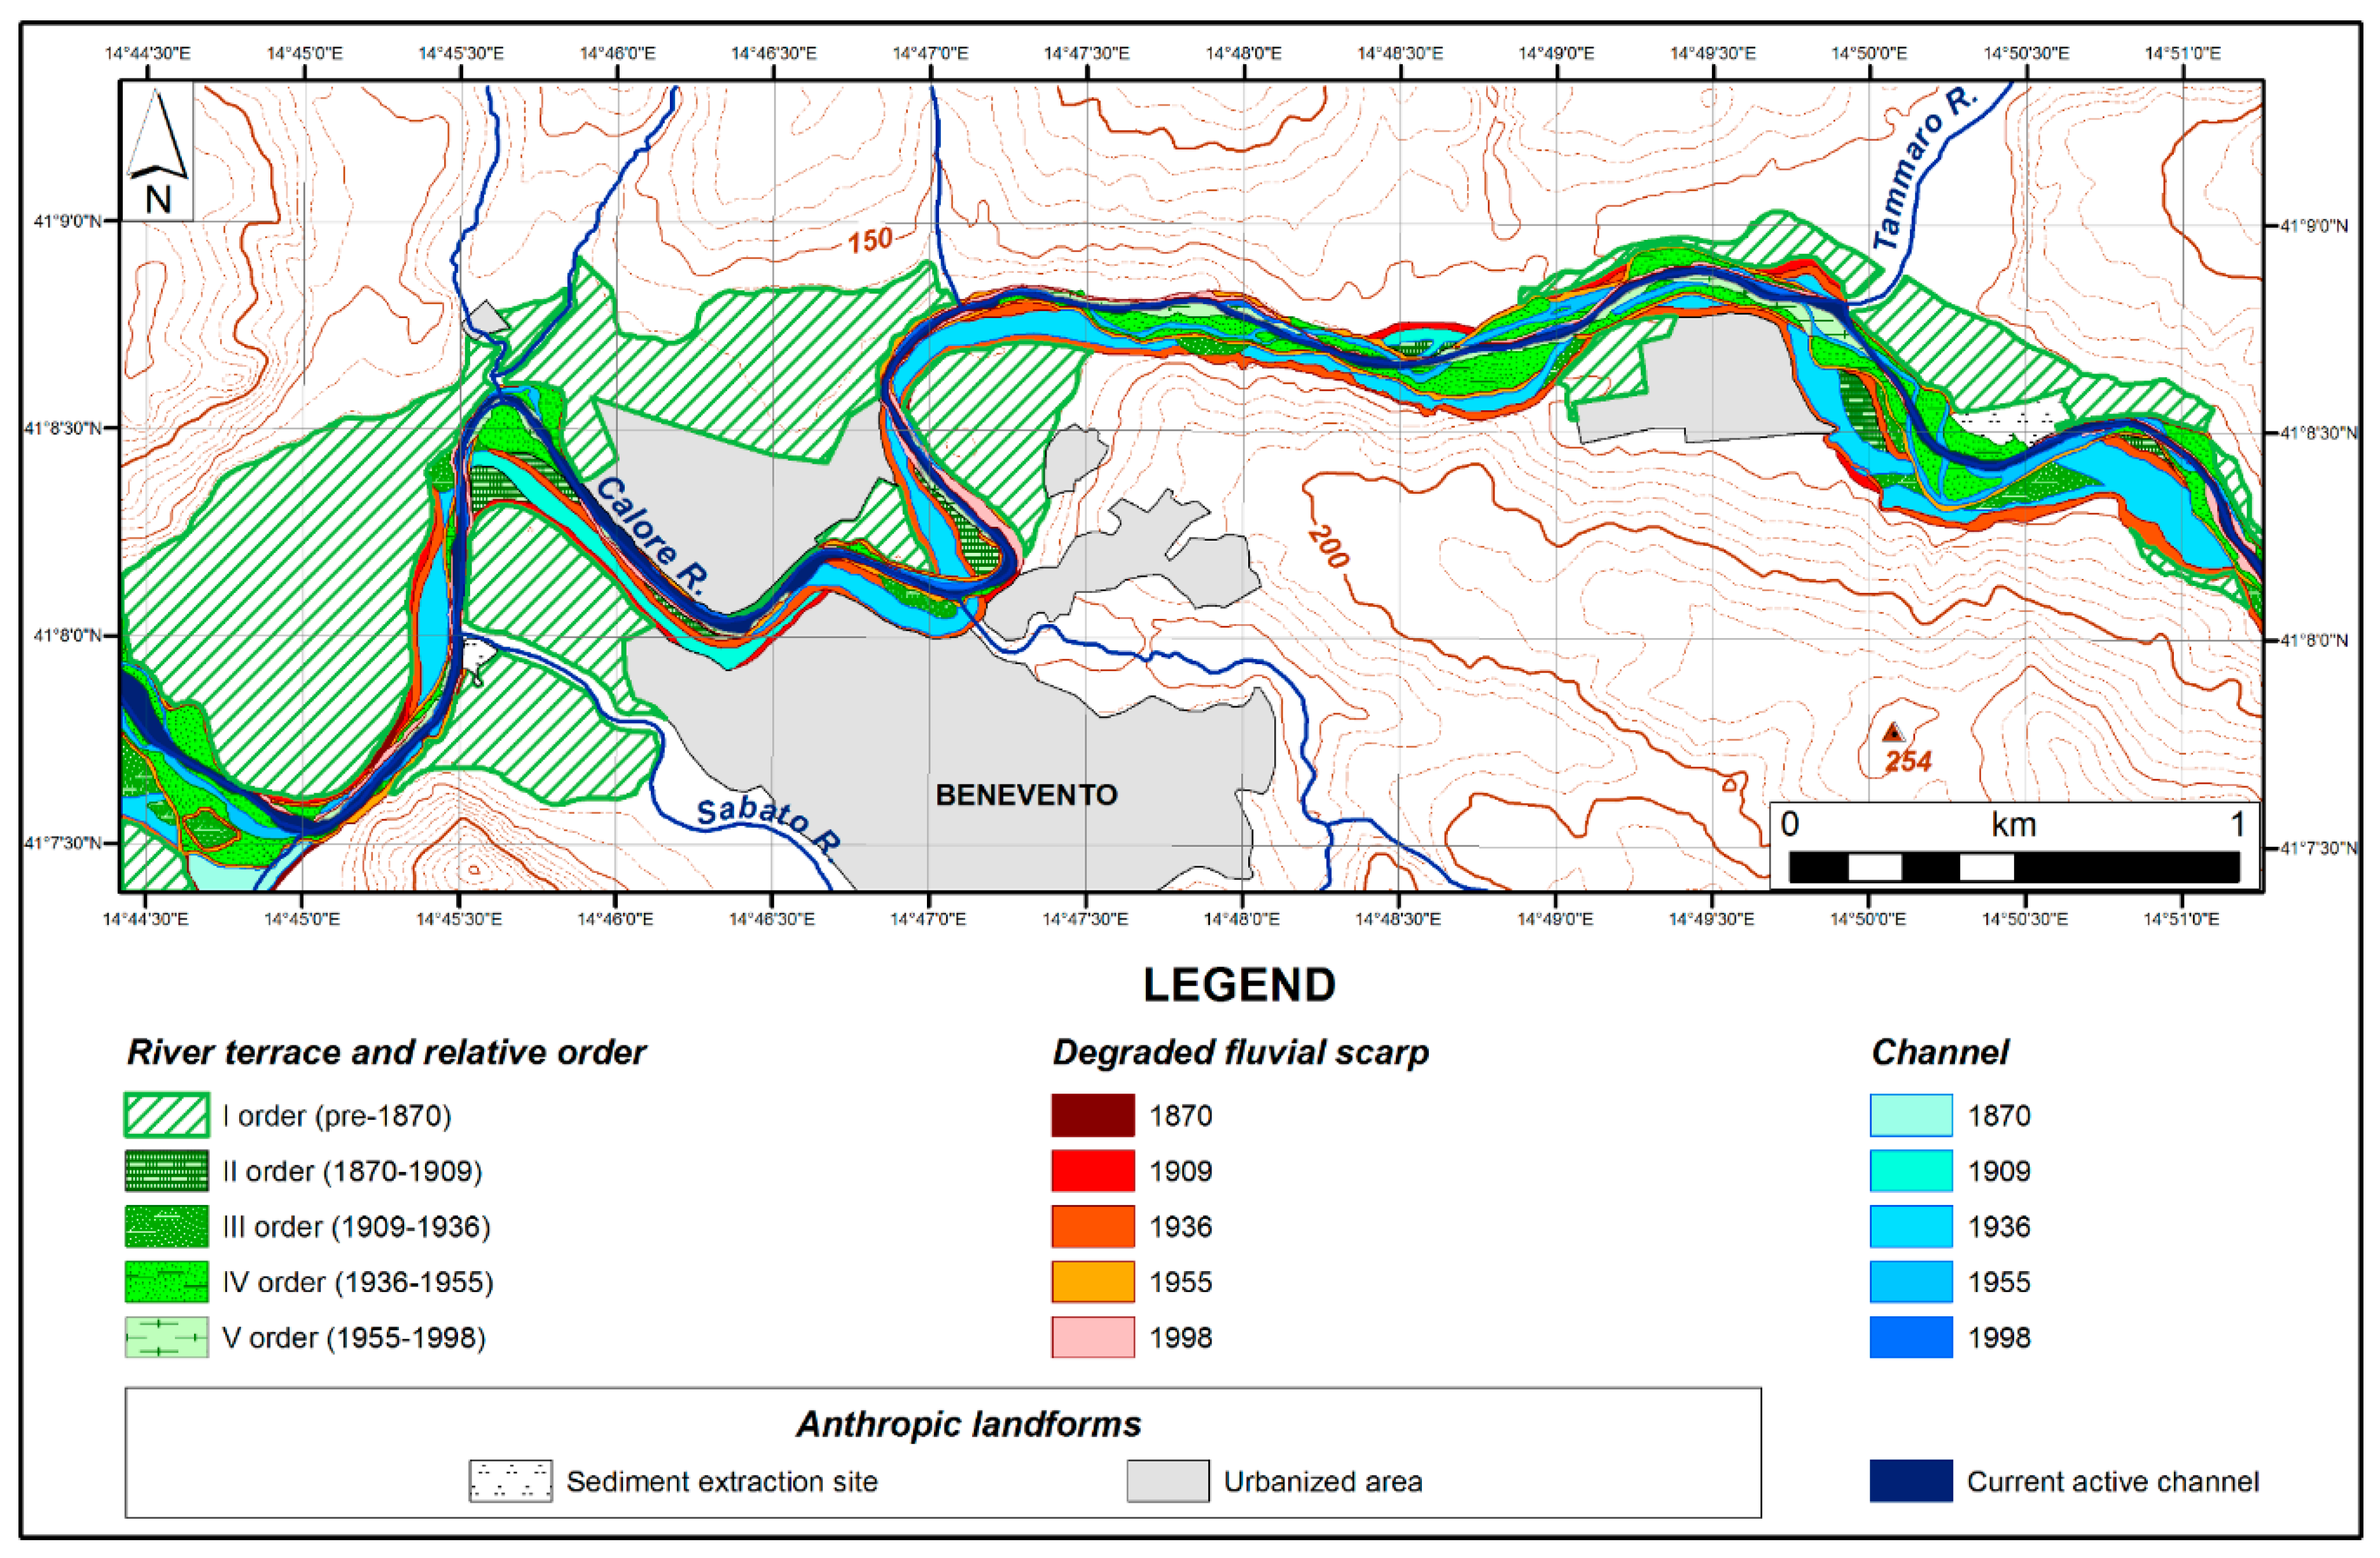
Most of the landforms shaped by the Calore River adjustments described above are nowadays present in the floodplain in the form of abandoned channels, inactive fluvial scarps and river terraces (Figure 5). GIS-analysis allowed easy mapping of each landform and quantifying of the area. The total extension of the sector of the Calore River floodplain investigated in this study was 12.4 km2.
Abandoned channels, whose extension accounted for 9.5% of the studied area, appeared in the field as long linear smooth concavities, which concur interrupting the spatial continuity of the almost completely flat land surface of the floodplain. The remnants of the abandoned channel of 1936 were the most widespread, as they represented ~60% of the whole area occupied by the abandoned channels and 5.7% of the total extension of the investigated floodplain, and were surveyed and mapped mainly in the central and eastern sectors of the study area (Figure 5). On the other hand, the remnants of the abandoned channels of 1870 and 1998 were the rarest, as they represented only 4.5% and 5.3% of the area of the abandoned channels, and 0.4% and 0.5% of the total extension of the investigated floodplain, respectively.
The investigated sector of the Calore River floodplain was also characterized by five orders of river terraces (Figure 5), whose extension accounted for 43.6% of the study area (Table 3). The oldest and topographically highest river terrace (I order) was the largest and most continuous, as it accounted for 34% of the total extension of the investigated floodplain and 77% of the total area occupied by river terraces. The mean altitude was 125.8 m a.s.l. (Table 3).
The field survey did not reveal remnants of inactive fluvial scarps interrupting the spatial continuity of I order terrace. However, it cannot be excluded that these scarps could have been totally flattened by natural and anthropogenic processes which acted on these landforms for a more prolonged time span than on the younger terraces (II to V order), also favored by the high erodibility of the loose alluvial deposits in which I order terrace is shaped. Thus, it cannot be excluded that the currently observable I order could have been originally composed by several different orders of river terraces, separated by several decimeters-high inactive fluvial scarps, similar to those currently separating the top surfaces of the younger terraces (II to V order; Figure 5).
Among the other detected river terraces, the IV order remnants, formed between 1936 and 1955, were the most widespread, as their surface accounted for 13.5% of the area occupied by river terraces and 5.9% of the total extension of the studied area, respectively (Table 3). A total of 42 remnants of this order were detected and mapped throughout the investigated sector of the floodplain, except for the central sector, where they were absent or small-sized (Figure 5). The more recent terraces, i.e., V order, formed between 1955 and 1998 were the rarest, accounting for only 2.6% of the total area of the river terraces and 1.1% of the study area extension. No river terraces formed between 1998 and 2011 were detected and mapped.
The five orders of river terraces surveyed and mapped in the study area were separated by inactive fluvial scarps, except for the youngest order (V order). This latter was separated downslope from the current channel by an active and sub-vertical fluvial erosional scarp, 2 to 4 m high, shaped into loose or very poorly cemented sandy-gravelly alluvial deposits, covered by arboreal and/or herbaceous riparian vegetation and locally affected by small-sized, undermining-induced riverbank collapses of fall or, subordinately, topple type. The oldest and inactive fluvial scarps, on the contrary, were strongly reshaped by natural erosional processes or by agricultural practices. They were deeply weathered, very gently sloping (<5°) and constantly less than 2.5 m high. The fluvial scarps that were active in 1936 and in 1955 were the most widespread ones, as they accounted for 39% and 30%, respectively, of the total length of the detected and mapped inactive fluvial scarps. They were relatively well preserved and more continuous mainly in the central and eastern sectors of the investigated area (Figure 5). On the contrary, remnants of the fluvial scarps that were active in 1870 were very rare in the studied area, as they accounted for 2% only of the total length of the inactive fluvial scarps.
The geomorphology of the investigated sector of the Calore River floodplain was completed by anthropogenic landforms, which accounted for 33% of the total extension of the study area and consisted of urbanized land surfaces and two sediment extraction sites. These latter were located a few tens of meters upstream from the confluence of the Tammaro River into the Calore River and at the confluence of the Sabato River into the Calore River, respectively (Figure 5). The first sediment extraction site is still active, while the second is not. Their area, in 2011, was 76,641 m2 and 16,630 m2, respectively.
4. Discussion
The use of GIS-software in compiling the object-oriented geomorphological map of the study area provided several unquestionable advantages. First, all the detected landforms were mapped easily through manual digitation and each “object” representing a landform was georeferenced. Second, a large number of attributes of each surveyed and mapped landform, such as extension, type, age of formation and others, was automatically calculated by the GIS software or determined in the field and/or during the on-screen analysis of aerial photographs and topographic maps. Such attributes were stored in a proper geodatabase. The use of GIS will allow an easy updating of both the geodatabase and the associated GIS-layer of the geomorphological map, this latter showing the spatial distribution of the different types of landforms: this is, obviously, of great importance in the monitoring of a very dynamic and hazardous environment such as the fluvial one [28]. Finally, the proposed approach allows a hierarchical, multiscale analysis, which can vary based upon the aims and scopes of the study [9,15,16,17]. Unquestionably, it increased the understanding of complex geomorphological changes, useful for the Calore River planning and management, and provided helpful data for a more precise mapping of the flooded zones for different return periods.
One key-point in compiling a GIS-based geomorphological map is unquestionably the legend. Several papers ([3,10,15], and references therein) underlined that, currently, a universally accepted legend for GIS-based, object-oriented geomorphological maps still does not exist and many different criteria can be used to compile the legend. In this paper, the criterion of the maximum readability, coupled with the possibility to provide in a simple and direct way morphogenetic and chronological information about each mapped landform, was chosen. More precisely, the morphogenetic and chronological features of the detected landforms were provided by choosing different colors for different types of landforms (blue for channels, green for river terraces, “warm” colors for scarps and neutral colors for anthropogenic landforms, as suggested by several authors [25,26,49]), and different shades of the same color for different ages of the same landform type. Symbols were used only when they increased the readability of the map, such as for the different orders of river terraces (Figure 5). In this case, because ArcGIS software is one of the most frequently used to compile geomorphological maps, symbols were chosen among those provided by the software. By varying simultaneously (a) the color and the shade of the background and (b) the color, the shade and the type of the foreground symbol, a very large amount of possible combinations were obtained. Among these, the combinations providing the best readability to the map were chosen. For river terraces, darker tones of the background color (i.e., dark green) and lighter tones of the foreground symbols (i.e., light green) were used for older landforms; on the contrary, a light green background and dark green symbols were used for the younger terraces. An exception was given by I order terraces. In fact, because the exact period of formation of I order terrace was unknown, a symbol very different from those used for terraces of a certain age was chosen. For scarps, it was noted that the use of different shades of the same color (e.g., red) was confusing and misleading. On the contrary, the use of “warm” colors ranging from brownish red to pink (which can be considered as different shades of red) provided much less ambiguous visual information about the period of formation of each scarp, thus, this solution was chosen. Finally, for channels, it was necessary highlighting as clearly as possible the course of the currently active channel. To this aim, the darker shade of blue was used for the currently active channel, while lighter shades of the same color were selected for the progressively older abandoned channels (Figure 5).
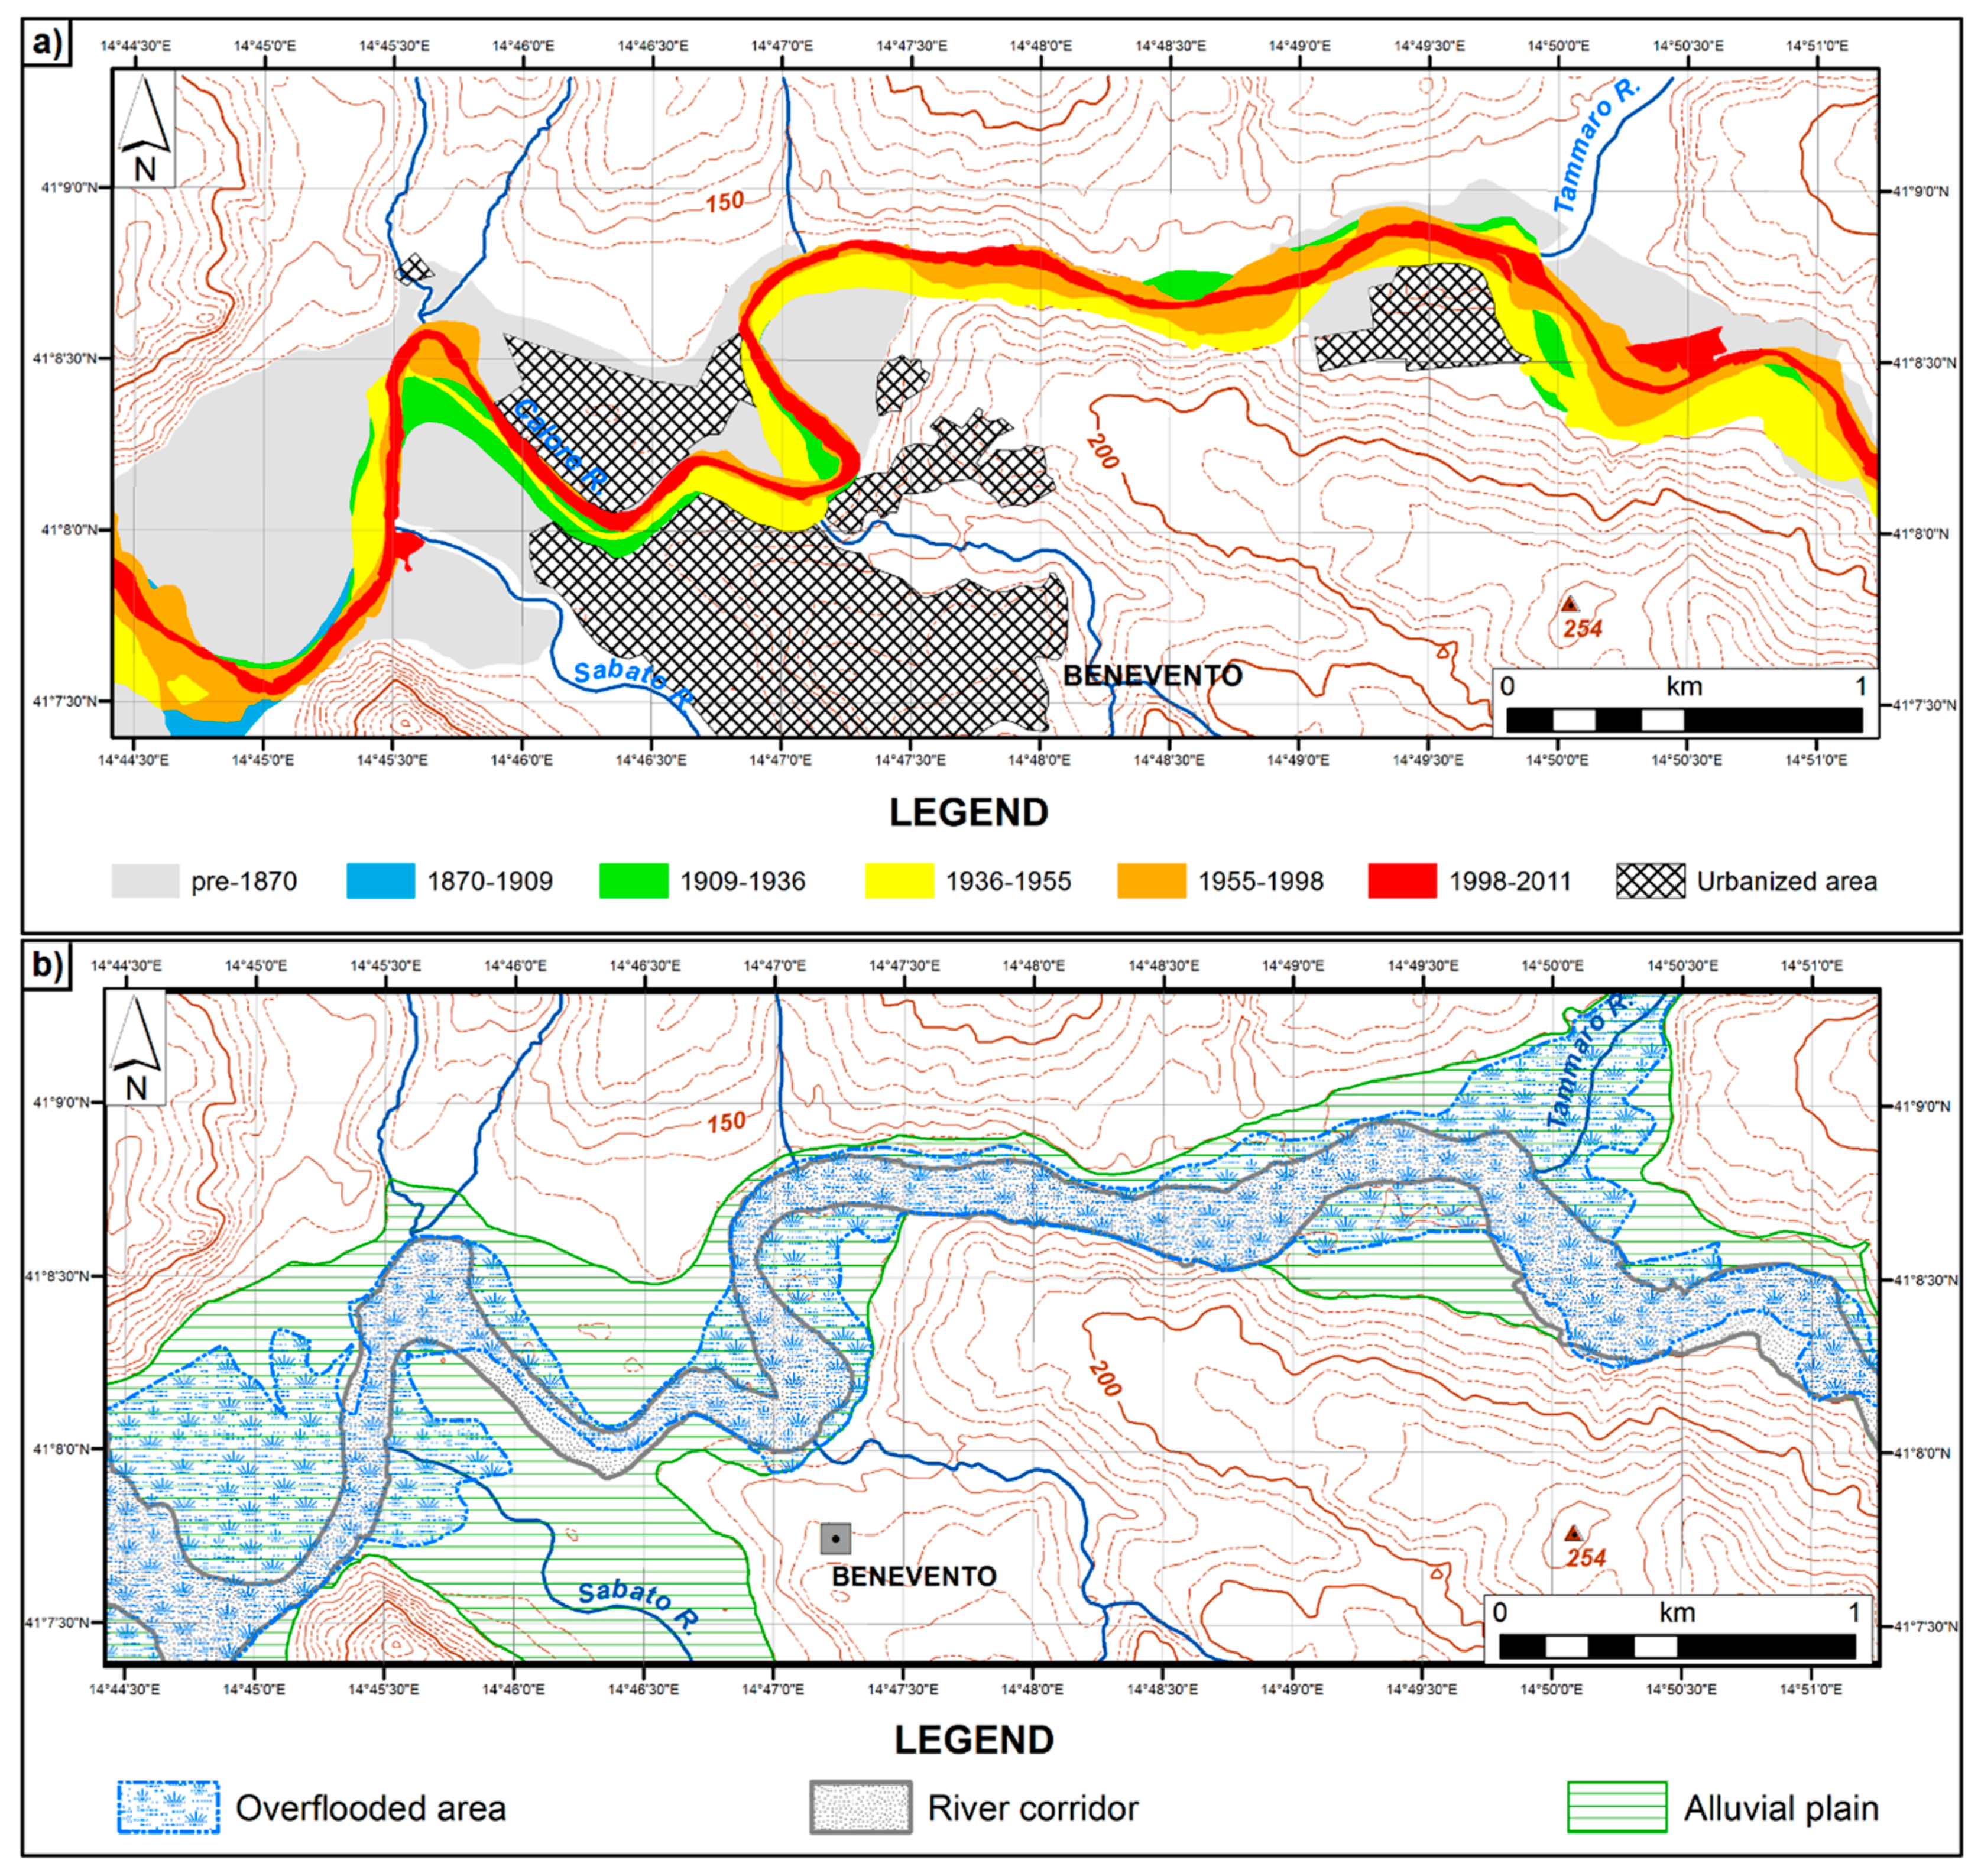
As previously stated, in this study a methodological approach based on the morphometric and multi-temporal analysis of the recent channel adjustments as a first step in compiling the final GIS-based geomorphological map was chosen. The reason for this choice was twofold. First, most of the landforms occurring in a floodplain are produced by recent channel adjustments. Thus, the analysis of the channel adjustments can greatly help in correctly detecting, interpreting, mapping and dating the landforms occurring in the floodplain. Second, the analysis of channel adjustments is a fundamental first step in the framework of a geomorphological survey aimed at flood hazard and risk mapping. This is proved, among others, by the fact that channel adjustments are one of the main indicators used to calculate indexes (e.g., Morphological Dynamics Index; [53]) in several methods that were recently developed in the context of the EU Water Framework Directive (WFD; [54]) and Floods Directive (FD; [55]), which have provided a legislative background with an emphasis on the need for integrated approaches for effective river management. Furthermore, the methodological approach used in this study also allowed producing cartographic tools, which could be useful in floodplain characterization, river management, and flood hazard and/or risk assessment [8]. The two derived maps reported in Figure 6 give examples.
In Figure 6a, the GIS-analysis allowed subdividing the investigated floodplain into sectors with different periods of formation. This result was achieved by means of queries based on attributes that were stored in the geodatabase associated with the GIS-layer of the geomorphological map of Figure 5. The latter, in turn, partly derived from the intersection of the GIS-layers of the active channels of the Calore River in the last 140 years, shown in Figure 3. In particular, to produce the map shown in Figure 6a, the attribute “period of formation” of each landform (river terrace, degraded fluvial scarp, channel) was considered. In turn, the period of formation was determined according to the year of the aerophotogrammetric survey on which the used topographic maps and orthophotos were based (Table 1). The youngest sectors of the floodplain (marked with “warm” colors on Figure 6a) are those characterized by a more intense fluvial dynamics, thus they are, at least in a first approximation, the sectors in which fluvial hazard is the highest. The most recent sectors are, obviously, those bordering the currently active channel. In Figure 6b, the GIS-analysis of the recent channel adjustments allowed delineating the “fluvial corridor” or “river morphodynamic corridor” [56,57,58,59] and compare it with the location and extension of the areas overflooded by the 15 October 2015 event. Such a comparison confirmed the high magnitude of the event, as the overflooded areas did not coincide only with the fluvial corridor, but also with the oldest sectors of the floodplain (shown in Figure 6a). More precisely, the GIS-analysis allowed calculating that 91% of the fluvial corridor was submerged by the 15 October 2015 flood. The few unsubmerged portions were located to the north-west of Benevento and mostly coincided with the Calore River channel abandoned after 1936 (Figure 5) and currently protected by 10 m high walls. This evidence confirmed the protective effectiveness of these latter structures, at least during the considered event. Furthermore, GIS-analysis also allowed the calculation of ~60% of the total surface of the investigated floodplain was overflooded on 15 October 2015, further confirming the high energy of the flood.
5. Conclusions
The study allowed producing a GIS-based, object-oriented geomorphological map of the Calore River floodplain hit by the destructive flood of 15 October 2015 in the surroundings of Benevento. GIS confirmed to be a fundamental tool in producing such maps, which can be easily updated, together with the associated geodatabases, allowing an effective analysis and monitoring of a very dynamic environment such as the fluvial one. The approach, used in this study, of starting from the analysis of the recent channel adjustments that shaped most of the landforms occurring in the floodplain greatly helped in detecting, mapping and dating the surveyed landforms. Furthermore, such an approach allowed producing data which can be used assessing fluvial hazard and risks according to several methods recently developed in the framework of the EU Water and Flood Directives. Thus, geomorphological mapping confirmed to be a key starting point for the analysis, monitoring, and management of rivers and alluvial plains, aimed at avoiding or reducing the destructive effects of floods such as the one that occurred on 15 October 2015.
Author Contributions
Conceptualization, P.M. and A.V.; Data curation, P.M. and A.V.; Funding acquisition, P.M.; Investigation, P.M. and A.V.; Methodology, P.M. and A.V.; Project administration, P.M. and A.V.; Software, P.M.; Supervision, P.M. and A.V.; Validation, P.M.; Visualization, P.M.; Writing—original draft, P.M.; Writing—review & editing, P.M. All authors have read and agreed to the published version of the manuscript.
Funding
No funding was received.
Acknowledgments
Authors are grateful to the three anonymous reviewers, whose helpful comments and suggestions greatly improved the clarity and scientific rigor of the manuscript.
Conflicts of Interest
The authors declare no conflict of interest.
References
- Vitek, J.D.; Giardino, J.R.; Fitzgerald, J.W. Mapping geomorphology: A journey from paper maps through computer mapping to GIS and virtual reality. Geomorphology 2008, 16, 233–249. [Google Scholar] [CrossRef]
- Bishop, M.P.; Allan James, L.; Shroder, J.F., Jr.; Walsh, S.J. Geospatial technologies and digital geomorphological mapping: Concepts, issues and research. Geomorphology 2012, 137, 5–26. [Google Scholar] [CrossRef]
- Seijmonsbergen, A.C. The modern geomorphological map. In Methods in Geomorphology; Shroder, J., Switzer, A.D., Kennedy, D.M., Eds.; Academic Press: San Diego, CA, USA, 2013; pp. 35–52. [Google Scholar]
- Kamal, A.S.M.M.; Midorikawa, S. GIS-based geomorphological mapping using remote sensing data and supplementary geoinformation: A case study of the Dhaka city area, Bangladesh. Int. J. Appl. Earth Obs. 2004, 6, 111–125. [Google Scholar] [CrossRef]
- Arvor, D.; Durieux, L.; Andrés, S.; Laporte, M.A. Advances in Geographic Object-Based Image Analysis with Ontologies: A review of main contributions and limitations from a Remote Sensing perspective. ISPRS J. Photogramm. 2013, 82, 125–137. [Google Scholar] [CrossRef]
- Chen, G.; Weng, Q.; Hay, G.; He, Y. Geographic bject-based Image Analysis (GEOBIA): Emerging trends and future opportunities. Gisci. Remote Sens. 2018, 55, 159–182. [Google Scholar] [CrossRef]
- Bocco, G.; Mendoza, M.; Velázquez, A. Remote sensing and GIS-based regional geomorphological mapping—A tool for land use planning in developing countries. Geomorphology 2001, 39, 211–219. [Google Scholar] [CrossRef]
- Gurnell, A.M.; Rinaldi, M.; Belletti, B.; Bizzi, S.; Blamauer, B.; Braca, G.; Buijse, A.D.; Bussettini, M.; Camenen, B.; Comiti, F.; et al. A multi-scale hierarchical framework for developing understanding of river behaviour to support river management. Aquat. Sci. 2016, 78, 1–16. [Google Scholar]
- Dramis, F.; Guida, D.; Cestari, A. Nature and aims of geomorphological mapping. In Geomorphological Mapping. Methods and Applications; Smith, M., Paron, P., Griffiths, J.S., Eds.; Elsevier: Amsterdam, The Netherlands, 2011; pp. 39–73. [Google Scholar]
- Otto, J.-C.; Geilhausen, M.; Gustavsson, M. Cartography: Design, symbolization and visualization of geomorphological maps. In Geomorphological Mapping: A Professional Handbook of Techniques and Applications; Smith, M.J., Paron, P., Griffiths, J., Eds.; Elsevier: London, UK, 2011; pp. 253–295. [Google Scholar]
- Smith, M.J.; Paron, P.; Griffiths, J.S. Geomorphological mapping, methods and applications. In Developments in Earth Surface Processes; Shroder, J.F., Jr., Ed.; Elsevier: Oxford, UK, 2011; Volume 15. [Google Scholar]
- Arundel, S.; Sinha, G. Validating the use of object-based image analysis to map commonly recognized landform features in the United States. Cartogr. Geogr. Inf. Sci. 2018, 46, 1–15. [Google Scholar] [CrossRef]
- Burrough, P.A.; Mc Donnell, R.A. Principles of Geographical Information Systems; Oxford University Press: Oxford, UK, 1998; p. 333. [Google Scholar]
- Zinck, J.A. Physiography and Soils. In ITC Lecture Note SOL.4.1; International Institute for Geoinformation Science and Earth Observation (ITC): Enschede, The Netherlands, 1988; p. 156. [Google Scholar]
- Guida, D.; De Pippo, T.; Cestari, A.; Siervo, V.; Valente, A. Applications of the hierarchic GIS-based geomorphological mapping system. In Proceedings of the 3rd AIGEO National Conference, Modena, Italy, 13–18 September 2009. [Google Scholar]
- Cestari, A.; Cuomo, A.; Dramis, F.; Guida, D.; Palmieri, V.; Paron, P.; Siervo, V. Hierarchical, multiscale, objective, oro-hydrography mapping: From continental (Europe) to national level (Italy). In Proceedings of the IAG/AIG International Workshop, Salerno, Italy, 15–19 October 2012. [Google Scholar]
- Guida, D.; Cestari, A.; Cuomo, A.; Dramis, F.; Palmieri, V.; Paron, P.; Siervo, V. The geomorphological informative mapping system of Salerno university: An overview. In Proceedings of the IAG/AIG International Workshop, Salerno, Italy, 15–19 October 2012. [Google Scholar]
- Pipaud, I.; Lehmkuhl, F. Object-based Delineation and classification of alluvial fans by application of mean-shift segmentation and support vector machines. Geomorphology 2017, 293, 178–200. [Google Scholar] [CrossRef]
- Drăgut, L.; Blaschke, T. Automated classification of landform elements using object-based image analysis. Geomorphology 2006, 81, 330–344. [Google Scholar] [CrossRef]
- Asselen, S.V.; Seijmonsbergen, A.C. Expert-driven semi-automated geomorphological mapping for a mountainous area using a laser DTM. Geomorphology 2006, 78, 309–320. [Google Scholar] [CrossRef]
- Camargo, F.F.; Florenzano, T.G.; De Almeida, C.M.; De Oliveira, C.G. Geomorphological mapping using object-based analysis and ASTER DEM in the Parralba do Sul Valley, Brazil. Int. J. Remote Sens. 2009, 30, 6613–6620. [Google Scholar] [CrossRef]
- Gustavsson, M.; Kolstrup, E.; Seijmonsbergen, A.C. A new symbol-and-GIS based detailed geomorphological mapping system: Renewal of a scientific discipline for understanding landscape development. Geomorphology 2006, 77, 90–111. [Google Scholar] [CrossRef] [Green Version]
- Gustavsson, M.; Kolstrup, E. New geomorphological mapping system used at different scales in a Swedish glaciated area. Geomorphology 2009, 110, 37–44. [Google Scholar] [CrossRef]
- Valente, A.; Magliulo, P. A GIS based geomorphological map of the Calore River alluvial plain in Benevento area (Campania, Italy). Rend. Online Soc. Geol. Ital. 2012, 21, 1161–1163. [Google Scholar]
- Magliulo, P.; Cusano, A. Geomorphology of the Lower Calore River alluvial plain (Southern Italy). J. Maps 2016, 12, 1119–1127. [Google Scholar] [CrossRef]
- de Graaff, L.W.S.; De Jong, M.G.G.; Rupke, J.; Verhofstad, J. A geomorphological mapping system at scale 1:10.000 for mountainous areas (Austria). Z. Geomorphol. 1987, 31, 229–242. [Google Scholar]
- Marston, R.A.; Girel, J.; Pautou, G.; Piegay, H.; Bravard, J.P.; Arneson, C. Channel metamorphosis, floodplain disturbance, and vegetation development: Ain River, France. Geomorphology 1995, 13, 121–131. [Google Scholar] [CrossRef]
- Wheaton, J.M.; Fryirs, K.A.; Brierley, G.; Baangen, S.G.; Bouwes, N.; Ó’Brien, G. Geomorphic mapping and taxonomy of fluvial landforms. Geomorphology 2015, 248, 273–295. [Google Scholar] [CrossRef]
- Napieralski, J.; Barr, I.; Kamp, U.; Kervyn, M. Remote sensing and GIS science in geomorphological mapping. In Treatise on Geomorphology; Shroder, J., Bishop, M.P., Eds.; Academic Press: San Diego, CA, USA, 2013; Volume 3, pp. 187–227. [Google Scholar]
- Dal Cin, C.; Moens, L.; Dierickx, P.; Bastin, G.; Zech, Y. An integrated approach for real time flood map forecasting on the Belgian Meuse River. Nat. Hazards 2005, 36, 237–256. [Google Scholar]
- Cook, A.; Merwade, V. Effect of topographic data, geometric configuration and modelling approach on flood inundation mapping. J. Hydrol. 2009, 377, 131–142. [Google Scholar] [CrossRef]
- Van Westen, C.J.; Soeters, R.; Sijmons, K. Digital geomorphological landslide hazard mapping of the Alpago area, Italy. Int. J. Appl. Earth Obs. 2000, 2, 51–60. [Google Scholar] [CrossRef]
- Wohl, E.; Oguchi, T. Geographic information systems and mountain hazards. In Geographic Information Science and Mountain Geomorphology; Bishop, M.P., Shroder, J.F., Eds.; Springer-Praxis: Chichester, UK, 2004; pp. 309–342. [Google Scholar]
- Seijmonsbergen, A.C.; de Graaff, L.W.S. Geomorphological mapping and geophysical profiling for the evaluation of natural hazards in an alpine catchment. Nat. Hazard Earth Sys. 2006, 6, 185–193. [Google Scholar] [CrossRef] [Green Version]
- Meyer, V.; Scheuer, S.; Haase, D. A multicriteria approach for flood risk mapping exemplified at the Mulde River, Germany. Nat. Hazards 2009, 48, 17–39. [Google Scholar] [CrossRef]
- Segura-Beltràn, F.; Sanchis-Ibor, C.; Morales-Hernàndez, M.; Gonzàlez-Sanchis, M.; Bussi, G.; Ortiz, E. Using post-flood surveys and geomorphologic mapping to evaluate hydrological and hydraulic models: The flash-flood of the Girona River (Spain) in 2007. J. Hydrol. 2016, 541, 310–329. [Google Scholar] [CrossRef] [Green Version]
- Borga, M.; Anagnostou, E.N.; Blöschl, G.; Creutin, J.D. Flash-flood forecasting, warning and risk management: The HYDRATE project. Environ. Sci. Policy 2011, 14, 834–844. [Google Scholar] [CrossRef]
- Alcantara-Ayala, I. Geomorphology, natural hazards, vulnerability and prevention of natural disasters in developing countries. Geomorphology 2002, 47, 107–124. [Google Scholar] [CrossRef]
- Langat, P.K.; Kumar, L.; Koech, R. Monitoring river channel dynamics using remote sensing and GIS techniques. Geomorphology 2019, 325, 92–102. [Google Scholar] [CrossRef]
- Ben Khalfallah, C.; Saidi, S. Spatiotemporal floodplain mapping and prediction using HEC-RAS-GIS tools: Case of the Mejerda river, Tunisia. J. Afr. Earth. Sci. 2018, 142, 44–51. [Google Scholar] [CrossRef]
- Guerriero, L.; Focareta, M.; Fusco, G.; Rabuano, R.; Guadagno, F.M.; Revellino, P. Flood hazard of major river segments, Benevento Province, Southern Italy. J. Maps. 2018, 14, 597–606. [Google Scholar] [CrossRef] [Green Version]
- Magliulo, P.; Valente, A.; Cartojan, E. Recent geomorphological changes of the middle and lower Calore River (Campania, Southern Italy). Environ. Earth Sci. 2013, 70, 2785–2805. [Google Scholar] [CrossRef]
- Patacca, E.; Scandone, P. Geology of the Southern Apennines. Boll. Soc. Geol. Ital. 2007, 7, 75–119. [Google Scholar]
- Magliulo, P.; Russo, F.; Valente, A. Tectonic significance of geomorphological features in the Telesina Valley (Campanian Apennines). Ital. J. Geosci. 2007, 126, 397–409. [Google Scholar]
- APAT. APAT Note Illustrative alla Carta Geologica d’Italia alla scala 1:50.000, foglio 432 “Benevento”; Chiocchini, U., Ed.; Agenzia per la Protezione dell’Ambiente e Servizi Tecnici, Dipartimento Difesa Suolo: Firenze, Italy, 2007; p. 126. [Google Scholar]
- D’Argenio, B.; Pescatore, T.S.; Senatore, M.R.; Bisogno, G.; Tocco, G. Effects of natural events on ancient Benevento, Southern Italy. Rend. Acc. Sci. Fis. Nat. Napoli 2002, 69, 13–26. [Google Scholar]
- Ciarcia, S.; Magliulo, P.; Russo, F.; Valente, A. Osservazioni geologiche e geomorfologiche preliminari sul bacino pleistocenico intermontano di Benevento (Appennino Campano). In Evoluzione Geomorfologica di Lungo Termine del Paesaggio nell’Italia Meridionale: Il Contributo delle Università Locali; Rosskopf, C.M., Aucelli, P.P.C., Eds.; Università degli Studi del Molise, Associazione Italiana di Geografia Fisica e Geomorfologia (AIGeo): Ripalimosani, Italy, 2014; pp. 125–141. [Google Scholar]
- CNR-DGCI. Valutazione delle piene in Campania. In Previsione e Prevenzione degli Eventi Idrologici Estremi e Loro Controllo, Linea 1; Rossi, F., Villani, P., Eds.; Consiglio Nazionale delle Ricerche, Gruppo Nazionale per la Difesa dalle Catastrofi Idrogeologiche, Presidenza del Consiglio dei Ministri, Dipartimento della Protezione Civile, Grafica Metelliana & C.: Cava de’ Tirreni, Italy, 1995; p. 310. [Google Scholar]
- Fonseca, A.F.; Zêzere, J.L.; Neves, M. Combining geomorphological mapping and geomorphometry in the study of the Plio-quaternary tectonic geomorphology of the Arrábida Chain (Portugal). In Proceedings of the IAG/AIG International Workshop, Salerno, Italy, 15–19 October 2012. [Google Scholar]
- Surian, N.; Rinaldi, M.; Pellegrini, L. Linee Guida per l’Analisi Geomorfologica degli Alvei Fluviali e delle Loro Tendenze Evolutive; Cleup: Padova, Italy, 2009; p. 79. [Google Scholar]
- Piacentini, T.; Urbano, T.; Sciarra, M.; Schipani, I.; Miccadei, E. Geomorphology of the floodplain at the confluence of the Aventino and Sangro rivers (Abruzzo, Central Italy). J. Maps 2016, 12, 443–461. [Google Scholar] [CrossRef] [Green Version]
- Valente, A.; Iscaro, C.; Magliulo, P.; Russo, F. The flood event in Benevento on 14–15 October 2015: A short report. Rend. Online Soc. Geol. Ital. 2016, 38, 105–108. [Google Scholar]
- Rinaldi, M.; Surian, N.; Comiti, F.; Bussettini, M. A methodological framework for hydromorphological assessment, analysis and monitoring (IDRAIM) aimed at promoting integrated river management. Geomorphology 2015, 251, 122–136. [Google Scholar] [CrossRef]
- European Commission. Directive 2000/60/EC of the European Parliament and of the Council of 23 October 2000 Establishing a Framework for Community Action in the Field of Water Policy. Available online: https://eur-lex.europa.eu/eli/dir/2000/60/oj (accessed on 31 December 2019).
- European Commission. Directive 2007/60/EC of the European Parliament and of the Council of 23 October 2007 on the Assessment and Management of Flood Risks. Available online: https://eur-lex.europa.eu/legal-content/EN/TXT/?uri=celex:32007L0060 (accessed on 31 December 2019).
- Malavoi, J.R.; Bravard, J.P.; Piegay, H.; Herouin, E.; Ramez, P. Determination de l’espace de liberte’ des cours d’eau. In Guide Technique No. 2; Agence de l’Eau Rhône Méditerranée Corse: Lyon, France, 1998; p. 39. [Google Scholar]
- Rapp, C.F.; Abbe, T.B. A framework for delineating channel migration zones. In Ecology Publication #03-06-027; Washington State Department of Ecology and Transportation: Olympia, WA, USA, 2003; p. 135. [Google Scholar]
- Lagasse, P.F.; Zevenbergen, L.V.; Spitz, W.J.; Thorne, C.R. Methodology for Predicting Channel Migration. National Cooperative Highway Research Program, 2004, Web-Only Document, Project 24-16, 67. Available online: http://onlinepubs.trb.org/onlinepubs/nchrp/nchrp_w67.pdf (accessed on 25 November 2019).
- Scorpio, V.; Surian, N.; Cucato, M.; Dai Prá, E.; Zolezzi, G.; Comiti, F. Channel changes of the Adige River (Eastern Italian Alps) over the last 1000 years and identification of the historical fluvial corridor. J. Maps 2018, 14, 680–691. [Google Scholar] [CrossRef]
Figure 1.
Location of the study area. The rain-gauge stations and stream-gages mentioned in the text are reported. B. Meteo—Benevento Meteo rain-gauge station; P. Valentino—Ponte Valentino stream-gage and rain-gauge station.
Figure 1.
Location of the study area. The rain-gauge stations and stream-gages mentioned in the text are reported. B. Meteo—Benevento Meteo rain-gauge station; P. Valentino—Ponte Valentino stream-gage and rain-gauge station.

Figure 2.
Rainfall data (a) and water level variations of the main rivers of the studied area (b) during the event of 15 October 2015. The water level in Figure 2b is expressed in centimeters above the riverbed height in the considered sections.
Figure 2.
Rainfall data (a) and water level variations of the main rivers of the studied area (b) during the event of 15 October 2015. The water level in Figure 2b is expressed in centimeters above the riverbed height in the considered sections.

Figure 3.
Channel planform changes of the investigated segment of the Calore River between 1870 and 2011.
Figure 3.
Channel planform changes of the investigated segment of the Calore River between 1870 and 2011.

Figure 4.
Channel length, sinuosity and “Bars index” variations of the investigated Calore River segment between 1870 and 2011. Bars Index—(Bars Area/Channel Area) × 100. (a) Absolute values of the considered parameters in different years. (b) Variations, in percent, of the selected parameters in the different time spans considered in this study.

Figure 5.
GIS-based, object-oriented geomorphological map of the study area.

Figure 6.
Derived maps, produced by means of queries based on the attributes stored in the geodatabase associated to the GIS-layer of the geomorphological map shown in Figure 5. (a) Map showing the different period of formation of the different sectors of the investigated portion of the Calore River floodplain; (b) map showing the spatial relationships between the “river corridor”, the investigated floodplain, and the areas overflooded during the 15 October 2015 event.


Table 1.
Main characteristics of the used materials.
| Year | Type | Producer | Scale | Scanning Resolution (dpi) | Pixel Size (m) | Positional Error (m) |
|---|---|---|---|---|---|---|
| 1870 | HM | IGMI | 1:50,000 | 300 | 5.4 | 35 |
| 1909 | HM | IGMI | 1:50,000 | 600 | 4.0 | 29 |
| 1936 | HM | IGMI | 1:50,000 | 300 | 5.0 | 31 |
| 1955 | TM | IGMI | 1:25,000 | 1200 | 2.3 | 16 |
| 1998 | O | Campania Region | 1:10,000 | - | 2.0 | 4 |
| 2011 | O | Campania Region | 1:5000 | - | 0.5 | - |
HM: historical topographic maps; TM: more recent topographic maps; O: orthophotos; IGMI: Italian Geographic Military Institute.
Table 2.
Main characteristics of the 15 October 2015 rainfall event.
| Station | Latitude Longitude | Total Rainfall (mm) | Mean Rainfall (mm/h) | Intensity Peak (mm/10 min) |
|---|---|---|---|---|
| Benevento | 41.142000 14.762417 | 140.6 | 28.1 | 13.8 |
| Benevento Meteo | 41.115056 14.825028 | 90.8 | 18.2 | 14.2 |
| Ponte Valentino | 41.141667 14.836028 | 107.6 | 21.5 | 9.6 |
| Paduli | 41.148222 14.834806 | 123.6 | 24.7 | 11.6 |
| Pago Veiano | 14.259833 14.897611 | 183.6 | 36.7 | 14.8 |
Table 3.
Main features of the river terraces detected in the study area.
| Order | Period of Formation | Mean Altitude (m a.s.l.) | No. of Remnants | Total Area (km2) | Terraced Area (%) | Study Area (%) |
|---|---|---|---|---|---|---|
| I | pre-1870 | 125.8 | 13 | 4.17 | 77.1 | 33.6 |
| II | 1870–1909 | 123.6 | 8 | 0.16 | 2.9 | 1.3 |
| III | 1909–1936 | 121.1 | 12 | 0.21 | 3.9 | 1.7 |
| IV | 1936–1955 | 119.1 | 42 | 0.73 | 13.5 | 5.9 |
| V | 1955–1998 | 117.0 | 18 | 0.14 | 2.6 | 1.1 |
Altitude is derived from Carta Tecnica Numerica Regionale (i.e., Technical Numerical Regional Map), produced by Regione Campania, P.O.R. Campania 2000/6–Misura 6.2 (http://sit.regione.campania.it).
© 2020 by the authors. Licensee MDPI, Basel, Switzerland. This article is an open access article distributed under the terms and conditions of the Creative Commons Attribution (CC BY) license (http://creativecommons.org/licenses/by/4.0/).
Share and Cite
MDPI and ACS Style
Magliulo, P.; Valente, A. GIS-Based Geomorphological Map of the Calore River Floodplain Near Benevento (Southern Italy) Overflooded by the 15th October 2015 Event. Water 2020, 12, 148. https://doi.org/10.3390/w12010148
AMA Style
Magliulo P, Valente A. GIS-Based Geomorphological Map of the Calore River Floodplain Near Benevento (Southern Italy) Overflooded by the 15th October 2015 Event. Water. 2020; 12(1):148. https://doi.org/10.3390/w12010148
Chicago/Turabian StyleMagliulo, Paolo, and Alessio Valente. 2020. "GIS-Based Geomorphological Map of the Calore River Floodplain Near Benevento (Southern Italy) Overflooded by the 15th October 2015 Event" Water 12, no. 1: 148. https://doi.org/10.3390/w12010148
Note that from the first issue of 2016, this journal uses article numbers instead of page numbers. See further details here.