Monitoring of Cyanobacteria in Water Using Spectrophotometry and First Derivative of Absorbance


1
Institute of Environmental Science and Interdisciplinary Science, Carleton University, Ottawa, ON K1S 5B6, Canada
2
Department of Civil and Environmental Engineering, Carleton University, Ottawa, ON K1S 5B6, Canada
*
Author to whom correspondence should be addressed.
Water 2020, 12(1), 124; https://doi.org/10.3390/w12010124
Submission received: 19 November 2019
/
Revised: 20 December 2019
/
Accepted: 20 December 2019
/
Published: 30 December 2019
(This article belongs to the Special Issue Monitoring, Modelling and Management of Water Quality)
Abstract
:Management of cyanobacteria blooms and their negative impact on human and ecosystem health requires effective tools for monitoring their concentration in water bodies. This research investigated the potential of derivative spectrophotometry in detection and monitoring of cyanobacteria using toxigenic and non-toxigenic strains of Microcystis aeruginosa. Microcystis aeruginosa was quantified in deionized water and surface water using traditional spectrophotometry and the first derivative of absorbance. The first derivative of absorbance was effective in improving the signal of traditional spectrophotometry; however, it was not adequate in differentiating between signal and noise at low concentrations. Savitzky-Golay coefficients for first derivative were used to smooth the derivative spectra and improve the correlation between concentration and noise at low concentrations. Derivative spectrophotometry improved the detection limit as much as eight times in deionized water and as much as four times in surface water. The lowest detection limit measured in surface water with traditional spectrophotometry was 392,982 cells/mL, and the Savitzky-Golay first derivative of absorbance was 90,231 cells/mL. The method provided herein provides a promising tool in real-time monitoring of cyanobacteria concentrations and spectrophotometry offers the ability to measure water quality parameters together with cyanobacteria concentrations.
1. Introduction
Cyanobacteria have become the recent focus of scientific research due to their impacts on environmental and human health [1,2]. Some species of cyanobacteria form blooms and produce taste and odour compounds, such as Geosmin and 2-methylisoborneol (2-MIB), which negatively affect water quality. A more pressing issue is the capability of these organisms to produce toxins (cyanotoxins) which are detrimental to living organisms [3]. Over the years, there has been an increase in literature on cyanobacteria, cyanobacterial blooms, and cyanotoxins, among which Microcystis and its associated hepatotoxin, microcystin, have been the focus. M. aeruginosa is the most common toxin-producing species in cyanobacterial blooms, and microcystins are the most widespread toxins [4,5]. Other genera capable of producing microcystins include Anabaena (Dolichospermum), Anabaenopsis, Nostoc, and Oscillatoria [6].
To ensure public health safety, World Health Organization (WHO) recommends critical control points to reduce exposure to cyanotoxin hazards [7]. The critical control points depend on monitoring schemes that are capable of detecting cyanobacteria proliferation and require sufficient management protocol to mitigate potential environment and human health impacts. Standard monitoring programs involve visual inspection of the water body, monitoring of nutrient concentration, and monitoring of mass developments of cyanobacteria and their toxins in the respective waterbody [7]. The WHO guidelines also state the probability of adverse health effects based on exposure to specific cyanobacteria concentrations in recreational waters (Table 1).
Continuous, real-time information on cyanobacteria concentration and other water quality parameters are of utmost importance to water quality managers. This information facilitates understanding of the impact of point and non-point source pollution on a water body, captures spatial and temporal variability in cyanobacteria concentration, and aids in determining subsequent treatment protocol to be implemented [7]. Real-time information also ensures blooms are managed in their early stages, and as such prevents extensive damage to the water body [3,7,8,9,10].
There are several methods for qualitative and quantitative analysis of cyanobacteria in surface waters [11,12,13]. These methods employ biological, biochemical or physicochemical approaches [11,12]. The challenges include spatial and temporal variability of cyanobacteria in the water body, sampling and analysis time, cost of analytical instrument, efficacy of the analytical technique, and interferences due to both water and cyanobacteria/algal characteristics.
Identification and quantification of cyanobacteria under a microscope is an established method that provides information regarding the species of cyanobacteria present, which can also infer on the possible presence of toxins in the waterbody [12]. However, there are several limitations to this laborious and time-consuming technique, such as the large quantities of variable types of cells, sample preparation and transport, high degree of expertise required for accurate quantification, and more importantly it is not suitable for real-time monitoring.
Fluorometry is the most commonly used method for real-time monitoring of cyanobacteria and typically relies on the detection and quantification of chlorophyll-a [14]. Cyanobacteria species contain light-absorbing pigment, chlorophyll-a, together with variable concentrations of accessory phycobiliprotein pigments phycocyanin (PC) and phycoerythrin (PE) [15]. These pigments play a major role in photosynthesis and determine the external colour of the species [16]. Chlorophyll-a contributes to 0.5–1% of the ash-free dry weight of phytoplanktonic organisms, and as such has set the standard for representation of phytoplankton biomass. Chlorophyll-a does, however, vary depending on the physiological state of the organism, species composition, and growth conditions such as nutrient and sunlight availability [7,17].
Spectrophotometry is used in laboratory studies to quantify the growth of cyanobacteria cultures in broth. Compared to fluorometry, spectrophotometry has a much higher detection limit (lower sensitivity) and therefore it is not employed for monitoring of cyanobacteria in water supplies. Recently, [18] developed a method to determine the concentration of microalgae in water and wastewater using spectrophotometry and the first derivative of absorbance. The detection limits established using the first derivative of absorbance for C. vulgaris were 0.47, 0.56, and 1.96 mg TVS (total volatile solids)/L in distilled water, surface water and wastewater, respectively. The results indicated that the first derivative of absorbance can successfully be used for monitoring of microalgae in bioreactors for industrial applications and microalgae-based wastewater treatment systems and potentially for surface water monitoring if detection limits can be improved.
Derivative spectrophotometry is capable of separating overlapping peaks and reducing background noise caused by the presence of other compounds in a sample and can improve the selectivity and sensitivity of classic spectrophotometry [19,20]. Digital (mathematical), electronic, or optical methods can be used to obtain first order or higher order derivatives from zero-order derivatives (original absorbance spectra). Digital methods, however, are more useful than electronic or optical methods because of the ease with which they calculate the derivative spectra, and the flexibility of the method for reanalysis of data (i.e., the derivative spectra can be recalculated with different parameters) [20]. If the zero-order derivative follows Beer-Lambert Law, all orders of derivative will reflect the linear relationship between concentration and absorbance. The improved selectivity and sensitivity associated with derivative spectrophotometry has increased its use in clinical, environmental, and pharmaceutical fields of analysis [20]. It does, however, seem that no research has explored the utilization of derivative spectrophotometry for the detection and quantification of cyanobacteria in water.
Even though spectrophotometry has a lower sensitivity compared to fluorometry for cyanobacteria, it offers other advantages. In-line and real-time UV-vis spectrophotometers are available in the market and are widely used by drinking water treatment plants to measure organic carbon at 254 nm. New generation real-time spectrophotometers have the capability to scan the whole UV-vis range (190–800 nm), measure the concentrations of a wide range of compounds simultaneously, apply algorithms and analyze the data, and transfer the data wirelessly. Furthermore, using chemometrics and advanced statistics, absorbance characteristics of a water sample at different wavelengths can be correlated to water quality parameters that are of interest to decision makers and regulators. These water quality parameters include UV254, dissolved organic carbon (DOC), biochemical oxygen demand (BOD), chemical oxygen demand (COD), total suspended solids, nitrate and nitrite, and color, which are all important in monitoring cyanobacteria blooms. The ability to measure the water quality parameters is important as they directly impact the growth conditions, competition and abundance of cyanobacteria. For example, it has been reported that increases in nitrate loads not only increases the growth rate and toxicity of toxigenic M. aeruginosa, but that higher nitrate concentrations favor toxigenic strains over non-toxigenic strains [21,22]. Therefore, if a spectrophotometry-based method that is sensitive enough for monitoring cyanobacteria in surface waters can be developed, only one instrument would be adequate to measure cyanobacteria and the complementary water quality parameters instead of the bundles of instruments that are currently used for monitoring applications. This would reduce the complexity and cost of real-time monitoring, which are the main roadblocks to the wide use of real-time monitoring.
The main objective of this research was to investigate the use of derivative spectrophotometry for monitoring of cyanobacteria and determine the detection limits that can be achieved using first derivative of absorbance and complementary statistical tools, and whether spectrophotometry would be a viable method for cyanobacteria monitoring.
2. Materials and Methods
2.1. Cultivation of Cyanobacteria
Pure cultures of Microcystis aeruginosa CPCC 299 (toxigenic strain) and Microcystis aeruginosa CPCC 632 (non-toxigenic strain) were used in this study. The strains and the sterile growth media BG-11 and 3N-BBM were purchased from the Canadian Phycological Culture Centre (CPCC) at the University of Waterloo (Waterloo, ON, Canada).
M. aeruginosa CPCC 299 was cultured in BG-11 while M. aeruginosa CPCC 632 was cultured in 3N-BBM. Each growth medium was inoculated with 1ml of its respective strain such that the dilution ratio was 1:100. To avoid contamination of cultures, both 250 mL Erlenmeyer flasks (250 mL) used to culture each strain of M. aeruginosa were rinsed with deionized (D.I.) water, after which the mouth of each flask was covered in foil paper and autoclaved at 15 psi and 121 °C for 30 min. The flasks were then let to cool at room temperature and labelled according to strain and growth medium before culturing as per dilution ratio aforementioned. The cultures were incubated in a temperature-controlled incubator and maintained at 25 °C under 24-h light intensity of 1800–2500 lux. M. aeruginosa CPCC 299 was cultured for 10 days and M. aeruginosa CPCC 632 was cultured for 11 days. Each flask was stirred manually twice a day at eight-hour time intervals or more.
2.2. Preparation of Cyanobacteria Samples for Spectrophotometric Analysis
M. aeruginosa cultures were enumerated under a light microscope using a Neubauer chamber (hemocytometer), after which dilutions of the sample were prepared in D.I. water and surface water. The same dilution ratios were prepared in both D.I. water and surface water to make comparisons when quantifying in each water sample. Surface water was taken from the Rideau River (Ottawa, Ontario). After dilution, concentration of samples ranged from 129 cells/mL to 10,288,000 cells/mL for M. aeruginosa CPCC 299, and from 88 cells/mL to 7,064,000 cells/mL for M. aeruginosa CPCC 632.
2.3. Absorbance Measurements
Spectrophotometric analysis was done using a Cary 100 Bio UV-Vis Spectrophotometer and a 1 cm quartz cuvette. A spectral scan was carried out between 200 nm to 800 nm, however, analysis focused on absorption of light between 400 nm to 800 nm due to the presence of significant peaks. The spectrophotometer was set to baseline subtraction to account for absorption by blanks (water samples), after which absorption spectra for respective growth media were taken and subtracted from final absorbance measurements (growth media and cyanobacteria). Standard calibration curves were plotted at low, medium, and high concentration ranges to validate whether spectral analysis was in agreement with the Beer-Lambert Law. For CPCC 299, the low, medium, and high concentration ranges were (129–803,750 cells/mL), (1,286,000–5,144,000 cells/mL), and (5,144,000–10,288,000 cells/mL), respectively.
2.4. First Derivative Of Absorbance
The first order derivative of absorbance refers to the rate of change in absorbance with respect to wavelength (∂A/∂λ). The first derivative was plotted using changes in absorbance values at 1 nm bandwidth.
2.5. Savitzky-Golay First Derivative of Absorbance
Savitzky-Golay coefficients for first derivative of absorbance were used to smooth the plot of the first derivative [23].
Savitzky-Golay first derivative of absorbance, Aj = ), where m = number of data points used for smoothing; Ci = filter coefficient; A = observed absorbance value at a specific wavelength; i = the relative position of the convolution coefficient from the smoothed (central) data point; j = the smoothed data point; n = number of data points in absorbance spectra for respective concentrations; N = standardization factor.
Twenty-three data points were used for smoothing such that m = 23; i = −11, −10, ….10, 11; N = 1012 (each m has its respective standardization factor, N, and can be readily obtained from a Savitzky-Golay table of coefficients for first derivate); Ci were fitted according to Savitzky-Golay coefficients for first derivative of absorbance.
2.6. Method Detection Limit
Method Detection Limit (MDL) is the minimum concentration of a compound that can be measured with 99% confidence that the concentration of then compound is greater than zero. The MDLs were calculated using Chemiasoft MDL calculator (www.chemiasoft.com), and a minimum of 7–10 spike replicates were used for the calculation of each MDL.
3. Results
3.1. Absorbance Measurements in Deionized Water
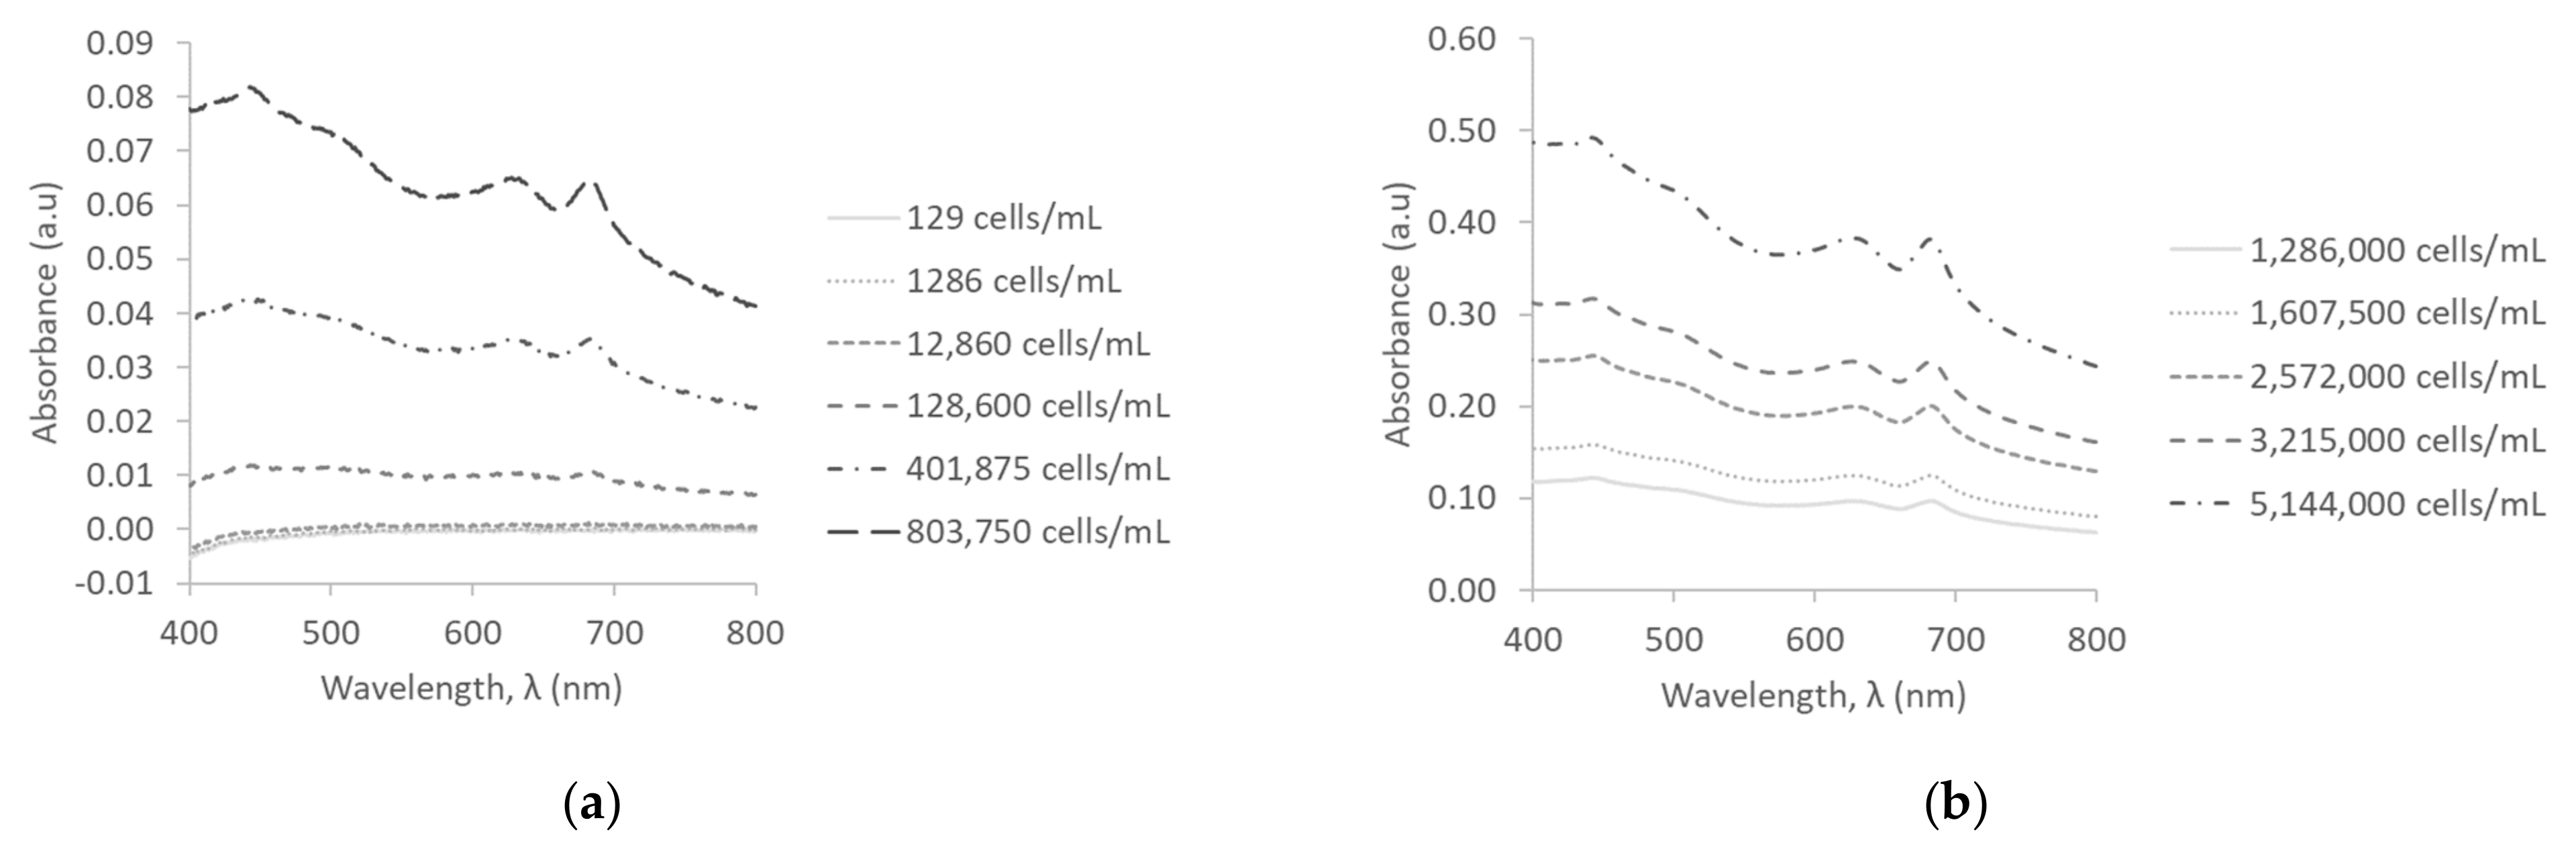
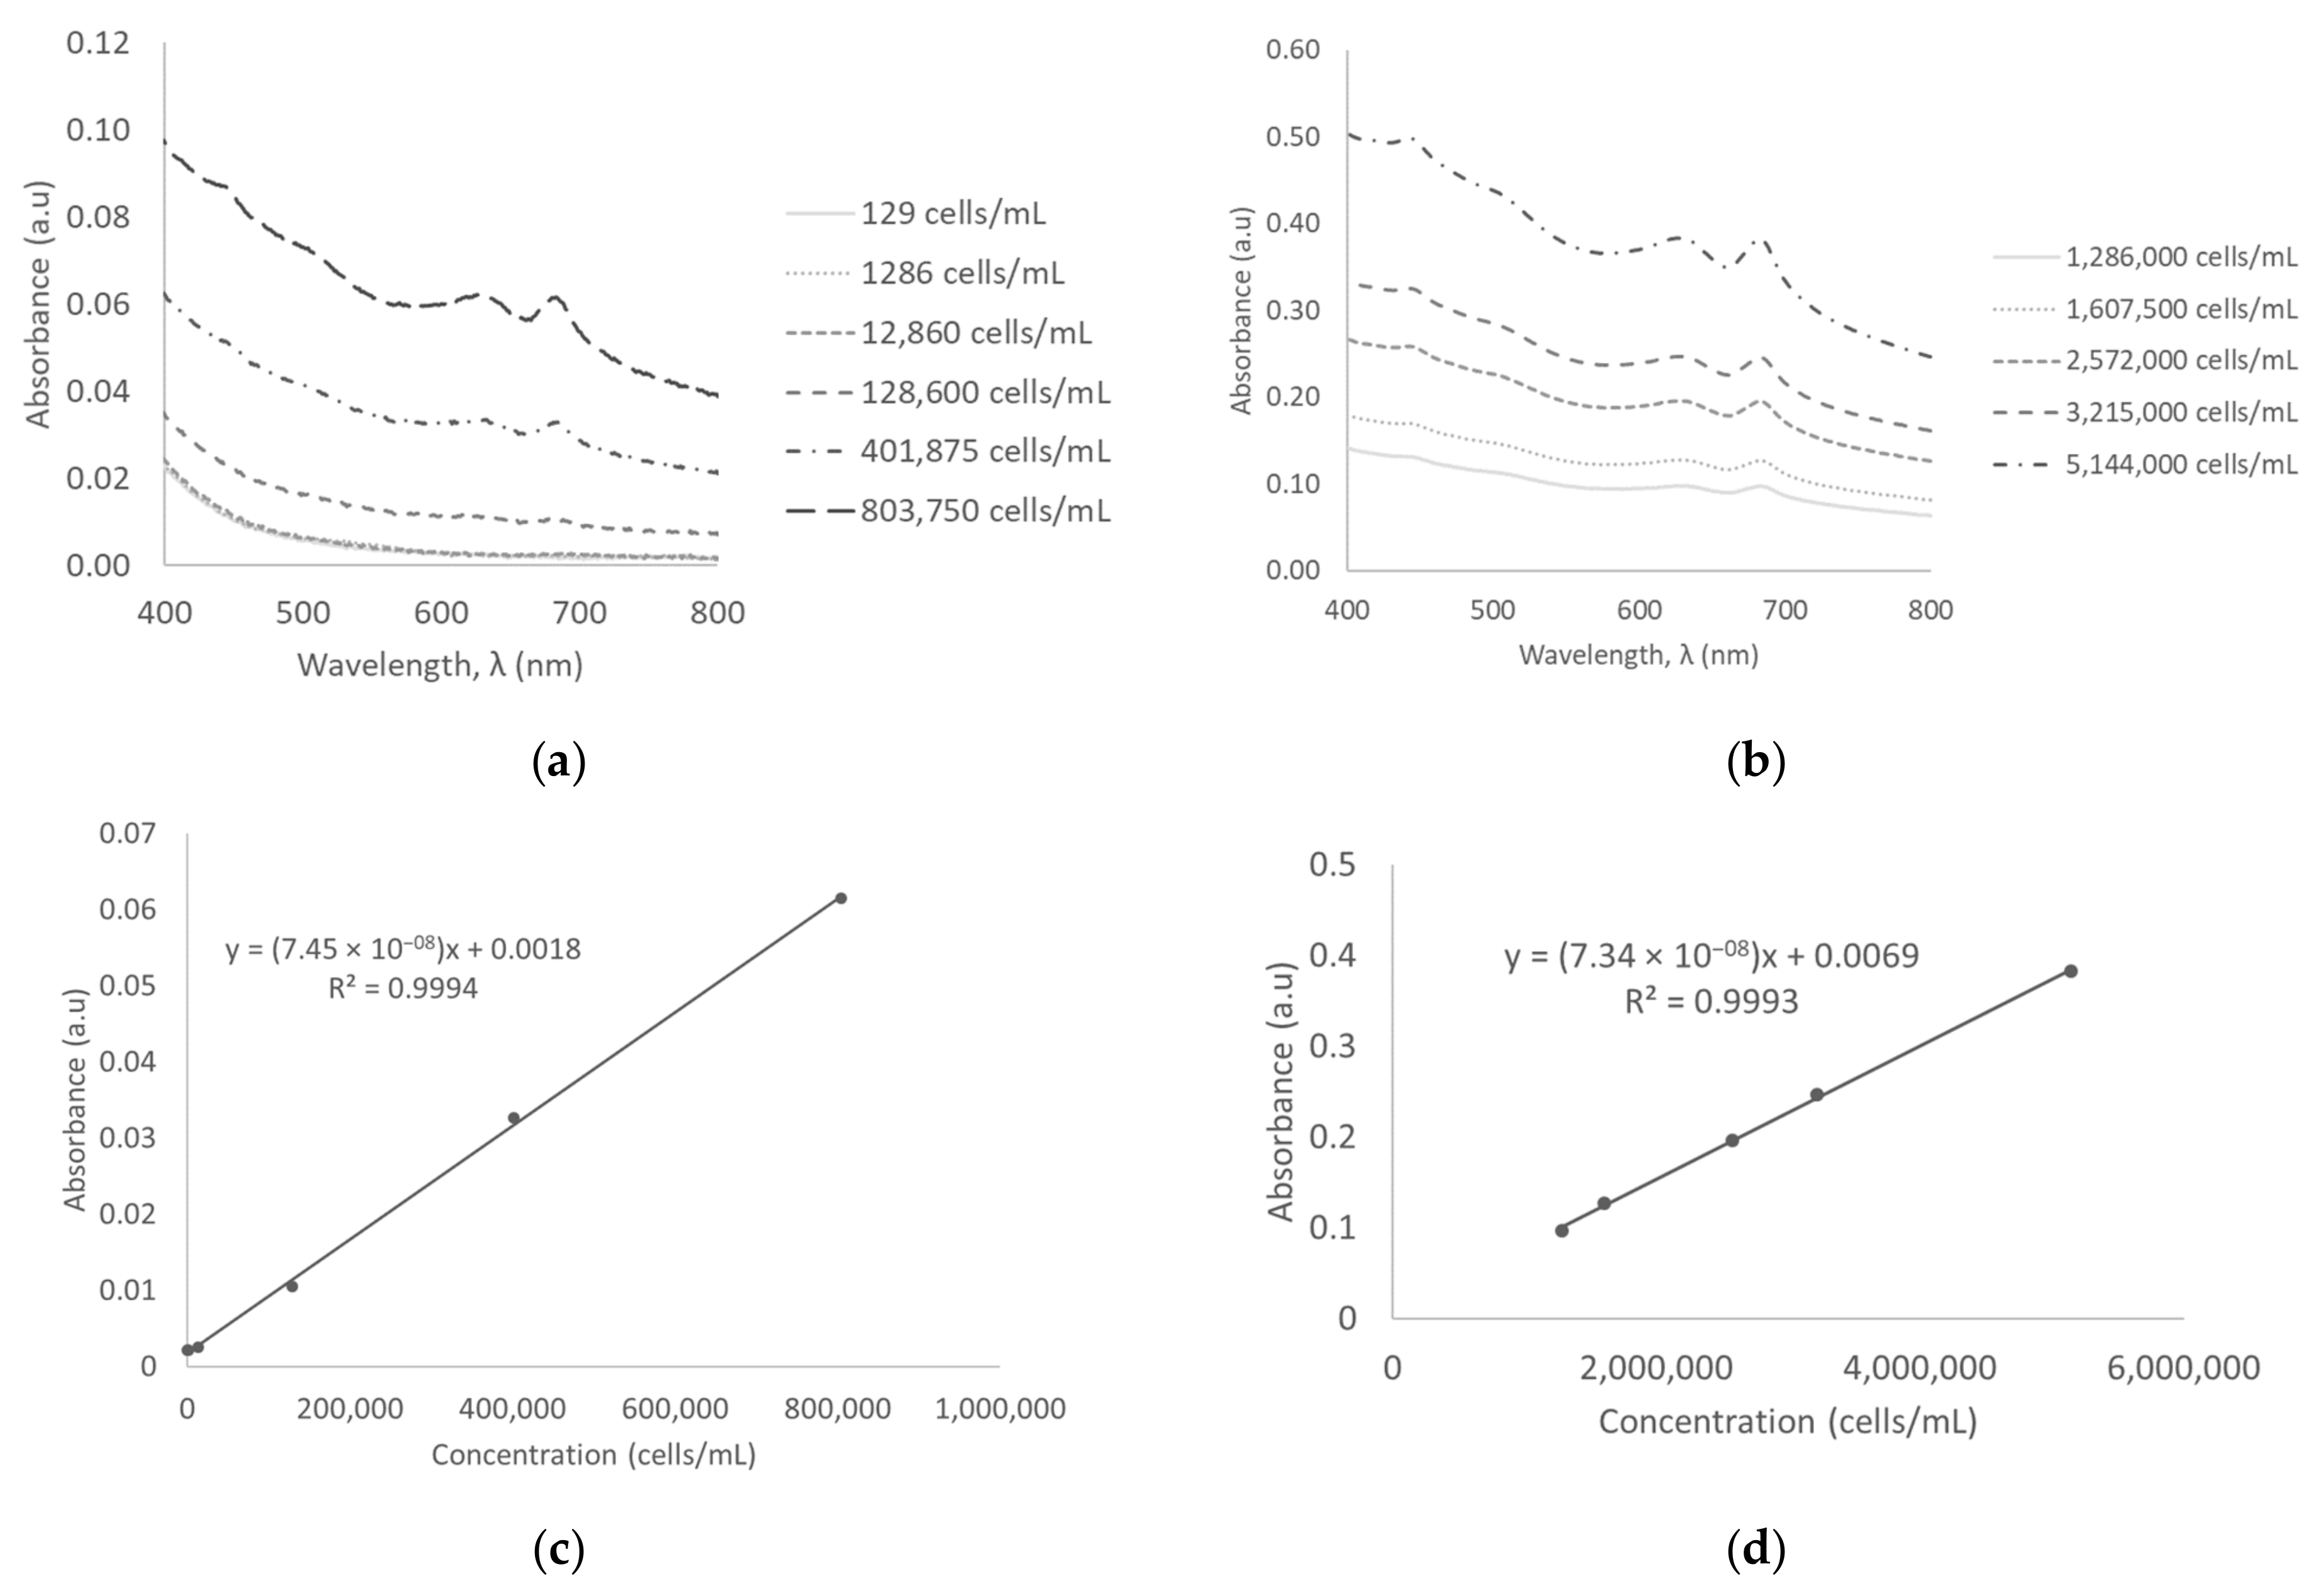
Initial experiments were carried out in contaminant free D.I. water. Absorbance spectra of M. aeruginosa CPCC 299 at three concentration ranges resulted in peaks at approximately 445 nm, 620 nm, and 682 nm, with the most obvious peaks at 682 nm. This peak (682 nm) is indicative of the presence of chlorophyll-a. Chlorophyll-a absorbs light at both 440 and 680 nm and phycocyanin absorbs light at 620 nm [15], which explains all the significant peaks observed for M. aeruginosa CPCC 299. The absorbance spectra for low (129–803,750 cells/mL) and medium (1,286,000–5,144,000 cells/mL) concentrations are illustrated in Figure 1a,b. The absorbance spectra for high concentrations are not shown, as the absorbance spectra at medium concentrations show that the method can easily detect these concentrations.
Comparison of both spectra indicates an increase in absorbance with cyanobacteria concentration. To validate that spectral analysis was coherent with the Beer-Lambert Law, a standard calibration curve at 682 nm was generated. There was a positive linear trend, and strong correlation between cyanobacteria concentration and absorbance (R2 = 0.9981 at low concentrations, R2 = 0.9985 at medium concentrations) (Figure 1c,d). Absorbance measurements increased linearly from –0.0002 au to 0.7438 au for concentrations ranging from 129 cells/mL to 10,288,000 cells/mL. The presence of negative absorbance values is due to the subtraction to account for the growth medium during the spectral scan. There was also a strong correlation between absorbance and concentration at 620 nm (R2 > 0.99), and the slopes at 620 nm and 682 nm were approximately the same. At 620 nm, the slope for low and medium concentrations were 8.128 × 10⁻⁸ ± 1.532 × 10⁻⁹ au/(cells/mL) and 7.366 × 10⁻⁸ ± 1.482 × 10⁻⁹ au/(cells/mL), respectively; at 682 nm, the slope for low and medium concentrations were 8.132 × 10⁻⁸ ± 1.753 × 10⁻⁹ au/(cells/mL) and 7.369 × 10⁻⁸ ± 1.675 × 10⁻⁹ au/(cells/mL) respectively. However, as illustrated in Figure 1a,b, the peaks at 620 nm are not readily distinguished from background noise (broad and blunt peaks), and at concentrations ≤128,600 cells/mL, the peaks at 682 nm are not readily observed. The method detection limit for the zero-order derivative at 682 nm was calculated to be 338,950 cells/mL in D.I. water based on the concentration increments tested.
3.2. First Derivative of Absorbance in D.I. Water
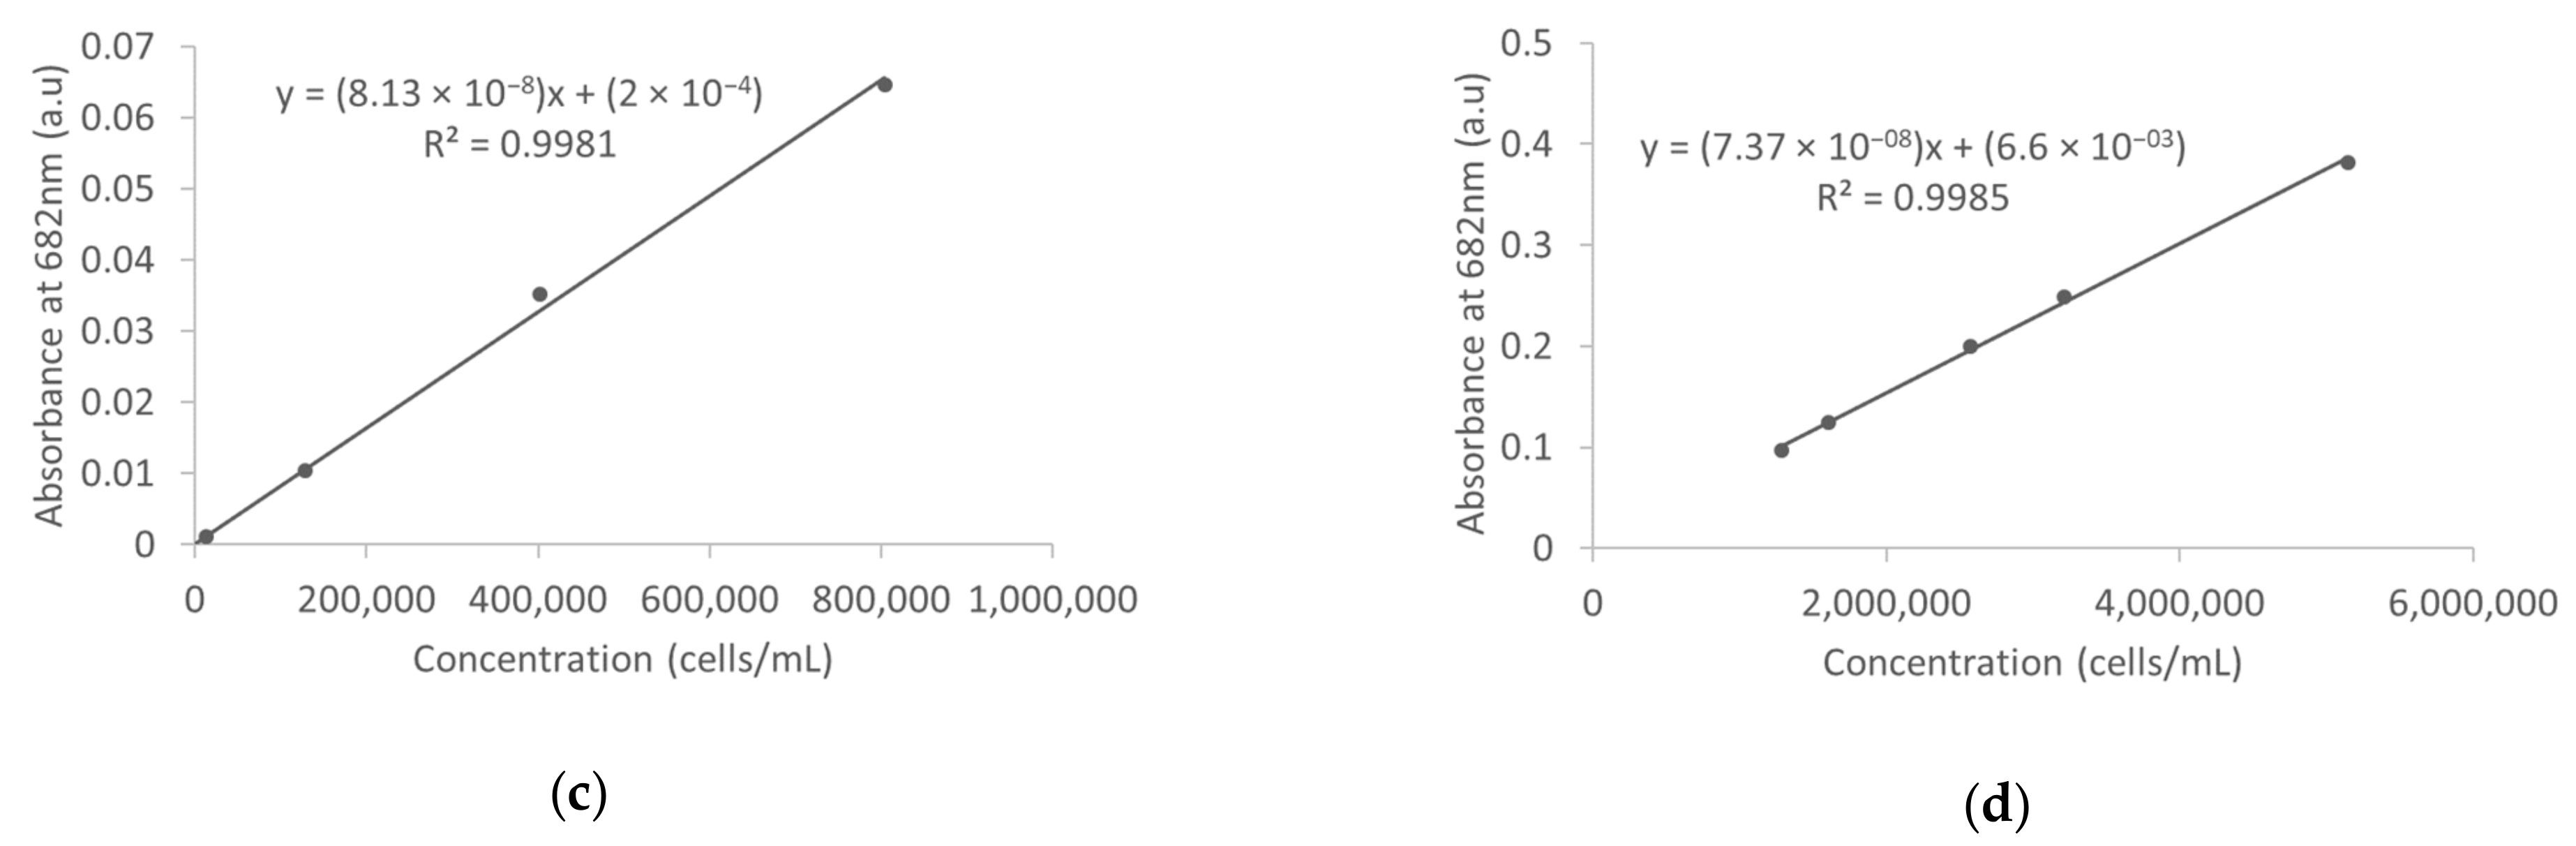
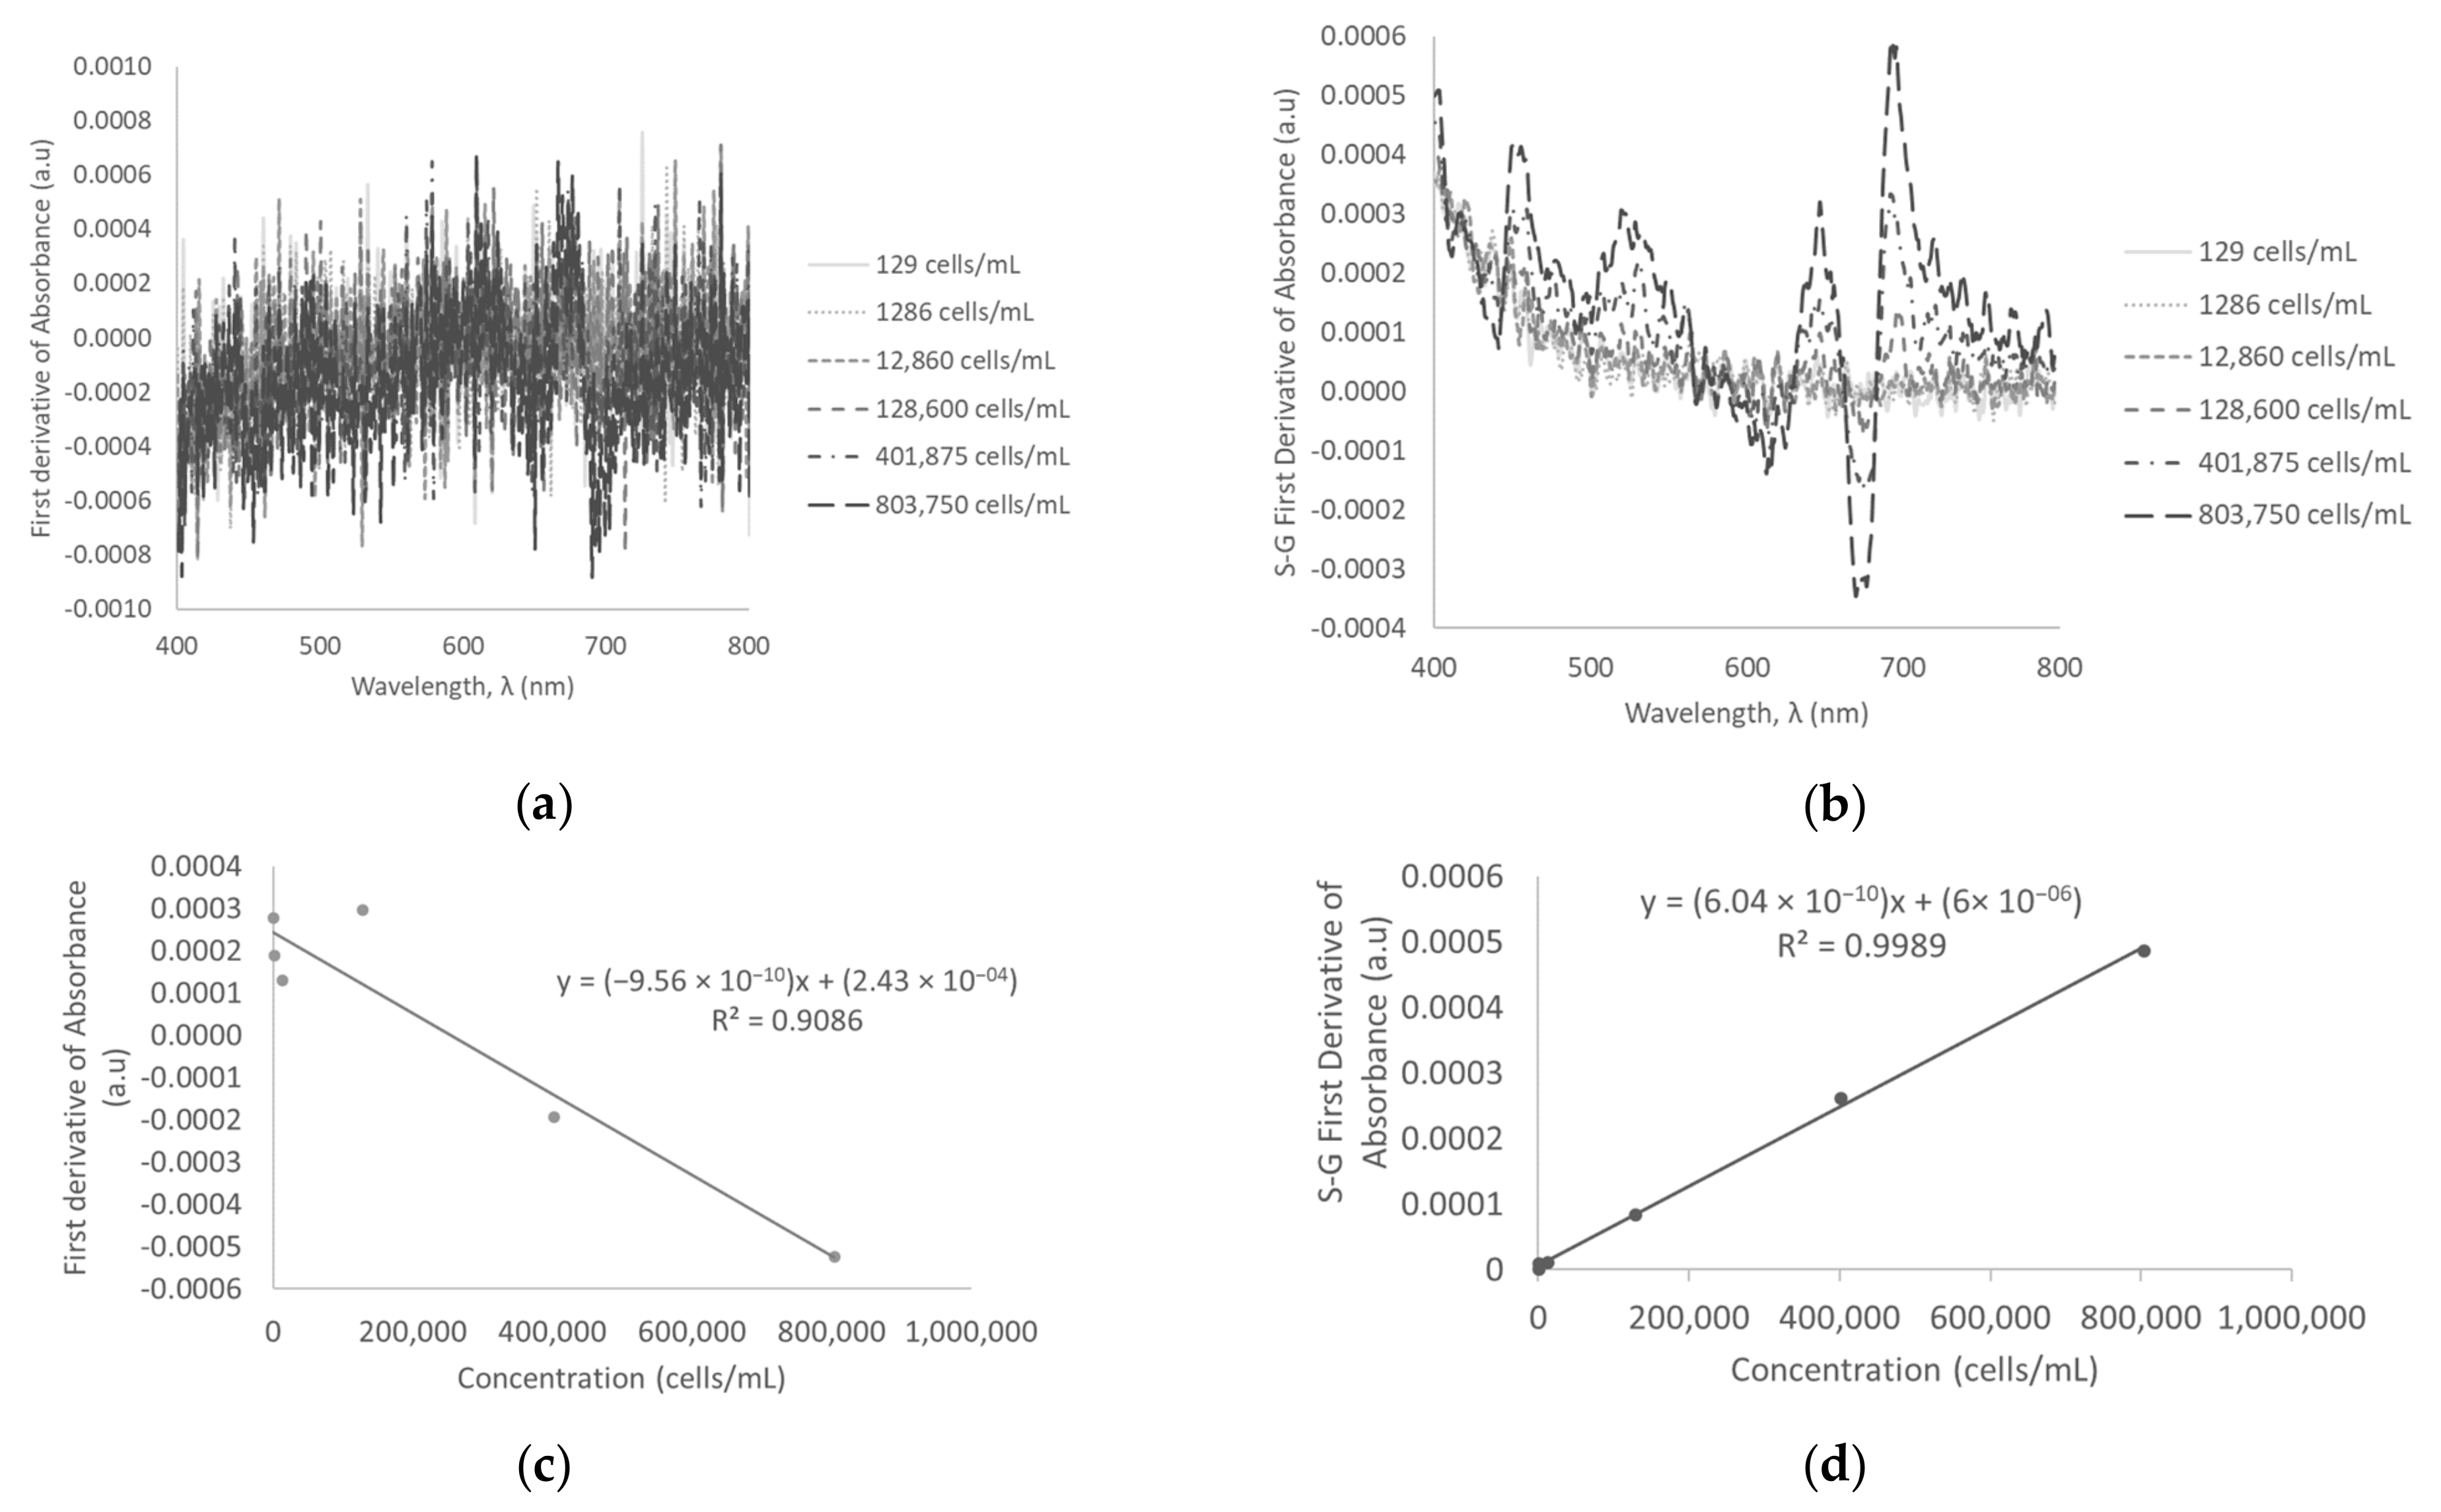
A plot of the first derivative of absorbance (y-axis) against concentration (x-axis) reveals over twice the quantity of peaks indicated on the zero-order absorbance plot. This is a characteristic of first order derivatives and is comprehensively explained by [19]. Simply, a first order derivative passes through zero at the original point where the maximum absorbance value was observed. Flanking this zero point are positive and negative bands with maximum and minimum at the same wavelengths as the inflection point (location of rapid change in direction). As illustrated in Figure 2a, the signal is not readily detected at low concentrations due to the presence of significant noise. This unwanted effect as explained by reference [20] is due to rapid, random changes of noise amplitude in the spectrum. Due to the aforementioned effect of noise, there is a relatively good correlation between the first derivative of absorbance and low concentrations of M. aeruginosa (R2 = 0.8601 at λ = 694 nm) (Figure 2c). However, at medium concentrations, the peaks are readily detected, despite the presence of noise through the spectral scan (Figure 2b). There is also a stronger correlation between the first derivative of absorbance and concentration at medium concentrations than at low concentrations (R2 = 0.9782 at λ = 694 nm) (Figure 2d). There is a negative linear relationship between the first derivative of absorbance at 694 nm and concentration, a trend which is due to the utilization of negative bands. By taking the absolute value of absorbance at locations where peaks are observed, λmax is observed at 694 nm (a region of negative bands). Comparison of the zero-order derivative absorbance spectra and first derivative of absorbance spectra indicates that response measurements (absorbance values) are greater for zero-order derivatives than for first derivative of absorbance, yet the peaks for first derivative of absorbance are more easily observed than that of zero-order derivative of absorbance. This characteristic exists because the first derivative of absorbance is a plot of the rate of change of absorbance, as opposed to absorbance, against wavelength.
3.3. Savitzky-Golay First Derivative of Absorbance in D.I. Water
Due to the presence of significant noise when utilizing the first derivative of absorbance, Savitzky-Golay coefficients for first derivate were used to smoothen the spectra of the first derivative. Utilization of a digital filter such as the Savitzky-Golay polynomial smoothening algorithm [23] can substantially improve the sensitivity and detection limit of the method.
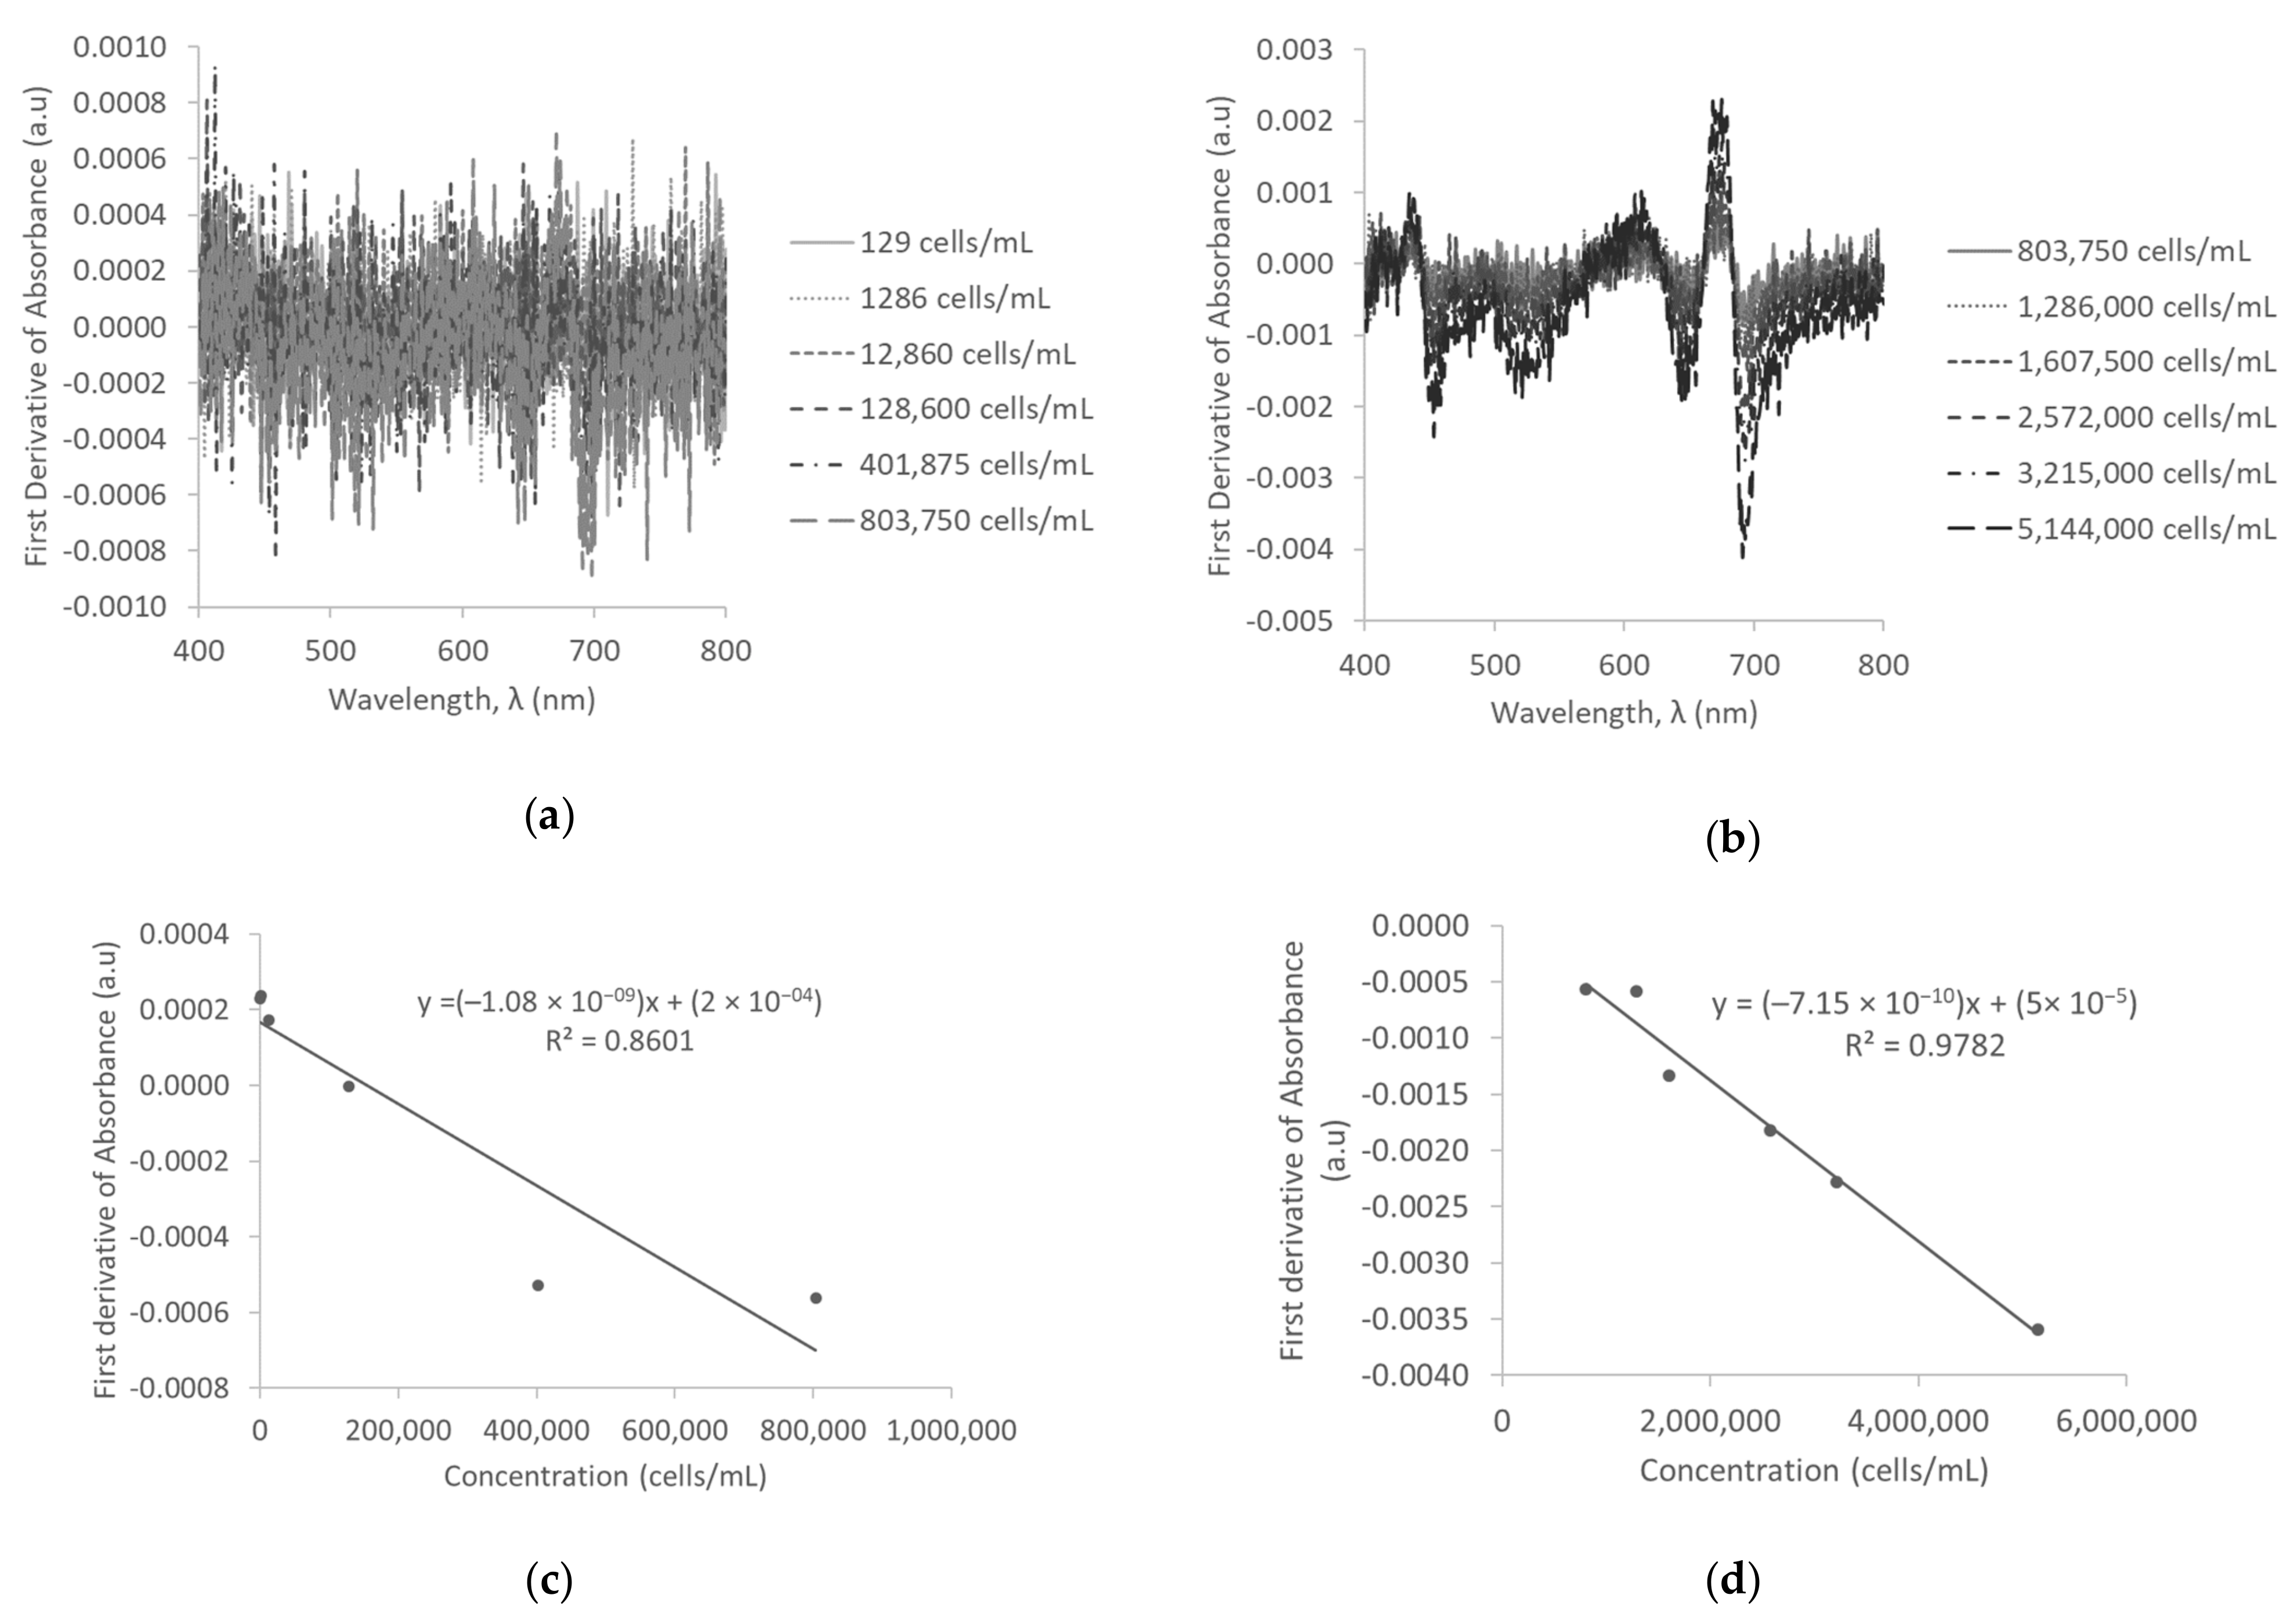
Smoothening of the data using Savitzky-Golay coefficients for the first derivative resulted in sharp and distinct peaks at low, medium, and high concentrations. However, similar to the zero-order derivative spectra, the peaks for 129 cells/mL, 1286 cells/mL, and 12,860 cells/mL were not identified on the spectral scan. The Savitzky-Golay first derivative of absorbance spectra for low and medium concentrations are illustrated in Figure 3a,b, respectively. The standard calibration curve of concentration versus Savitzky-Golay first derivative of absorbance revealed a linear trend and strong positive correlation between the Savitzky-Golay first derivative of absorbance and concentration (R2 = 0.9948 at low concentrations; R2 = 0.9994 at medium concentrations; R2 = 0.9999 at high concentrations). The standard calibration curves of low and medium concentrations are illustrated in Figure 3c,d. The method detection limit using the Savitzky-Golay first derivative of absorbance was calculated to be as low as 41,802 cells/mL. This improvement in detection limit was approximately eight times that of zero-order derivative of absorbance.
3.4. Absorbance Measurements in Surface Water
Initial experiments were carried out in D.I. water to evaluate the capability of the method in a contaminant-free water sample. The overall goal, however, was to determine the viability of derivative spectrophotometry in surface water, which is more challenging due to the presence of organic and inorganic contaminants. Therefore, measurements were repeated in surface water to determine the effectiveness of the method under more realistic conditions. The objective was not to study the impact of each water quality parameter on the performance of the method and the detection limits. The same M. aerugionsa culture and dilutions were used in both the D.I. and surface water experiments, and as a result water characteristics were the primary factors resulting in differences in absorbance measurements.
Similar to measurements in D.I. water, the absorbance spectra of all concentration ranges of M. aeruginosa CPCC 299 resulted in peaks at 445 nm, 620 nm, and 682 nm (Figure 4). The sharpest peaks were observed at 682 nm; however, peaks were not readily identified at concentrations < 401,875 cells/mL. The absorbance spectra of low and medium concentrations are illustrated in Figure 4a,b, respectively. Analysis at 682 nm revealed a linear trend and strong correlation between absorbance and concentration at all concentration ranges (R2 = 0.9994 at low concentrations; R2 = 0.9993 at medium concentrations; R2 = 0.9980 at high concentrations). The standard calibration curve of low and medium concentrations is illustrated in Figure 4c,d, respectively. The detection limit in surface water was poorer than in deionized water (i.e., 392,982 cells/mL in surface water compared to 338,950 cells/mL in D.I.), a response which was expected due to interferences from impurities.
3.5. First Derivative of Absorbance and Savitzky-Golay First Derivative of Absorbance in Surface Water
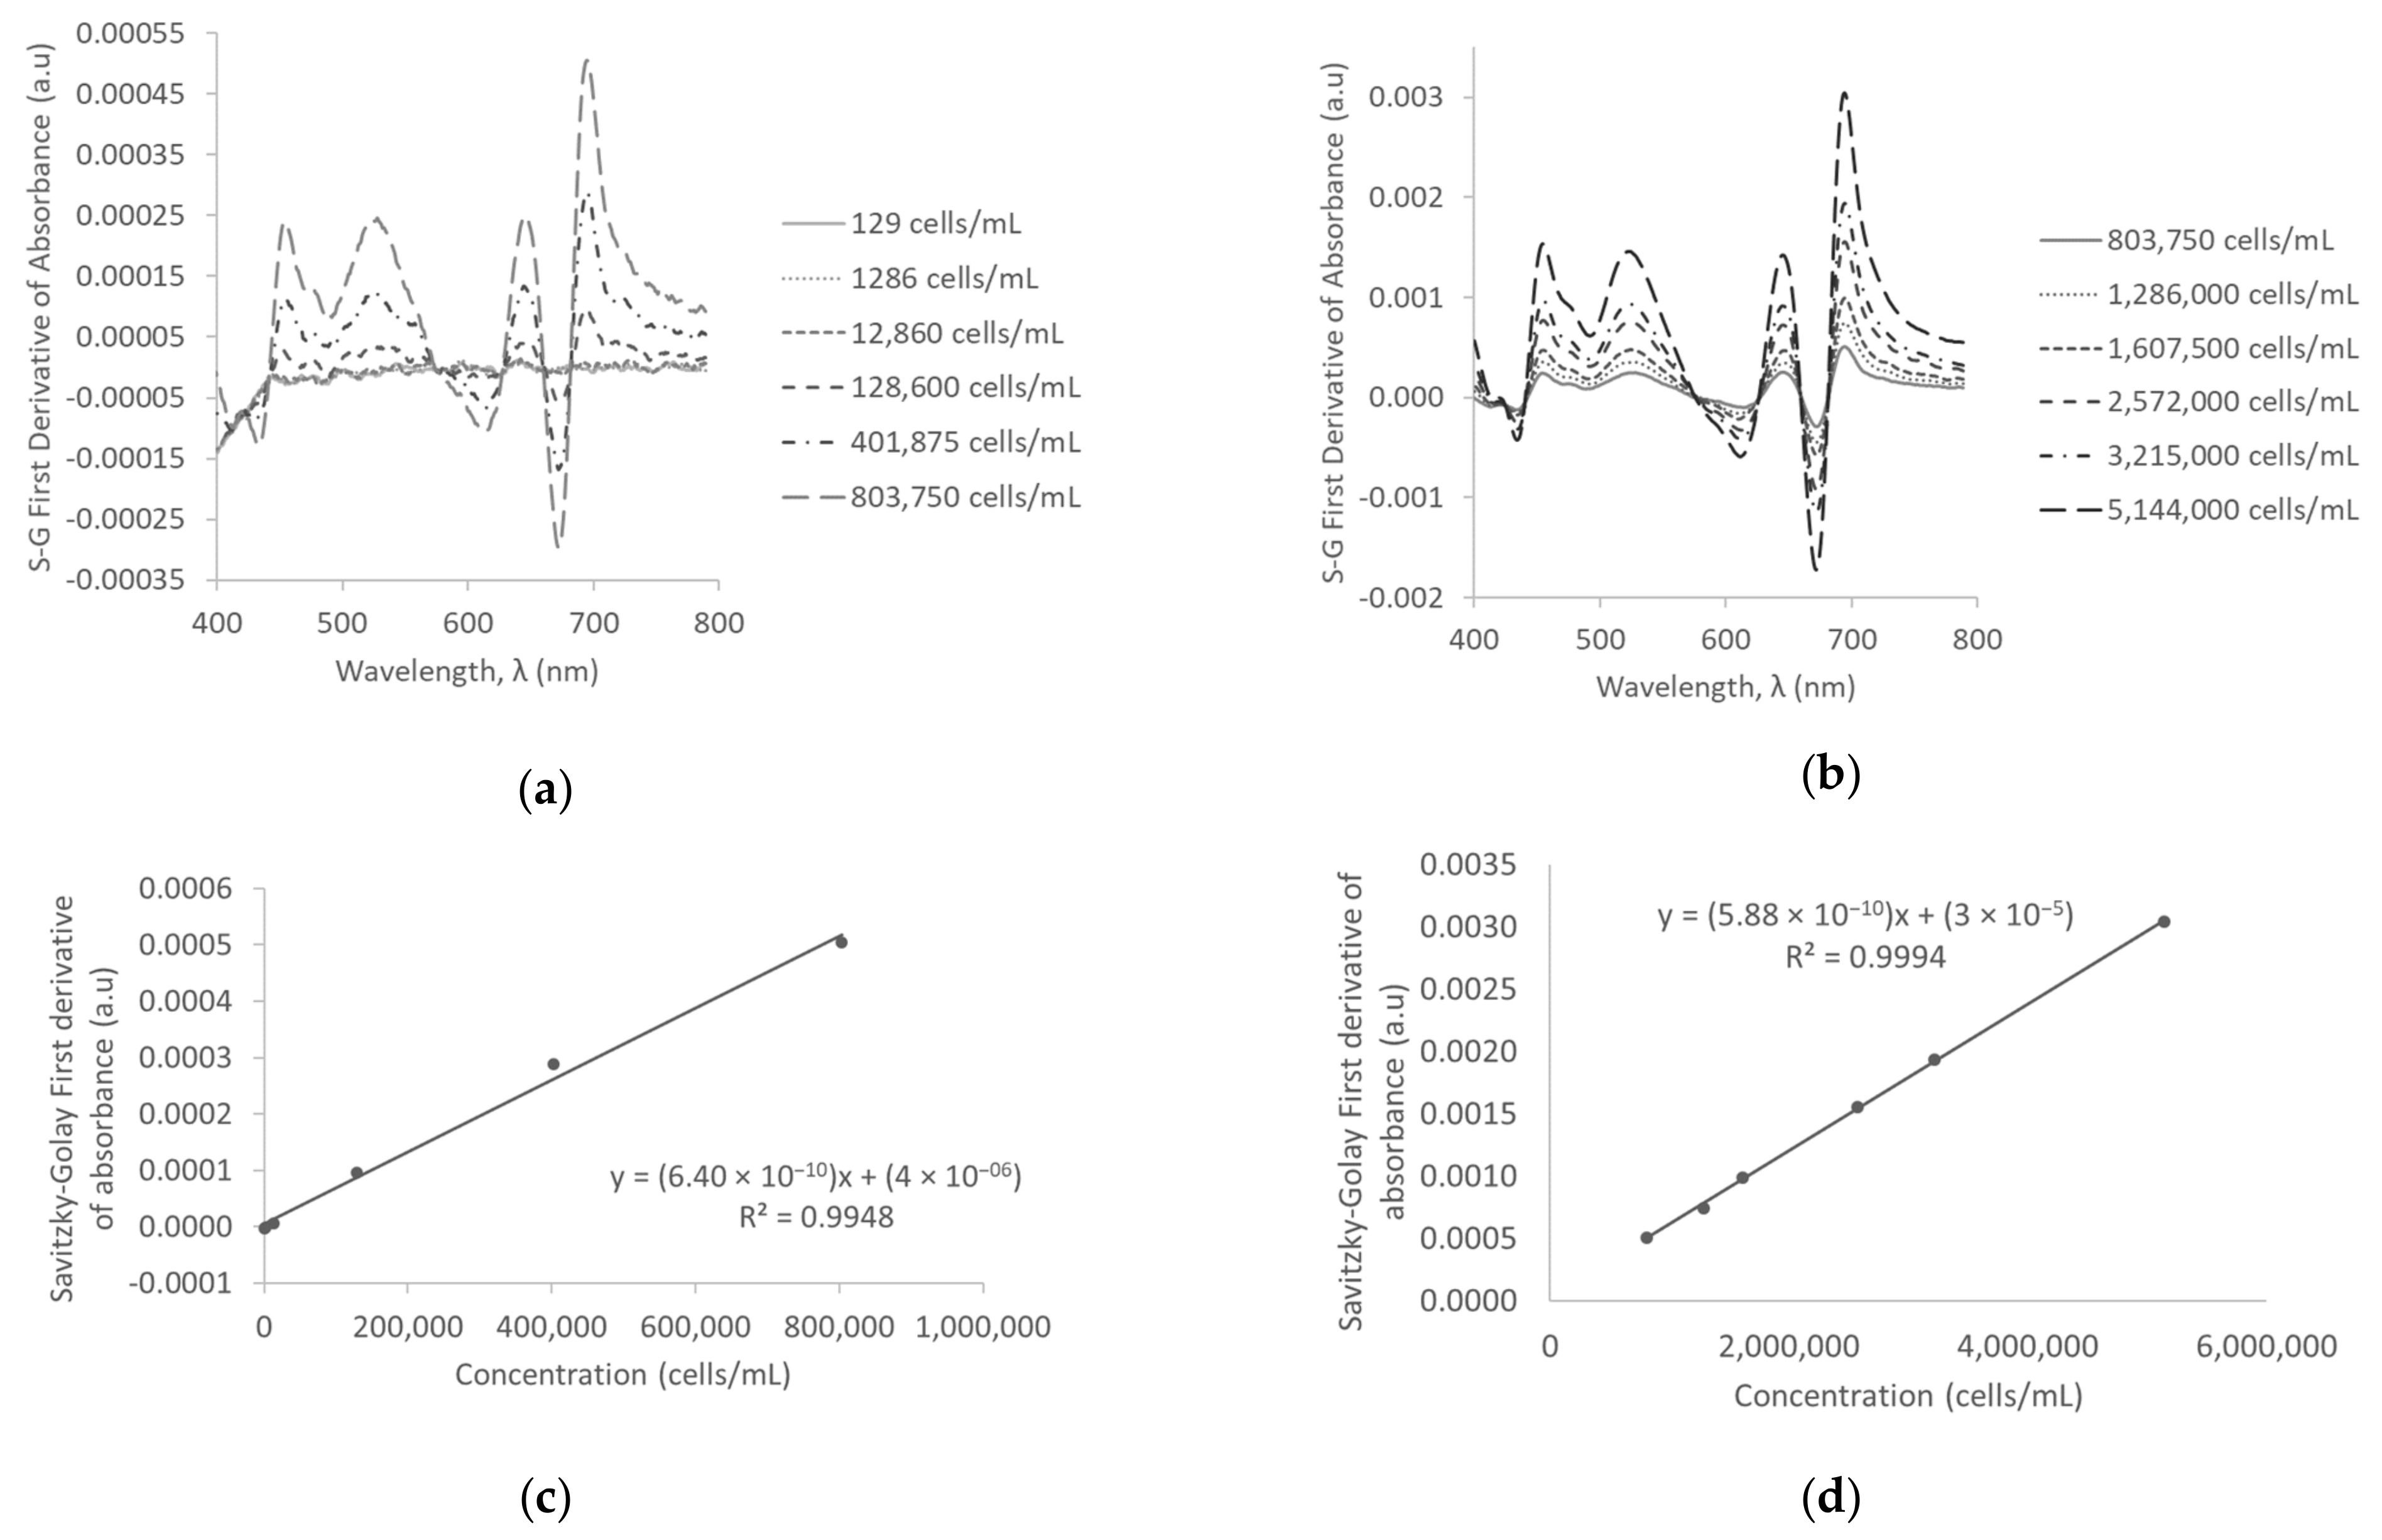
As was expected, due to the sharpness and rapid change in noise, the peaks were not readily identified using the first derivative of absorbance at low concentrations (Figure 5a). However, the Savitzky-Golay coefficients for first derivative of absorbance were effective in improving the signal-to-noise ratio and facilitated distinct identification of peaks (Figure 5b). The location of peaks was the same for both quantification in D.I. water and surface water, with the most obvious peak still observed at 694 nm. As was the case in D.I. water, there was still a strong linear relationship between the Savitzky-Golay first derivative of absorbance at 694 nm and all concentration ranges of M. aeruginosa (R2 = 0.9989 at low concentrations; R2 = 0.9990 at medium concentrations; R2 = 0.9977 at high concentrations). The standard calibration curves of low concentrations versus first derivative and Savitzky-Golay first derivative of absorbance are illustrated in Figure 5c,d, respectively. The method detection limit was calculated to be as low as 90,231 cells/mL and is approximately four times an improvement in detection compared to zero-order derivative measurements.
A summary of all results obtained from the above experiments including the detection limits are presented in Table 2.
3.6. Comparison of M. aeruginosa CPCC 299 and M. aeruginosa CPCC 632 Spectra
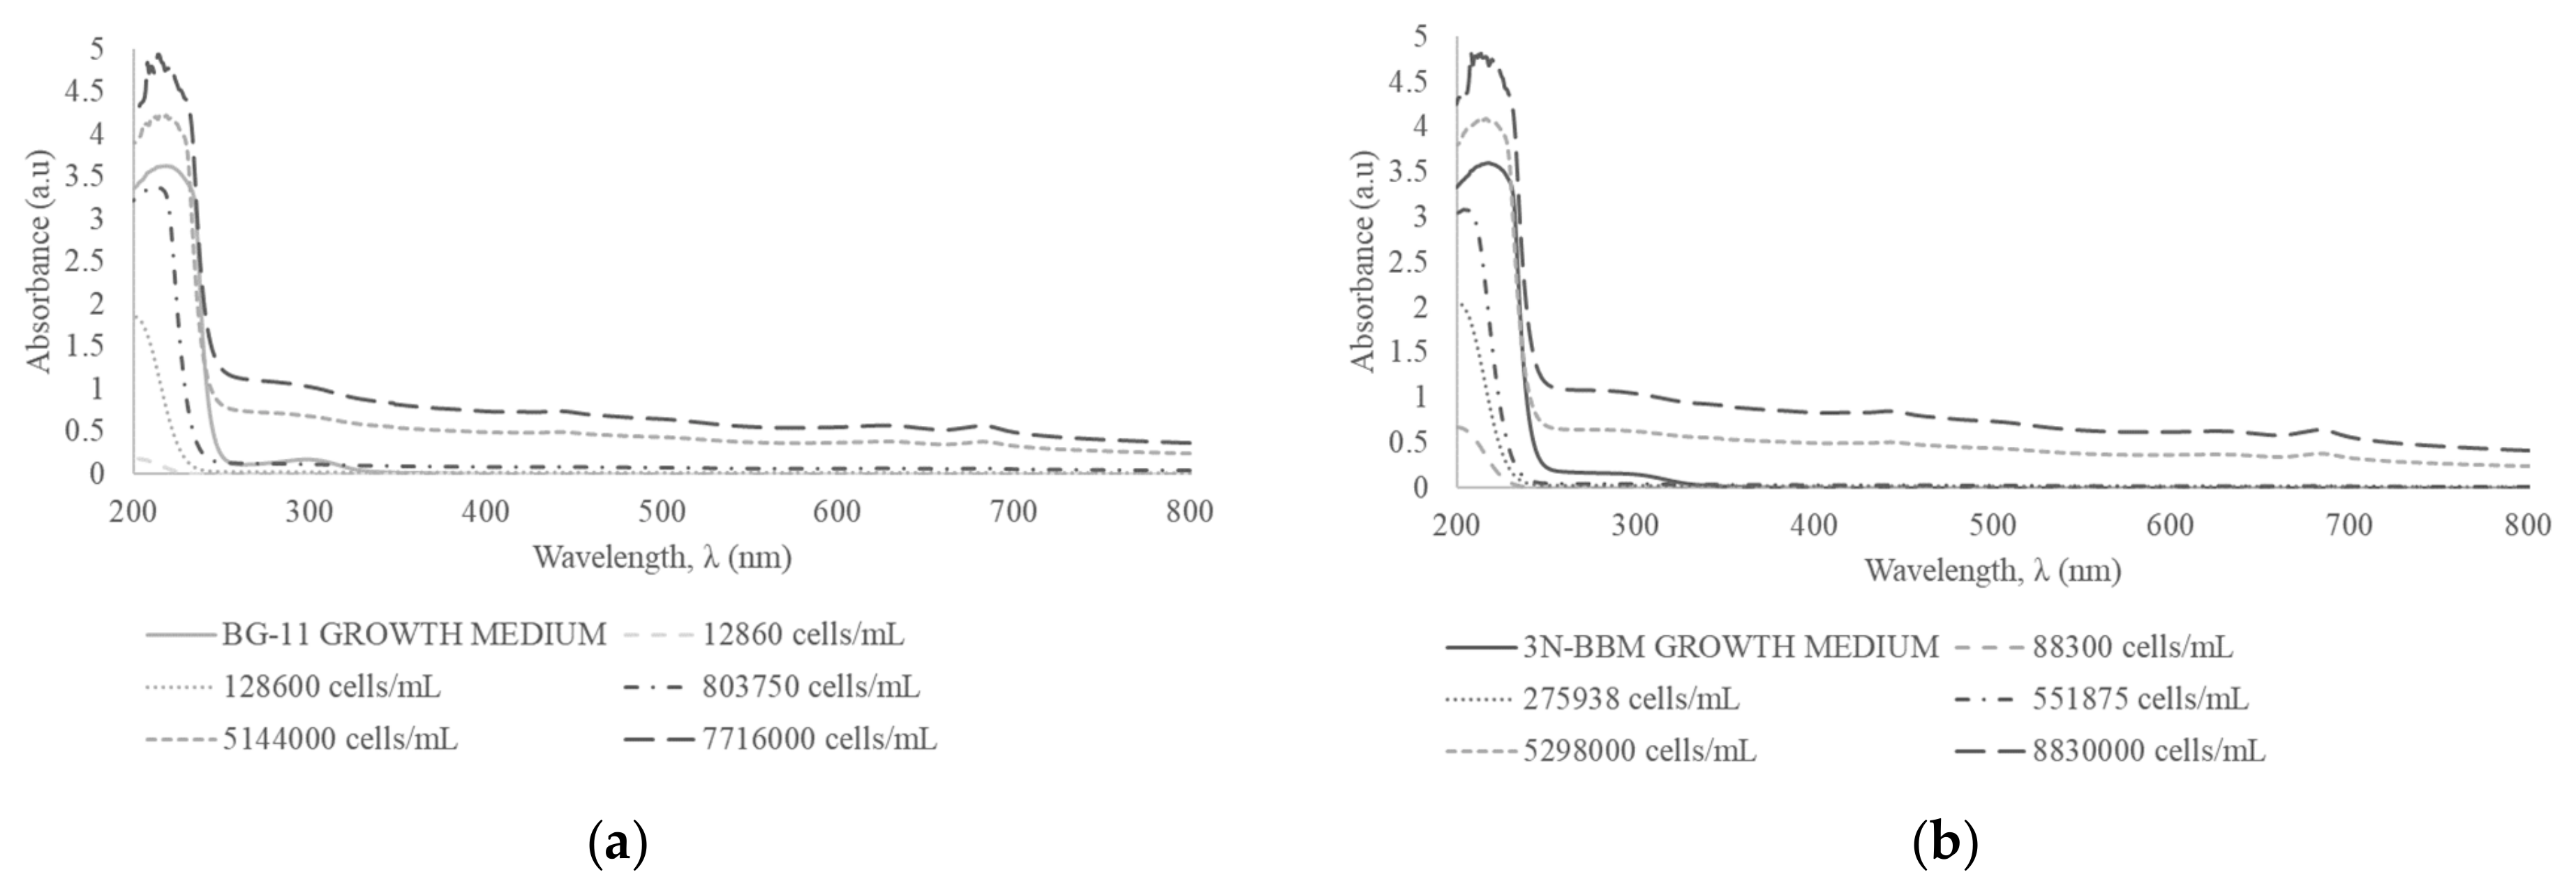
The next phase investigated potential differences in the absorbance spectra of toxigenic (M. aeruginosa CPCC 299) and non-toxigenic (M. aeruginosa CPCC 632) strains to determine whether there would be any significant differences in their absorbance spectra and whether they could be differentiated based on their absorbance characteristics. M. aeruginosa CPCC 632 and M. aeruginosa CPCC 299 have identical morphologies and there are no specific morphological differences between the toxigenic and non-toxigenic strains of Microcystis spp. [24]. However, the presence of toxins may impact the absorbance measurements due to the physical and chemical changes they induce in the water matrix. In addition, [25] reported that the presence of environmentally relevant concentrations of microcystin increased the size of Microcystis spp. colonies 2.7 times in six days, and this aggregation behavior can also impact the absorbance spectra. Results indicated that there was no significant differences in the absorbance spectra of M. aeruginosa CPCC 632 and M. aeruginosa CPCC 299 at similar concentrations (Figure 6a,b), indicating that spectrophotometry would not be able to differentiate them.
4. Discussion
The results presented in this study show that spectrophotometry can be a valuable tool for monitoring of cyanobacteria in surface waters. The detection limit of spectrophotometry alone is not very sensitive, but the detection limit can be greatly improved by employing mathematical and statistical tools such as the Savitzky-Golay first derivative of absorbance as shown in this study. The detection limit for M. aeruginosa CPCC 299 in surface water was approximately 393,000 cells/mL using absorbance measurements and was reduced to approximately 90,000 cells/mL with the application of Savitzky-Golay first derivative of absorbance.
Although the method presented in this paper sufficiently improved the method detection limit both in D.I. water and surface water, it was not able to improve the detection limit to a range of low probability of adverse health effects (<20,000 cells/mL) established by the WHO guidelines (Table 1). However, the detection limit can further be improved using different pathlengths for absorbance measurements, employing signal processing and mathematical tools that should be investigated in future research. The main advantage of using spectrophotometry is its simplicity, real-time capability, and ability to measure a wide range of water quality parameters (e.g., UV254, DOC, BOD, COD, turbidity, nitrate, and nitrite) simultaneously together with the cyanobacteria concentrations. This is particularly important since several studies have reported the impact of water quality and nutrient concentrations on the growth and numbers of cyanobacteria and on the competition and dominance of the toxigenic and non-toxigenic strains. No sample processing, treatment with reagents, or pigment extraction are required for the method and there is a well-established market (e.g., RealTech Inc. UV-VIS sensors) for real-time spectrophotometers that can scan the complete visible and ultraviolet range and analyze results in real-time.
Spectrophotometry neither has the low detection limits nor the specificity of fluorometry that are its main disadvantages. Fluorometric scans have both an excitation and emission spectra, and each compound has its unique fluorometric spectra commonly referred to as its fluorescence signature. Because of these reasons, fluorometry is a more sensitive tool with higher specificity in monitoring of cyanobacteria compared to spectrophotometry. Fluorometry is capable of monitoring cyanobacteria concentrations within WHO management thresholds, however, the maximum attainable concentration for all fluorometric probe technology is 200,000 cells/mL, above this threshold, this tool is insufficient for quantification of cyanobacteria [13]. The more concentrated the water body, as is the case with highly eutrophic lakes, the more likely fluorometric probes are to underestimate measurements. In comparison, spectrophotometry is sufficient for quantification over a wider concentration range [26].
Many of the interferences that hinder the applicability of fluorometry also interfere with spectrophotometric measurements. For example, spectrophotometry and fluorometry were both subject to interference from pigments such as chlorophyll b, c, and pheophytin [27]. This is due to the overlapping spectra caused by other pigments that absorb light and fluoresce at the same wavelength as chlorophyll-a. In addition, the presence of other phytoplankton communities would impact and interfere with the measurements as well as water quality parameters such as turbidity and light scattering particles [13].
5. Conclusions
This study presents a spectrophotometry-based method as a promising tool for real-time detection and monitoring of cyanobacteria. The first derivative of absorbance improved the differentiation between signal and noise; however, it was not effective in improving the signal-to-noise ratio at cyanobacteria concentrations lower than 800,000 cells/mL. Smoothing of the first derivative of absorbance using Savitzky-Golay first derivative of absorbance resulted in narrower, sharper, and more distinct peaks and substantially improved the detection limits both in deionized water and surface water. The lowest detection limit measured in surface water with traditional spectrophotometry was 392,982 cells/mL and with the Savitzky-Golay first derivative of absorbance was 90,231 cells/mL. Detection limits were lower in deionized water, and 338,950 cells/mL and 41,802 cells/mL were achieved with traditional spectrophotometry and the Savitzky-Golay first derivative of absorbance, respectively. The main advantage of a spectrophotometry-based method is its simplicity, real-time capability, and ability to measure a wide range of water quality parameters (e.g., UV254, DOC, BOD, COD, turbidity, nitrate, and nitrite) together with the cyanobacteria concentrations without the need for reagents or processing times. Further research is recommended to bring down the detection limits to lower than 20,000 cells/mL based on the WHO guideline for low probability of adverse health effects.
Author Contributions
Conceptualization, B.Ö.; methodology, B.Ö. and A.V.A.; validation, A.V.A.; formal analysis, A.V.A.; investigation, B.Ö. and A.V.A.; writing—original draft preparation, A.V.A.; writing—review and editing, B.Ö.; supervision, B.Ö.; funding acquisition, B.Ö. All authors have read and agreed to the published version of the manuscript.
Funding
This research was funded by the Natural Sciences and Engineering Research Council (NSERC) under the Strategic Partnership Grants program (STPGP 463663-14).
Conflicts of Interest
The authors declare no conflict of interest.
References
- Falconer, I.R. An Overview of problems caused by toxic blue–green algae (cyanobacteria) in drinking and recreational water. Environ. Toxicol. 1999, 14, 5–12. [Google Scholar] [CrossRef]
- Carmichael, W.W.; Boyer, G.L. Health impacts from cyanobacteria harmful algae blooms: Implications for the North American Great Lakes. Harmful Algae 2016, 54, 194–212. [Google Scholar] [CrossRef]
- Kenefick, S.L.; Hrudey, S.E.; Prepas, E.E.; Motkosky, N.; Peterson, H.G. Odorous Substances and Cyanobacterial Toxins in Prairie Drinking Water Sources. Water Sci. Technol. 1992, 25, 147–154. [Google Scholar] [CrossRef]
- Sivonen, K.; Niemelä, S.I.; Niemi, R.M.; Lepistö, T.; Luoma, T.H.; Räsänen, L.A. Toxic cyanobacteria (blue-green algae) in Finnish fresh and coastal waters. Hydrobiologia 1990, 190, 267–275. [Google Scholar] [CrossRef]
- Bláha, L.; Babica, P.; Maršalek, B. Toxins produced in cyanobacterial water blooms-toxicity and risks. Interdiscip. Toxicol. 2009, 2, 36–41. [Google Scholar] [CrossRef] [PubMed] [Green Version]
- Kaebernick, M.; Neilan, B.A. Ecological and molecular investigations of cyanotoxin production. FEMS Microbiol. Ecol. 2001, 35, 1–9. [Google Scholar] [CrossRef]
- Chorus, I.; Bartram, J. Toxic Cyanobacteria in Water: A Guide to Their Public Health Consequences, Monitoring and Management; E & FN Spon, Published on Behalf of the World Health Organization: New York, NY, USA, 1999. [Google Scholar]
- Bullerjahn, G.S.; McKay, R.M.; Davis, T.W.; Baker, D.B.; Boyer, G.L.; D’Anglada, L.V.; Doucette, G.J.; Ho, J.C.; Irwin, E.G.; Kling, C.L.; et al. Global solutions to regional problems: Collecting global expertise to address the problem of harmful cyanobacterial blooms. A Lake Erie case study. Harmful Algae 2016, 54, 223–238. [Google Scholar] [CrossRef] [Green Version]
- Chaffin, J.D.; Kane, D.D.; Stanislawczyk, K.; Parker, E.M. Accuracy of data buoys for measurement of cyanobacteria, chlorophyll, and turbidity in a large lake (Lake Erie, North America): Implications for estimati.on of cyanobacterial bloom parameters from water quality sonde measurements. Environ. Sci. Pollut. Res. 2018, 25, 25175–25189. [Google Scholar] [CrossRef]
- Read, J.; Klump, V.; Johengen, T.; Schwab, D.; Paige, K.; Eddy, S.; Anderson, E.; Manninen, C. Working in freshwater: The Great Lakes observing system contributions to regional and national observations, data infrastructure, and decision support. Mar. Technol. Soc. J. 2010, 44, 84–98. [Google Scholar] [CrossRef]
- Srivastava, A.; Singh, S.; Ahn, C.-Y.; Oh, H.-M.; Asthana, R.K. Monitoring Approaches for a Toxic Cyanobacterial Bloom. Environ. Sci. Technol. 2013, 47, 8999–9013. [Google Scholar] [CrossRef]
- Moreira, C.; Ramos, V.; Azevedo, J.; Vasconcelos, V. Methods to detect cyanobacteria and their toxins in the environment. Appl. Microbiol. Biotechnol. 2014, 98, 8073–8082. [Google Scholar] [CrossRef] [PubMed]
- Zamyadi, A.; Choo, F.; Newcombe, G.; Stuetz, R. A review of monitoring technologies for real-time management of cyanobacteria: Recent advances and future direction. Trends Anal. Chem. 2016, 85, 83–96. [Google Scholar] [CrossRef]
- Falkowski, P.; Kiefer, D.A. Chlorophyll a fluorescence in phytoplankton: Relationship to photosynthesis and biomass. J. Plankton Res. 1985, 7, 715–731. [Google Scholar] [CrossRef]
- Gan, F.; Shen, G.; Bryant, D.A. Occurrence of Far-Red Light Photoacclimation (FaRLiP) in Diverse Cyanobacteria. Life 2015, 5, 4–24. [Google Scholar] [CrossRef] [PubMed]
- Kulasooriya, S.A. Cyanobacteria: Pioneers of Planet Earth. Ceylon J. Sci. (Bio. Sci.) 2011, 40, 71–88. [Google Scholar] [CrossRef] [Green Version]
- Conroy, J.D.; Kane, D.D.; Dolan, D.M.; Edwards, W.J.; Charlton, M.N.; Culver, D.A. Temporal trends in Lake Erie plankton biomass: Roles of external phosphorus loading and Dreissenid mussels. J. Great Lakes Res. 2005, 31 (Suppl. S2), 89–110. [Google Scholar] [CrossRef]
- Almomani, F.A.; Örmeci, B. Monitoring and measurement of microalgae using the first derivative of absorbance and comparison with chlorophyll extraction method. Environ. Monit. Assess. 2018, 190, 90. [Google Scholar] [CrossRef]
- Kuś, S.; Marczenko, Z.; Obarski, N. Derivative UV-VIS Spectrophotometry in Analytical Chemistry. Chem. Anal. (Wars.) 1996, 41, 899–927. [Google Scholar]
- Patel, K.N.; Patel, J.K.; Rajput, G.C.; Rajgor, N.B. Derivative spectrophotometry method for chemical analysis: A review. Sch. Res. Libr. 2010, 2, 139–150. [Google Scholar]
- Beversdorf, L.J.; Miller, T.R.; McMahon, K.D. The Role of Nitrogen Fixation in Cyanobacterial Bloom Toxicity in a Temperate, Eutrophic Lake. PLoS ONE 2013, 8, e56103. [Google Scholar] [CrossRef] [Green Version]
- Davis, T.W.; Berry, D.L.; Boyer, G.L.; Gobler, C.J. The effects of temperature and nutrients on the growth and dynamics of toxic and non-toxic strains of microcystis during cyanobacteria blooms. Harmful Algae 2009, 8, 715–725. [Google Scholar] [CrossRef]
- Savitzky, A.; Golay, M.J.E. Smoothing and Differentiation of Data by Simplified Least Squares. Anal. Chem. 1964, 36, 1627–1639. [Google Scholar] [CrossRef]
- Fastner, J.; Erhard, M.; von Döhren, H. Determination of oligopeptide diversity within a natural population of Microcystis spp. (Cyanobacteria) by typing single colonies by matrix-assisted laser desorption ionization-time of flight mass spectrometry. Appl. Environ. Microbiol. 2001, 67, 5069–5076. [Google Scholar] [CrossRef] [PubMed] [Green Version]
- Gan, N.; Xiao, Y.; Zhu, L.; Wu, Z.; Liu, J.; Hu, C.; Song, L. The role of microcystins in maintaining colonies of bloom forming Microcystis spp. Environ. Microbiol. 2012, 14, 730–742. [Google Scholar] [CrossRef] [PubMed]
- Sobiechowska-Sasim, M.; Stoń-Egiert, J.; Kosakowska, A. Quantitative analysis of extracted phycobilin pigments in cyanobacteria-an assessment of spectrophotometric and spectrofluorometric methods. J. Appl. Phycol. 2014, 26, 2065–2074. [Google Scholar] [CrossRef] [Green Version]
- Dos Santos, A.C.; Calijuri, M.C.; Moraes, E.M.; Adorno, M.A.; Falco, P.B.; Carvalho, D.P.; Deberdt, G.L.; Benassi, S.F. Comparison of three methods for Chlorophyll determination: Spectrophotometry and Fluorimetry in samples containing pigment mixtures and spectrophotometry in samples with separate pigments through High Performance Liquid Chromatography. Acta Limnol. Bras. 2003, 15, 7–18. [Google Scholar]
Figure 1.
Absorbance spectra of M. aeruginosa CPCC 299 at low concentrations (a) and medium concentrations (b) in D.I. water, and the corresponding calibration curves at 682 nm (c,d).
Figure 1.
Absorbance spectra of M. aeruginosa CPCC 299 at low concentrations (a) and medium concentrations (b) in D.I. water, and the corresponding calibration curves at 682 nm (c,d).


Figure 2.
First derivative of absorbance spectra of M. aeruginosa CPCC 299 at low concentrations (a) and medium concentrations (b) in D.I. water, and the corresponding calibration curves at 694 nm (c,d).
Figure 2.
First derivative of absorbance spectra of M. aeruginosa CPCC 299 at low concentrations (a) and medium concentrations (b) in D.I. water, and the corresponding calibration curves at 694 nm (c,d).

Figure 3.
Savitzky-Golay first derivative of absorbance spectra of M. aeruginosa CPCC 299 at low concentrations (a) and medium concentrations (b) in D.I. water, and the corresponding calibration curves at 694 nm (c,d).
Figure 3.
Savitzky-Golay first derivative of absorbance spectra of M. aeruginosa CPCC 299 at low concentrations (a) and medium concentrations (b) in D.I. water, and the corresponding calibration curves at 694 nm (c,d).

Figure 4.
Absorbance spectra of M. aeruginosa CPCC 299 at low concentrations (a) and medium concentrations (b) in surface water, and the corresponding calibration curves at 682 nm (c,d).
Figure 4.
Absorbance spectra of M. aeruginosa CPCC 299 at low concentrations (a) and medium concentrations (b) in surface water, and the corresponding calibration curves at 682 nm (c,d).

Figure 5.
First derivative (a) and Savitzky-Golay first derivative (b) of absorbance spectra at medium concentrations in surface water (Rideau River), and the corresponding calibration curves at 694 nm (c,d).
Figure 5.
First derivative (a) and Savitzky-Golay first derivative (b) of absorbance spectra at medium concentrations in surface water (Rideau River), and the corresponding calibration curves at 694 nm (c,d).

Figure 6.
Absorbance spectra of toxigenic M. aeruginosa CPCC 299 (a) and non-toxigenic CPCC 632 (b) in D.I water.
Figure 6.
Absorbance spectra of toxigenic M. aeruginosa CPCC 299 (a) and non-toxigenic CPCC 632 (b) in D.I water.


Table 1.
World Health Organization guideline values for cyanobacteria in recreational waters.
| Cyanobacteria Cell Concentration (cells/ml) | Probability of Adverse Health Effects |
|---|---|
| <20,000 | Relatively mild and/or low |
| 20,000–100,000 | Moderate |
| 100,000–10,000,000 | High |
| >10,000,000 | Very high |
Table 2.
Critical data for Microcystis aeruginosa CPCC 299 in both deionized water and surface water in low (129–803,750 cells/mL), medium (1,286,000–5,144,000 cells/mL), and high (5,144,000–10,288,000 cells/mL) concentration ranges.
Table 2.
Critical data for Microcystis aeruginosa CPCC 299 in both deionized water and surface water in low (129–803,750 cells/mL), medium (1,286,000–5,144,000 cells/mL), and high (5,144,000–10,288,000 cells/mL) concentration ranges.
| Water Sample | Test | Concentration Range (cells/mL) | Slope | R2 | Detection Limit (cells/mL) |
|---|---|---|---|---|---|
| Deionized water | Absorbance | 129–803,750 | 8.13208 × 10−08 ± 1.75287 × 10−09 | 0.9981 | 338,950 |
| 1,286,000–5,144,000 | 7.36864 × 10−08 ± 1.67453 × 10−09 | 0.9985 | |||
| 5,144,000–10,288,000 | 6.99701 × 10−08 ± 8.81363 × 10⁻¹⁰ | 0.9997 | |||
| First derivative of absorbance | 129–803,750 | −1.07539 × 10−09 ± 2.16885 × 10⁻¹⁰ | 0.8601 | ||
| 1,286,000–5,144,000 | −7.14544 × 10⁻¹⁰ ± 5.33754 × 10⁻¹¹ | 0.9782 | |||
| 5,144,000–10,288,000 | −7.50473 × 10⁻¹⁰ ± 1.23489 × 10⁻¹¹ | 0.9995 | |||
| Savitzky-Golay first derivative of absorbance | 129–803,750 | 6.39754 × 10⁻¹⁰ ± 2.32216 × 10⁻¹¹ | 0.9948 | 41,802 | |
| 1,286,000–5,144,000 | 5.88213 × 10⁻¹⁰ ± 7.20283 × 10⁻¹² | 0.9994 | |||
| 5,144,000–10,288,000 | 6.26434 × 10⁻¹⁰ ± 3.44903 × 10⁻¹² | 0.9999 | |||
| Surface water | Absorbance | 129–803,750 | 7.45411 × 10−08 ± 9.27447 × 10⁻¹⁰ | 0.9994 | 392,982 |
| 1,286,000–5,144,000 | 7.33732 × 10−08 ± 1.1411 × 10−09 | 0.9993 | |||
| 5,144,000–10,288,000 | 7.37948 × 10−08 ± 2.32234 × 10−09 | 0.9980 | |||
| First derivative of absorbance | 129–803,750 | −9.5609 × 10⁻¹⁰ ± 1.51611 × 10⁻¹⁰ | 0.9086 | ||
| 1,286,000–5,144,000 | −7.3683 × 10⁻¹⁰ ± 3.83158 × 10⁻¹¹ | 0.9920 | |||
| 5,144,000–10,288,000 | −7.3868 × 10⁻¹⁰ ± 2.82227 × 10⁻¹¹ | 0.9971 | |||
| Savitzky-Golay first derivative of absorbance | 129–803,750 | 6.04214 × 10⁻¹⁰ ± 1.03161 × 10⁻¹¹ | 0.9989 | 90,231 | |
| 1,286,000–5,144,000 | 5.8526 × 10⁻¹⁰ ± 1.0753 × 10⁻¹¹ | 0.9990 | |||
| 5,144,000–10,288,000 | 6.20429 × 10⁻¹⁰ ± 2.0855 × 10⁻¹¹ | 0.9977 |
© 2019 by the authors. Licensee MDPI, Basel, Switzerland. This article is an open access article distributed under the terms and conditions of the Creative Commons Attribution (CC BY) license (http://creativecommons.org/licenses/by/4.0/).
Share and Cite
MDPI and ACS Style
Agberien, A.V.; Örmeci, B. Monitoring of Cyanobacteria in Water Using Spectrophotometry and First Derivative of Absorbance. Water 2020, 12, 124. https://doi.org/10.3390/w12010124
AMA Style
Agberien AV, Örmeci B. Monitoring of Cyanobacteria in Water Using Spectrophotometry and First Derivative of Absorbance. Water. 2020; 12(1):124. https://doi.org/10.3390/w12010124
Chicago/Turabian StyleAgberien, Adogbeji Valentine, and Banu Örmeci. 2020. "Monitoring of Cyanobacteria in Water Using Spectrophotometry and First Derivative of Absorbance" Water 12, no. 1: 124. https://doi.org/10.3390/w12010124
Note that from the first issue of 2016, this journal uses article numbers instead of page numbers. See further details here.