Influence of Rigid Emerged Vegetation in a Channel Bend on Bed Topography and Flow Velocity Field: Laboratory Experiments


1
Water Engineering Department, Shiraz University, Shiraz 71441, Iran
2
Centre for Infrastructure Engineering, School of Engineering, Western Sydney University, Penrith, NSW 2747, Australia
3
Institute of Geophysics, Polish Academy of Sciences, 01-452 Warsaw, Poland
*
Author to whom correspondence should be addressed.
Water 2020, 12(1), 118; https://doi.org/10.3390/w12010118
Submission received: 2 December 2019
/
Revised: 20 December 2019
/
Accepted: 27 December 2019
/
Published: 30 December 2019
(This article belongs to the Section Hydraulics and Hydrodynamics)
Abstract
:Trees have been used extensively by river managers for improving the river environment and ecology. The link between flow hydraulics, bed topography, habitat availability, and organic matters is influenced by vegetation. In this study, the effect of trees on the mean flow, bed topography, and bed shear stress were tested under different flow conditions. It was found that each configuration of trees produced particular flow characteristics and bed topography patterns. The SR (single row of trees) model appeared to deflect the maximum velocity downstream of the bend apex toward the inner bank, while leading the velocity to be more uniformly distributed throughout the bend. The entrainment of sediment particles occurred toward the area with higher values of turbulent kinetic energy (TKE). The results showed that both SR and DR (double rows of trees) models are effective in relieving bed erosion in sharp ingoing bends. The volume of the scoured bed was reduced up to 70.4% for tests with trees. This study shows the effectiveness of the SR model in reducing the maximum erosion depth.
1. Introduction
In recent years, there has been growing interest among river managers to use soft engineering solutions for river restoration and ecosystem protection [1]. Undoubtedly, environmental and morphological aspects of river variations, especially rivers’ bends, must be inspected, because of their strong influence on aquatic habitat and channel hydraulics [2,3,4,5,6,7,8]. The development and migration of river bends endanger the habitat, properties, roads and bridges, resulting in damage. To date, the link between hydraulic conditions and biotic interactions is less explored, possibly because of the limited attention that ecologists have paid to the hydraulics of bends [9]. Nevertheless, some researchers have studied the vegetation–flow interaction [10,11,12,13,14,15,16,17].
Some theoretical studies present insights into the processes governing river bend morphology [18,19,20]. It is now well understood that a channel bend creates secondary flows and a cross sloped channel section, along which the flow depth increases toward the outer bank [21,22,23]. The curvature of the river leads flow on the point bar and then pushes the high-velocity region toward the pool [24]. The secondary circulation produces outward near-surface and inward near-bed velocity components. Measurements have shown that the secondary currents adjacent to the bed move to the inside bank, and that those close to the water surface move to the outside bank [25].
The morphology of rivers’ beds is affected by the characteristics of sediments conveyed from upstream, as well as local geology, the local flow field, and the discharge [26,27,28]. Some studies have focused on investigating the effect of river training structures for bed stabilization. For example, the influence of spurs on the flow pattern in a mild meandering flume was investigated by Giri et al. [29]. Also, it has been observed that gabions hinder natural river alterations and restrict the connectivity between floodplain and main channel. Thompson et al. [30] found that for the models with spurs, flow at the outer bank of the second bend was very slow-moving, due to the existence of training structures. However, using hard engineering measures in river restoration projects may affect water quality and reduce channel geometry [31].
Biological strategies in controlling erosion and improving stream habitat and ecology are much less expensive, time-consuming and more effective than other types of conservation hard engineering methods such as dikes, levees and concrete walls [32,33,34,35,36]. According to the formation of plants, their mechanical properties and density, as well as their spatial distribution, can greatly affect the flow structure, biotic processes, channel planform and sediment movement in rivers [4,37,38,39,40,41,42]. The effectiveness of plants as a bed reinforcing measure depends upon the scale and density, as well as the protrusion of plant stems that are partly or fully submerged, the geometric arrangement concerning one another, and their development stage [43,44].
Rigid plants such as willows and cottonwoods, which can be simulated by cylindrical rods, influence flow characteristics and reduce both boundary shear stress and flow velocity in bends [18,45,46]. The rods, sometimes termed sacrificial piles, can themselves be subject to considerable scour, but nonetheless protect the bed and river banks against scouring [47,48]. Hey and Thorne [49] reported that vegetation has a major control on river width and flow velocity. In an experimental study, Sandercock and Hooke [50] investigated the effects of vegetation on sediment removal in an ephemeral river and found that using plants for scouring control is more useful than check dams. The relative effectiveness of forest trees versus grassland vegetation for river bank protection was studied by Rood et al. [5], who found that trees are more resistant than grassland to flood-associated bank erosion. The performance of stream barbs (submerged groynes) on the channel bathymetry and flow field in a semi-alluvial meander bend was investigated by Sandercock and Hooke [51]. These researchers found that semi-alluvial rivers are resistant to alteration and vegetation has little effect on bed topography. Also, Keshavarzi et al. [52] studied the effect of rods simulating trees on the bed morphology in mild river bends. Their study showed that relative to the bare-channel control, for the tests with a single row and double rows of cylindrical rods, the maximum scour depth at the bend apex reduced by up to 77% and 62%, respectively.
However, more studies are needed for realistic modeling of flow and aquatic plant interaction and long-term river dynamics. This study aims to experimentally investigate the influence on flow pattern and bed topography of two different arrangements of cylindrical rods simulating trees on the bed of a river bend. For this, single-row and double-row configurations of trees commonly used in river restoration projects are studied. Additionally, the variations of turbulent kinetic energy and Reynolds shear stresses in the presence of the trees along the outer bank are presented. It is also significant from a practical standpoint, as limiting bank migration occurring as a result of bed erosion at the bank toe is often a matter of concern in river engineering and management.
2. Materials and Methods
The experimental runs for this research were carried out in the hydraulics laboratory of the Water Engineering Department at Shiraz University, Shiraz, Iran. A 15 m long, 0.7 m wide and 0.6 m deep flume was used with upstream and downstream straight reaches of 8 m and 2.8 m, respectively. A sine-generated reach, 4.2 m long, comprised of three sequential bends, was set up for the test reach, as shown in Figure 1. The width of the bend channel was 0.3 m. The characteristics of the physical model were: wavelength = 2.15 m, sinuosity = 2.97, and Rc/B = 2.6, where Rc and B are the radius of curvature and width of the bend, respectively. As the value of Rc/B was less than 3, the river bend model is classified as being a strongly curved or sharp bend [53]. Also, the wavelength was 9.4 times the channel width, which is close to the value of 10 in natural rivers, as reported by Leopold and Wolman [14]. The measurements were made in the middle (second) bend, termed the test section with Rc = 0.78 m.
River meanders can be categorized as ingoing (θ ≤ 30°) and outgoing (θ ≥ 70°), based on the values of θ, the deflection angle [53]. The model used in this study represents an ingoing condition (θ = 30°). The range of flow depths was H = 0.15–0.21 m.
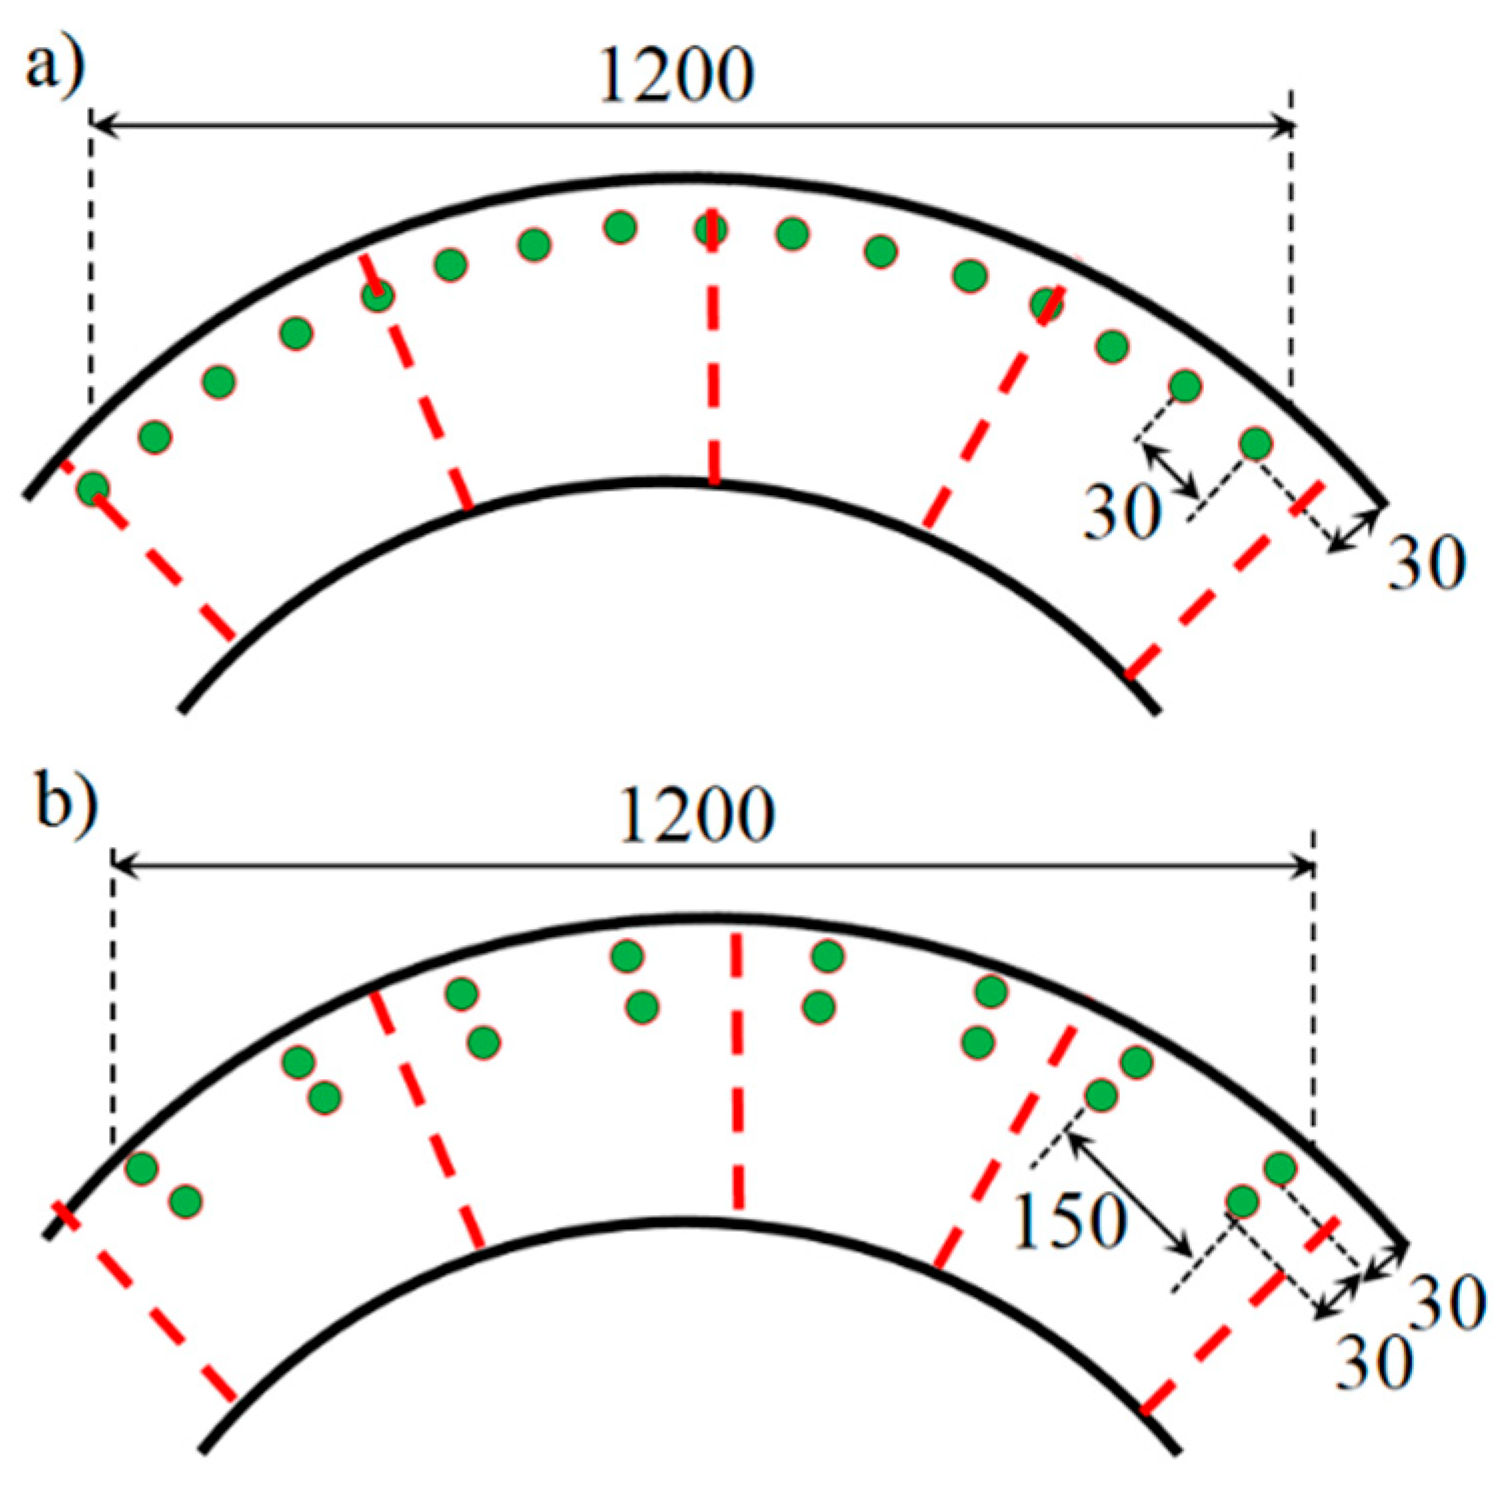
Two sets of experiments were carried out with uniform flow and different vegetation conditions including (a) the tests without trees (Tests 1, 4 and 7), and (b) the tests with trees (Tests 2, 3, 5, 6, 8 and 9). The flow conditions for all the tests are presented in Table 1. In this table, Q is the flow discharge, H is the flow depth, U is the mean flow velocity, Fr is the Froude number, and U* is the shear velocity. Details of the model, including the grid for velocity measurement at different cross-sections in the bend, are shown in Figure 1. All the experiments were carried out under sub-critical flow conditions, based on the inflow to the channel test section. To simulate the trees, cylindrical wooden rods of 300 mm height and 8 mm diameter were installed in the model at the outer bank of the bend in two different patterns, as shown in Figure 2. The cylindrical rods were fixed to the floor of the flume. The SR model, simulating a single row of trees along the river bank, featured 40 rods symmetrically located about the apex of the bend, with longitudinal spacing and distance from the bank equal to 0.1 B. The DR model, simulating double-row trees along the river bank contained two rows of cylindrical rods with longitudinal spacing and lateral distance equal to 0.5 B and 0.1 B, respectively.
The bed was covered with an 80 mm thick layer of sediment particles, and the surface of the bed was leveled at the beginning of each test, while the longitudinal bed slope at the beginning of the tests was 0.002. A uniformly graded sediment with a median diameter of d50 = 0.8 mm, uniformity coefficient of Cu = 1.96 and angle of repose of φ = 27.5° was used in the experiments. Measurements of bed topography were made after the bed reached semi-equilibrium conditions. The equilibrium conditions were defined as the situation where the bed elevation did not change after a period of an hour, checked by some rulers installed on the flume wall. The experiments were carried out under clear water conditions. It means that there was no movement of sediment particles in the straight reaches of the flume. The duration of the experimental tests was in the range of 7–13.5 h, according to the variations of the bed surface elevation. At the end of each experiment, the flow was stopped and the flume was drained slowly. Precautions were used to minimize the effect of draining on bed topography. Then the bed topography was measured using a sandy surface meter with a resolution of ±0.5 mm. The sandy surface meter was installed on a carriage which allowed measurement of the bed elevation in longitudinal and transverse directions. A grid of 2 cm × 2 cm including 430 measurement points of bed elevation was recorded, giving an appropriate resolution of the bed topography throughout the test section. To assess the performance of the trees, three cases (with and without cylindrical rods) were studied. The first case was done under non-vegetated conditions. The second and third cases included single row (SR) and double rows (DR) of vegetation, and the distance between the adjacent trees are shown in Figure 2. The bed topography was measured after each test and then the bed profiles of the three cases described above were compared.
To determine the turbulence characteristics of the flow in the bend, three dimensional (3D) flow velocities were measured using a down-looking acoustic Doppler velocity meter (Micro-ADV 16 MHz) with a sampling rate of 50 Hz and duration of 120 s. A 3D coordinate system was defined, which consisted of s, t and z axes, representing the streamwise, transverse and vertical directions, respectively (see Figure 1). The 3D velocity components (u, v and w) were measured at five cross-sections, C1–C5, each consisting of 12 locations laterally across the flume, with 5–8 vertical profile points collected at each of these locations. The lowest velocity measurement point was kept 0.5 mm above the erodible bed to avoid the bed disturbance by the ADV probe. The precision of the collected data, including 3D velocities, was tested by values of correlation (COR) and the signal-to-noise ratio (SNR) being larger than 70% and 15 dB, respectively. The values of the bed shear stress were computed by direct measurement of near-bed Reynolds shear stress using the velocity data. Also, the reach averaged shear velocity values were computed by U* = (gRS)0.5 where g is the acceleration due to gravity, R is the hydraulic radius and S is the bed slope.
3. Results and Discussion
3.1. Bed Topography
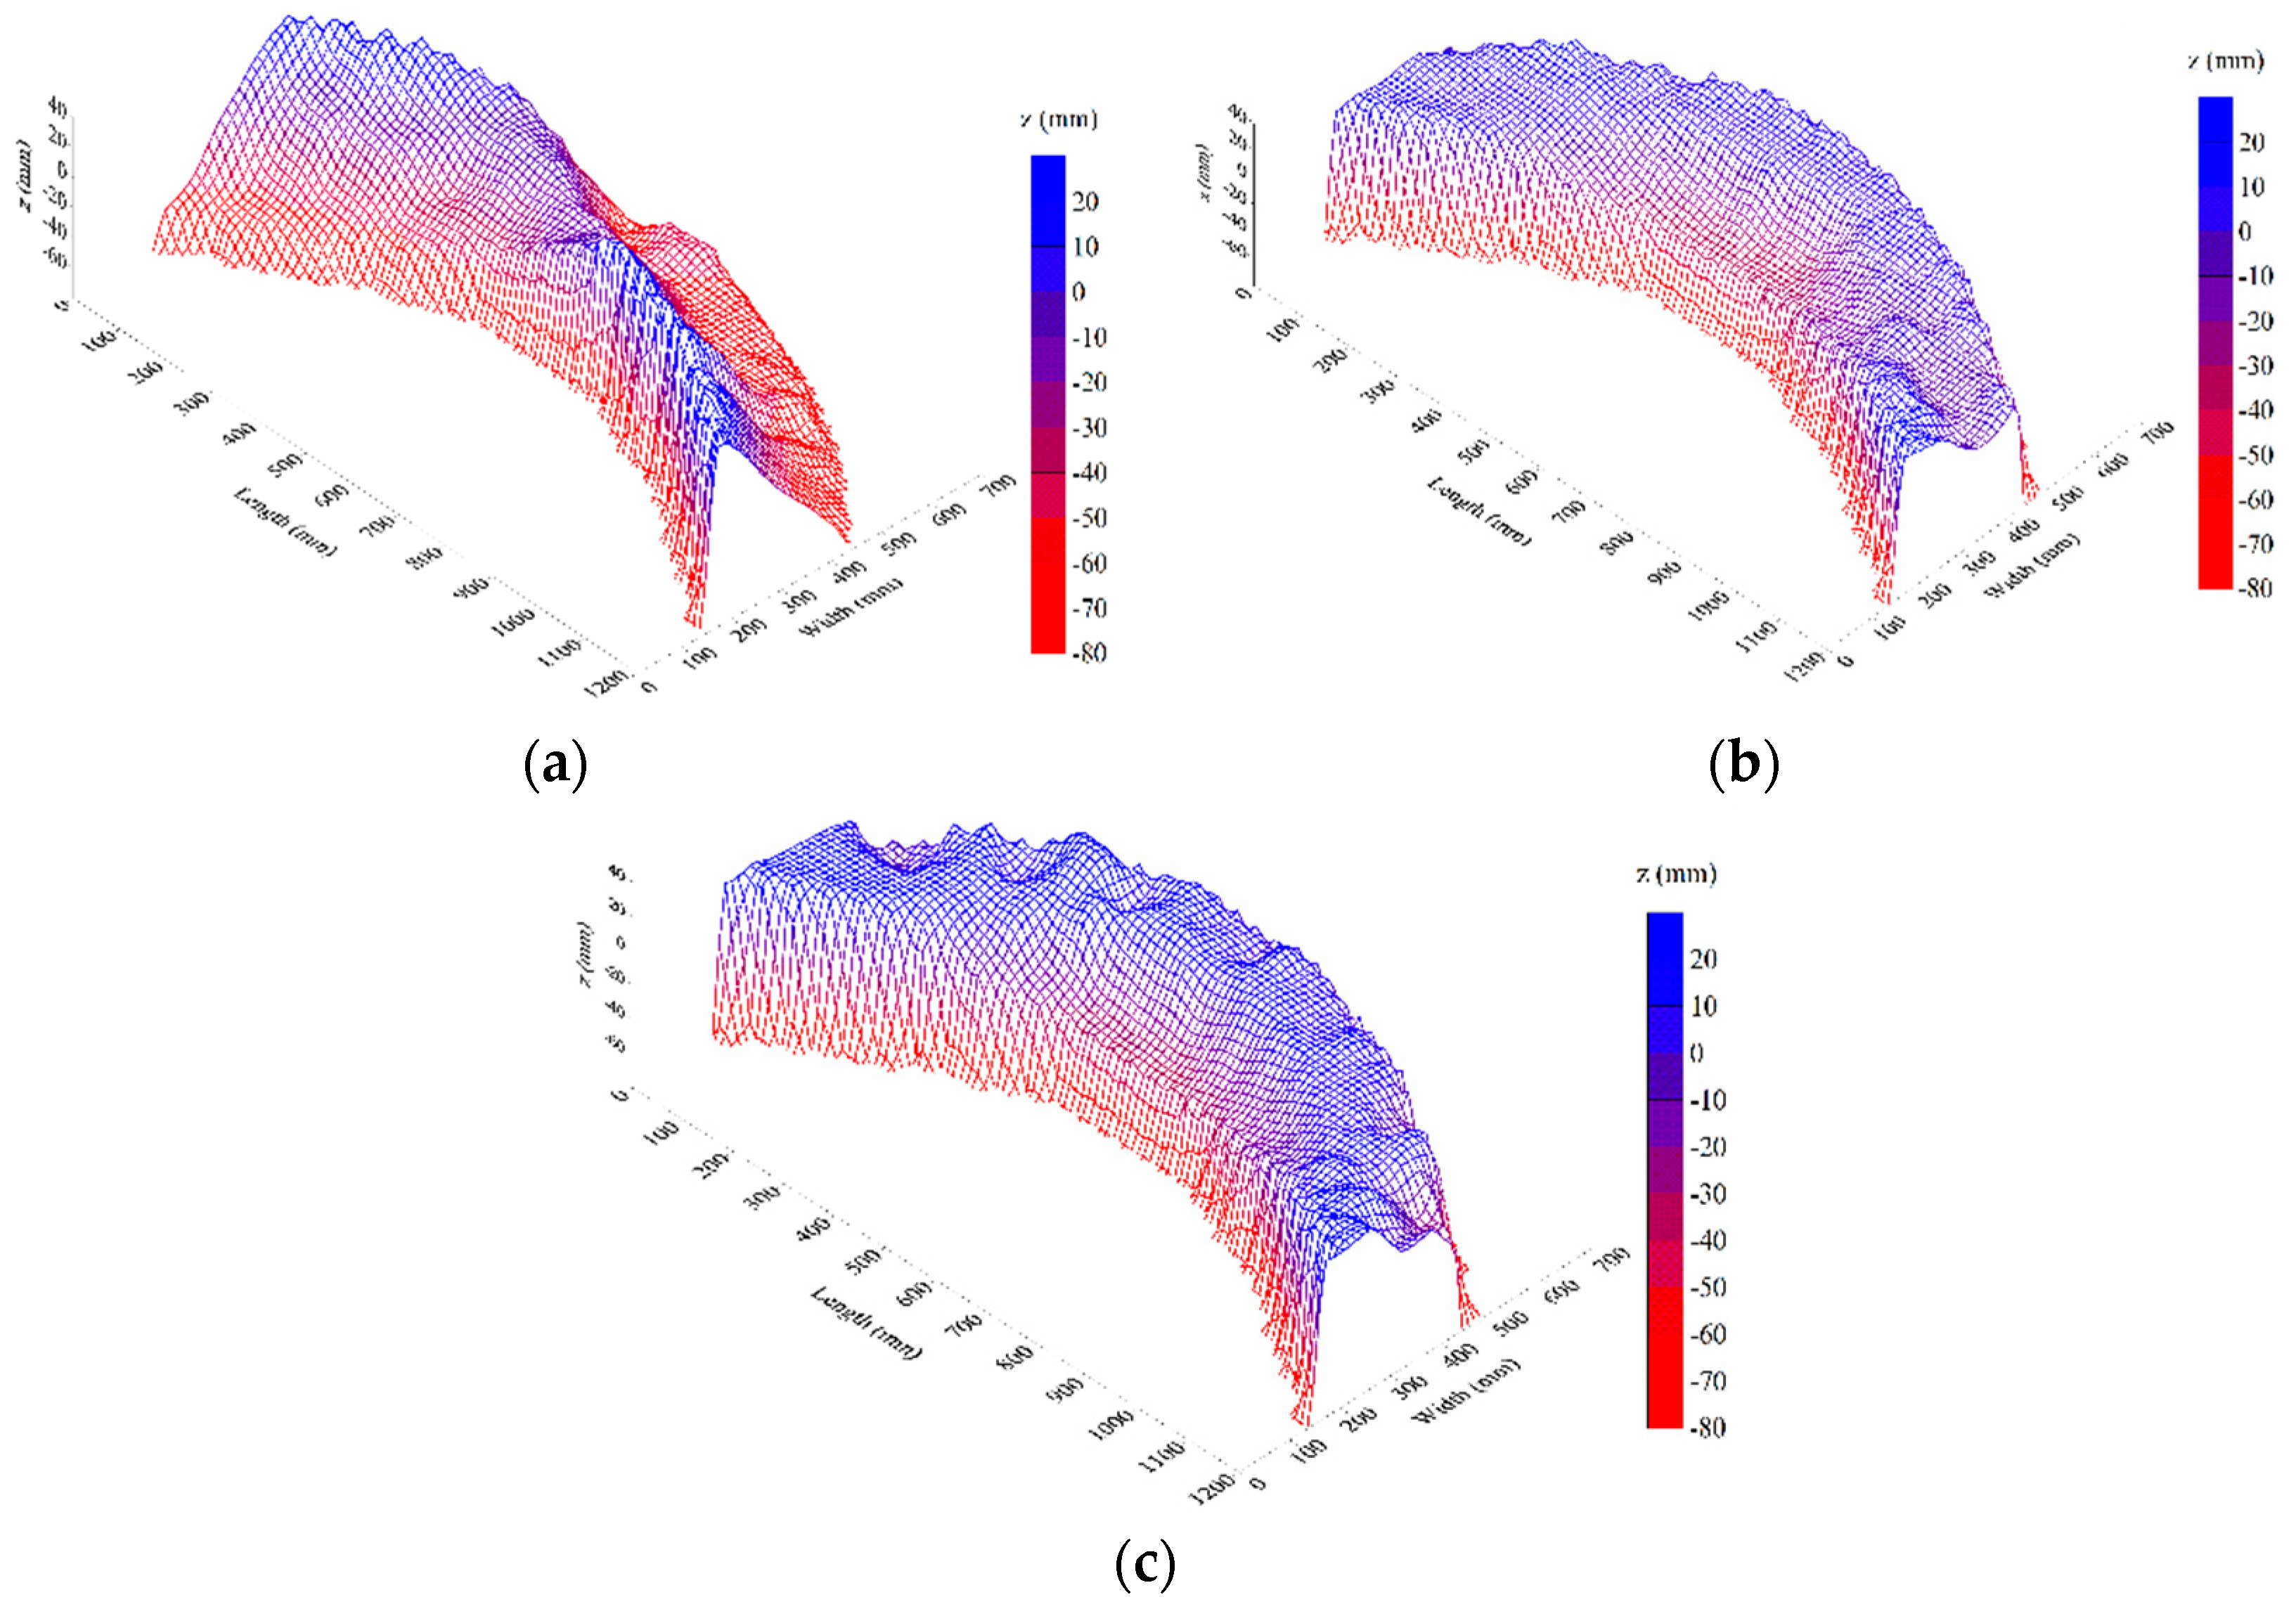
Three dimensional views of the deformed bed for the test without trees, as well as the tests with different arrangements of the trees, are shown in Figure 3. For the tests without cylindrical rods, the results indicated that erosion takes place close to the outer bank between cross-section C1 and the middle of the test section (cross-section C3), while deposition occurs adjacent to the inner bank from the center of the test section to cross-section C5 (Figure 3a). The above results are consistent with previous studies [22,53,54,55]. Regarding the pattern of eroded and deposited regions, the results are also consistent with the findings of da Silva [55] and da Silva and Yalin [53], who showed that at the inward bank of the rivers with ingoing meanders, the current accelerates from the entrance to the vertex, while it slows down from the vertex to the curve exit, as will be discussed in the next sections in this paper. However, for SR and DR models, maximum deposition occurred close to the outside bank in the center of the test section, i.e., the bend apex (Figure 3b) which may be related to the reduced turbulence due to the diverted flow by the rods. Thus, trees considerably affect the pattern of erosion and deposition along the bend.
Table 2 gives the percentage change of the volume (Vr) of the erosion hole as well as the maximum scour depth (Dr) within the test section to quantify the effect of the arrangement of the cylindrical rods on the scoured bed geometry under different flow discharges. Vr and Dr are defined as:
where Vi and Di are the volume and maximum depth of the eroded zone, respectively, throughout the test section for the tests without cylindrical rods, and Vf and Df represent the volume and maximum scour depth of the eroded zone, respectively, throughout the test section, after the installation of the cylindrical rods.
The results indicate that both SR and DR models lead to a considerable reduction in the size of the scoured bed. The volume of the scoured bed was reduced by up to 70.4% and 62.1% in Test 2 and Test 3, respectively, where these values were 36.6% and 11.8% for Test 5 and Test 6, respectively. The volume of the eroded zone does not change considerably by increasing the flow discharge from 15 to 20 L/s. Hence, it seems that the trees are more effective in protecting the bed from excessive erosion at higher flow discharges.
It is seen in Table 2 that for high flow rates, the cylindrical rods were very effective in reducing the maximum scour depth. While for Test 2 (SR model, Q = 10 L/s) the decrease in the maximum erosion depth was limited to 21.4%, it was increased to 49.8% and 47.0% for Test 5 (SR model, Q = 15 L/s) and Test 8 (SR model and Q = 20 L/s), respectively. For the DR model (Tests 3, 6 and 9), it is seen that the percentage decrease of the maximum scour depth increases with the flow discharge. Therefore, it seems that the SR model is most effective in decreasing the maximum scour depth for high discharges. However, these results also demonstrated that both configurations of the trees used in this study are effective in relieving bed erosion in sharp ingoing meander bends. The subsequent discussion relates to SR and DR models in comparison to the model without trees.
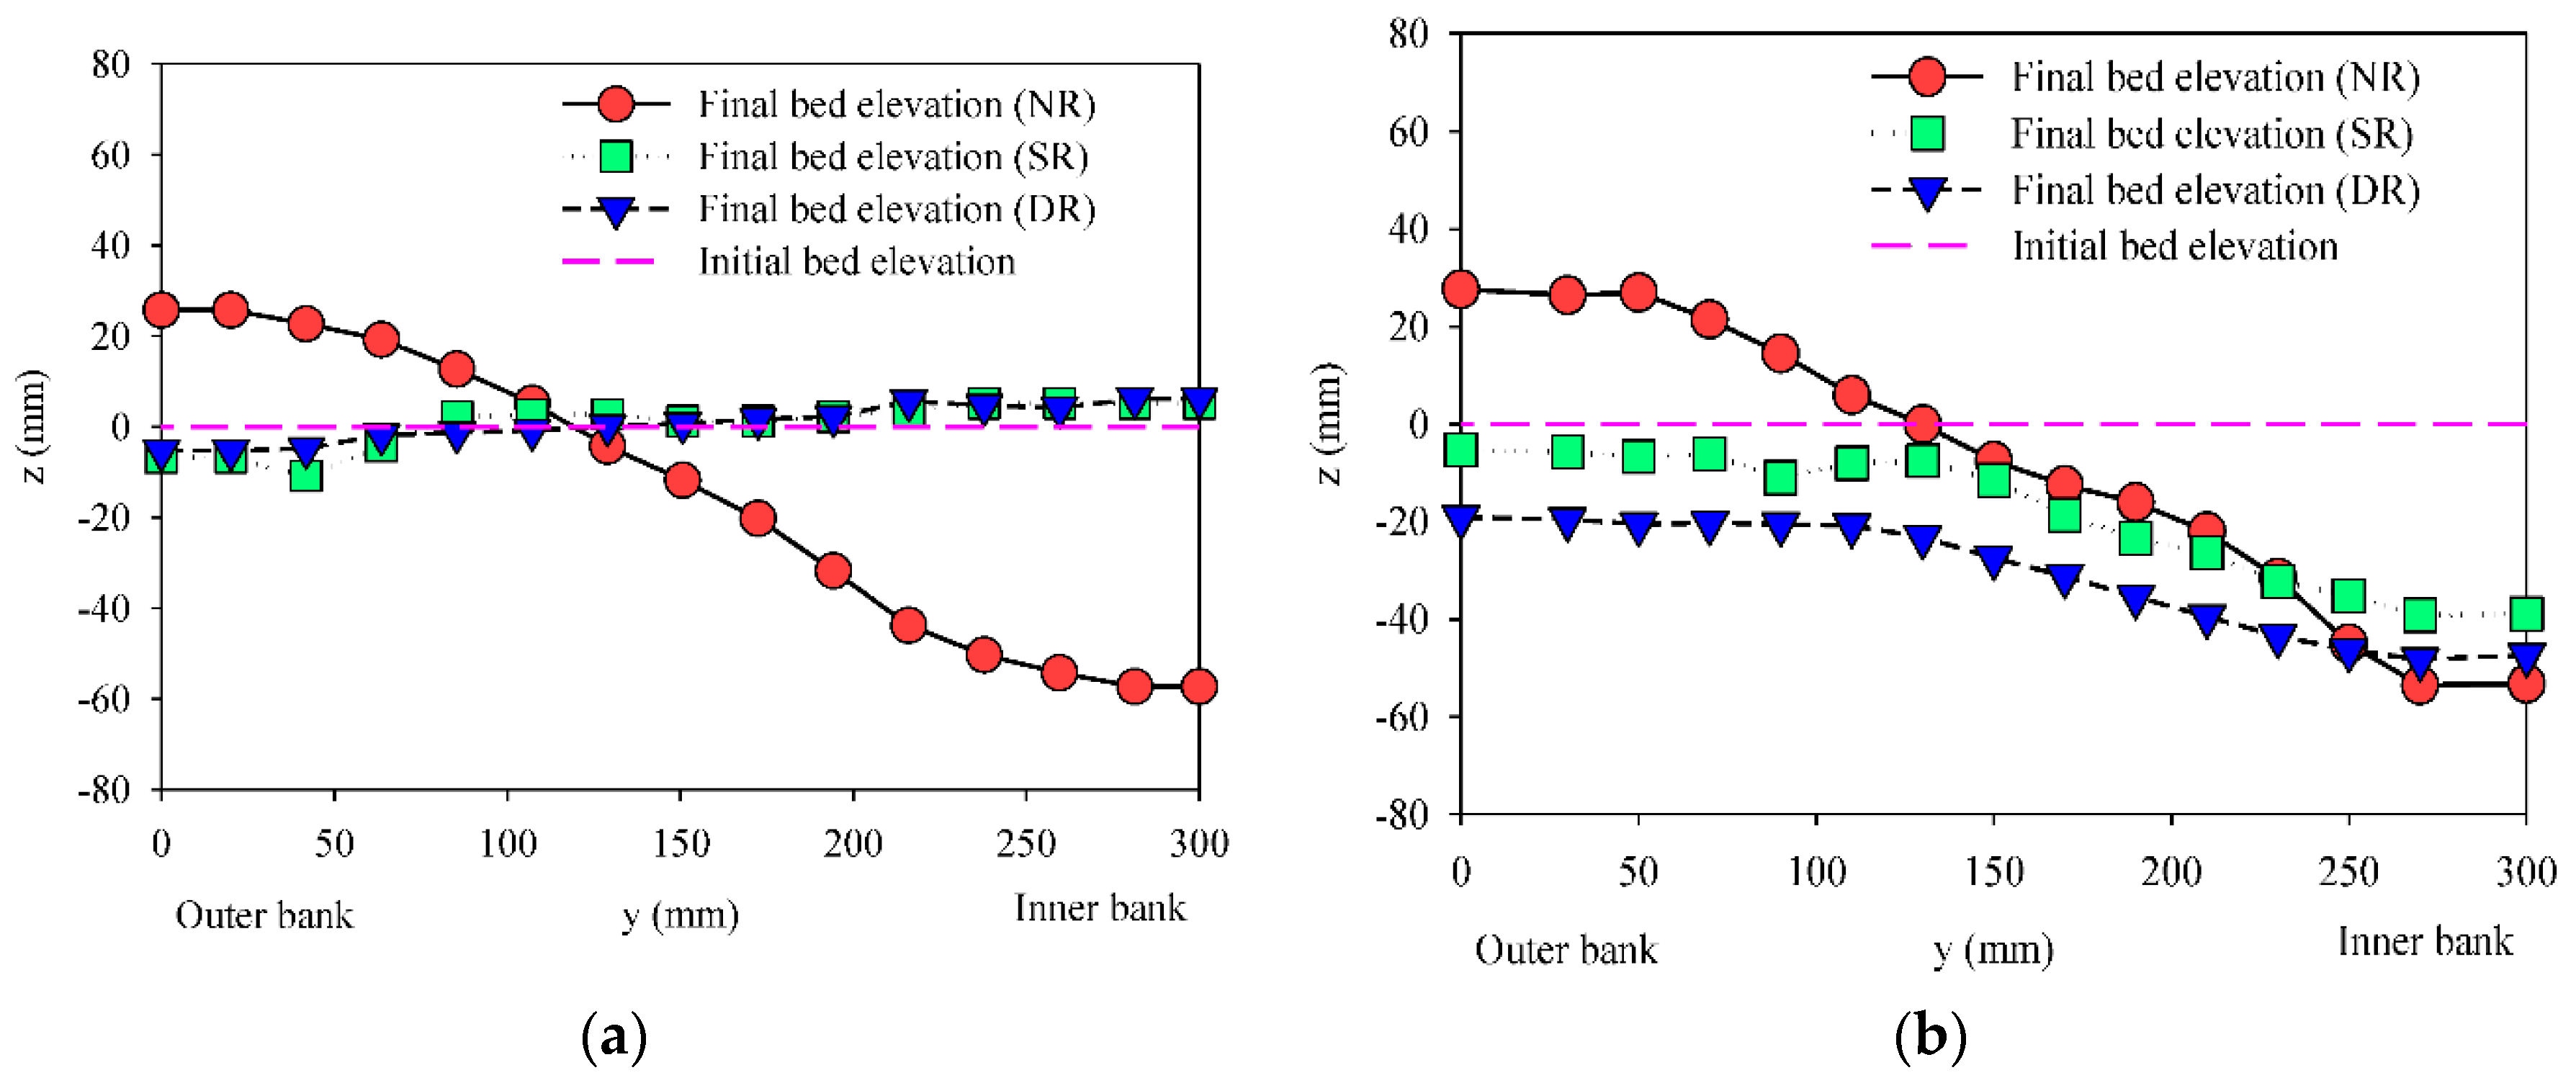
Figure 4a–c show the bed elevation and cross-sections of the channel bed at the entrance to the study reach (cross-section C1) for Q = 10, 15 and 20 L/s, respectively. Figure 4a indicates erosion at the inner bank and deposition at the outer bank for the test without trees. Conversely, the presence of the trees for both SR and DR models renders the bed reasonably flat across the section. It is of interest that the bed for both models is slightly deeper on the outside of the bend than in the model without trees, i.e., the rods have acted to ‘over-correct’ for the natural tendency for deposition on the outer bank at the entrance of the bends. By increasing the discharge, the maximum scour depth at section C1 increases for the tests without trees (Figure 4b,c). However, the situation at the inner bank is interesting, where no sediment deposition occurred for the tests with SR and DR models of the cylindrical rods.
Figure 5a–c shows the cross-section of the flume in the middle of the test section at cross-section C3 (at the apex of the bend) for Q = 10, 15 and 20 L/s, respectively. It is seen in Figure 5a that the bed is eroded at the outer bank. While the size of the scoured bed is reduced, the maximum scour depth does not reduce considerably after installing the cylindrical rods. However, as the flow discharge increases (Figure 5b,c), the role of the cylindrical rods on bed topography becomes more obvious. The presence of the cylindrical rods is shown to considerably reduce the maximum scour depth when compared to the case without cylindrical rods.
In the DR model and for the test with high flow rates (Figure 5c), a ridge is apparent in the middle of the cross-section which can be related to the strong secondary currents at the bend apex. Figure 5a–c suggests that, at most points, the bed elevation of the tests with the SR model is higher than the DR model. Hence, the SR model is preferred because the bed topography is less disturbed, in comparison to the initial bed topography in the middle of the experimental reach.
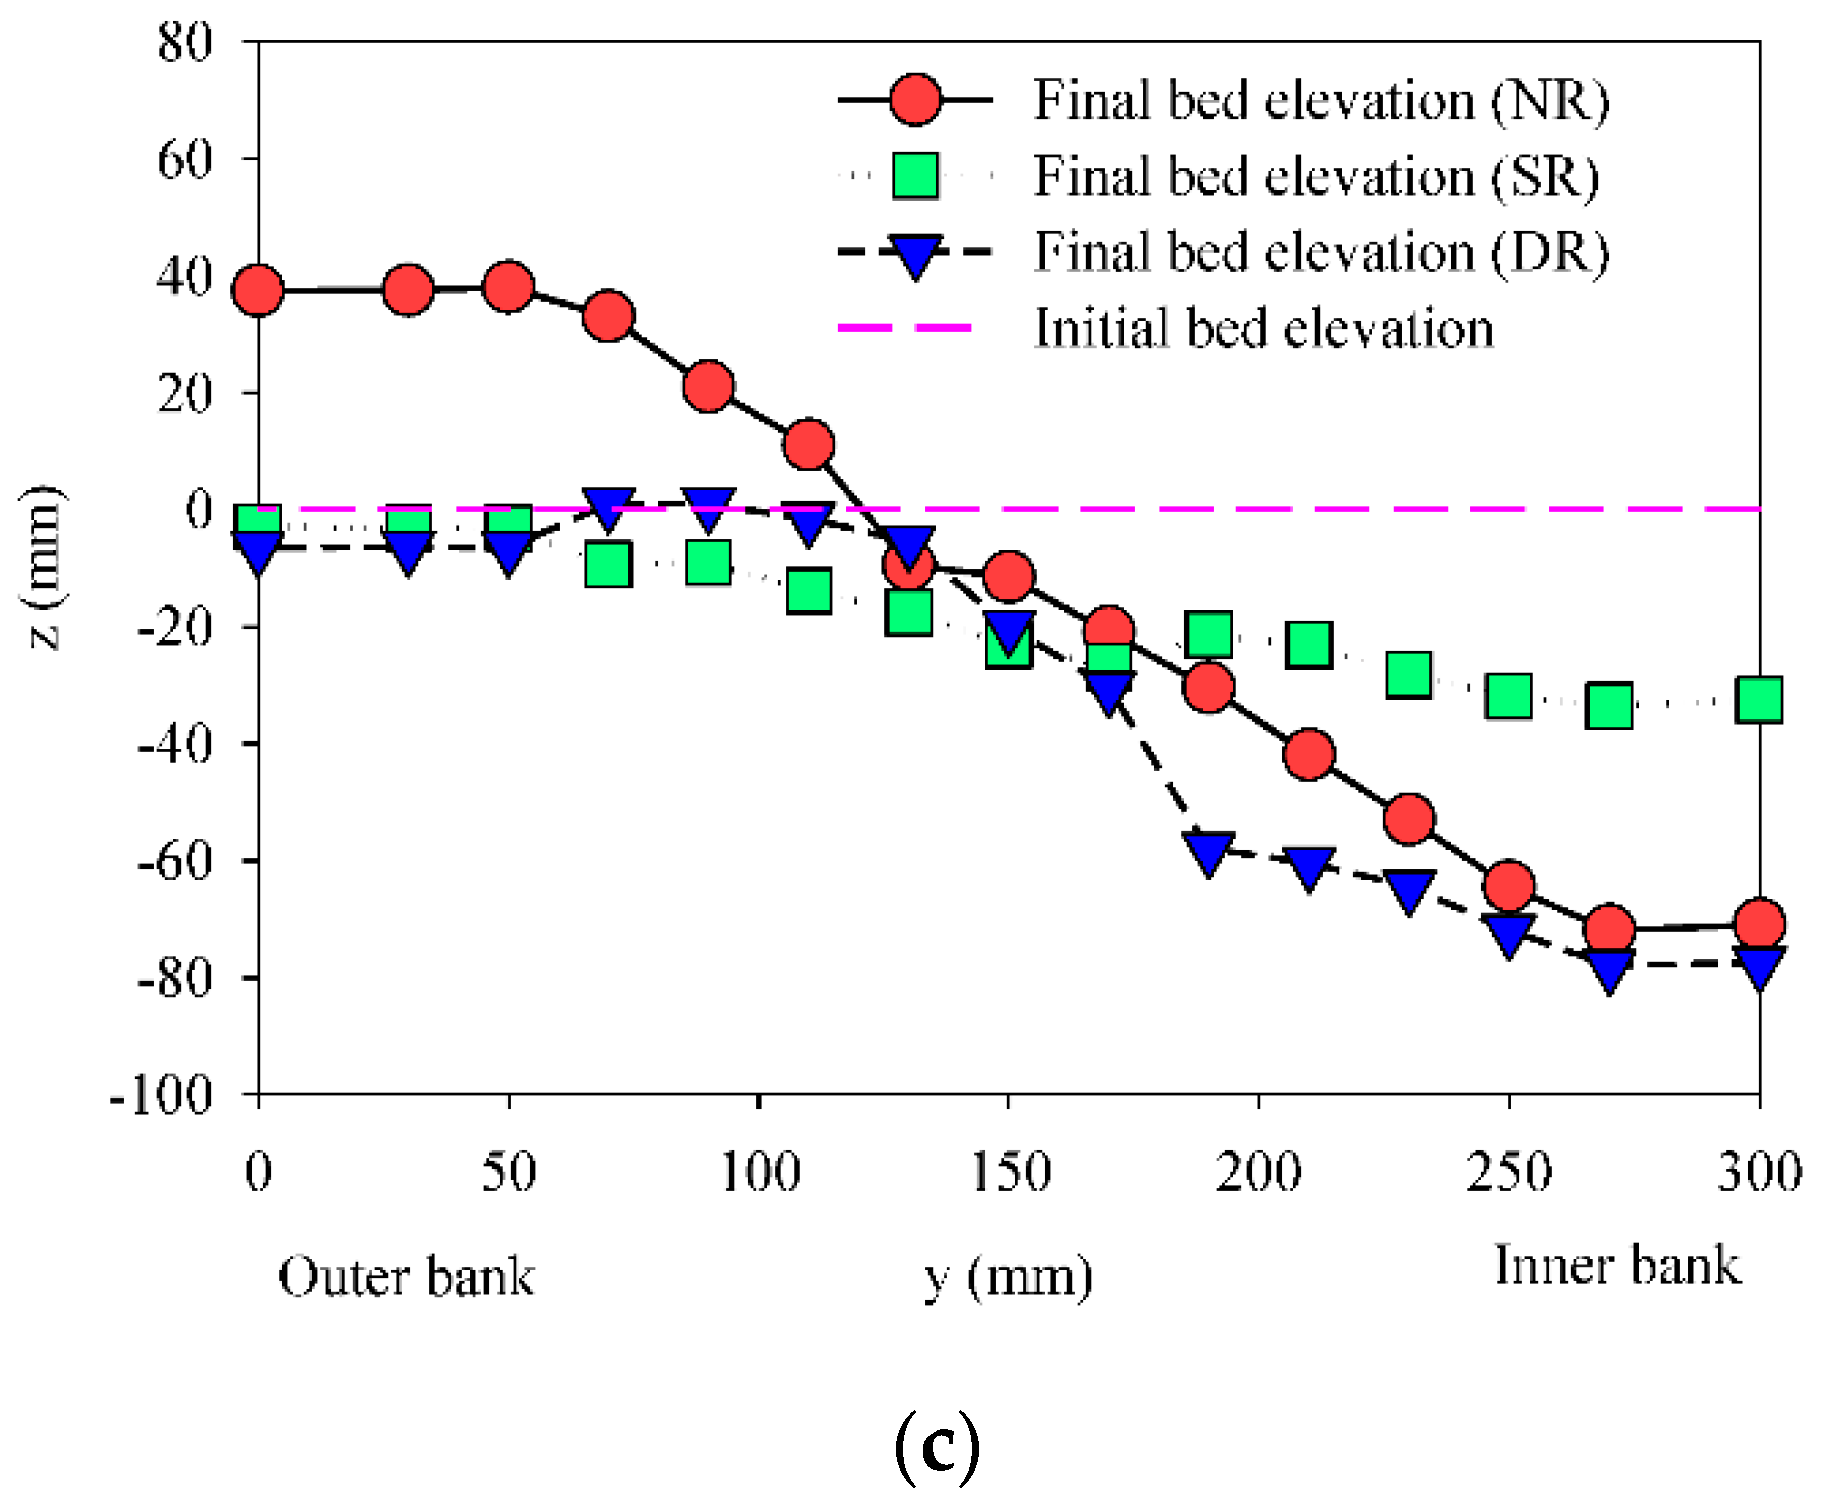
In Figure 6a–c, the bed topography for cross-section C5 is shown for the tests with and without cylindrical rods. Again, the cylindrical rods have acted to transform the bed cross-sectional shape, reducing both the steep lateral gradient of the bed and the deepest scour developed for the case without cylindrical rods. Comparing the bed levels for both SR and DR models, the DR model features a flatter bed surface at the exit of the bend, while the SR model leads to a lower maximum scour depth. Therefore, as a general conclusion, the SR model with one row of cylindrical rods, has advantages throughout the entire test section. Also, the cylindrical rods shift the thalweg from the outer bank toward the inner bank. This can increase the flow depth at the inner bank.
Figure 7 shows the longitudinal profile of the thalweg through the test section for the tests without cylindrical rods and for SR and DR models (Tests 1–3). It can be seen that cylindrical rods, installed along the outer bank of the bend, considerably reduce the scour depth at the thalweg. The longitudinal profile of the thalweg changed between the three tests as the rods influenced the flow field. It seems noteworthy to mention that the pool formed at the bend apex is more extended in the streamwise direction in Tests 2 and 3. This extension can be of significance for improving the instream habitat and stabilizing the river’s bed and banks for land and infrastructure protection. Also, a hydraulically low-velocity flow structure may be expected in this type of pool. Similarly, as the water depth reduces, flow velocity accelerates slightly and turbulence is moderate in relative comparison to high TKE observed in the bend apex for the non-vegetated conditions, as will be depicted later [56,57].
3.2. Near Bed Flow Characteristics
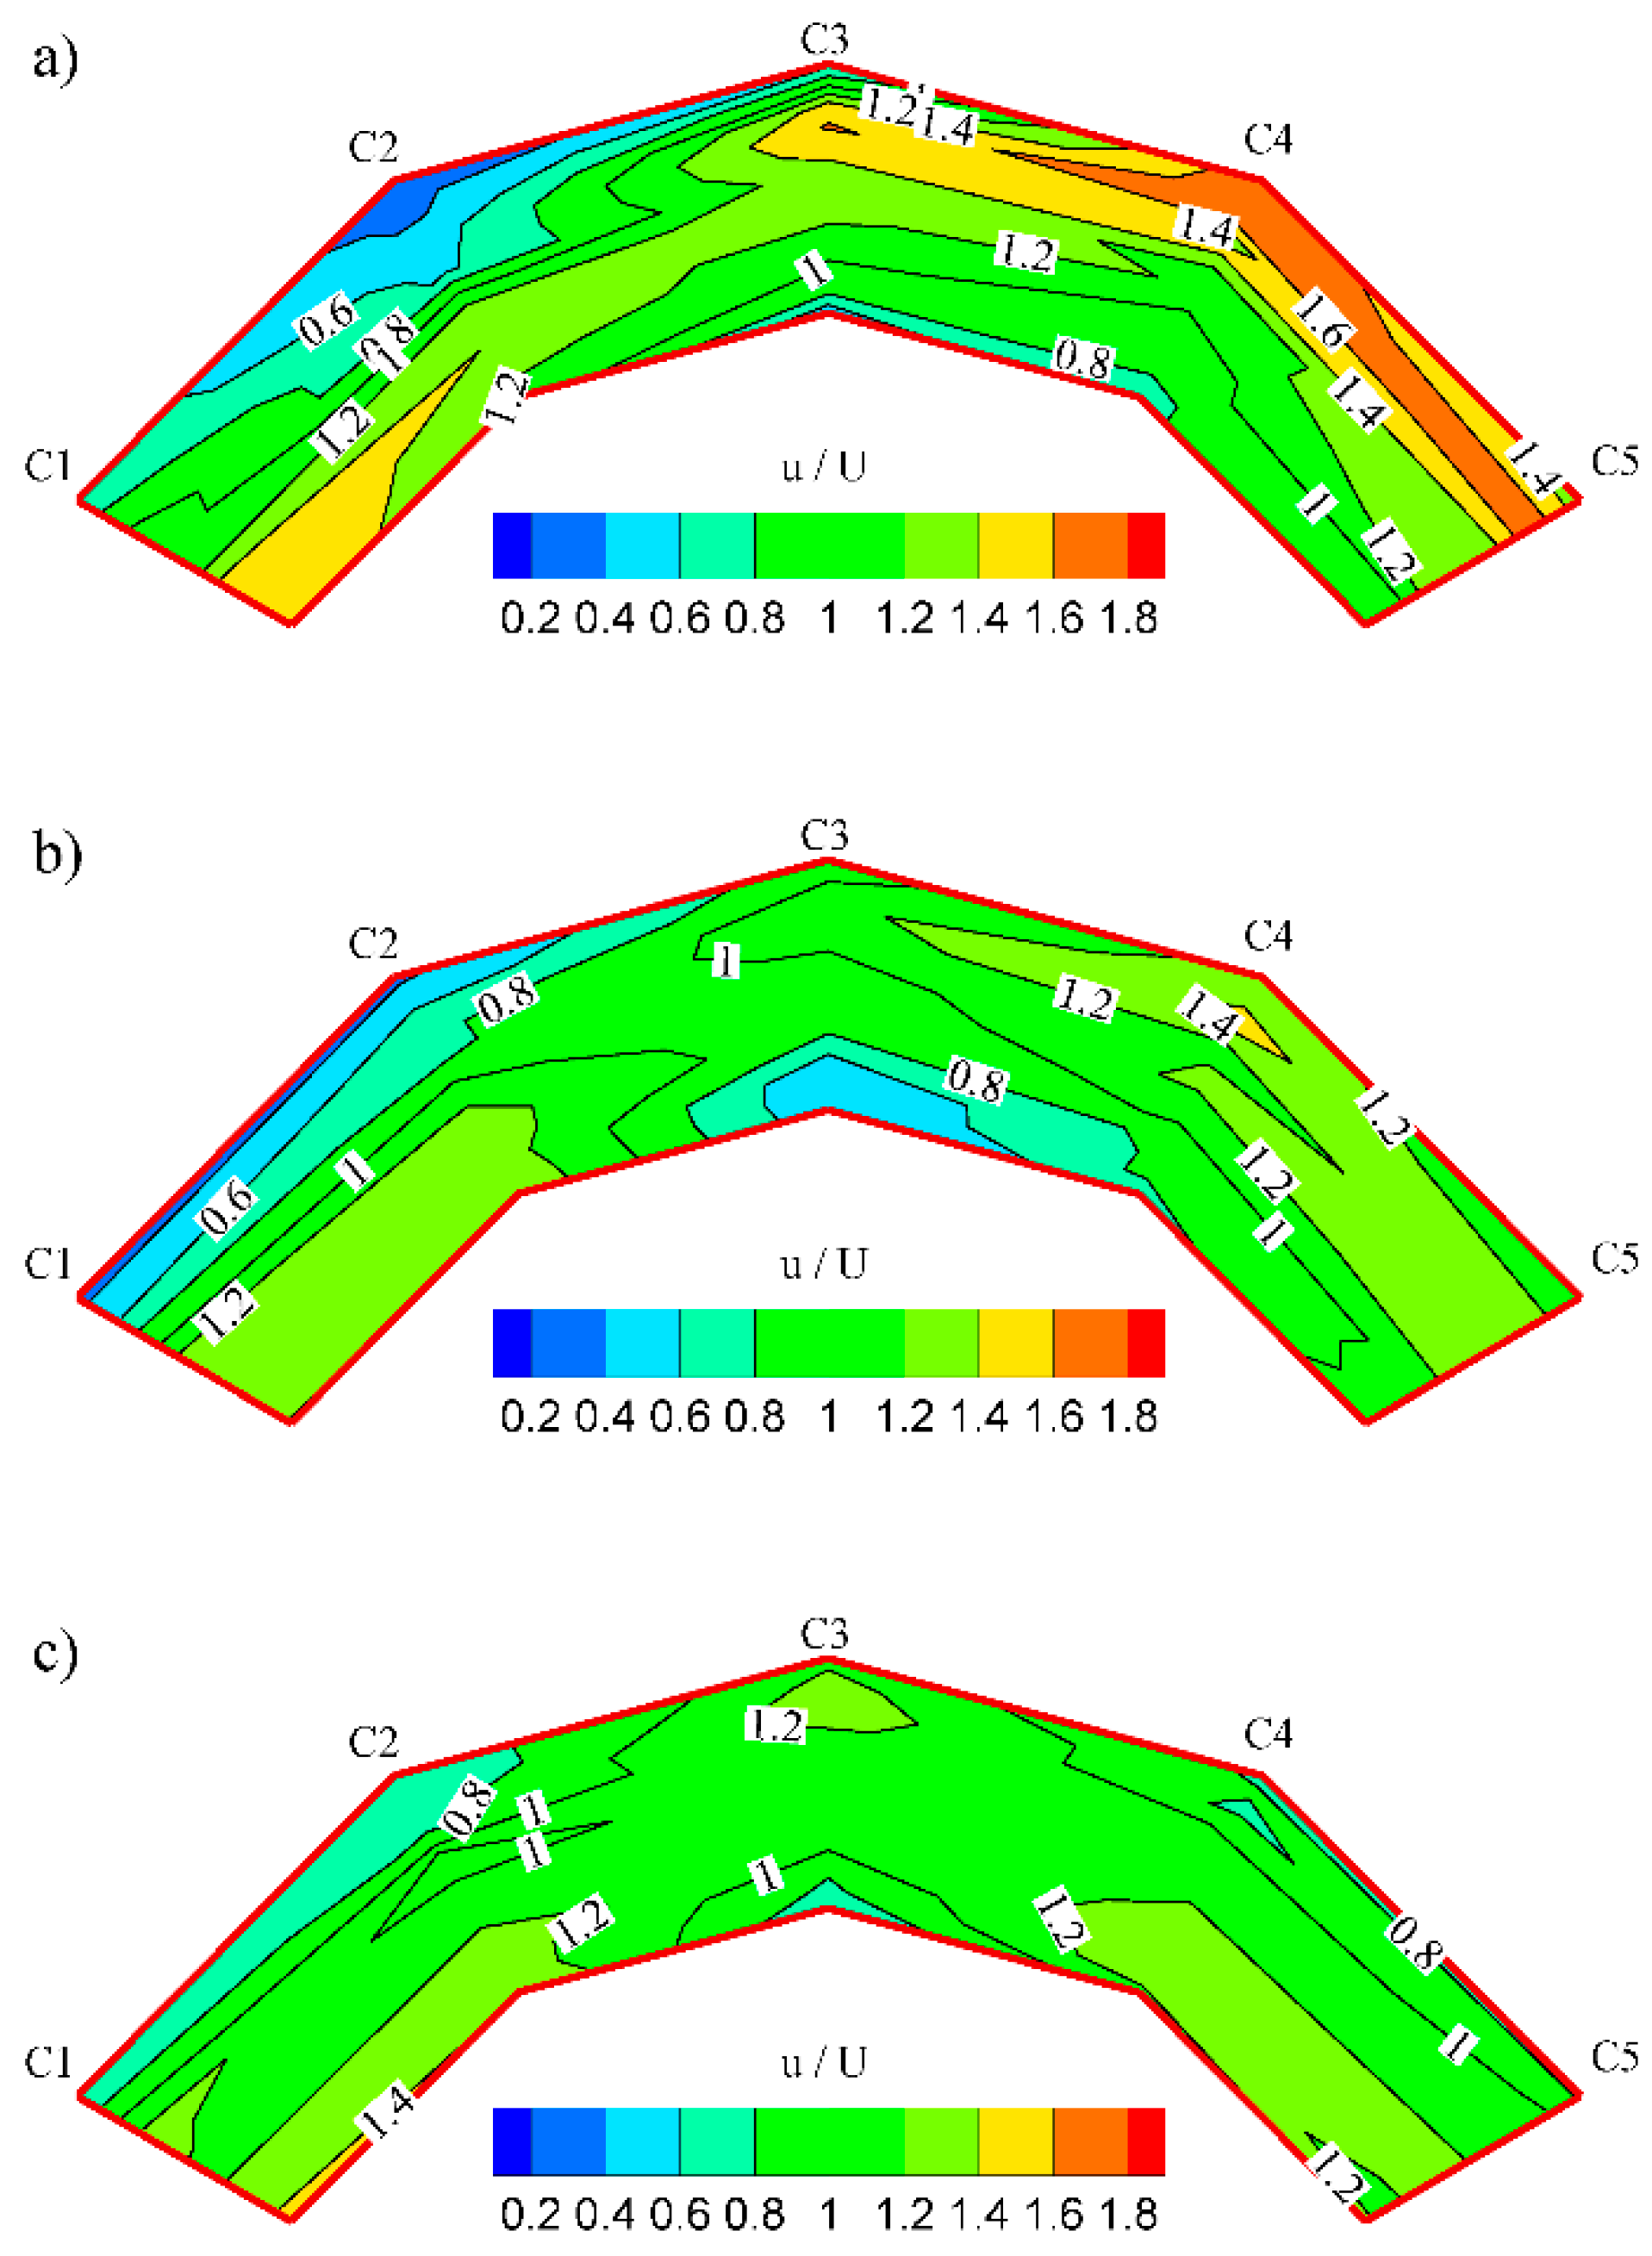
To find the effect of the cylindrical rods on the flow characteristics near the flume bed, instantaneous velocities were measured 5 mm above the bed. Figure 8a–c shows the normalized streamwise velocity (u/U) throughout the test section where U and u are the cross-sectional averaged and point velocities, respectively, for Tests 4, 5, and 6, i.e., Q = 15 L/s. The same results were observed for Tests 7, 8, and 9, i.e., Q = 20 L/s, which are not reported here for the sake of brevity. It is seen in Figure 8a that in the absence of the cylindrical rods, at the entrance to the flume bend, the maximum velocity occurs near the inside bank. While the centerline experiences the least velocity variation, the core of maximum velocity shifts toward the outer bank as the flow passes the curve vertex. However, between sections C4 and C5, the near-bed velocity is more or less stable for all of the tests, which is in good agreement with the findings of Giri et al. [29]. These results are also consistent with the typical spiral flow observed in channel bends [20].
It is observed in Figure 8b that the SR model of the cylindrical rods reduces the high velocities near the bed when compared to the case without cylindrical rods. Also, Figure 8b,c shows that both models of the cylindrical rods appeared to deflect the maximum velocity downstream of the bend apex to the internal bank, while the velocity is more uniformly distributed throughout the middle bend. Near-bed velocity distributions shown in Figure 8a–c are in good agreement with the established bed topography in Figure 4, Figure 5 and Figure 6. When the core of maximum velocity moves from the outer bank toward the centerline of the bend due to the existence of the cylindrical rods (Figure 8), the position of the thalweg experiences similar variations (Figure 4, Figure 5 and Figure 6). Comparing Figure 8b,c, it is seen that the SR model is more effective than the DR model in deflecting the core of maximum velocity from the outer bank. However, velocity in the downstream direction decreased in the area close to the bed for both protected and non-protected bed conditions. The results are in good agreement with the findings of Bywater-Reyes et al. [58] and Lightbody et al. [59], who reported that dense configurations of vegetation alter flow velocities to a significantly greater degree than sparse or no vegetation conditions.
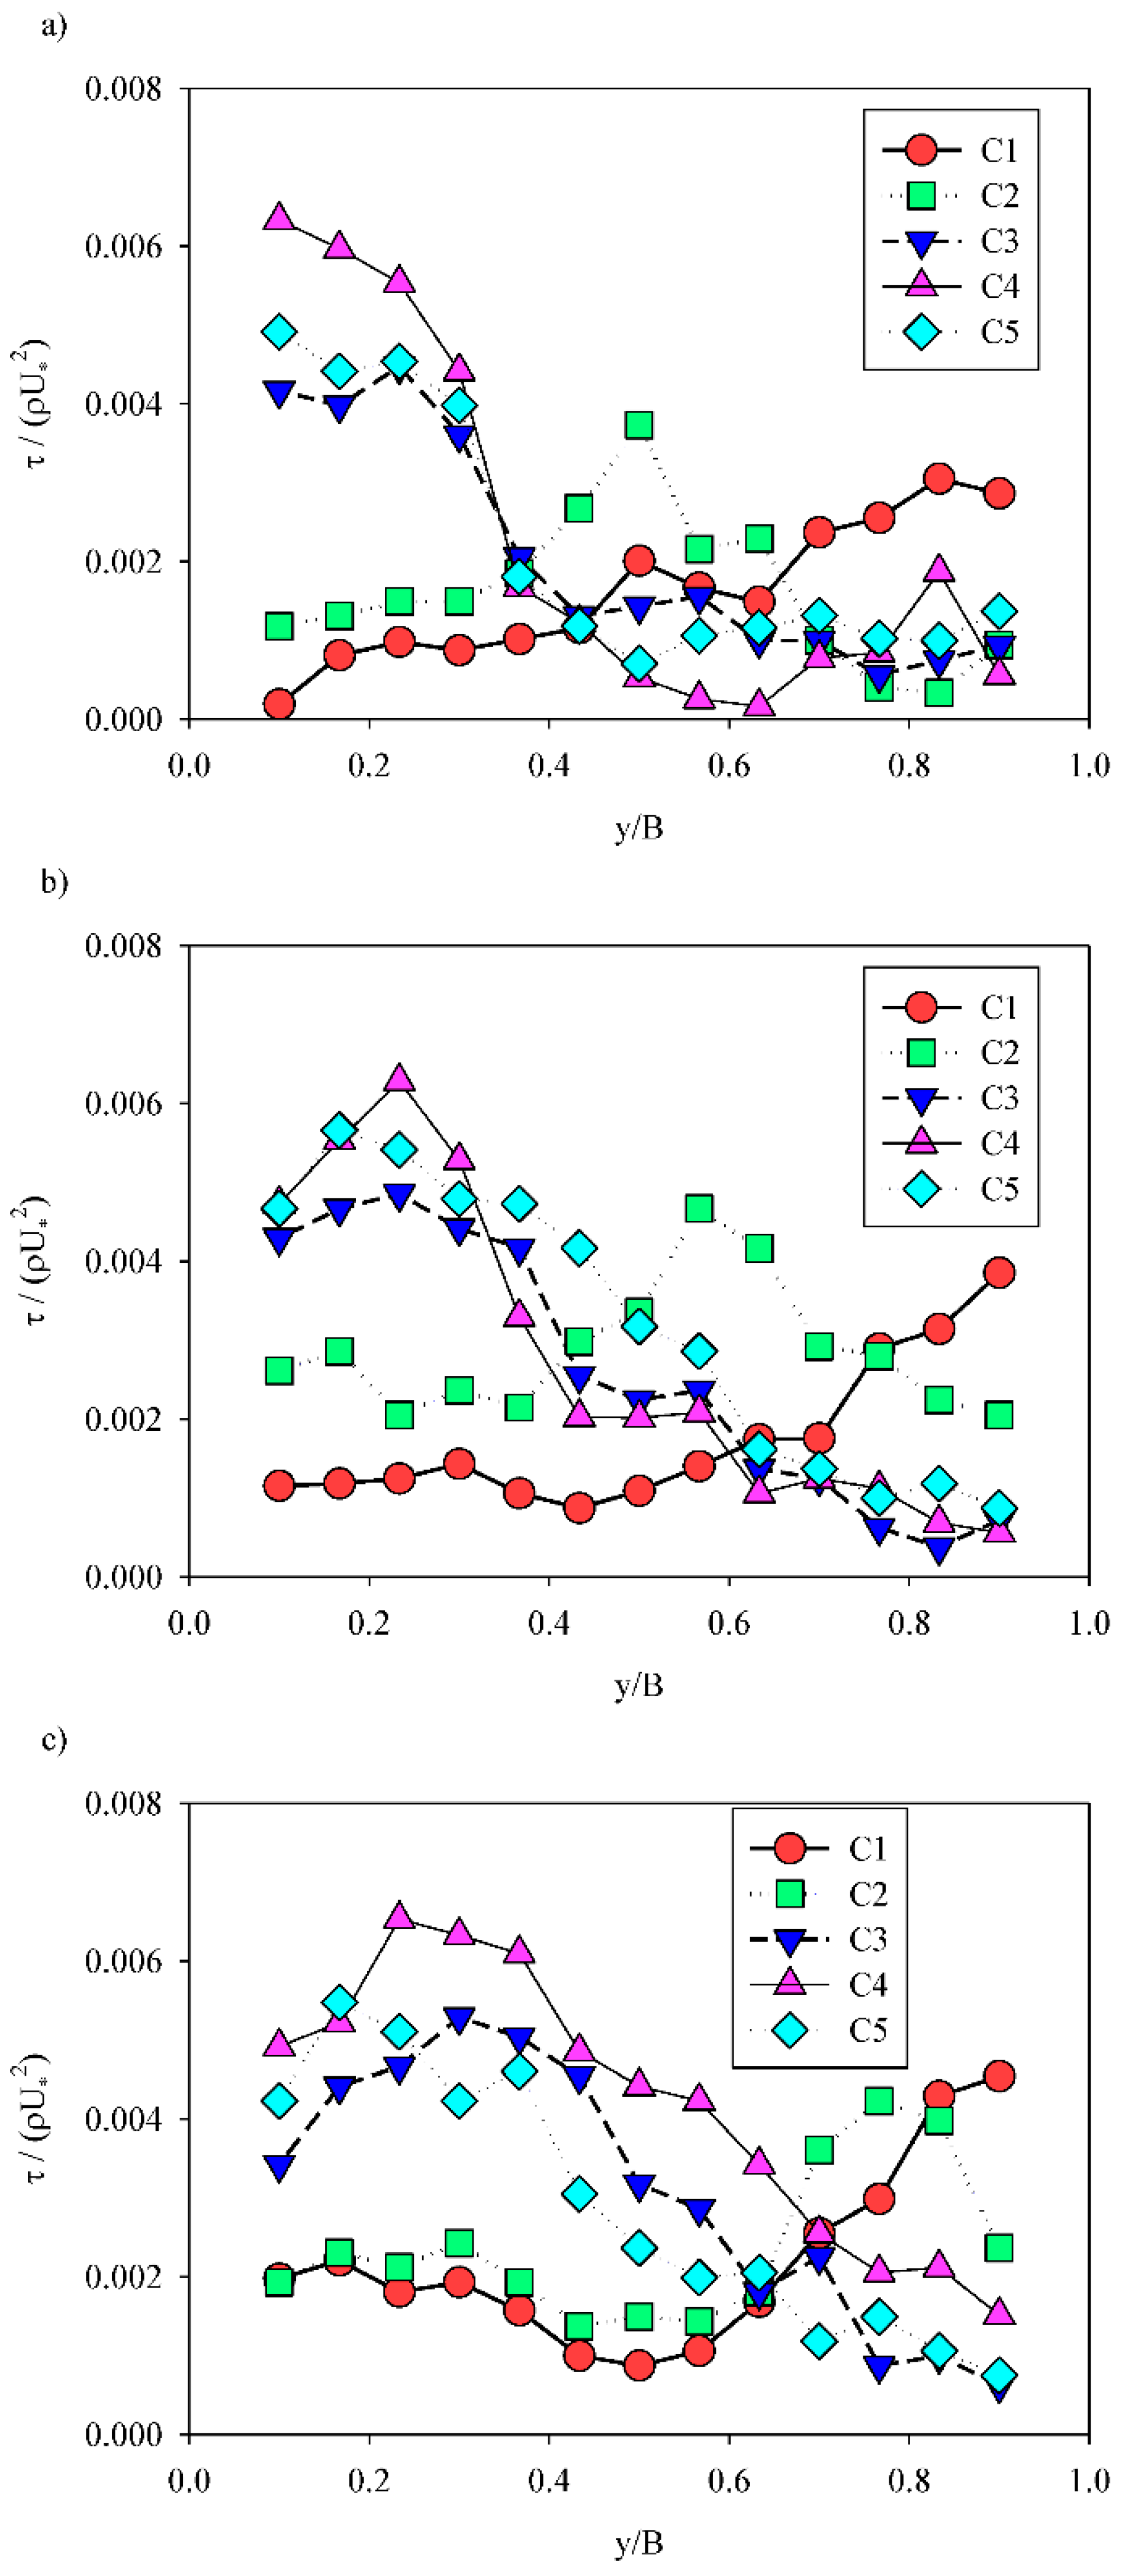
The normalized shear stress at the bed (τ/ρU*2) at cross-sections C1–C5 are illustrated in Figure 9a–c. As shown in Figure 9a, in the case of absence of the cylindrical rods, the bed shear stress increases monotonically from the outside bank toward the inside bank at the beginning of the test section (section C1). Moving downstream, the variations of the shear stress become non-uniform and the peak value is observed near the bend centerline. This may be attributed to the strong secondary circulation generated in the upstream bends [51].
From section C3 (bend apex) to section C5 (bend exit), variations of the bed shear stress across the bend is more or less the same. In sections C3–C5, the bed shear stress decreases uniformly from the outer bank toward the inner bank. In this region, the gradient of the lateral distribution of the bed shear stress is very high at the centerline of the bend. This high gradient may be attributed to the strong circulation cells which form in the bend cross-section [60]. The redistribution of velocity due to the implanted trees has been shown to bring an enhancement in appropriate natural territory for aquatic macroinvertebrates [61,62].
After installing the single row of the rods (SR model), the distribution of the normalized bed shear stress does not change considerably from the entrance to the bend apex (cross-section C1 to C3). However, from section C3 to section C5 (i.e., from apex to the bend exit), the peak values of τ/ρU*2 move from the outer bank toward the adjacent cylindrical rod. These high values of shear stress move bed particles in the lateral direction, affecting the production and conservation of the shape of bends. Therefore, τ/ρU*2 reduces at the outer bank due to the presence of the cylindrical rods, while a local increase in the normalized bed shear stress is observed next to the rods. The decreased shear stress at the outer bank can enhance the benthic density, as investigated by Blettler et al. [9].
Unlike the SR model, the distribution of the normalized bed shear stress for the DR model (Figure 9c) differs completely from the case without cylindrical rods (Figure 9a). It is seen in Figure 9c that τ/ρU*2 reduces from the outer bank toward the centerline of the bend and then increases toward the inner bank, except where it adjoins the bank in section C2. Also, the magnitude of τ/ρU*2 in section C1 increased at the outer bank due to the existence of the double rows of the rods, as compared to the SR model. From section C3 to section C5, the normalized bed shear stress follows a similar trend to that of the SR model, but the peak values of τ/ρU*2 move away from the outer bank. Also, both SR and DR models move high shear stresses away from the protected flume bank, which is in agreement with the findings of Hopkinson and Wynn-Thompson [63].
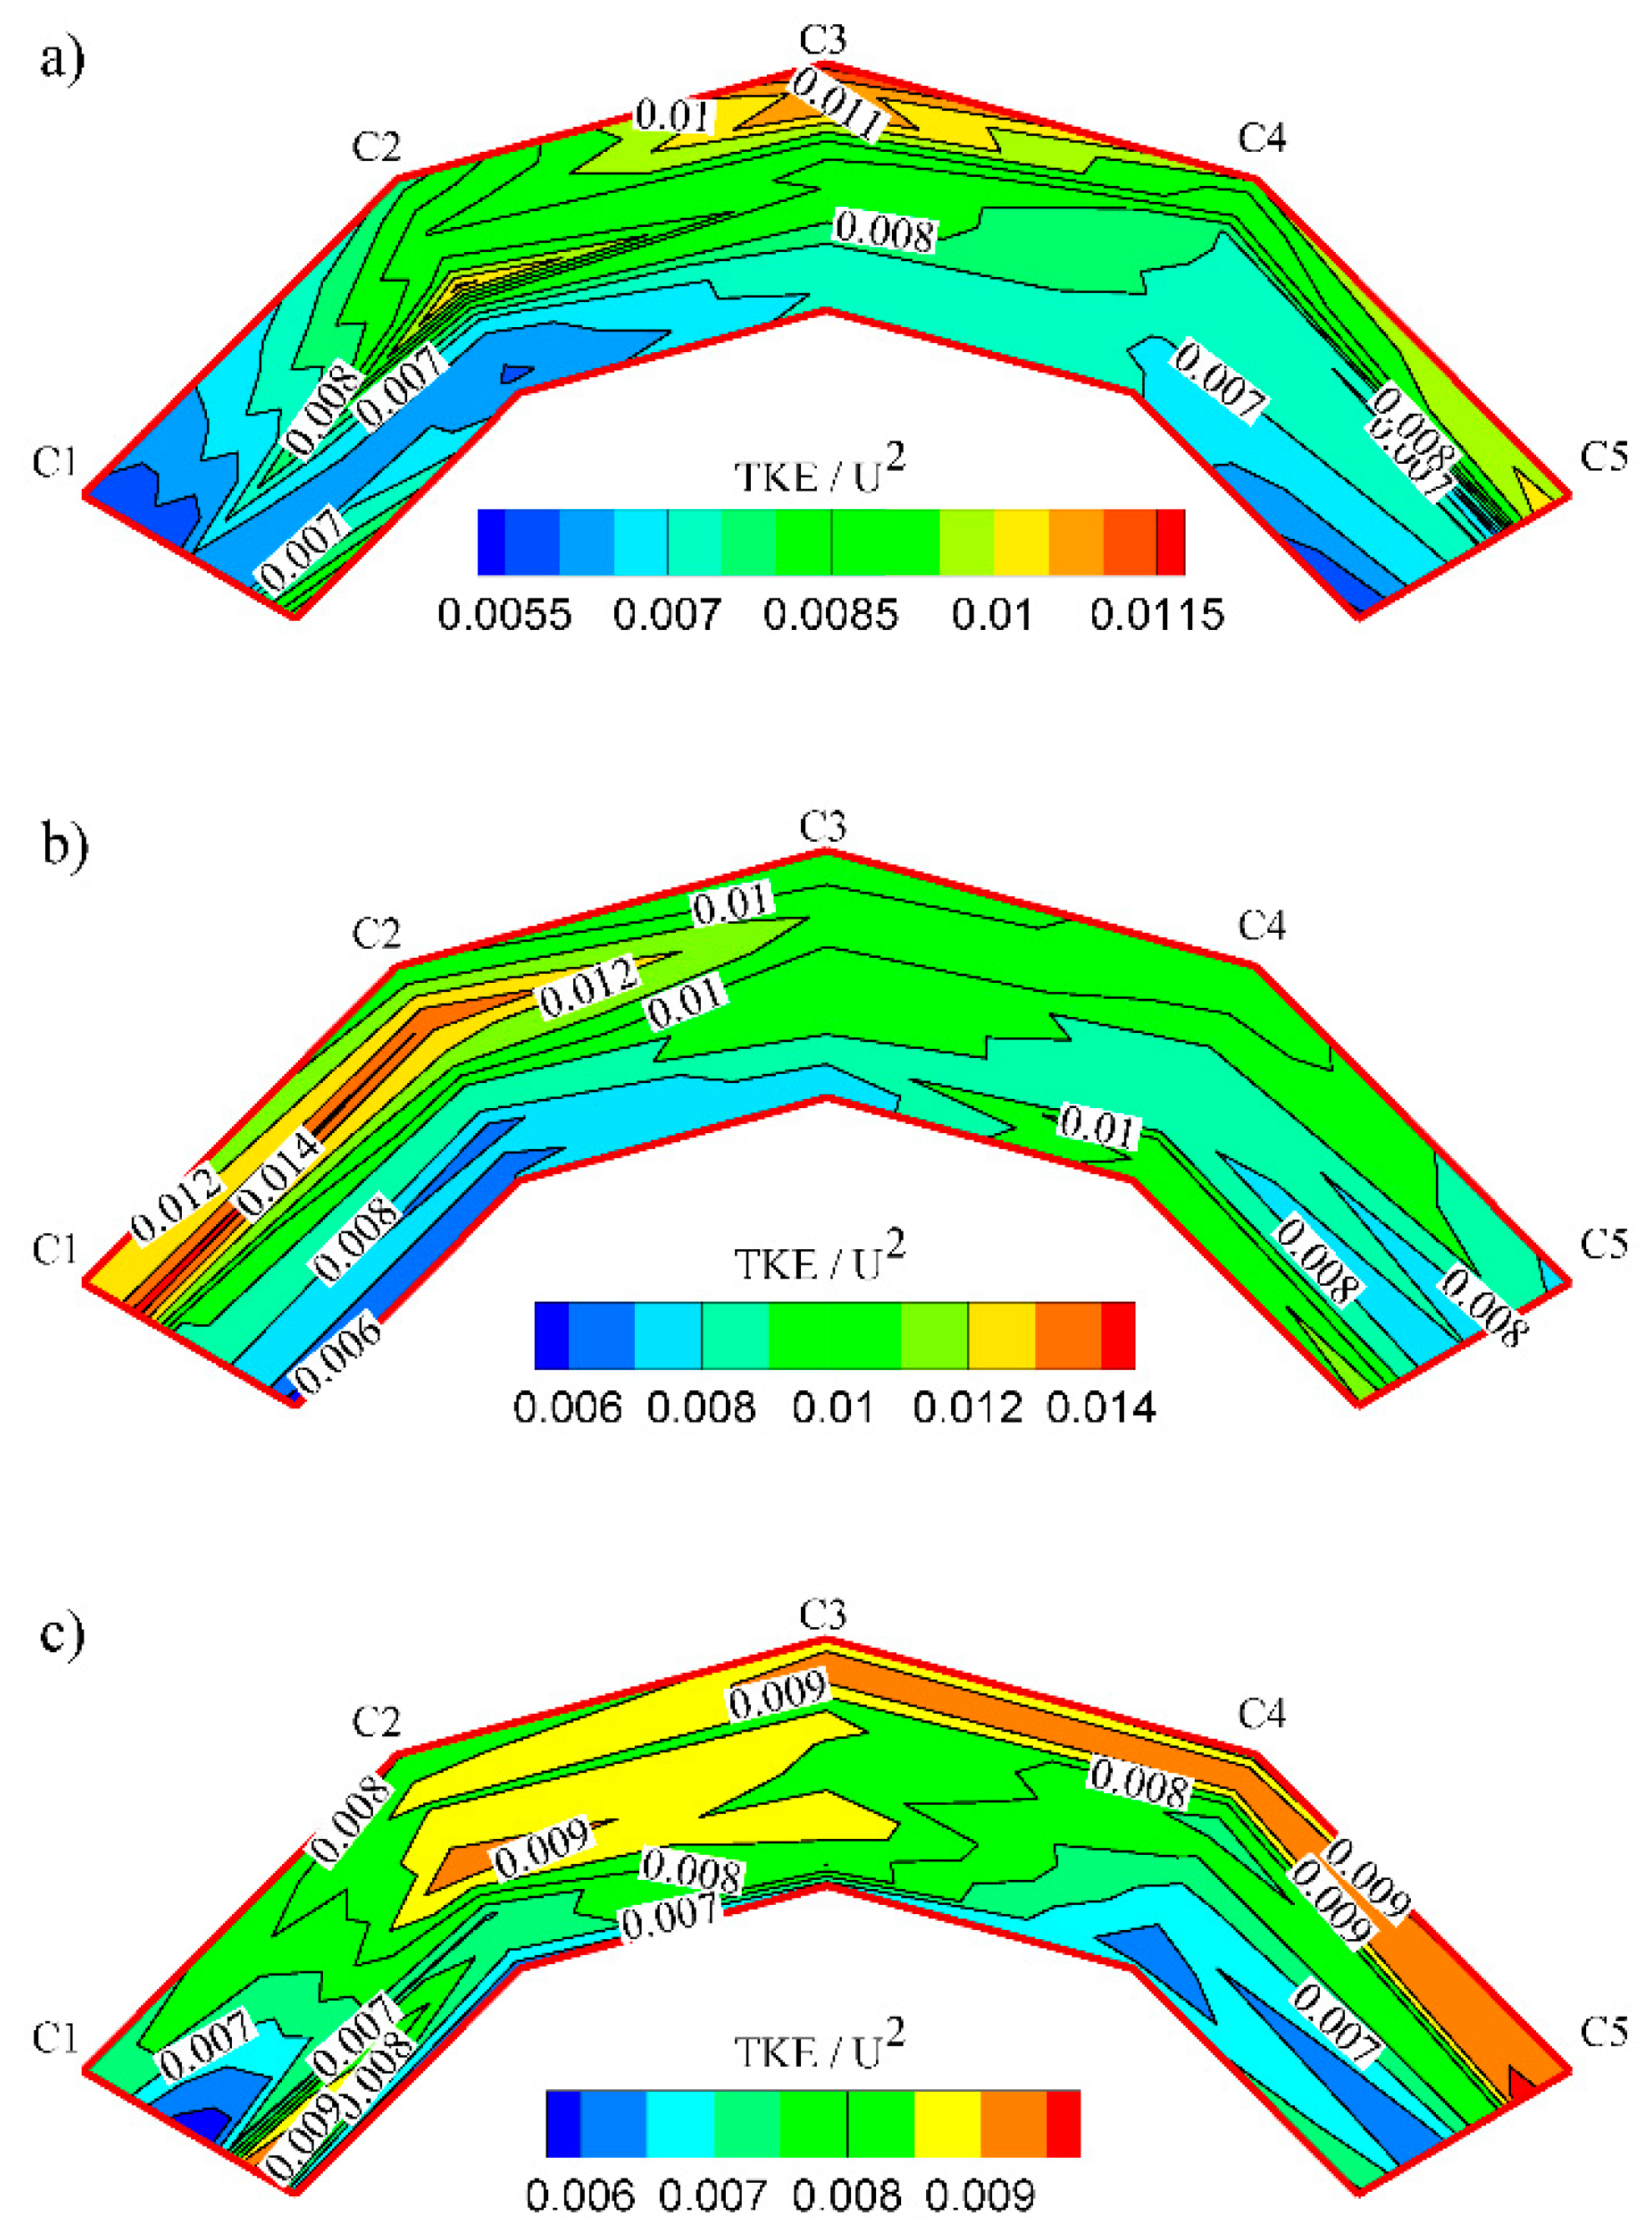
The turbulent kinetic energy (TKE), is defined as 0.5, where , and are deviations of the instantaneous velocity components from the time-averaged velocity (u, v and w) in streamwise, transverse and vertical directions, respectively. TKE is proved to relate to the boundary shear stress [63,64]. As shown in Figure 10a, high values of the normalized turbulent kinetic energy (TKE/U2) were measured within the erosion area (i.e., close to the outside bank from the vertex to the exit of the bend, as noted above). From Figure 10b,c it can be seen that the SR model of the cylindrical rods changed the variations of TKE/U2 through the bend. The zone of maximum values of TKE/U2 moved from the bend apex to adjacent of the cylindrical rods between sections C1 and C2. Both arrangements of the cylindrical rods have shown to reduce the turbulent kinetic energy at the outer bank. So, TKE weakens through the bend, especially near the outer bank, as the rods redistribute energy and momentum. The above results are in good agreement with the numerical study carried out by Sun et al. [18] and indicate that the cylindrical rods can protect the river banks as well as reduce the bed scour through the bend. It should be noted that a zone of higher TKE is introduced along the interface of the flow with the rods in the SR model between cross-sections C1 and C2, i.e., at the bend entrance. This zone can be attributed to the flow diversion due to the rods at the bend entrance and can be mitigated by continuing the row of implanted trees to some distance in the upstream bend.
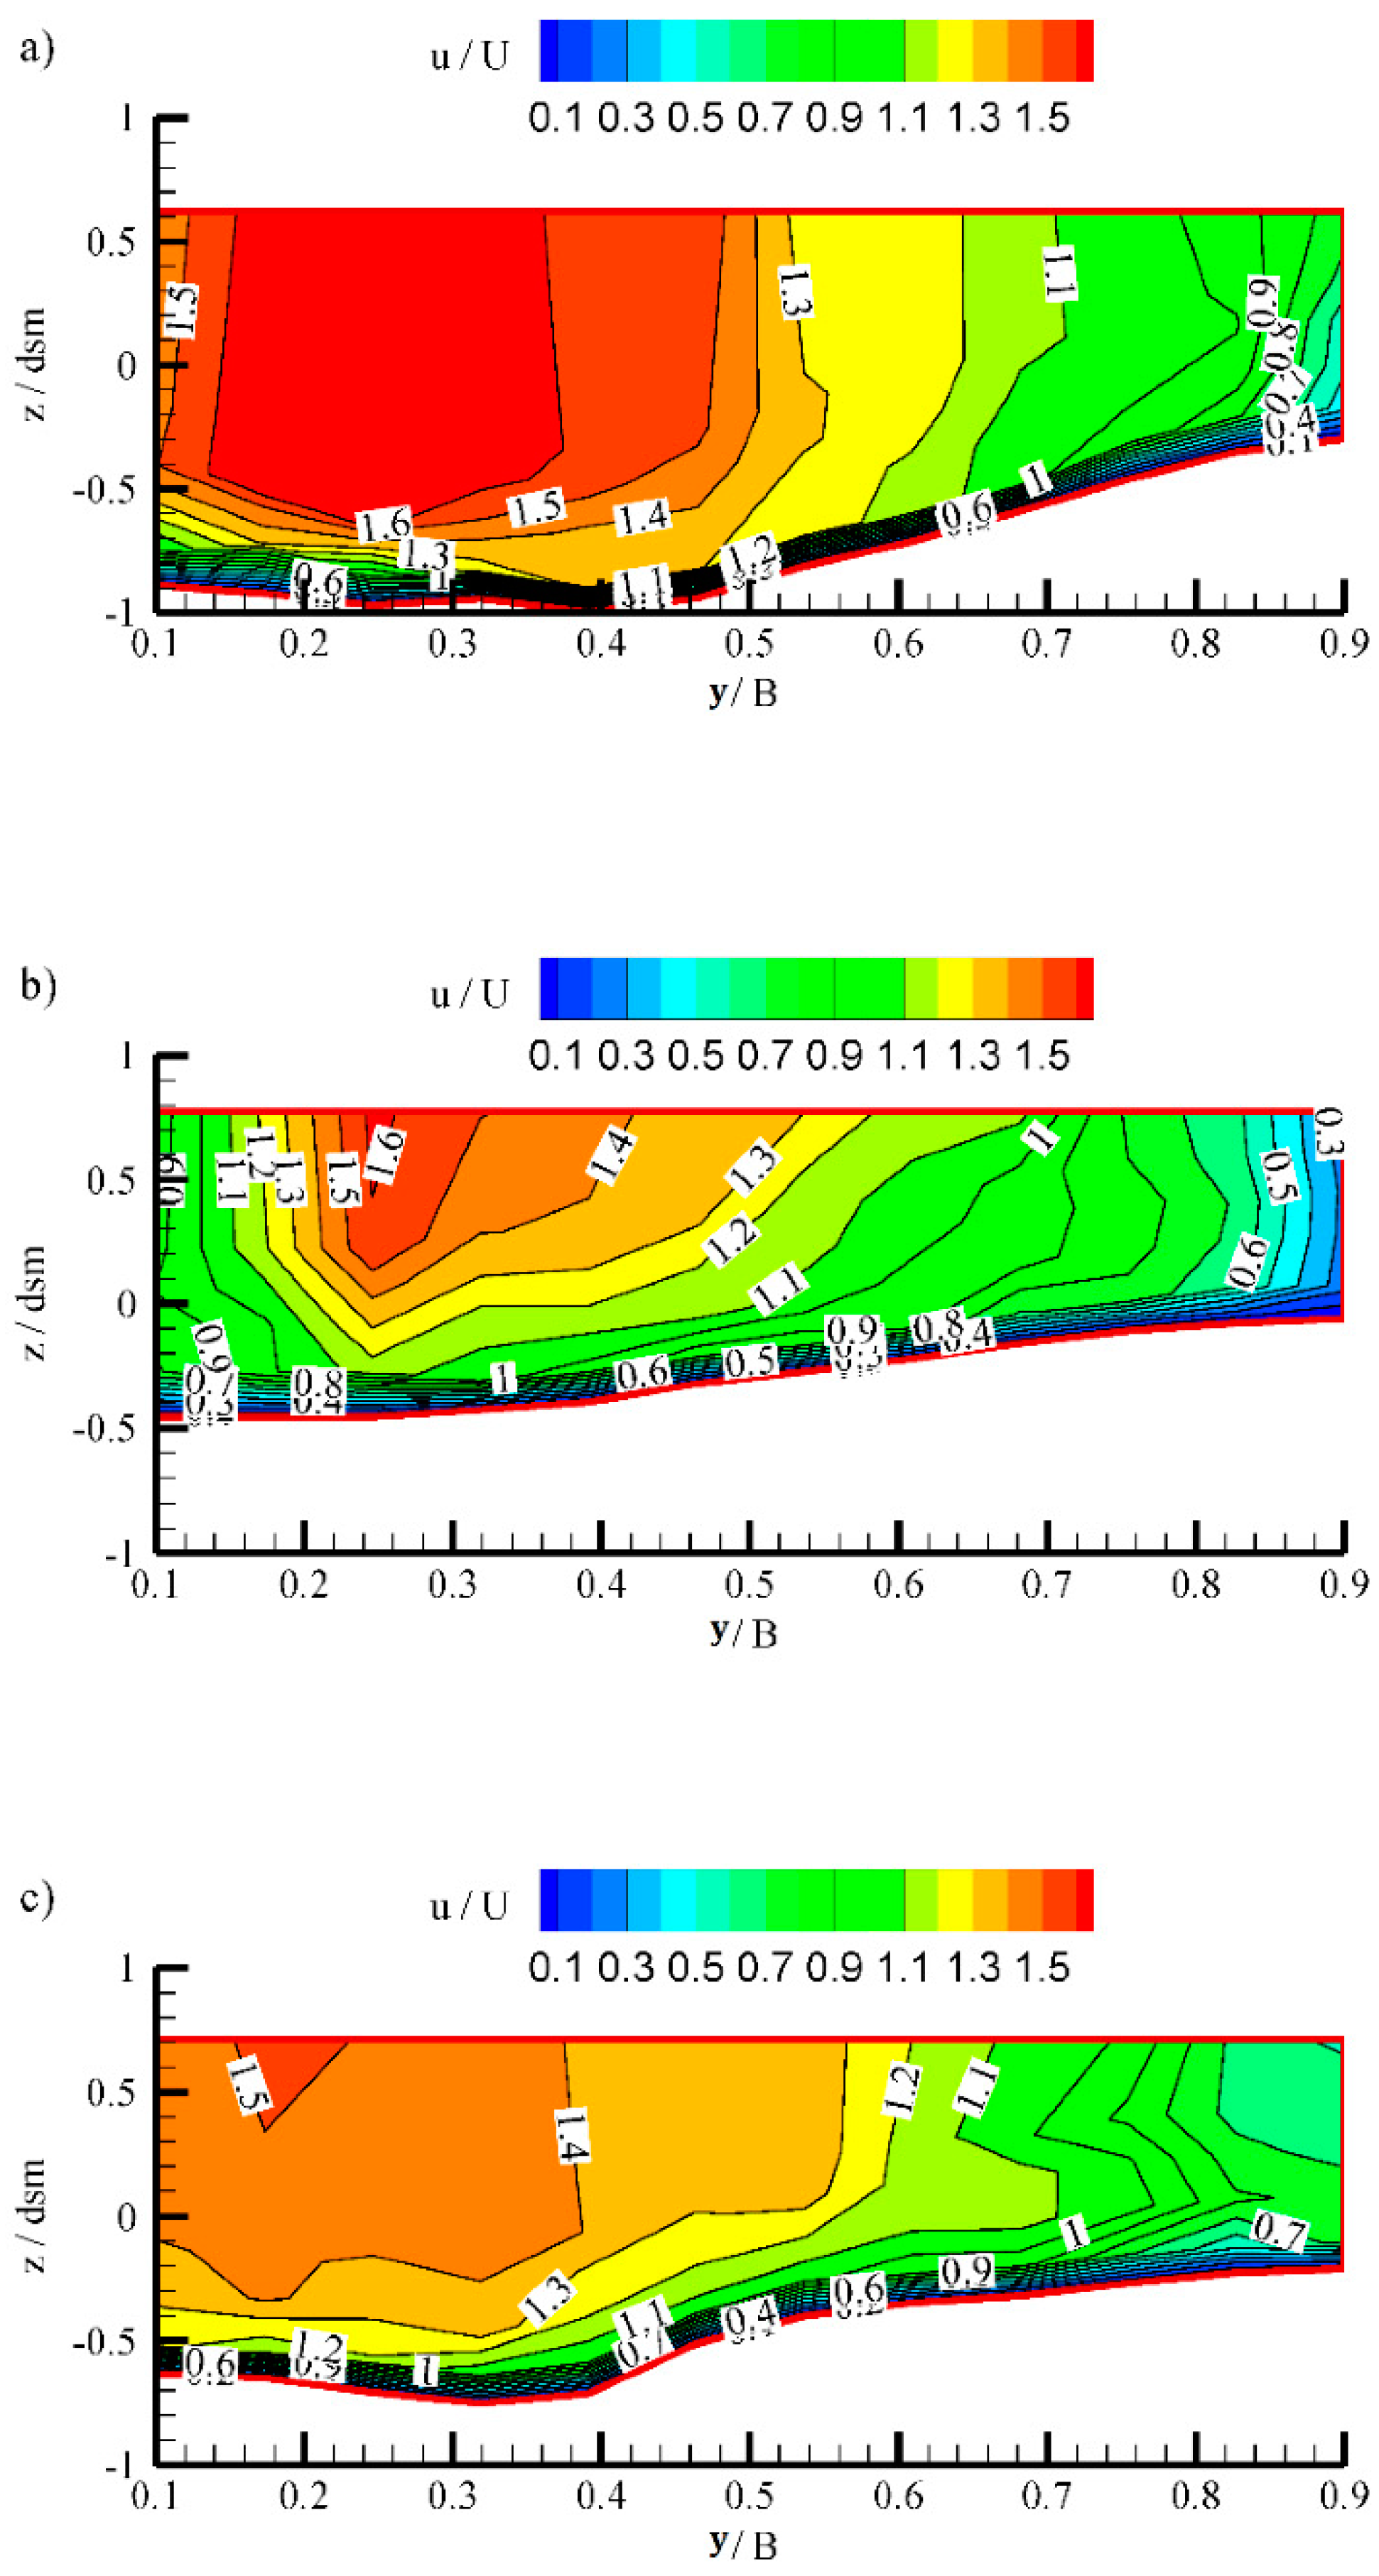
Due to the limitations of the down-looking ADV instrument in shallow depths, velocity measurements were undertaken only in points in the cross-section located at least 5 cm below the water surface. Contour plots of the normalized streamwise velocity for the case without cylindrical rods and the SR and DR models are presented in Figure 11a–c. The contour plots confirm the above interpretations of bed level changes. As the roughness of the outer bank increases due to the SR model of the cylindrical rods (Figure 11b), the core of maximum streamwise velocity crosses from the outside bank to the center part of the channel. This redistribution of velocity can be related to the advective momentum transport by the secondary currents [60].
4. Conclusions
An experimental study on the effect of cylindrical rods simulating leafless trees such as willows and cottonwoods located adjacent to the outer bank of a river bend is presented. The experiments were undertaken to simulate the influence on bed shear stress, mean flow and bend scour of the existence of trees planted at the outer bank of a bend. Two different arrangements of the trees were studied. The following conclusions have been drawn:
- The trees considerably affect the flow direction, turbulent kinetic energy and bed shear stress adjacent to the bed and the corresponding bed topography in the channel bend.
- Considering the flow characteristics, it was found that the SR model appeared to deflect the maximum velocity toward the internal bank downstream of the bend vertex, while the velocity is more uniformly distributed throughout the middle bend. The magnitude of the shear stress was enhanced at the outside bank due to the presence of double rows when compared to the SR model.
- The presence of trees deviates the thalweg from the outside wall toward the centerline of the bend. The SR model arrangement of trees was found to be more effective in reducing scour at the outside wall.
- The results may be used for validation and calibration of the ecohydraulics models. Further research is, however, required with different models of curved rivers, and with other flow parameters to make the results applicable in a real river.
Author Contributions
H.H. and A.K. contributed to the design and implementation of the research. H.H., A.K. and P.M.R. discussed the results and contributed to the final manuscript. All authors have read and agreed to the published version of the manuscript.
Funding
This study was partially supported by the Ministry of Science, Research, and Technology of Iran. The third author gratefully acknowledges the funding from statutory activities No. 3841/E-41/S/2019 of the Ministry of Science and Higher Education of Poland.
Acknowledgments
The authors greatly appreciate the staff of Sediment Hydraulics Laboratory, Shiraz University, Shiraz, Iran, for their helpful support.
Conflicts of Interest
The authors declare no conflict of interest.
References
- Rowiński, P.M.; Västilä, K.; Aberle, J.; Järvelä, J.; Kalinowska, M.B. How Vegetation Can Aid in Coping with River Management Challenges: A Brief Review. Ecohydrol. Hydrobiol. 2018, 18, 345–354. [Google Scholar] [CrossRef] [Green Version]
- Kui, L.; Stella, J.C.; Lightbody, A.; Wilcox, A.C. Ecogeomorphic Feedbacks and Flood Loss of Riparian Tree Seedlings in Meandering Channel Experiments. Water Resour. Res. 2014, 50, 9366–9384. [Google Scholar] [CrossRef] [Green Version]
- Crosato, A. Physical Explanations of Variations in River Meander Migration Rates from Model Comparison. Earth Surf. Process. Landf. 2009, 34, 2078–2086. [Google Scholar] [CrossRef]
- Oorschot, M.V.; Kleinhans, M.; Geerling, G.; Middelkoop, H. Distinct Patterns of Interaction between Vegetation and Morphodynamics. Earth Surf. Process. Landf. 2016, 41, 791–808. [Google Scholar] [CrossRef]
- Rood, S.B.; Bigelow, S.G.; Polzin, M.L.; Gill, K.M.; Coburn, C.A. Biological Bank Protection: Trees Are More Effective than Grasses at Resisting Erosion from Major River Floods. Ecohydrology 2015, 8, 772–779. [Google Scholar] [CrossRef]
- Farzadkhoo, M.; Keshavarzi, A.; Hamidifar, H.; Javan, M. A Comparative Study of Longitudinal Dispersion Models in Rigid Vegetated Compound Meandering Channels. J. Environ. Manag. 2018, 217. [Google Scholar] [CrossRef] [PubMed]
- Farzadkhoo, M.; Keshavarzi, A.; Hamidifar, H.; Javan, M. Sudden Pollutant Discharge in Vegetated Compound Meandering Rivers. Catena 2019, 182. [Google Scholar] [CrossRef]
- Hurson, M.; Biron, P. Quantifying Hydrodynamic Changes Associated with Bioengineered Stabilization Measures Using Numerical Modelling. Ecol. Eng. 2019, 136, 118–124. [Google Scholar] [CrossRef]
- Blettler, M.C.M.; Amsler, M.L.; Ezcurra De Drago, I.; Drago, E.C.; Paira, A.R.; Espinola, L.A. Hydrodynamic and Morphologic Effects on the Benthic Invertebrate Ecology along a Meander Bend of a Large River (Paraguay River, Argentina-Paraguay). Ecol. Eng. 2012, 44, 233–243. [Google Scholar] [CrossRef]
- Rowiński, P.M.; Kubrak, J. A mixing-length model for predicting vertical velocity distribution in flows through emergent vegetation. Hydrol. Sci. J. 2002, 47, 893–904. [Google Scholar] [CrossRef] [Green Version]
- Wilson, C.A.; Hoyt, J.; Schnauder, I. Impact of Foliage on the Drag Force of Vegetation in Aquatic Flows. J. Hydraul. Eng. 2008, 134, 885–891. [Google Scholar] [CrossRef] [Green Version]
- Nepf, H.M. Hydrodynamics of Vegetated Channels. J. Hydraul. Res. 2012, 50, 262–279. [Google Scholar] [CrossRef] [Green Version]
- Wilcox, A.C.; Shafroth, P.B. Coupled Hydrogeomorphic and Woody-Seedling Responses to Controlled Flood Releases in a Dryland River. Water Resour. Res. 2013, 49, 2843–2860. [Google Scholar] [CrossRef]
- Manners, R.B.; Wilcox, A.C.; Kui, L.; Lightbody, A.F.; Stella, J.C.; Sklar, L.S. When Do Plants Modify Fluvial Processes? Plant-Hydraulic Interactions under Variable Flow and Sediment Supply Rates. J. Geophys. Res. Earth Surf. 2015, 120, 325–345. [Google Scholar] [CrossRef]
- Aberle, J.; Järvelä, J. Hydrodynamics of Vegetated Channels. In GeoPlanet: Earth and Planetary Sciences; Springer: Berlin/Heidelberg, Germany, 2015; pp. 519–541. [Google Scholar] [CrossRef]
- Hamidifar, H.; Keshavarzi, A.; Omid, M.H. Evaluation of 1-D and 2-D Models for Discharge Prediction in Straight Compound Channels with Smooth and Rough Floodplain. Flow Meas. Instrum. 2016, 49. [Google Scholar] [CrossRef]
- Hamidifar, H.; Omid, M.H.; Keshavarzi, A. Kinetic Energy and Momentum Correction Coefficients in Straight Compound Channels with Vegetated Floodplain. J. Hydrol. 2016, 537. [Google Scholar] [CrossRef]
- Sun, X.; Shiono, K.; Rameshwaran, P.; Chandler, J.H. Modelling Vegetation Effects in Irregular Meandering River. J. Hydraul. Res. 2010, 48, 775–783. [Google Scholar] [CrossRef]
- Bai, Y.; Wang, Z. Theory and Application of Nonlinear River Dynamics. Int. J. Sediment Res. 2014, 29, 285–303. [Google Scholar] [CrossRef]
- da Silva, A.M.F. Recent Advances from Research on Meandering and Directions for Future Work. In GeoPlanet: Earth and Planetary Sciences; Springer: Berlin/Heidelberg, Germany, 2015; pp. 373–401. [Google Scholar] [CrossRef]
- Blanckaert, K. Topographic Steering, Flow Recirculation, Velocity Redistribution, and Bed Topography in Sharp Meander Bends. Water Resour. Res. 2010, 46. [Google Scholar] [CrossRef]
- Esfahani, F.S.; Keshavarzi, A. Effect of Different Meander Curvatures on Spatial Variation of Coherent Turbulent Flow Structure inside Ingoing Multi-Bend River Meanders. Stoch. Environ. Res. Risk Assess. 2011, 25, 913–928. [Google Scholar] [CrossRef]
- Huang, J.; Greimann, B.P.; Randle, T.J. Modelling of Meander Migration in an Incised Channel. Int. J. Sediment Res. 2014, 29, 441–453. [Google Scholar] [CrossRef]
- Bridge, J.S.; Jarvis, J. Velocity Profiles and Bed Shear Stress over Various Bed Configurations in a River Bend. Earth Surf. Process. 1977, 2, 281–294. [Google Scholar] [CrossRef]
- Rozovskiĭ, I.L. Flow of Water in Bends of Open Channels; Academy of Sciences of the Ukrainian SSR: Kiev, Ukrainian, 1957. [Google Scholar]
- Alcayaga, H.A.; Mao, L.; Belleudy, P. Predicting the Geomorphological Responses of Gravel-Bed Rivers to Flow and Sediment Source Perturbations at the Watershed Scale: An Application in an Alpine Watershed. Earth Surf. Process. Landf. 2018, 43, 894–908. [Google Scholar] [CrossRef]
- Mason, J.; Mohrig, D. Scroll Bars Are Inner Bank Levees along Meandering River Bends. Earth Surf. Process. Landf. 2019, 44, 2649–2659. [Google Scholar] [CrossRef]
- Li, J.; Tooth, S.; Yao, G. Cascades of Sub-decadal, Channel-floodplain Changes in Low-gradient, Non-vegetated Reaches near a Dryland River Terminus: Salar de Uyuni, Bolivia. Earth Surf. Process. Landf. 2019, 44, 490–506. [Google Scholar] [CrossRef] [Green Version]
- Giri, S.; Shimizu, Y.; Fujita, M. Flow Characeristics in a Mildly Meandering Channel with & without River Training Structures. Proc. Hydraul. Eng. 2003, 47, 835–840. [Google Scholar] [CrossRef] [Green Version]
- Thompson, D.M.; Puklin, L.S.; Marshall, A.E. The Long-Term Impact of Channel Stabilization Using Gabion Structures on Zealand River, New Hampshire. Ecol. Eng. 2016, 95, 779–792. [Google Scholar] [CrossRef]
- Henning, M.; Hentschel, B. Sedimentation and Flow Patterns Induced by Regular and Modified Groynes on the River Elbe, Germany. Ecohydrology 2013, 6, 598–610. [Google Scholar] [CrossRef]
- Yager, E.M.; Schmeeckle, M.W. The Influence of Vegetation on Turbulence and Bed Load Transport. J. Geophys. Res. Earth Surf. 2013, 118, 1585–1601. [Google Scholar] [CrossRef]
- Gurnell, A. Plants as River System Engineers. Earth Surf. Process. Landf. 2014, 39, 4–25. [Google Scholar] [CrossRef]
- Kim, H.S.; Kimura, I.; Shimizu, Y. Bed Morphological Changes around a Finite Patch of Vegetation. Earth Surf. Process. Landf. 2015, 40, 375–388. [Google Scholar] [CrossRef]
- Hamidifar, H.; Omid, M.H.; Keshavarzi, A. Longitudinal Dispersion in Waterways with Vegetated Floodplain. Ecol. Eng. 2015, 84. [Google Scholar] [CrossRef]
- Hamidifar, H.; Keshavarzi, A.; Truong, P. Enhancement of River Bank Shear Strength Parameters Using Vetiver Grass Root System. Arab. J. Geosci. 2018, 11. [Google Scholar] [CrossRef]
- Crosato, A.; Saleh, M.S. Numerical Study on the Effects of Floodplain Vegetation on River Planform Style. Earth Surf. Process. Landf. 2011, 36, 711–720. [Google Scholar] [CrossRef]
- Surian, N.; Barban, M.; Ziliani, L.; Monegato, G.; Bertoldi, W.; Comiti, F. Vegetation Turnover in a Braided River: Frequency and Effectiveness of Floods of Different Magnitude. Earth Surf. Process. Landf. 2015, 40, 542–558. [Google Scholar] [CrossRef]
- Liu, C.; Nepf, H. Sediment Deposition within and around a Finite Patch of Model Vegetation over a Range of Channel Velocity. Water Resour. Res. 2016, 52, 600–612. [Google Scholar] [CrossRef] [Green Version]
- Vargas-Luna, A.; Crosato, A.; Anders, N.; Hoitink, A.J.F.; Keesstra, S.D.; Uijttewaal, W.S.J. Morphodynamic Effects of Riparian Vegetation Growth after Stream Restoration. Earth Surf. Process. Landf. 2018, 43, 1591–1607. [Google Scholar] [CrossRef]
- Lera, S.; Nardin, W.; Sanford, L.; Palinkas, C.; Guercio, R. The Impact of Submersed Aquatic Vegetation on the Development of River Mouth Bars. Earth Surf. Process. Landf. 2019, 44, 1494–1506. [Google Scholar] [CrossRef]
- Caroppi, G.; Västilä, K.; Järvelä, J.; Rowiński, P.M.; Giugni, M. Turbulence at Water-Vegetation Interface in Open Channel Flow: Experiments with Natural-like Plants. Adv. Water Resour. 2019, 127, 180–191. [Google Scholar] [CrossRef]
- Langendoen, E.J.; Richard Lowrance, R.; Simon, A. Assessing the Impact of Riparian Processes on Streambank Stability. Ecohydrology 2009, 2, 360–369. [Google Scholar] [CrossRef]
- Fleri, J.R.; Lera, S.; Gerevini, A.; Staver, L.; Nardin, W. Empirical Observations and Numerical Modelling of Tides, Channel Morphology, and Vegetative Effects on Accretion in a Restored Tidal Marsh. Earth Surf. Process. Landf. 2019, 44, 2223–2235. [Google Scholar] [CrossRef]
- Rhee, D.S.; Woo, H.; Kwon, B.A.; Ahn, H.K. Hydraulic Resistance of Some Selected Vegetation in Open Channel Flows. River Res. Appl. 2008, 24, 673–687. [Google Scholar] [CrossRef]
- Pasquino, V.; Gualtieri, P.; Doria, G.P. On Evaluating Flow Resistance of Rigid Vegetation Using Classic Hydraulic Roughness at High Submergence Levels: An Experimental Work. In GeoPlanet: Earth and Planetary Sciences; Springer: Berlin/Heidelberg, Germany, 2016; pp. 269–277. [Google Scholar] [CrossRef]
- Esfahani, F.S.; Keshavarzi, A.R. How Far Must Trees Be Cultivated from the Edge of the Flood Plain to Provide Best River Bank Protection? Int. J. River Basin Manag. 2010, 8, 109–116. [Google Scholar] [CrossRef]
- Keshavarzi, A.; Esfahani, F.S. Flow Structure around a Row of Vertical Rods in a Floodplain. Proc. Inst. Civ. Eng. Water Manag. 2012, 165, 213–227. [Google Scholar] [CrossRef]
- Hey, R.D.; Thorne, C.R. Stable Channels with Mobile Gravel Beds. J. Hydraul. Eng. 1986, 112, 671–689. [Google Scholar] [CrossRef]
- Sandercock, P.J.; Hooke, J.M. Vegetation Effects on Sediment Connectivity and Processes in an Ephemeral Channel in SE Spain. J. Arid Environ. 2011, 75, 239–254. [Google Scholar] [CrossRef]
- Jamieson, E.C.; Ruta, M.A.; Rennie, C.D.; Townsend, R.D. Monitoring Stream Barb Performance in a Semi-Alluvial Meandering Channel: Flow Field Dynamics and Morphology. Ecohydrology 2013, 6, 611–626. [Google Scholar] [CrossRef]
- Keshavarzi, A.; Hamidifar, H.; Ball, J. Bed Morphology in Vegetated Estuarine River with Mild-Curved Meander Bend. Hydrol. Sci. J. 2016, 61. [Google Scholar] [CrossRef] [Green Version]
- da Silva, A.M.F.; Yalin, M.S. Fluvial Processes, 2nd ed.; Series: IAHR Monographs; CRC Press: Boca Raton, FL, USA, 2017; p. 266. [Google Scholar]
- Zolezzi, G.; Seminara, G. Downstream and Upstream Influence in River Meandering. Part 1. General Theory and Application Overdeepening. Available online: https://www.researchgate.net/publication/281822623_Downstream_and_upstream_influence_in_river_meandering_Part_1_General_theory_and_application_to_overdeepening (accessed on 2 December 2019). [CrossRef]
- da Silva, A.M.F. On Why and How Do Rivers Meander. J. Hydraul. Res. 2006, 44, 579–590. [Google Scholar] [CrossRef]
- Schwartz, J. Use of Ecohydraulic-Based Mesohabitat Classification and Fish Species Traits for Stream Restoration Design. Water 2016, 8, 520. [Google Scholar] [CrossRef] [Green Version]
- Rodríguez, J.F.; García, C.M.; García, M.H. Three-Dimensional Flow in Centered Pool-Riffle Sequences. Water Resour. Res. 2013, 49, 202–215. [Google Scholar] [CrossRef] [Green Version]
- Bywater-Reyes, S.; Diehl, R.M.; Wilcox, A.C. The Influence of a Vegetated Bar on Channel-Bend Flow Dynamics. Earth Surf. Dyn. 2018, 6, 487–503. [Google Scholar] [CrossRef] [Green Version]
- Lightbody, A.F.; Kui, L.; Stella, J.C.; Skorko, K.W.; Bywater-Reyes, S.; Wilcox, A.C. Riparian Vegetation and Sediment Supply Regulate the Morphodynamic Response of an Experimental Stream to Floods. Front. Environ. Sci. 2019, 7. [Google Scholar] [CrossRef] [Green Version]
- Blanckaert, K.; Graf, W.H. Momentum Transport in Sharp Open-Channel Bends. J. Hydraul. Eng. 2004, 130, 186–198. [Google Scholar] [CrossRef]
- Kemp, J.L.; Harper, D.M.; Crosa, G.A. The Habitat-Scale Ecohydraulics of Rivers. Ecol. Eng. 2000, 16, 17–29. [Google Scholar] [CrossRef]
- Bockelmann, B.N.; Fenrich, E.K.; Lin, B.; Falconer, R.A. Development of an Ecohydraulics Model for Stream and River Restoration. Ecol. Eng. 2004, 22, 227–235. [Google Scholar] [CrossRef]
- Hopkinson, L.; Wynn-Thompson, T. Streambank Shear Stress Estimates Using Turbulent Kinetic Energy. J. Hydraul. Res. 2012, 50, 320–323. [Google Scholar] [CrossRef]
- Rowiński, P.M.; Aberle, J.; Mazurczyk, A. Shear Velocity Estimation in Hydraulic Research. Acta Geophys. Pol. 2005, 53, 567–583. [Google Scholar]
Figure 1.
Top view of the experimental setup and bend reach and measurement sections (all dimensions are in mm, not in scale).
Figure 1.
Top view of the experimental setup and bend reach and measurement sections (all dimensions are in mm, not in scale).

Figure 2.
The arrangement pattern of simulated trees: (a) single row of trees (SR) Model and (b) double row of trees (DR) model, (not in scale, dimensions in mm, the red dashed lines are the velocity measurement sections).
Figure 2.
The arrangement pattern of simulated trees: (a) single row of trees (SR) Model and (b) double row of trees (DR) model, (not in scale, dimensions in mm, the red dashed lines are the velocity measurement sections).

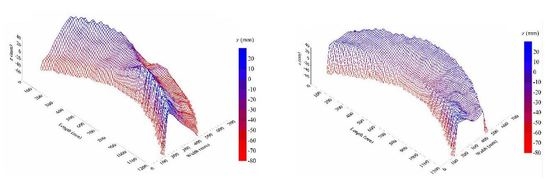
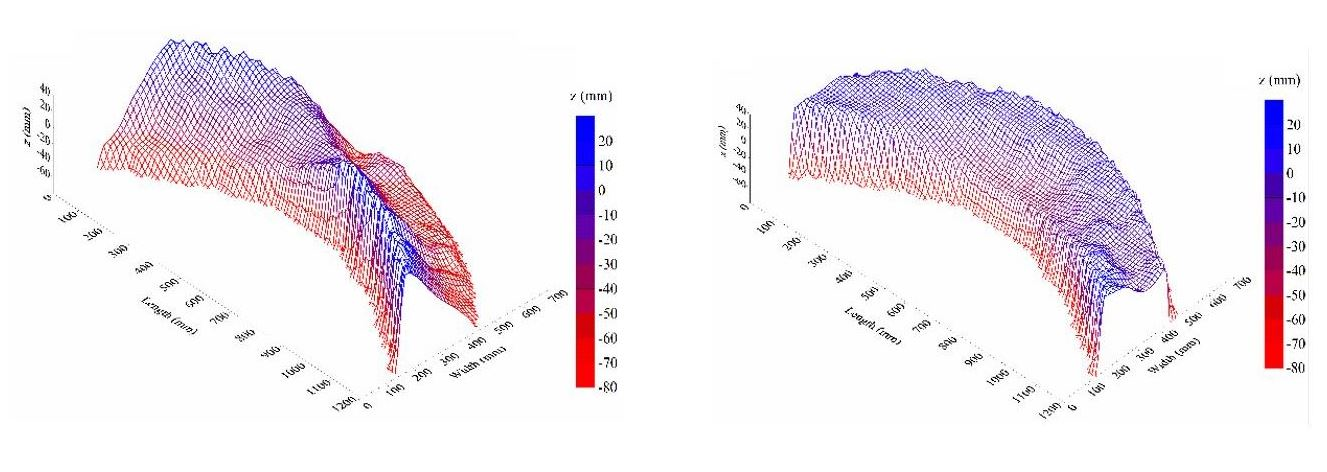
Figure 3.
Bed topography along the bend, (a) without cylindrical rods (Test 1), (b) Model SR (Test 2) and (c) Model DR (Test 3), z = 0 corresponds to the initial bed level.
Figure 3.
Bed topography along the bend, (a) without cylindrical rods (Test 1), (b) Model SR (Test 2) and (c) Model DR (Test 3), z = 0 corresponds to the initial bed level.

Figure 4.
Bed elevations at the entrance of the test section (cross-section C1): (a) Q = 10, (b) Q = 15 and (c) Q = 20 L/s.
Figure 4.
Bed elevations at the entrance of the test section (cross-section C1): (a) Q = 10, (b) Q = 15 and (c) Q = 20 L/s.


Figure 5.
Bed elevations at the bend apex (cross-section C3): (a) Q = 10, (b) Q = 15 and (c) Q = 20 L/s.
Figure 5.
Bed elevations at the bend apex (cross-section C3): (a) Q = 10, (b) Q = 15 and (c) Q = 20 L/s.

Figure 6.
Bed elevation at cross-section C5: (a) Q = 10, (b) Q = 15 and (c) Q = 20 L/s.

Figure 7.
Longitudinal profile of the thalweg in the test section of the bend (Tests 1, 2 and 3).

Figure 8.
Near-bed streamwise velocity distribution: (a) Test 4 (without cylindrical rods), (b) Test 5 (Model SR) and (c) Test 6 (Model DR).
Figure 8.
Near-bed streamwise velocity distribution: (a) Test 4 (without cylindrical rods), (b) Test 5 (Model SR) and (c) Test 6 (Model DR).

Figure 9.
Effect of cylindrical rods on normalized bed shear stress: (a) Test 4 (without cylindrical rods), (b) Test 5 (Model SR) and (c) Test 6 (Model DR).
Figure 9.
Effect of cylindrical rods on normalized bed shear stress: (a) Test 4 (without cylindrical rods), (b) Test 5 (Model SR) and (c) Test 6 (Model DR).

Figure 10.
Normalized turbulent kinetic energy (TKE/U2) near-bed: (a) Test 4 (without cylindrical rods), (b) Test 5 (Model SR) and (c) Test 6 (Model DR).
Figure 10.
Normalized turbulent kinetic energy (TKE/U2) near-bed: (a) Test 4 (without cylindrical rods), (b) Test 5 (Model SR) and (c) Test 6 (Model DR).

Figure 11.
Streamwise velocity isolines at the bend apex: (a) Test 4 (without cylindrical rods), (b) Test 5 (Model SR) and (c) Test 6 (Model DR).
Figure 11.
Streamwise velocity isolines at the bend apex: (a) Test 4 (without cylindrical rods), (b) Test 5 (Model SR) and (c) Test 6 (Model DR).


Table 1.
Summary of the experimental conditions.
| Test No. | Q (L/s) | H (m) | U (m/s) | Fr (-) | U* (m/s) | Model Type |
|---|---|---|---|---|---|---|
| 1 | 10 | 0.15 | 0.22 | 0.181 | 0.0384 | NR |
| 2 | 10 | 0.15 | 0.22 | 0.181 | 0.0384 | SR |
| 3 | 10 | 0.15 | 0.22 | 0.181 | 0.0384 | DR |
| 4 | 15 | 0.18 | 0.28 | 0.211 | 0.0401 | NR |
| 5 | 15 | 0.18 | 0.28 | 0.211 | 0.0401 | SR |
| 6 | 15 | 0.18 | 0.28 | 0.211 | 0.0401 | DR |
| 7 | 20 | 0.21 | 0.32 | 0.223 | 0.0414 | NR |
| 8 | 20 | 0.21 | 0.32 | 0.223 | 0.0414 | SR |
| 9 | 20 | 0.21 | 0.32 | 0.223 | 0.0414 | DR |
Table 2.
Percentage change of eroded bed volume and maximum scour depth throughout the test section.
Table 2.
Percentage change of eroded bed volume and maximum scour depth throughout the test section.
| Test No. | Arrangement | Vr (%) | Dr (%) |
|---|---|---|---|
| 2 | SR | −70.4 | −21.4 |
| 3 | DR | −62.1 | −14.3 |
| 5 | SR | −36.6 | −49.8 |
| 6 | DR | −11.8 | −24.8 |
| 8 | SR | −36.9 | −47.0 |
| 9 | DR | −7.7 | −31.9 |
© 2019 by the authors. Licensee MDPI, Basel, Switzerland. This article is an open access article distributed under the terms and conditions of the Creative Commons Attribution (CC BY) license (http://creativecommons.org/licenses/by/4.0/).
Share and Cite
MDPI and ACS Style
Hamidifar, H.; Keshavarzi, A.; Rowiński, P.M. Influence of Rigid Emerged Vegetation in a Channel Bend on Bed Topography and Flow Velocity Field: Laboratory Experiments. Water 2020, 12, 118. https://doi.org/10.3390/w12010118
AMA Style
Hamidifar H, Keshavarzi A, Rowiński PM. Influence of Rigid Emerged Vegetation in a Channel Bend on Bed Topography and Flow Velocity Field: Laboratory Experiments. Water. 2020; 12(1):118. https://doi.org/10.3390/w12010118
Chicago/Turabian StyleHamidifar, Hossein, Alireza Keshavarzi, and Paweł M. Rowiński. 2020. "Influence of Rigid Emerged Vegetation in a Channel Bend on Bed Topography and Flow Velocity Field: Laboratory Experiments" Water 12, no. 1: 118. https://doi.org/10.3390/w12010118
Note that from the first issue of 2016, this journal uses article numbers instead of page numbers. See further details here.