The Macrophyte Index for Rivers (MIR) as an Advantageous Approach to Running Water Assessment in Local Geographical Conditions


1
Department of Ecology and Environmental Protection, Poznan University of Life Sciences, Wojska Polskiego 28, 60-637 Poznan, Poland
2
Chief Inspectorate of Environmental Protection, Wawelska 52/54, 00-922 Warsaw, Poland
*
Author to whom correspondence should be addressed.
Water 2020, 12(1), 108; https://doi.org/10.3390/w12010108
Submission received: 9 December 2019
/
Revised: 23 December 2019
/
Accepted: 26 December 2019
/
Published: 29 December 2019
(This article belongs to the Special Issue Use of Aquatic Biota to Detect Ecological Changes in Freshwater: Current Status and Future Directions)
Abstract
:The Macrophyte Index for Rivers (MIR) was developed in 2007, and it was one of the first biological methods developed in Poland under the requirements of the Water Framework Directive to assess the ecological status of running waters. It is based on the quantitative and qualitative evaluation of 153 indicator taxa. The aim of this study was to evaluate the ability of the MIR method to detect trophic degradation in rivers and to compare its efficiency with other macrophyte metrics. Our investigation was based on 100 sites, representing a very clear gradient from near oligotrophic to eutrophic conditions. The results showed that macrophytes can be distinguished in terms of their ecological requirements for nutrient concentration in water, and this can be used to develop an effective system of freshwater assessment. The MIR was shown to be the indicator most strongly correlated with various forms of nutrients, and it was demonstrated that calibration of the macrophyte method to local biogeographical conditions resulted in greater effectiveness of the assessment method.
1. Introduction
The evaluation and classification of freshwater ecosystems by assessing their ecological status was introduced as a monitoring task almost 20 years ago by the Water Framework Directive (WFD). The adoption of the WFD has led to the intensive development of monitoring methods using all major groups of aquatic organisms [1], making the EU member states leaders in comprehensive ecological studies of aquatic ecosystems as a determinant of environment quality. This approach has also been used for the development of biomonitoring systems in nonEU countries and even on other continents [2,3,4].
Macrophytes, as a vital component of aquatic ecosystems, are among the groups of organisms considered by the WFD for river assessment. Plants are sensitive indicators of the aquatic environment, able to detect eutrophication [2,5,6,7,8,9], and to some extent also acidification [10], water flow [11], and morphological degradation [8]. Furthermore, aquatic plants respond to various other environmental factors, including light, temperature, and substrate [12].
For the purpose of river monitoring, several systems based on aquatic plants have been developed, and some of these have been integrated into national monitoring programs. In France, the L’Indice Biologique Macrophytique en Rivière (IBMR) system [8] was proposed, and it has been implemented in monitoring on a national scale. In Germany, several systems had been developed by the turn of the century, including Trophäe-Index Macrophyten (TIM) [6] and the Macrophyte Index (MI) [13]. Later, especially for the purposes of the WFD, a new method was designed, based on the Reference Index (RI) [14,15,16]. Macrophyte monitoring of British rivers was already being tested in the 1990s using Mean Trophic Rank (MTR) [5], and this method was tested widely in Europe, for instance in Denmark, Germany, Italy, Slovakia, Sweden [17,18], Latvia [19], and Poland [20]. Later, further macrophyte methods were proposed and implemented in monitoring in the UK (RMNI) [21], Denmark [22], and Austria [23].
The Polish macrophyte method was developed in 2007 and is based on calculation of the Macrophyte Index for Rivers (MIR). The method indicates the ecological status of rivers based on quantitative and qualitative evaluation of freshwater plant species. In more than a decade since its introduction, it has been modified based on the results of research projects [24,25,26,27] and the EU Water Framework Directive intercalibration exercise [28]. Although the MIR method has been in use for over 10 years, its fundamentals have not yet been described in detail in an international scientific journal. Our paper fills this gap, presenting the results of application of the most recent form of the MIR method in a selected trophy gradient. The aim was to evaluate the ability of the MIR method to detect trophic degradation in rivers and to compare its efficiency with other macrophyte metrics. Moreover, the source of the differences between metrics was analyzed. We hypothesized that the MIR method is the most advantageous method for ecological status monitoring in local conditions in Poland. Furthermore, we hypothesized that the advantage of local macrophyte methods in particular geographical conditions is a result of the use of locally adapted sets of macrophyte species and adjustment of their indicative values.
2. Methods
2.1. The MIR Method
Macrophyte surveys were undertaken using the Polish national monitoring method based on the MIR index (Macrophyte Index for Rivers) [29], which was developed to meet the requirements of the Water Framework Directive. The field procedure of the MIR method corresponds to most other European macrophyte methods [5,6,8] and it has been intercalibrated with other European macrophyte assessment methods [28].
The MIR method, introduced into practice in 2007 [30], has enabled successful monitoring throughout Poland. In the last cycle of national monitoring in Poland, the macrophyte method was used for the evaluation of approximately one thousand water bodies. There is also an increasing number of reports concerning the use of the method in other countries [4].
In the MIR method, the survey reach is a 100 m length of river, where all submerged, free-floating, amphibious and emergent monocotyledonous and dicotyledonous plants, as well as filamentous algae, liverworts, mosses, and pteridophytes are identified. The assessment also includes macrophytes attached or rooted in parts of the river bank that are likely to be submerged for more than 85% of the year. The cover of each species is recorded using the following nine-point scale according to Holmes et al. [5]: <0.1%, 0.1–1%, 1–2.5%, 2.5–5%, 5–10%, 10–25%, 25–50%, 50–75%, and >75%.
From the field records, the Macrophyte Index for Rivers (MIR) can be calculated Equation (1):
where:
MIR is the value of the Macrophyte Index for Rivers at the sampling site;
N is the number of species at the sampling site;
li is the indicator value for the i-th taxon;
wi is the weighting factor for the i-th taxon;
pi is the cover of the i-th taxon according to the nine-point scale.
The value of the MIR index depends on the presence of species identified in the river and their indicator values. This is a common approach, utilized in other macrophyte methods used in EU countries under the WFD (e.g., IBMR [8]). The method is based on 153 taxa: 106 vascular plants (including 55 monocots, 48 dicots, and 3 pteridophytes), 30 bryophytes (20 mosses and 10 liverworts), and 17 taxa of structural algae (Table S1). Two ecological values have been developed for each indicator species. The first—the indicative value (l), ranging from 1 to 10—indicates the average degree of trophic degradation of the river. The second parameter—the weighting factor (w), ranging from 1 to 3—reflects tolerance for environmental conditions. The highest weighting values are assigned to ecological specialists and the lowest to the most tolerant plants.
The value of the MIR index reflects the ecological status of a river. It indicates river degradation, especially eutrophication, and ranges from 10 (most degraded rivers) to 100 (highest quality). To evaluate ecological status using the MIR index, class boundary values consistent with the five-class scheme of the WFD were derived. The reference values for evaluation have been determined previously and are presented in separate publications [26,27]. A river typology based on macrophytes was proposed by Jusik et al. [24].
2.2. Field Surveys
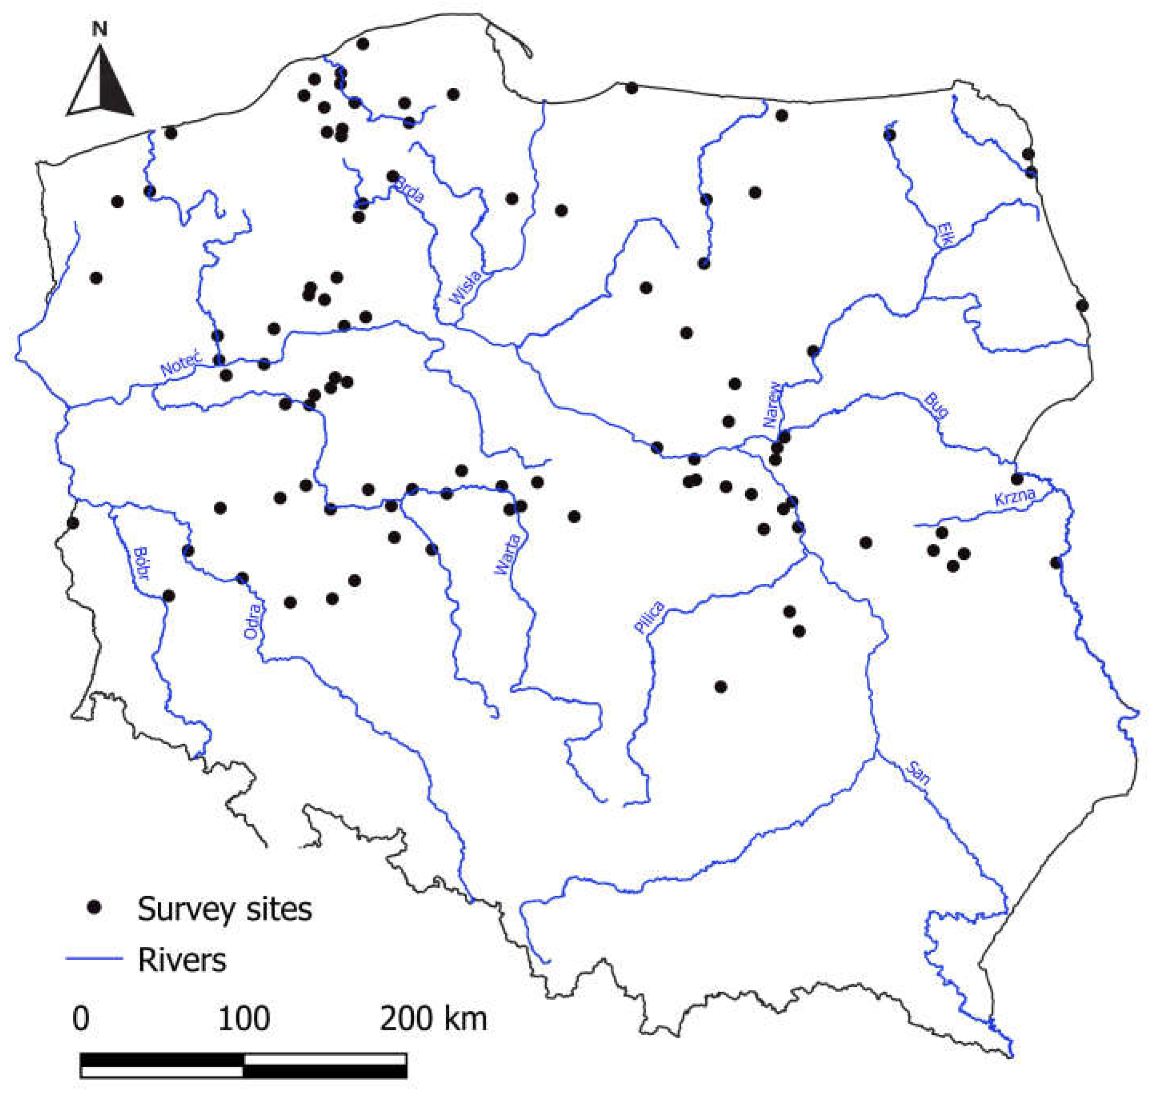
The study covered 100 river sites representing the most common abiotic type of Polish rivers, sandy lowland rivers, located in two European ecoregions: 14 (Central Plains) and 16 (Eastern Plains) (Figure 1). In terms of altitude, all of the rivers were located below 200 m a.s.l., while in terms of catchment size they were smaller than 1000 km2 (small and medium rivers, according to the WFD). Only rivers with a substrate predominantly composed of sand were included in the study. Artificial canals and rivers that were strongly hydromorphologically transformed were excluded from the analysis. Most of the selected rivers (88 sites) are included in the state environmental monitoring system. Moreover, six pristine sites were surveyed, representing the best ecological status of this river type in Poland, while on the other hand, six sites representing an extreme level of degradation were surveyed. This means that the 100 selected sites represent a very wide gradient of eutrophication, from the least eutrophic river sites to those with the most advanced eutrophication.
Macrophyte surveys were carried out on the 100 selected sites in the years 2008–2011 during the summer season, between July and early September. A glass-bottomed bucket was used to aid observations. For nonwadable parts of the largest rivers, a grapnel was used to retrieve macrophytes from the channel. All plants were recorded, including submerged and emerged species (at least rooted in the water).
Chemical data on water quality for 88 sites was obtained from the national monitoring database, where each site was sampled at monthly intervals (12 monthly samples). Chemical analysis for the additional 12 sites was performed in the researchers’ own laboratory, based on two collected samples.
2.3. Statistical Analysis
Based on the macrophyte database, six macrophyte metrics were calculated, namely the MIR [27], IBMR [8], MTR [5], RMNI [21], ITEM [28], and RI [13,14,15]. Five of them were adapted to the requirements of the WFD for evaluation of the ecological status of rivers; the exception is the British MTR, which was developed before the directive was introduced in the year 2000.
Analyses of the environmental database began by testing the distribution of environmental variables, using the W-value according to the Shapiro–Wilk criteria [31]. To normalize the distribution most of the variables were transformed, mainly using logarithmic conversion (Table 1). The normalized dataset underwent principal component analysis (PCA) to identify the major directions of variability. Varimax with normalized rotation was applied.
The correlation between the calculated macrophyte metrics and environmental variables was evaluated based on Pearson’s correlation coefficient. Among the environmental variables, normalized values of hydrochemical parameters were used. The environmental matrix was supplemented with the values of the main hydrochemical degradation gradient, identified as the first principal component in PCA.
Constrained and unconstrained ordination methods were used to explore gradients in the macrophyte dataset using CANOCO 4.56. These were Canonical Correspondence Analysis (CCA) [32] and Detrended Correspondence Analysis (DCA) [33]. Preliminary DCA on the biological data revealed that the gradient length was 3.84 times the standard deviation; this result justified the use of Gaussian multivariate methods. The statistical significance of the relationship between macrophyte data and environmental parameters was evaluated using the Monte Carlo permutation test with 499 permutations [34].
To detect sources of differences in the response of various European macrophyte systems to the same environmental gradient, MIR values were calculated based on the species provided for the IBMR, MTR, RMNI, and ITEM methods and using original indicator values for those systems (the RI system was omitted due to its different classification approach). The indices calculated in this way were designated as MIRIBMR, MIRMTR, MIRRMNI, and MIRITEM, respectively. For example, MIRIBMR is based on the MIR equation but uses IBMR indicative species with the original IBMR indicator values, standardized between 1 (most pristine, original IBMR value 20) and 10 (most degraded, original IBMR value 1). The statistical analysis was carried out using the STATISTICA program [31].
3. Results
3.1. Environmental Database Analysis
The distribution of the water quality parameters among the 100 sites was tested using the W-value according to the Shapiro–Wilk criteria [31]. Only in case of three of the variables was the distribution close to normal (pH, BOD, and Cond). The remaining variables were transformed using logarithmic conversion (Table 1).
The results of hydrochemical analysis are shown in Table 2. For each of the 10 studied parameters they show the raw data mean (untransformed data), the mean values based on transformed data, the median, and the minimum and maximum. The converted data mean values were much closer to the medians than the unconverted data mean values, which additionally confirmed the attainment of a distribution close to normal. Following the transformation, since the normality condition was fulfilled, parametric statistical methods could be applied.
Principal component analysis (PCA) of the water quality parameters revealed two main factors indicating two different directions of variability (Table 3). Factor 1 explains the greater part of the variability, and its interpretation is very clear. It is correlated strongly and positively with nutrients and can be explained as the general trophic degradation. The second factor is related to the pH of the water.
In the further analysis, the environmental gradient indicated by Factor 1 was used. Therefore, the factorial loadings of each site were considered as environmental variables in the process of system calibration.
3.2. Biological Diversification
The numbers of indicator species for particular systems were different (Table 4)—the greatest numbers of identified plants were used in the RMNI (112 species) and ITEM (100) systems. Only 97 indicator species detected in the studied rivers were applied as MIR system indicators. Among the detected plants, those not used by the MIR system but used by other systems were almost exclusively emergent species, of which the majority should be considered as terrestrial plants, occasionally found in water, for example Agrostis stolonifera, Bidens frondosa and B. tripartita, Cardamine amara, Epilobium hirsutum, Eupatorium cannabinum, Gallium palustre, Juncus articulates, J. conglomeratus, J. effusus, Lysimachia nummularia, Lythrum salicaria, Myosoton aquaticum, Petasites hybridus, Ranunculus repens, Scutelaria galericulata, Solanum dulcamara, and Symphytum officinale. Those species are taken into account chiefly in the RMNI, ITEM, and IBMR methods. Three species of vascular plants, namely Phragmietes australis, Carex pseudocyperus, and Rumex aquaticus, as well as one species of moss, Calliergon cordifolium, were among the detected plants more strongly related to the water environment, but not included in the MIR. The ecological properties of these plants were widely studied during the development of the MIR, but because of their wide ecological tolerance they were not recognized as MIR indicator species. The only taxon of submerged plants that is not included in the MIR is Callitriche sp., which at this level is included in RMNI, ITEM, and RI.
3.3. Relations between Macrophyte Indices and Water Quality
The results showed a strong correlation of all macrophyte indices with environmental variables representing trophic degradation of water (Table 5). The r-Pearson correlation coefficient values were significant and usually took relatively high values. The highest values were obtained for the MIR and the general trophic degradation gradient isolated by PCA (r = −0.88). Moreover, strong correlations were also visible in relation to individual hydrochemical parameters, in particular with conductivity (r = −0.82) and total and reactive phosphorus (r = −0.81). No relationship was found between the acidification factor and any of the analyzed indices. The r-Pearson correlation coefficient here did not indicate significance and took low values (at most 0.21).
The studied foreign macrophyte indices exhibited a weaker relationship with particular variables indicating eutrophication of water than did the MIR; however, this relationship was still strong in some cases (Table 5). Apart from the MIR, very high values of the correlation index were obtained for MTR, which was the most strongly correlated with the degradation gradient determined by PCA (r = −0.80), conductivity (r = −0.73), total phosphorus (r = −0.75), phosphates (r = −0.73), and total nitrogen (r = −0.68). IBMR and ITEM, followed by RMNI, showed weaker relationships with the water trophy. The lowest values of the r-Pearson correlation index were found for RI.
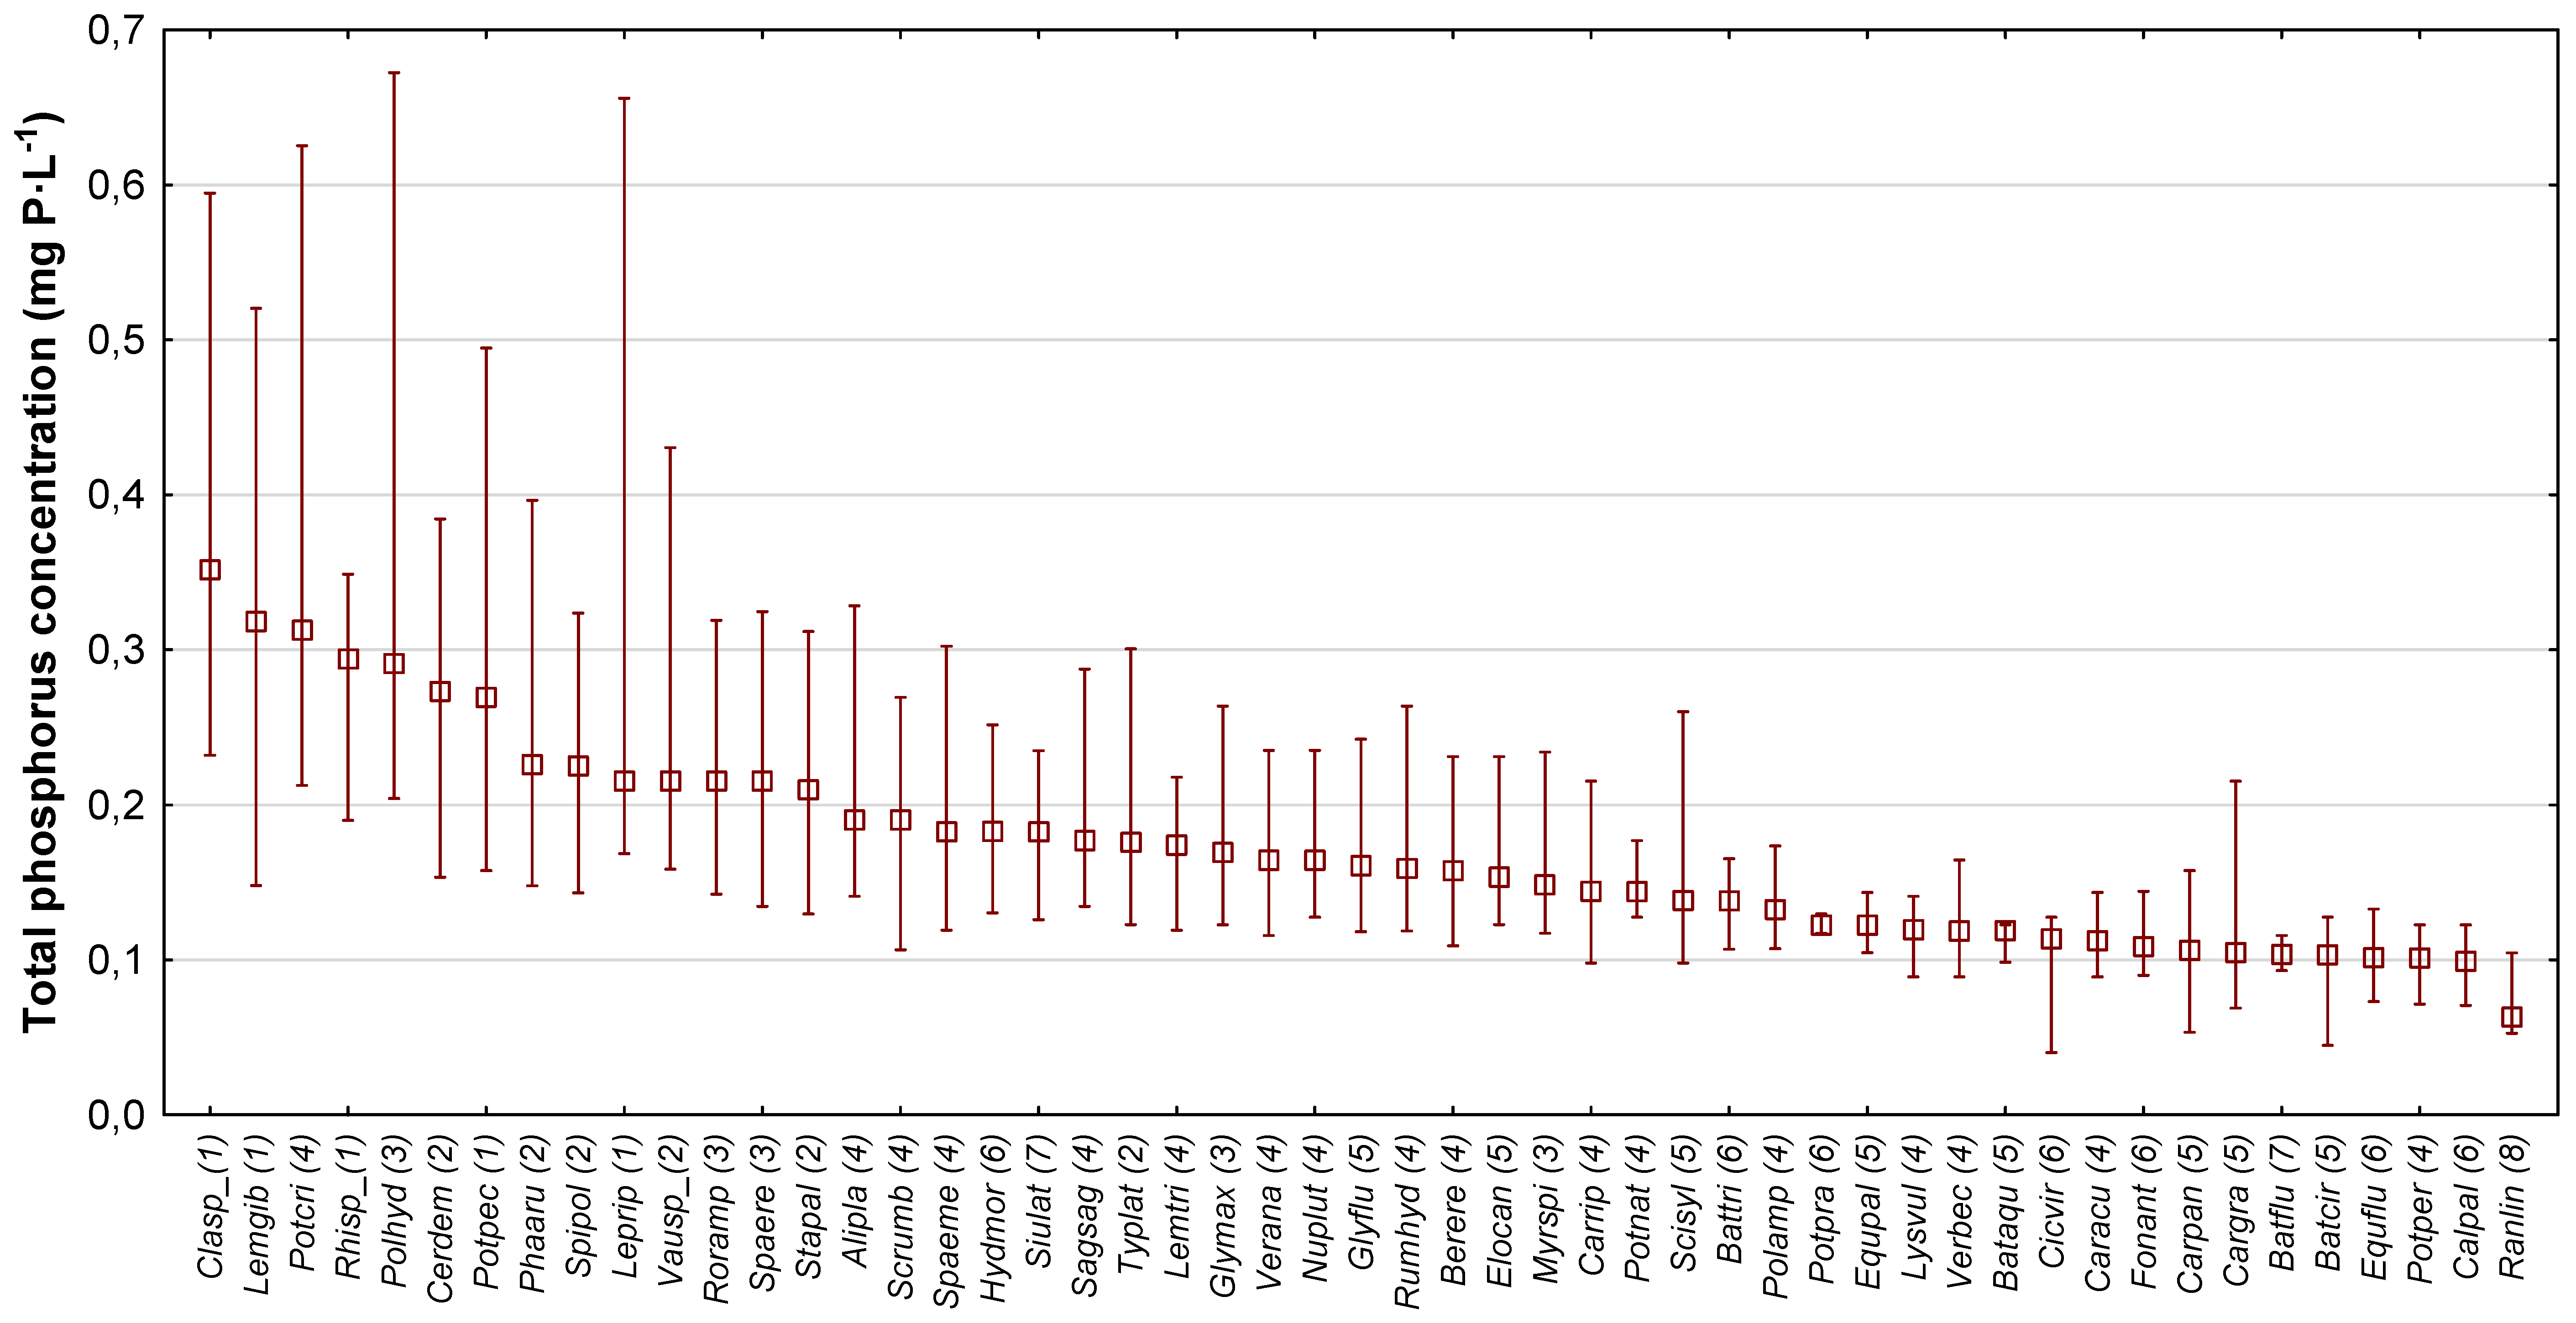
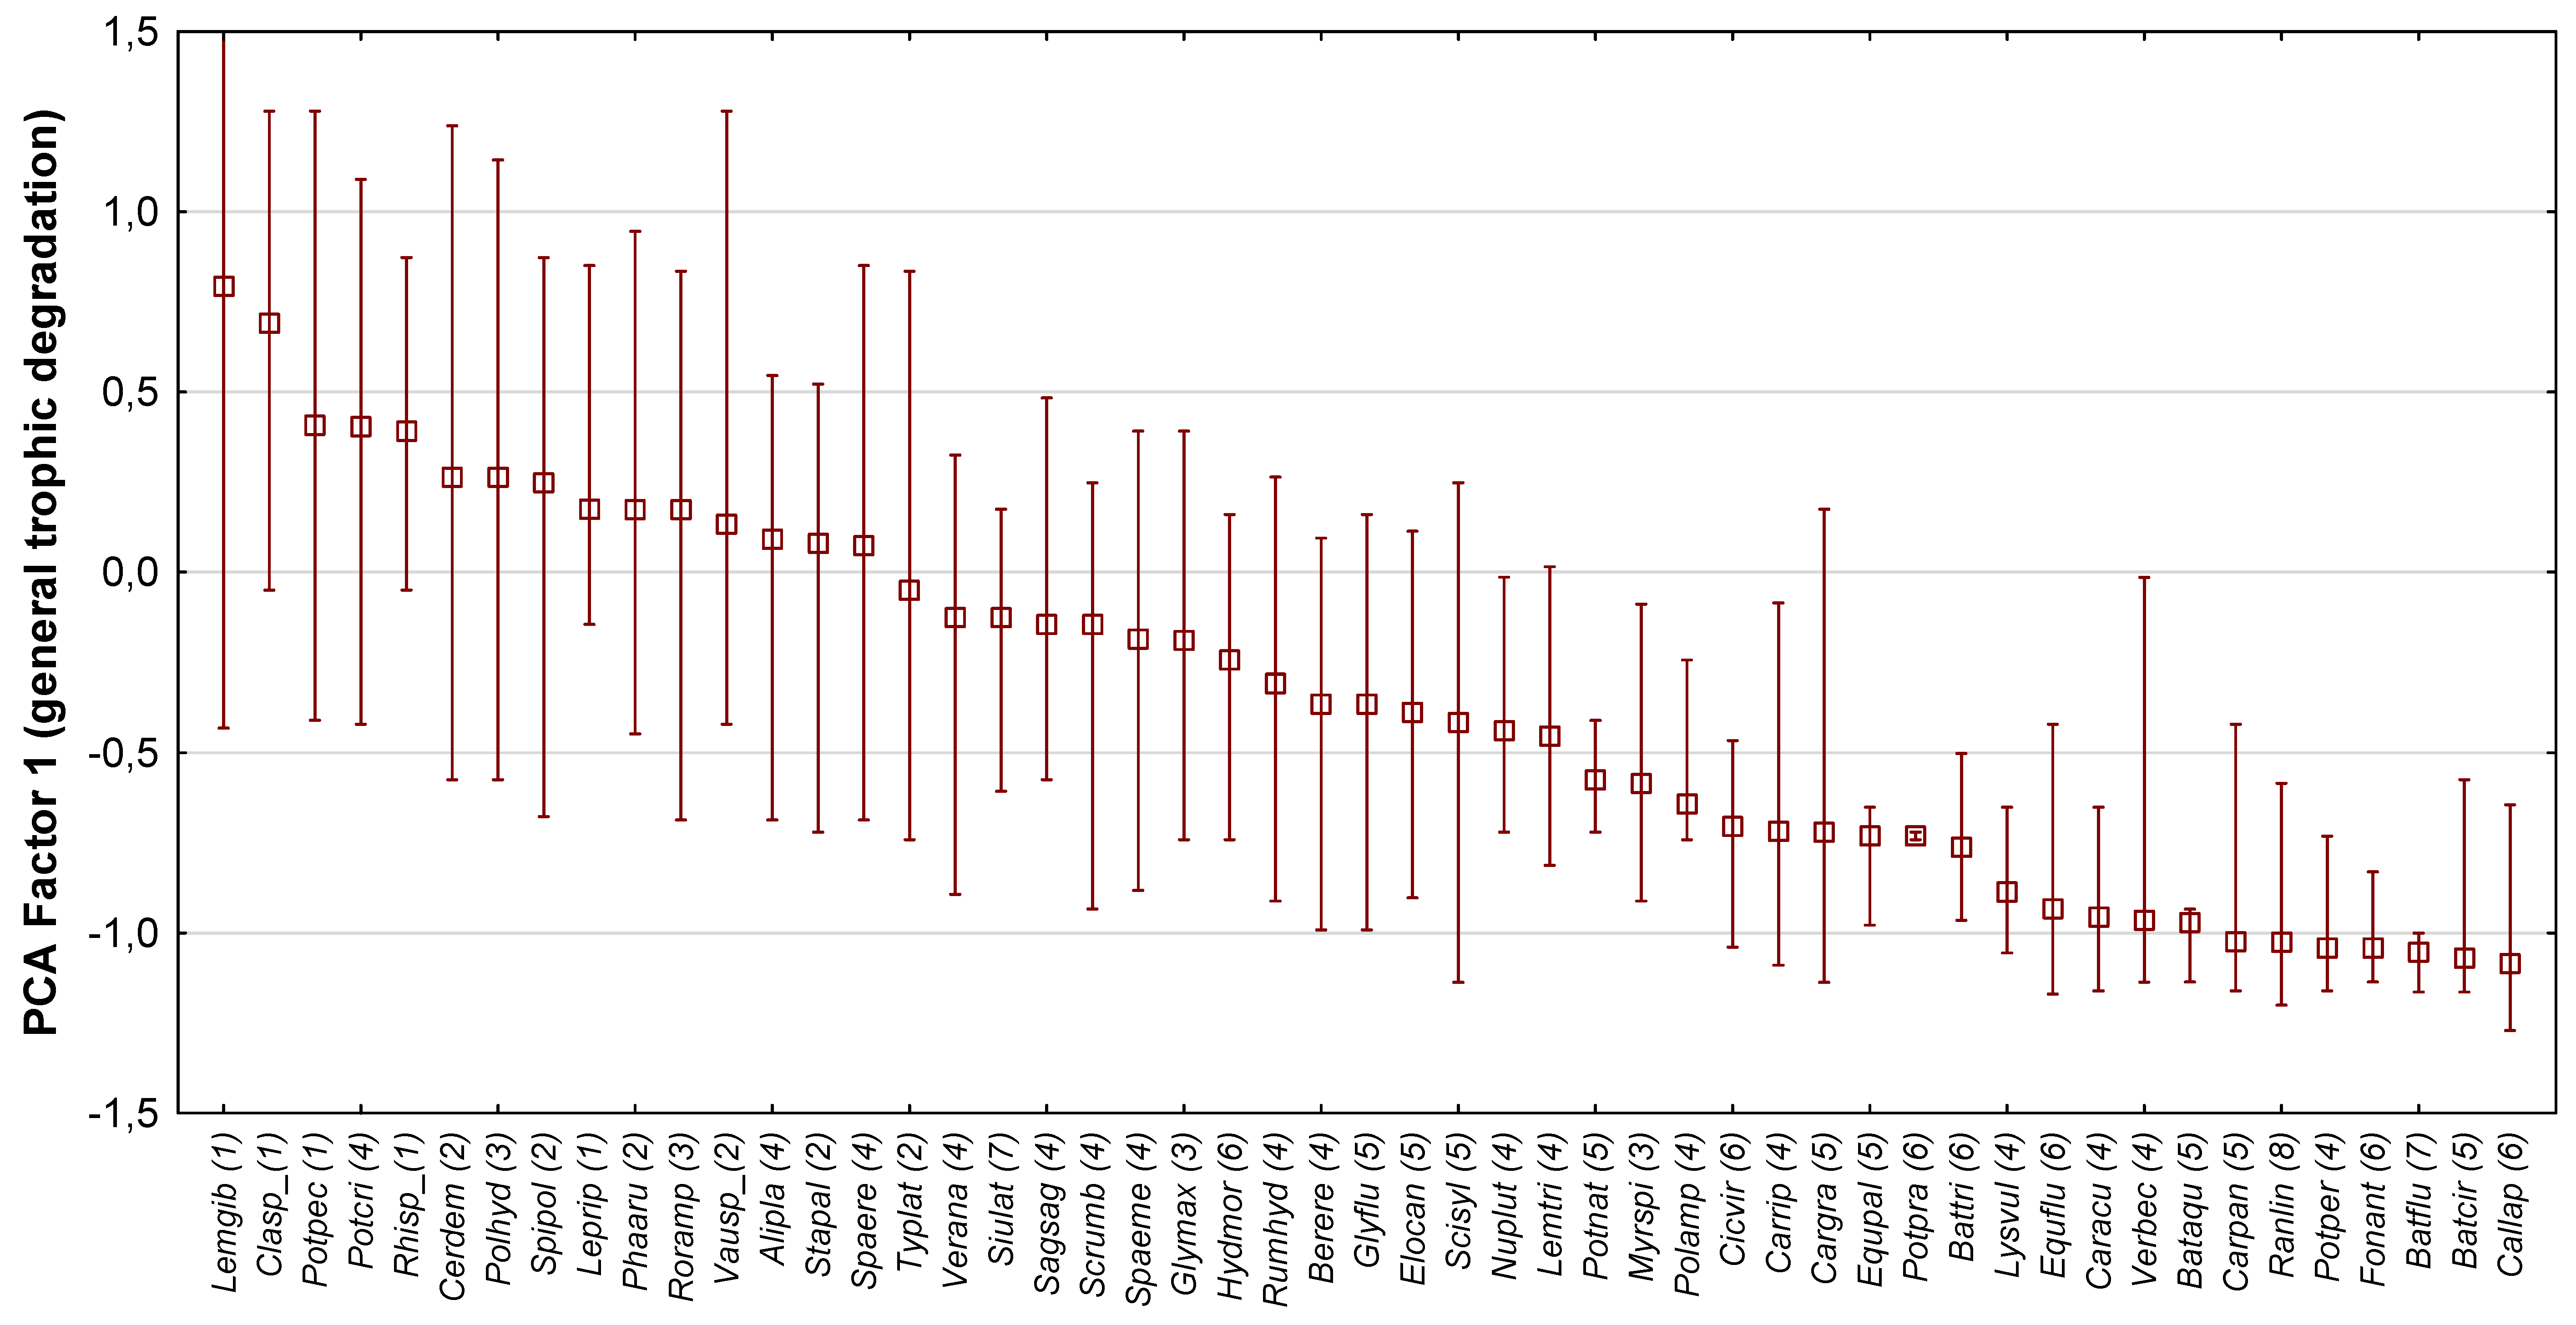
Preferences of macrophyte species in relation to total phosphorus concentration (Figure 2) and PCA Factor 1 (Figure 3) are presented graphically. The diagram includes 51 macrophyte taxa found during the study at at least four sites, which are ranked according to decreasing median values of total phosphorus concentration and PCA Factor 1, respectively. High values of total phosphorus concentration and PCA Factor 1, related to the general trophic degradation, corresponded mainly to taxa, which in the MIR index were ascribed indicator value l = 1 or 2 (taxa in the left-hand part of Figure 2 and Figure 3), for example Ceratophyllum demersum, Cladophora sp., Lemna gibba, Leptodictyum riparium, Potamogeton pectinatus, Rhizomnim sp., and Spirodela polyrhiza, Vaucheria sp. The median of the total phosphorus concentration for this group of taxa lay in the range 0.21–0.36 mg P·L−1, with maximum values exceeding 0.65 mg P·L−1. On the other hand, low values of total phosphorus concentration and PCA Factor 1 usually corresponded to taxa ascribed indicator values l ≥ 5 (taxa in the right-hand corner of Figure 2 and Figure 3), for example Batrachium aquatile, B. circinatum, B. fluitans, Caltha palustris, Carex gracilis, C. paniculata, Cicuta virosa, Equisetum fluviatile, Fontinalis antipyretica, and Ranunculus lingua. The median total phosphorus concentration for this group of taxa was within the range 0.07–0.12 mg P·L−1.
The ecological preferences of macrophytes in the studied rivers, presented graphically in Figure 2 and Figure 3, were also compared with those ascribed to indicator values l in the MIR. The Spearman’s rank correlation between the l indicator and the total phosphorus concentration was −0.78, while against PCA Factor 1 it was −0.75 (Table 6). Ecological preferences of macrophytes were also compared in terms of correlations among indicator values of other macrophyte systems (IBMR, MTR, RMNI, ITEM). According to the results for Polish lowland rivers, the indicator values for macrophytes and P-total have the strongest correlation (according to Spearman’s rank correlation) with MIR (−0.78), followed by MTR (−0.76). In the case of the other systems the correlation was significantly lower.
Similar relationships were found between the indicator l and the general hydrochemical degradation gradient values (PCA Factor 1), where the Spearman’s rank correlation with MIR (−0.75) was slightly lower than with MTR (−0.76). In the case of the other systems this correlation was even lower than that for total phosphorus.
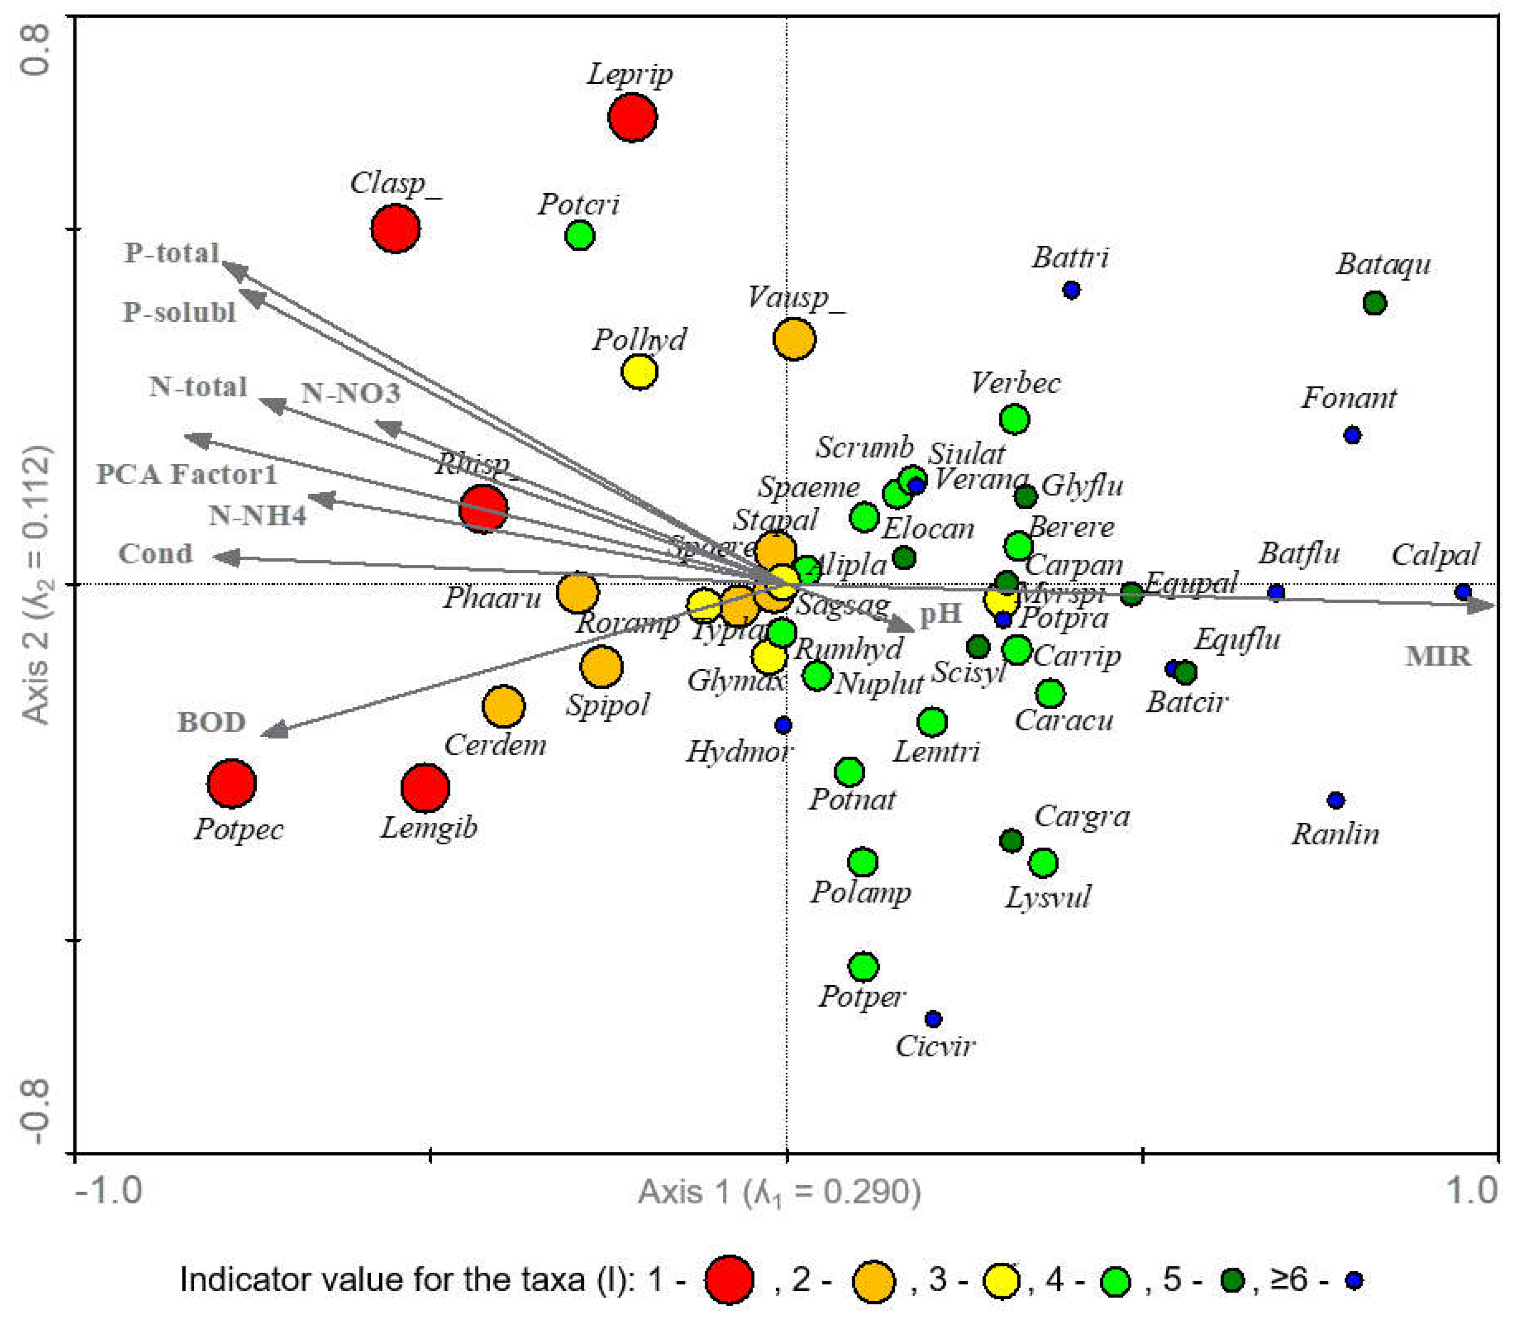
The relationship between aquatic plant species and environmental variables was demonstrated by CCA analysis and presented graphically (Figure 4). The first axis accounted for 37.8% (ʎ1 = 0.290) and the second axis for 14.6% (ʎ2 = 0.112) of the total variance in the relationships between the aquatic plant taxa and environmental variables. The interpretation of the first axis appears to be relatively simple. It is strongly correlated negatively with nutrients (especially forms of phosphorus) and positively with the MIR index, and can be explained as the general trophic degradation. High concentrations of nutrients in the water favor mainly macrophyte taxa with low indicator value (l ≤ 2), e.g., Ceratophyllum demersum, Cladophora sp., Lemna gibba, Leptodictyum riparium, Phalaris arundinaceae, Potamogeton pectinatus, Rhizoclonium sp., and Spirodela polyrhiza (left part of Figure 4). On the other hand, low biogen concentrations favor macrophytes with high indicator value (l ≥ 5), e.g., Batrachium aquatile, B. circinatum, B. fluviatile, Caltha palustris, Equisetum fluviatile, Fontinalis antipyretica, and Ranunculus lingua (right part of Figure 4). It appears that the indicator value of some species should be adjusted in the future, e.g., Hydrocharis morsus-ranae and Potamogeton crispus should have their indicator value lowered. Table 7 presents the correlation among environmental factors in the ordination analysis for frequency and cover data. The Monte Carlo permutation test showed that only 5 of the 10 variables presented significant lambda-1 values (ʎ1 > 0.20; p < 0.05), while for conditional variance (ʎA > 0.05; p < 0.05) only six variables presented significant values.
3.4. Correlation between MIR and the Species Index Values of Other Macrophyte Coefficients
Additional analyses were completed to detect sources of differences in the response of various European macrophyte systems to the same environmental gradient. For this problem, the MIR coefficient was calculated for each survey site, but using indicator values assumed for the IBMR, MTR, RMNI, and ITEM methods (see Table S2). The calculated indices (MIRIBMR, MIRMTR, MIRRMNI, and MIRITEM) were compared with the main hydrochemical degradation gradient, determined on the basis of PCA (Table 8). It was found that in most cases the calculated MIRIBMR, MIRMTR, MIRRMNI, and MIRITEM showed better correlation with the environment variables than the original indicators (IBMR, MTR, RMNI, and ITEM, respectively; see Table 5) when their original formulae and sets of species were applied. However, the MIR index showed stronger correlation with the water quality gradient than the other analyzed indices.
4. Discussion
Analysis of the water quality dataset showed that the selected river sites represent a wide gradient of eutrophication, which is the major threat to rivers in Central Europe [35] and a serious problem in many other regions. PCA revealed that the major hydrochemical gradient was strongly positively correlated with various forms of nutrients, including both forms of phosphorus and nitrogen, which are the main cause of surface water eutrophication. Moreover, this gradient was strongly positively correlated with BOD, which indicates the potential oxygen deficit in the water, accompanying the eutrophication process. The gradient obtained was also positively correlated with conductivity, which indicates a wide range of chemicals dissolved in the water. There is no direct relationship between conductivity and eutrophication, but in the central European lowlands, in the absence of a mineral and marine salt supply, a higher conductivity value usually follows nutrient enrichment [36,37,38]. Because trophy is the factor that is most strongly indicated by macrophytes [39], our dataset provided a very convenient way to test macrophyte metrics. Moreover, by selecting a uniform river type and excluding heavily modified river sites, a high degree of environmental homogeneity was achieved, and the impact of trophy conditions on macrophytes could be precisely evaluated.
The results obtained showed a strong relationship between macrophytes and water quality, compared with various other studies based on macrophytes [28,37,40,41,42] and other organisms [39]. The strong relationship was clearly due to some extent to the quality of the data based on a single river type, where a lack of typological homogeneity is regarded as one of the major sources of uncertainty in ecological assessment [43]. Moreover, we achieved a significant reduction in interpersonal variability, because the macrophyte surveys were carried out by experienced experts trained by the present authors. This meant that interpersonal variability in our case was largely excluded, which removed a large source of uncertainty [30,44,45]. Furthermore, other studies have demonstrated that the MIR has relatively low resistance to measurement errors, compared with other methods based on phytobenthos and macroinvertebrates [46]. All of the aforementioned factors reducing uncertainty in our study provided favorable conditions to identify precisely the correlation between plant-based indices and environmental factors.
The research showed that the MIR index in its present form is well suited for the evaluation of the ecological status of Polish rivers. It was found to reflect well the trophic degradation of rivers, which is the most serious issue affecting surface waters in this part of Europe [35]. It was shown to respond much better to water quality changes than other coefficients of foreign origin—the Pearson’s correlation coefficient r was particularly high for the MIR index in relation to the synthetic trophic degradation gradient determined by PCA, but the values were usually also very high in the case of conductivity and phosphorus (both total and reactive). They were slightly lower for BOD, mineral nitrogen, total nitrogen, and ammonium nitrogen. The possibility of precise identification of threats related to eutrophication makes the MIR a very important tool in the process of river degradation monitoring for the requirements of the WFD, as well as a method of identifying threats caused by human activities.
The results of the completed study show that macrophyte methods developed in other countries are not as sensitive as the MIR, but still identify the undergoing eutrophication process to a large extent. The degradation gradient determined by PCA was particularly strongly detected by MTR (r = −0.79) and IBMR (r = −0.67). These indices were also strongly correlated with total and reactive phosphorus, as well as with conductivity. The obtained level of correlation was relatively high compared with other studies [37,40,47], and in our opinion, this results from the wide gradient, the size of the analyzed database, the homogeneity of the collected data in terms of habitat background, and the reduced personal variability.
According to the results of the research, the variability of the pH factor in water is not detected by the considered macrophyte metrics. It should be noted that the tested macrophyte methods were developed this century to evaluate the ecological status of water according to the requirements of the WFD [48]. The development of these methods was mainly focused on monitoring of the main factors responsible for the degradation of surface waters in Europe, which include eutrophication and, to a lesser extent, the hydromorphological factor [6,8,15,21,49]. It should be pointed out that the pH gradient in the studied rivers was very narrow, as the sandy lowland rivers of the whole Eastern European Lowlands have a rather uniform geology.
Our calculations showed that the indicator values determined for the MIR better reflect the water degradation gradient than the indicator values assumed for other methods (IBMR, MTR, RMNI, and ITEM). The analyses carried out with the use of a uniform formula revealed that the detected differences in biomonitoring result not only from the different equations used, but also from the set of species and their ascribed indicator values. The significant differentiation of sets of indicator species considered by various macrophyte systems on lowland rivers has already been demonstrated in the literature [50]. The weaker response of the foreign methods compared with the MIR persisted even when the assessment was based on a uniform equation. Indicator values of particular species differ between these methods, and it appears that those proposed for Poland (Table S1) best reflect the local conditions of the Polish lowland rivers.
The study showed that it is justified to develop separate macrophyte systems for geographically differing countries. The MIR index was better suited for the evaluation of ecological status in Poland than foreign indicators; thus it was better adjusted to the local conditions. A stronger correlation between the MIR index and environment gradients in Polish rivers had already been indicated by other authors [51,52] but the current research makes it possible to evaluate the sources of the differences. Moreover, the importance of the selection of the species set and the estimation of indicator values was proven. Therefore, for different geographic conditions, separate systems should be developed with different lists of indicator species and their indicative values should be verified according to local geographic and ecological conditions. For example, Apium nodiflorum, which is an important species in the British MTR system [5], is not present in the MIR system. Apium nodiflorum is a very rare species in Poland, and therefore its ecological preferences may not be precisely verified. On the other hand, the species Berula erecta, which also belongs to the family Apiacae, is included in the MIR system but not in MTR, as it occurs rarely in the British Isles. The introduction of separate systems or local modifications would enable the more precise identification of threats occurring in surface waters.
The pool of taxa recorded in the lowland rivers contained a smaller number of indicator species used in the MIR system than indicators used in RMNI and ITEM. Among exclusive RMNI and ITEM indicative taxa, many are not typical macrophytes, and in many cases they can be regarded as largely terrestrial plants. This provides a convincing explanation of the precision of the MIR method in water degradation detection, since typical aquatic plants are more sensitive to the water habitat [10,16]. A large proportion of emergent bank plants increases the variability of the bioindication process and prevents accurate assessment of the fluvial ecosystem.
The results were based on the category of small and medium lowland rivers, but the correlations demonstrated can also be expected to apply to other types of rivers in Poland and abroad. Our analysis focused on this category because it represents a widespread type of rivers in Europe [28,49]. Moreover, the biodiversity of rivers of this type is higher than that of other rivers [37], and analyses based on rich biological material can better reflect the processes taking place in ecosystems. It was shown by Budka [53] that a limited pool of indicator species reduces the quantity of ecological information provided by bioindication. The use of a species-rich habitat and a very common river type in our analysis increases the universal applicability of the results.
5. Conclusions
- The MIR index is well adjusted for river monitoring in Poland and responds strongly to trophic degradation, which is the main problem affecting surface waters in this country.
- The MIR index is better suited for river monitoring in the conditions found in Poland than foreign methods developed for the needs of other European countries, as it reflects better the conditions of trophic degradation of rivers. This is because of the higher number of local indicator species considered, as well as the fact that their indicator values better reflect local conditions.
- For the purposes of environment monitoring, it is justified to develop local methods of ecological status assessment in order to more precisely identify threats occurring in surface waters. We recommend the adjustment of indicative plant lists and verification of the ecological sensitivity of particular species in various ecological conditions.
- Macrophyte methods can be very helpful in the accurate evaluation of ecological status in Europe, because they are a sensitive indicator of river degradation.
Supplementary Materials
The following are available online at https://www.mdpi.com/2073-4441/12/1/108/s1, Table S1. List of indicator species utilised for calculating MIR index (l = species index value, w = species weight value), Table S2. List of aquatic plants recorded during surveys, which are utilized in macrophyte methods as MIR, IBMR, MTR, RMNI, ITEM, RI (TN river type) and shortcodes used in figures.
Author Contributions
Conceptualization, K.S., S.J., D.G., K.P.; Field Work and Data Preparation, K.P., S.J.; Methodology and Analysis, K.S., S.J.; Writing, K.S., D.G., S.J. All authors have read and agreed to the published version of the manuscript.
Funding
This research has been supported by Ministry of Science and Higher Education (project No. 2 PO4G 136 29) and co-financed within the framework of Ministry of Science and Higher Education programme as “Regional Initiative Excellence” in years 2019–2022 (project No.005/RID/2018/19).
Conflicts of Interest
The authors declare no conflict of interest.
References
- Birk, S.; Bonne, W.; Borja, A.; Brucet, S.; Courrat, A.; Poikane, S.; Solimini, A.G.; van de Bund, W.; Zampoukas, N.; Hering, D. Three hundred ways to assess Europe’s surface waters: An almost complete overview of biological methods to implement the Water Framework Directive. Ecol. Indic. 2012, 18, 31–41. [Google Scholar] [CrossRef]
- Umetsu, C.A.; Aguiar, F.C.; Ferreira, M.T.; Cancian, L.F.; Camargo, A.F.M. Addressing bioassessment of tropical rivers using macrophytes: The case of Itanhaem Basin, Sao Paulo, Brazil. Aquat. Bot. 2018, 150, 53–63. [Google Scholar] [CrossRef]
- Kennedy, M.P.; Lang, P.; Grimaldo, J.T.; Martins, S.V.; Bruce, A.; Hastie, A.; Lowe, S.; Ali, M.M.; Sichingabula, H.; Dallas, H.; et al. Environmental drivers of aquatic macrophyte communities in southern tropical African rivers: Zambia as a case study. Aquat. Bot. 2015, 124, 19–28. [Google Scholar] [CrossRef]
- Muratov, R.; Szoszkiewicz, K.; Zhamangara, A.; Jusik, S.; Gebler, D.; Beisenova, R.; Akbayeva, L. An attempt to prepare Macrophyte Index for Rivers for assessment watercourses in Kazakhstan. Meteorol. Hydrol. Water Manage. 2015, 3, 27–32. [Google Scholar] [CrossRef]
- Holmes, N.T.H.; Newman, J.R.; Chadd, S.; Rouen, K.J.; Saint, L.; Dawson, F.H. Mean Trophic Rank: A User’s Manual; R&D Technical Report E38; Environment Agency: Bristol, UK, 1999; p. 142.
- Schneider, S.; Melzer, A. The Trophic Index of Macrophytes (TIM)—A New Tool for Indicating the Trophic State of Running Waters. Int. Rev. Hydrobiol. 2003, 88, 49–67. [Google Scholar] [CrossRef]
- Haury, J. Assessing functional typology involving water quality, physical features and macrophytes in a Normandy river. Hydrobiologia 1996, 340, 43–49. [Google Scholar] [CrossRef]
- Haury, J.; Peltre, M.-C.; Trémolières, M.; Barbe, J.; Thiébaut, G.; Bernez, I.; Daniel, H.; Chatenet, P.; Haan-Archipof, G.; Muller, S.; et al. A new method to assess water trophy and organic pollution—The Macrophytes Biological Index for Rivers (IBMR): Its application to different types of river and pollution. Hydrobiologia 2006, 570, 153–158. [Google Scholar] [CrossRef]
- Stefanidis, K.; Papastergiadou, E. Linkages between Macrophyte Functional Traits and Water Quality: Insights from a Study in Freshwater Lakes of Greece. Water 2019, 11, 1047. [Google Scholar] [CrossRef] [Green Version]
- Tremp, H.; Kohler, A. The usefulness of macrophyte monitoring-systems, exemplified on eutrophication and acidification of running waters. Acta Botanica Gallica 1995, 142, 541–550. [Google Scholar] [CrossRef] [Green Version]
- Marcinkowski, P.; Kiczko, A.; Okruszko, T. Model-Based Analysis of Macrophytes Role in the Flow Distribution in the Anastomosing River System. Water 2018, 10, 953. [Google Scholar] [CrossRef] [Green Version]
- Bornette, G.; Puijalon, S. Response of aquatic plants to abiotic factors: A review. Aquat. Sci. 2011, 73, 1–14. [Google Scholar] [CrossRef]
- Melzer, A. Aquatic macrophytes as tools for lake management. In The Ecological Bases for Lake and Reservoir Management; Springer: Dordrecht, The Netherlands, 1999; pp. 181–190. [Google Scholar] [CrossRef] [Green Version]
- Passauer, B.; Meilinger, P.; Melzer, A.; Schneider, S. Does the structural quality of running waters affect the occurrence of macrophytes? Acta Hydroch. Hydrob. 2002, 30, 197–206. [Google Scholar] [CrossRef]
- Schaumburg, J.; Schranz, C.; Foerster, J.; Gutowski, A.; Hofmann, G.; Meilinger, P.; Schneider, S.; Schmedtje, U. Ecological classification of macrophytes and phytobenthos for rivers in Germany according to the water framework directive. Limnologica 2004, 34, 283–301. [Google Scholar] [CrossRef] [Green Version]
- Meilinger, P.; Schneider, S.; Melzer, A. The Reference Index Method for the Macrophyte-Based Assessment of Rivers—A Contribution to the Implementation of the European Water Framework Directive in Germany. Int. Rev. Hydrobiol 2005, 90, 322–342. [Google Scholar] [CrossRef]
- Furse, M.; Hering, D.; Moog, O.; Verdonschot, P.; Johnson, R.K.; Brabec, K.; Gritzalis, K.; Buffagni, A.; Pinto, P.; Friberg, N.; et al. The STAR project: Context, objectives and approaches. Hydrobiologia 2006, 566, 3–29. [Google Scholar] [CrossRef]
- Brabec, K.; Szoszkiewicz, K. Macrophytes and diatoms—Major results and conclusions from the STAR project. Hydrobiologia 2006, 566, 175–178. [Google Scholar] [CrossRef]
- Grinberga, L. Environmental factors influencing the species diversity of macrophytes in middle-sized streams in Latvia. Hydrobiologia 2010, 656, 233–241. [Google Scholar] [CrossRef]
- Szoszkiewicz, K.; Karolewicz, K.; Ławniczak, A.; Dawson, F.H. An assessment of the MTR aquatic plant system for determining the trophic status of Polish rivers. Pol. J. Environ. Stud. 2002, 11, 421–427. [Google Scholar]
- Willby, N.; Pitt, J.A.; Phillips, G. The Ecological Classification of UK Rivers Using Aquatic Macrophytes; Science Report; Environment Agency: Bristol, UK, 2012; p. 221.
- Baattrup-Pedersen, A.; Andersson, B.; Brandrud, T.E.; Karttunen, K.; Riis, T.; Toivonen, H. Macrophytes. In Biological Monitoring in Nordic Rivers and Lakes; Skriver, J., Ed.; Nordic Council of Ministers: Copenhagen, Denmark, 2001; pp. 53–60. [Google Scholar]
- Pall, K.; Mayerhofer, V. Leitfaden zur Erhebung Biologischer Qualitätselemente, Teil A4—Makrophyten; Bundesministerium für Land- und Forstwirtschaft, Umwelt und Wasserwirtschaft (Hrsg.): Vienna, Austria, 2013; p. 65. [Google Scholar]
- Jusik, S.; Szoszkiewicz, K.; Kupiec, J.; Lewin, I.; Samecka-Cymerman, A. Development of comprehensive river typology based on macrophytes in the mountain-lowland gradient of different Central European ecoregions. Hydrobiologia 2015, 745, 241–262. [Google Scholar] [CrossRef] [Green Version]
- Gebler, D.; Szoszkiewicz, K.; Pietruczuk, K. Modeling of the river ecological status with macrophytes using artificial neural networks. Limnologica 2017, 65, 46–54. [Google Scholar] [CrossRef]
- Szoszkiewicz, K.; Jusik, S.; Ławniczak, A.E.; Zgola, T. Macrophyte development in unimpacted lowland rivers in Poland. Hydrobiologia 2010, 656, 117–131. [Google Scholar] [CrossRef] [Green Version]
- Szoszkiewicz, K.; Jusik, S.; Lewin, I.; Czerniawska-Kusza, I.; Kupiec, J.M.; Szostak, M. Macrophyte and macroinvertebrate patterns in unimpacted mountain rivers of two European ecoregions. Hydrobiologia 2018, 805, 327–342. [Google Scholar] [CrossRef] [Green Version]
- Birk, S.B.; Willby, N.J. Towards harmonization of ecological quality classification: Establishing common grounds in European macrophyte assessment for rivers. Hydrobiologia 2010, 652, 149–163. [Google Scholar] [CrossRef]
- Szoszkiewicz, K.; Zbierska, J.; Jusik, S.; Zgola, T. Metodyka Badań Terenowych Makrofitów na Potrzeby Rutynowego Monitoringu Rzek [Macrophyte Survey Manual for the Purpose of River Monitoring]; Bogucki Wydawnictwo Naukowe: Poznan, Poland, 2009; p. 81. [Google Scholar]
- Szoszkiewicz, K.; Jusik, S.; Zgola, T.; Czechowska, M.; Hryc, B. Uncertinity of macrophyte-based monitoring in different river types. Belg. J. Bot. 2007, 140, 7–16. [Google Scholar]
- STATISTICA (Data Analysis Software System), Version 13; StatSoft, Inc.: Tulsa, OK, USA, 2019; Available online: www.statsoft.com (accessed on 31 July 2019).
- Ter Braak, C.J.F.; Smilauer, P. CANOCO Reference Manual and CanoDraw for Windows User’s Guide: Software for Canonical Community Ordination (Version 4.5); Biometris: Ithaca, NY, USA, 2002; p. 500. [Google Scholar]
- Hill, M.O.; Gauch, H.G., Jr. Detrended correspondence analysis: An improved ordination technique. Vegetatio 1980, 42, 47–58. [Google Scholar] [CrossRef]
- Gill, P.M.W. Efficient calculation of p-values in linear-statistic permutation significance tests. J. Stat. Comput. Simul. 2007, 77, 55–61. [Google Scholar] [CrossRef] [Green Version]
- EEA. European Waters—Assessment of Status and Pressures; European Environment Agency: Copenhagen, Denmark, 2012; p. 96.
- Demars, B.O.L.; Thiebaut, G. Distribution of aquatic plants in the Northern Vosges rivers: Implications for biomonitoring and conservation. Aquat. Conserv. Mar. Freshwater Ecosyst. 2008, 18, 619–632. [Google Scholar] [CrossRef]
- Szoszkiewicz, K.; Ferreira, M.T.; Korte, T.; Baattrup-Pedersen, A.; Davy-Bowker, J.; O’Hare, M. European river plant communities: The importance of organic pollution and the usefulness of existing macrophyte metrics. Hydrobiologia 2006, 566, 211–234. [Google Scholar] [CrossRef]
- Wiegleb, G.; Herr, W.; Zander, B.; Broring, U.; Brux, H.; van de Weyer, K. Natural variation of macrophyte vegetation in lowland streams at the regional level. Limnologica 2015, 51, 53–62. [Google Scholar] [CrossRef] [Green Version]
- Hering, D.; Johnson, R.K.; Kramm, S.; Schmutz, S.; Szoszkiewicz, K.; Verdonschot, P.F.M. Assessment of European rivers with diatoms, macrophytes, invertebrates and fish: A comparative metric-based analysis of organism response to stress. Freshwater Biol. 2006, 51, 1757–1785. [Google Scholar] [CrossRef]
- Aguiar, F.C.; Feio, M.J.; Ferreira, M.T. Choosing the best method for stream bioassessment using macrophyte communities: Indices and predictive models. Ecol. Indic. 2011, 11, 379–388. [Google Scholar] [CrossRef]
- Baláži, P.; Hrivnák, R. Bryophytes and macro-algal growths as a part of macrophyte monitoring in rivers used for ecological assessment. Knowl. Manage. Aquat. Ecosyst. 2015, 416, 19. [Google Scholar] [CrossRef] [Green Version]
- Vieira, C.; Aguiar, F.C.; Ferreira, M.T. The relevance of bryophytes in the macrophyte-based reference conditions in Portuguese rivers. Hydrobiologia 2014, 737, 245–264. [Google Scholar] [CrossRef]
- Hering, D.; Borja, A.; Carstensen, J.; Carvalho, L.; Elliott, M.; Feld, C.K.; Heiskanen, A.-S.; Johnson, R.K.; Moe, J.; Pont, D.; et al. The European Water Framework Directive at the age of 10: A critical review of the achievements with recommendations for the future. Sci. Total. Environ. 2010, 408, 4007–4019. [Google Scholar] [CrossRef] [Green Version]
- Staniszewski, R.; Szoszkiewicz, K.; Zbierska, J.; Lesny, J.; Jusik, S.; Clarke, R.T. Assessment of sources of uncertainty in macrophyte surveys and the consequences for river classification. Hydrobiologia 2006, 566, 235–246. [Google Scholar] [CrossRef]
- Szoszkiewicz, K.; Zbierska, J.; Staniszewski, R.; Jusik, S. The variability of macrophyte metrics used in river monitoring. Oceanol. Hydrobiol. Stud. 2009, 38, 117–126. [Google Scholar] [CrossRef]
- Loga, M.; Wierzchołowska-Dziedzic, A. Probability of misclassifying biological elements in surface waters. Environ. Monit. Assess. 2017, 189, 647. [Google Scholar] [CrossRef] [Green Version]
- Demars, B.O.L.; Potts, J.M.; Tremolieres, M.; Thiebaut, G.; Gougelin, N.; Nordmann, V. River macrophyte indices: Not the Holy Grail! Freshwater Biol. 2012, 57, 1745–1759. [Google Scholar] [CrossRef]
- The European Parliament and the Council. Directive 2000/60/EC of the European Parliament and of the Council Establishing a Framework for Community Action in the Field of Water Policy. Available online: http://eur-lex.europa.eu/resource.html?uri=cellar:5c835afb-2ec6-4577-bdf8-756d3d694eeb.0004.02/DOC_1&format=PDF (accessed on 17 June 2019).
- Birk, S.; Korte, T.; Hering, D. Intercalibration of assessment methods for macrophytes in lowland streams: Direct comparison and analysis of common metrics. Hydrobiologia 2006, 566, 417–430. [Google Scholar] [CrossRef]
- Tomczyk, P.; Wiatkowski, M.; Gruss, Ł. Application of Macrophytes to the Assessment and Classification of Ecological Status above and below the Barrage with Hydroelectric Buildings. Water 2019, 11, 1028. [Google Scholar] [CrossRef] [Green Version]
- Szoszkiewicz, K.; Budka, A.; Pietruczuk, K.; Kayzer, D.; Gebler, D. Is the macrophyte diversification along the trophic gradient distinct enough for river monitoring? Environ. Monit. Assess. 2017, 189, 4. [Google Scholar] [CrossRef] [PubMed] [Green Version]
- Gebler, D.; Wiegleb, G.; Szoszkiewicz, K. Integrating river hydromorphology and water quality into ecological status modelling by artificial neural networks. Water Res. 2018, 139, 395–405. [Google Scholar] [CrossRef] [PubMed]
- Budka, A. How many indicator species are required to assess the ecological status of a river? Oceanol. Hydrobiol. Stud. 2018, 48, 1–12. [Google Scholar] [CrossRef]
Figure 1.
Distribution of the survey sites throughout the lowland part of Poland.

Figure 2.
Macrophyte taxa in descending order according to median of total phosphorus (range of quartiles marked). Abbreviations of macrophytes are explained in Table S2. Macrophyte Index for Rivers (MIR) indicator values (l) are shown in brackets.
Figure 2.
Macrophyte taxa in descending order according to median of total phosphorus (range of quartiles marked). Abbreviations of macrophytes are explained in Table S2. Macrophyte Index for Rivers (MIR) indicator values (l) are shown in brackets.

Figure 3.
Macrophyte taxa in descending order according to median of PCA Factor 1 (range of quartiles marked). Abbreviations of the macrophytes are explained in Table S2. MIR indicator values (l) are shown in brackets.
Figure 3.
Macrophyte taxa in descending order according to median of PCA Factor 1 (range of quartiles marked). Abbreviations of the macrophytes are explained in Table S2. MIR indicator values (l) are shown in brackets.

Figure 4.
CCA ordination diagram of macrophyte species and environmental variables. Full names of metrics are given in Table 1, and full names of macrophyte taxa are given in Table S2.


Table 1.
List of chemical parameters analyzed in the surveyed rivers.
| Parameter | Units | Transformation | Short Code |
|---|---|---|---|
| pH | pH | − | pH |
| BOD–5 days | mg O2·L−1 | − | BOD |
| Conductivity | μS·cm−1 | − | Cond |
| Ammonium | mg NNH4+·L−1 | ln (x + 1) | N-NH4 |
| Nitrate | mg NNO3−·L−1 | ln (x + 1) | N-NO3 |
| Mineral nitrogen | mg N·L−1 | ln (x + 1) | N-mineral |
| Organic nitrogen | mg N·L−1 | ln (x + 1) | N-organic |
| Total nitrogen | mg N·L−1 | ln (x + 1) | N-total |
| Soluble phosphates | mg PO43−·L−1 | ln (x + 1) | P-PO4 |
| Total phosphorus | mg P·L−1 | ln (x + 1) | P-total |
Table 2.
Chemical characteristics of the surveyed rivers (Transformations are given in Table 1).
Table 2.
Chemical characteristics of the surveyed rivers (Transformations are given in Table 1).
| Parameter | Raw Data Mean | Transformed Data Mean | Median | Min | Max |
|---|---|---|---|---|---|
| pH | 7.82 | − | 7.86 | 7.21 | 8.51 |
| BOD | 2.98 | − | 2.69 | 0.10 | 6.51 |
| Cond | 575 | − | 545 | 145 | 1202 |
| N-NH4 | 2.13 | 1.63 | 1.67 | 0.02 | 12.49 |
| N-NO3 | 0.63 | 0.45 | 0.21 | 0.01 | 4.78 |
| N-mineral | 2.76 | 2.08 | 2.03 | 0.04 | 13.70 |
| N-organic | 1.35 | 1.25 | 1.17 | 0.45 | 6.18 |
| N-total | 4.11 | 3.38 | 3.18 | 0.58 | 15.80 |
| P-PO4 | 0.51 | 0.45 | 0.33 | 0.03 | 2.25 |
| P-total | 0.26 | 0.22 | 0.18 | 0.04 | 1.16 |
Table 3.
Principal component analysis of the chemical variables. Varimax normalized rotation.
| Variable | Factor 1 | Factor 2 |
|---|---|---|
| pH | −0.024 | 0.906 |
| BOD | 0.738 | −0.044 |
| Cond | 0.920 | 0.001 |
| N-NH4 | 0.809 | 0.242 |
| N-NO3 | 0.787 | −0.335 |
| N-mineral | 0.922 | 0.072 |
| N-organic | 0.709 | −0.299 |
| N-total | 0.951 | −0.012 |
| P-PO4 | 0.911 | −0.158 |
| P-total | 0.905 | −0.168 |
| Explained variance | 7.346 | 1.154 |
| Percentage of variance | 66.8% | 10.5% |
Table 4.
The number of indicator taxa used by various macrophyte systems and species recorded in the surveyed rivers.
Table 4.
The number of indicator taxa used by various macrophyte systems and species recorded in the surveyed rivers.
| Macrophyte Index | Number of Taxa in the System | Number of Indicative Taxa Detected | Percentage of Indicative Taxa Detected |
|---|---|---|---|
| MIR | 153 | 97 | 63.4 |
| IBMR | 210 | 79 | 37.6 |
| MTR | 129 | 67 | 51.9 |
| RMNI | 391 | 112 | 28.6 |
| ITEM | 337 | 100 | 29.7 |
| RI | 208 (103 *) | 52 | 25.0 (50.5 *) |
* Taxa only in lowland rivers (TN river type).
Table 5.
Comparison of Pearson’s correlation coefficients (r) between macrophyte metrics and environmental variables in Polish lowland rivers (n = 100). Significant correlations at p < 0.05 are marked in red.
Table 5.
Comparison of Pearson’s correlation coefficients (r) between macrophyte metrics and environmental variables in Polish lowland rivers (n = 100). Significant correlations at p < 0.05 are marked in red.
| Variable | MIR | IBMR | MTR | RMNI | ITEM | RI |
|---|---|---|---|---|---|---|
| pH | 0.09 | 0.01 | −0.10 | −0.04 | −0.21 | 0.21 |
| BOD | −0.71 | −0.63 | −0.67 | 0.47 | 0.54 | −0.43 |
| Cond | −0.82 | −0.62 | −0.73 | 0.55 | 0.55 | −0.44 |
| N-NH4 | −0.69 | −0.47 | −0.61 | 0.36 | 0.38 | −0.38 |
| N-NO3 | −0.61 | −0.50 | −0.52 | 0.48 | 0.47 | −0.36 |
| N-mineral | −0.74 | −0.56 | −0.65 | 0.52 | 0.52 | −0.43 |
| N-organic | −0.64 | −0.49 | −0.59 | 0.40 | 0.43 | −0.46 |
| N-total | −0.77 | −0.60 | −0.68 | 0.54 | 0.54 | −0.47 |
| P-PO4 | −0.81 | −0.55 | −0.73 | 0.45 | 0.43 | −0.40 |
| P-total | −0.81 | −0.56 | −0.75 | 0.46 | 0.45 | −0.44 |
| PCA Factor 1 | −0.88 | −0.68 | −0.80 | 0.58 | 0.58 | −0.49 |
Table 6.
Spearman’s rank correlation between indicator values of different macrophyte metrics (MIR, IBMR, MTR, RMNI, and ITEM) and environmental factors (median of total phosphorus concentration and general trophic degradation gradient—PCA Factor 1) for 51 indicative macrophytes detected at a minimum of four river sites. Significant correlations at p < 0.05 are marked in red.
| Variable | Indicator Value in Macrophyte Methods | ||||
|---|---|---|---|---|---|
| MIR–l | IBMR–cs | MTR–str | RMNI | ITEM | |
| P-total | −0.78 | −0.67 | −0.76 | 0.51 | 0.69 |
| PCA Factor 1 | −0.75 | −0.65 | −0.76 | 0.50 | 0.67 |
Table 7.
Results of Monte Carlo permutation test of the relationship between species composition and environmental variables.
Table 7.
Results of Monte Carlo permutation test of the relationship between species composition and environmental variables.
| Variables | Marginal Effects | Conditional Effects | ||
|---|---|---|---|---|
| Lambda-1 | Lambda-A | P | F | |
| MIR | 0.29 | 0.29 | 0.002 | 6.87 |
| PCA Factor 1 | 0.22 | 0.04 | 0.632 | 0.90 |
| P-total | 0.21 | 0.06 | 0.003 | 1.88 |
| P-PO4 | 0.20 | 0.08 | 0.002 | 1.97 |
| Cond | 0.20 | 0.05 | 0.242 | 1.14 |
| BOD | 0.19 | 0.06 | 0.018 | 1.57 |
| N-total | 0.18 | 0.03 | 0.922 | 0.68 |
| N-NH4 | 0.15 | 0.03 | 0.790 | 0.80 |
| N-NO3 | 0.14 | 0.06 | 0.018 | 1.58 |
| pH | 0.08 | 0.07 | 0.004 | 1.70 |
Lambda-1 is the proportion of variance explained by each single environmental variable, and Lambda-A is the proportion of conditional variance explained by the variable in forward selection. Full names of metrics are given in Table 1.
Table 8.
Comparison of Pearson’s correlation coefficients (r) between various environmental variables and the MIR index based on original indicative species values (MIR) and values recommended for other metrics (IBMR, MTR, RMNI, ITEM). Significant correlations at p < 0.05 are marked in red.
Table 8.
Comparison of Pearson’s correlation coefficients (r) between various environmental variables and the MIR index based on original indicative species values (MIR) and values recommended for other metrics (IBMR, MTR, RMNI, ITEM). Significant correlations at p < 0.05 are marked in red.
| Variable | MIR | MIRIBMR | MIRMTR | MIRRMNI | MIRITEM |
|---|---|---|---|---|---|
| pH | 0.09 | 0.01 | −0.07 | −0.01 | −0.21 |
| BOD | −0.71 | −0.71 | −0.69 | 0.55 | 0.60 |
| Cond | −0.82 | −0.77 | −0.74 | 0.65 | 0.62 |
| N-NH4 | −0.69 | −0.62 | −0.64 | 0.47 | 0.47 |
| N-NO3 | −0.61 | −0.58 | −0.54 | 0.53 | 0.52 |
| N-mineral | −0.74 | −0.68 | −0.66 | 0.59 | 0.58 |
| N-organic | −0.64 | −0.57 | −0.61 | 0.46 | 0.49 |
| N-total | −0.77 | −0.71 | −0.70 | 0.62 | 0.61 |
| P-PO4 | −0.81 | −0.73 | −0.75 | 0.57 | 0.54 |
| P-total | −0.81 | −0.72 | −0.77 | 0.58 | 0.55 |
| PCA Factor 1 | −0.88 | −0.82 | −0.82 | 0.68 | 0.66 |
© 2019 by the authors. Licensee MDPI, Basel, Switzerland. This article is an open access article distributed under the terms and conditions of the Creative Commons Attribution (CC BY) license (http://creativecommons.org/licenses/by/4.0/).
Share and Cite
MDPI and ACS Style
Szoszkiewicz, K.; Jusik, S.; Pietruczuk, K.; Gebler, D. The Macrophyte Index for Rivers (MIR) as an Advantageous Approach to Running Water Assessment in Local Geographical Conditions. Water 2020, 12, 108. https://doi.org/10.3390/w12010108
AMA Style
Szoszkiewicz K, Jusik S, Pietruczuk K, Gebler D. The Macrophyte Index for Rivers (MIR) as an Advantageous Approach to Running Water Assessment in Local Geographical Conditions. Water. 2020; 12(1):108. https://doi.org/10.3390/w12010108
Chicago/Turabian StyleSzoszkiewicz, Krzysztof, Szymon Jusik, Karol Pietruczuk, and Daniel Gebler. 2020. "The Macrophyte Index for Rivers (MIR) as an Advantageous Approach to Running Water Assessment in Local Geographical Conditions" Water 12, no. 1: 108. https://doi.org/10.3390/w12010108
Note that from the first issue of 2016, this journal uses article numbers instead of page numbers. See further details here.