Mechanism of Riparian Vegetation Growth and Sediment Transport Interaction in Floodplain: A Dynamic Riparian Vegetation Model (DRIPVEM) Approach

Abstract
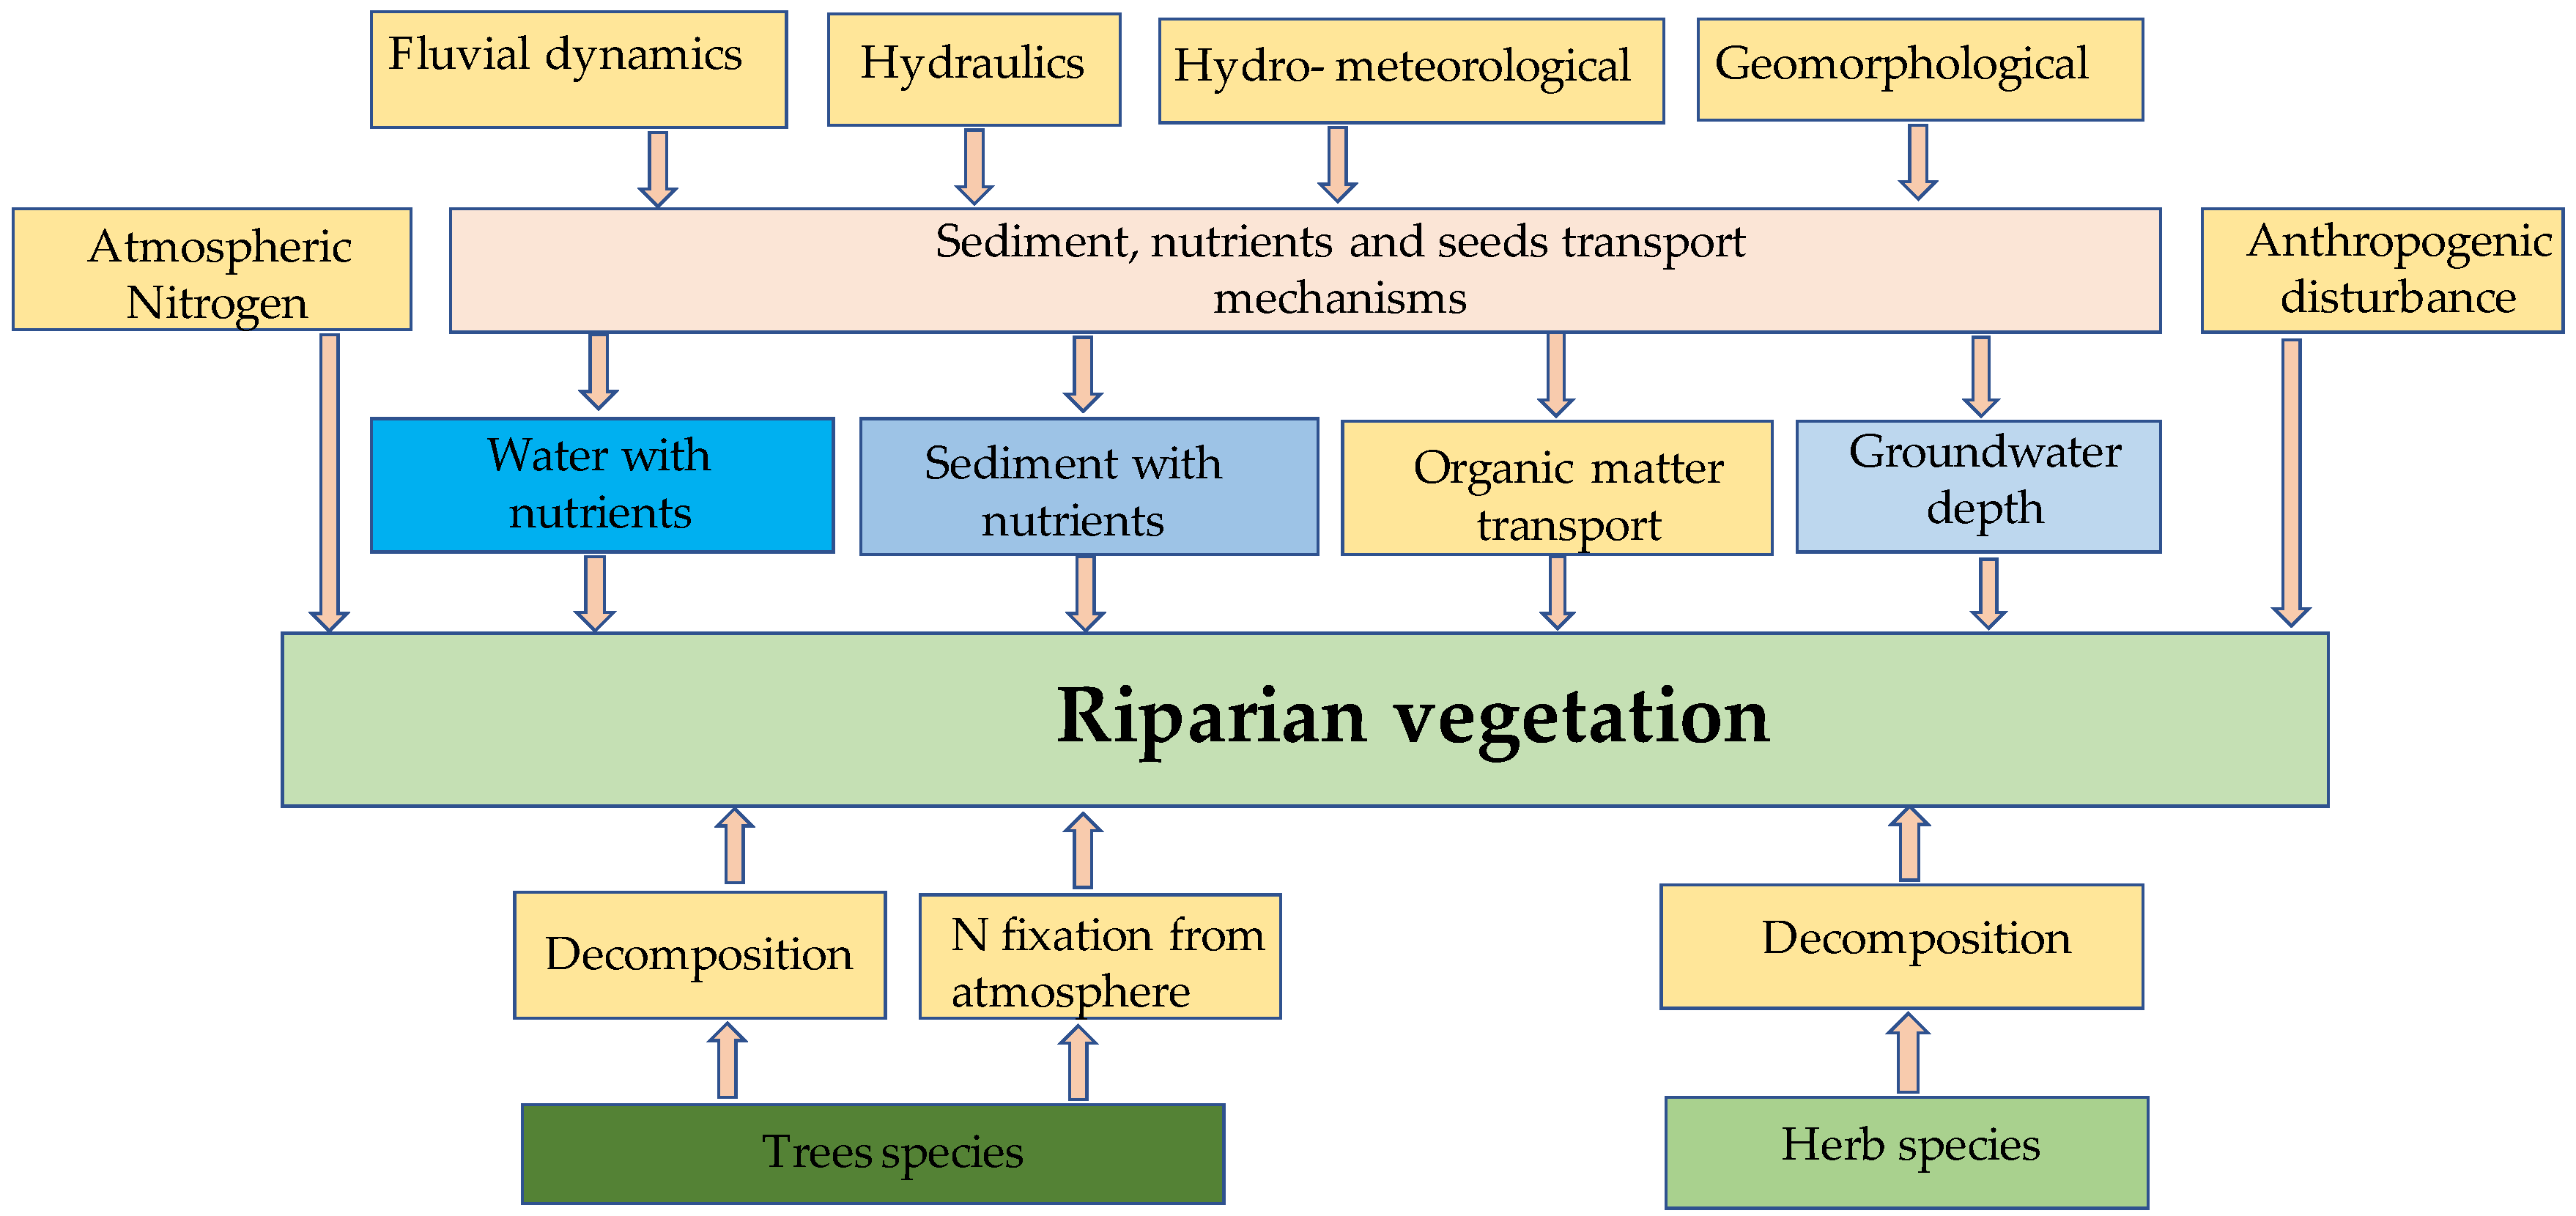
:1. Introduction
2. Materials and Methods
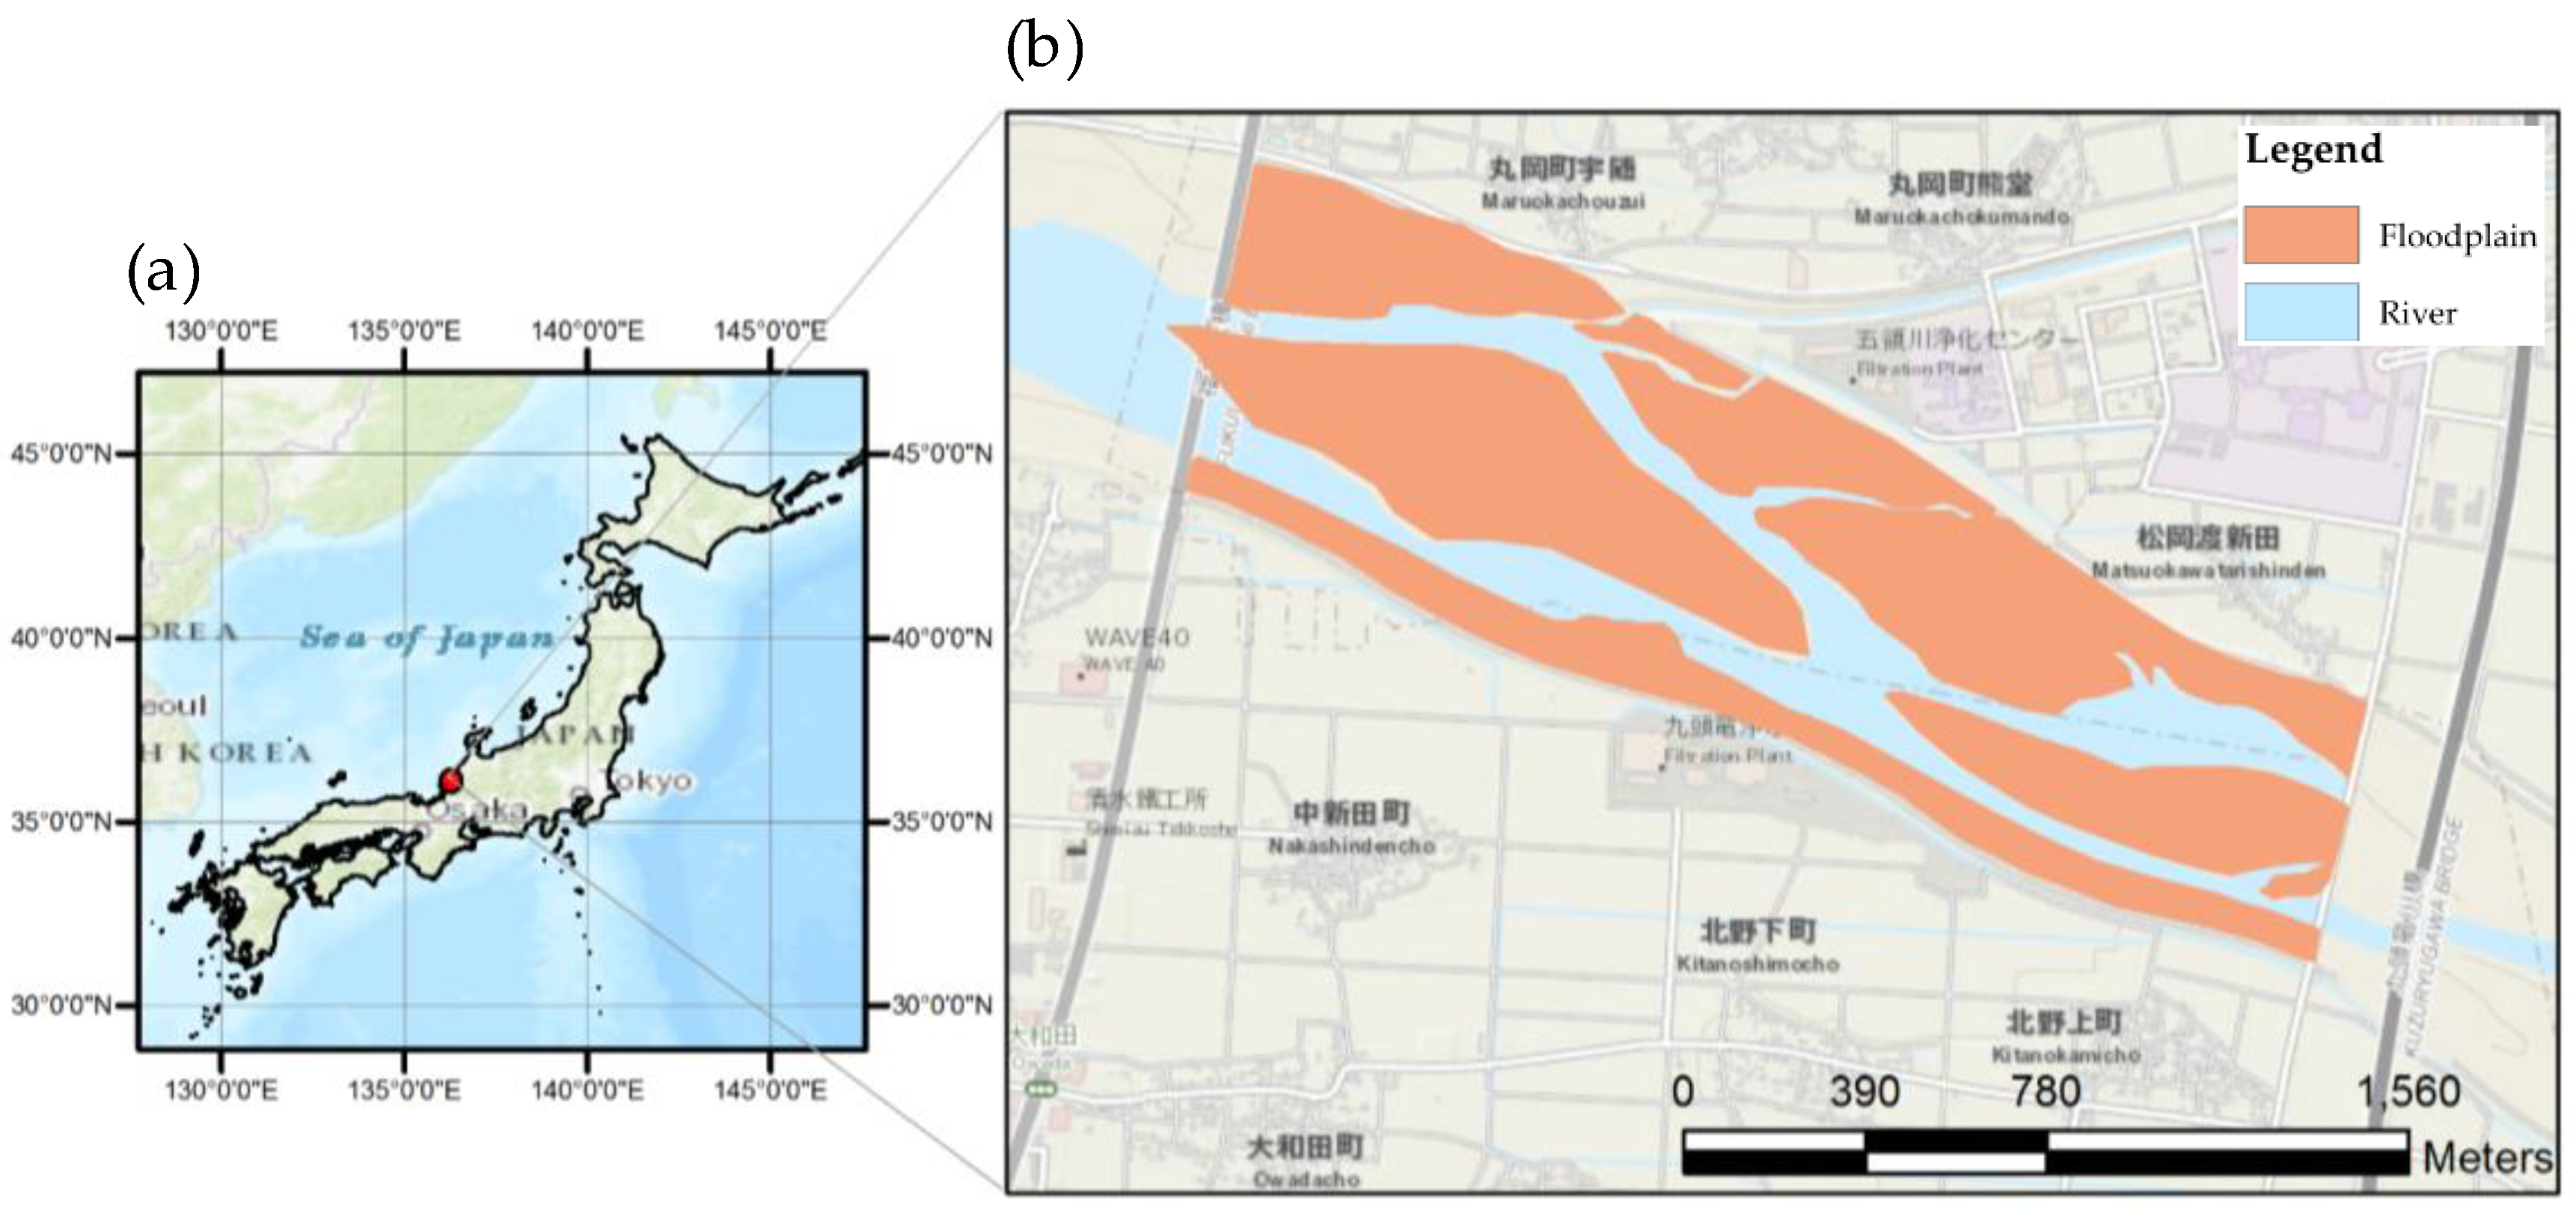
2.1. Study Site Description
2.2. Model Development
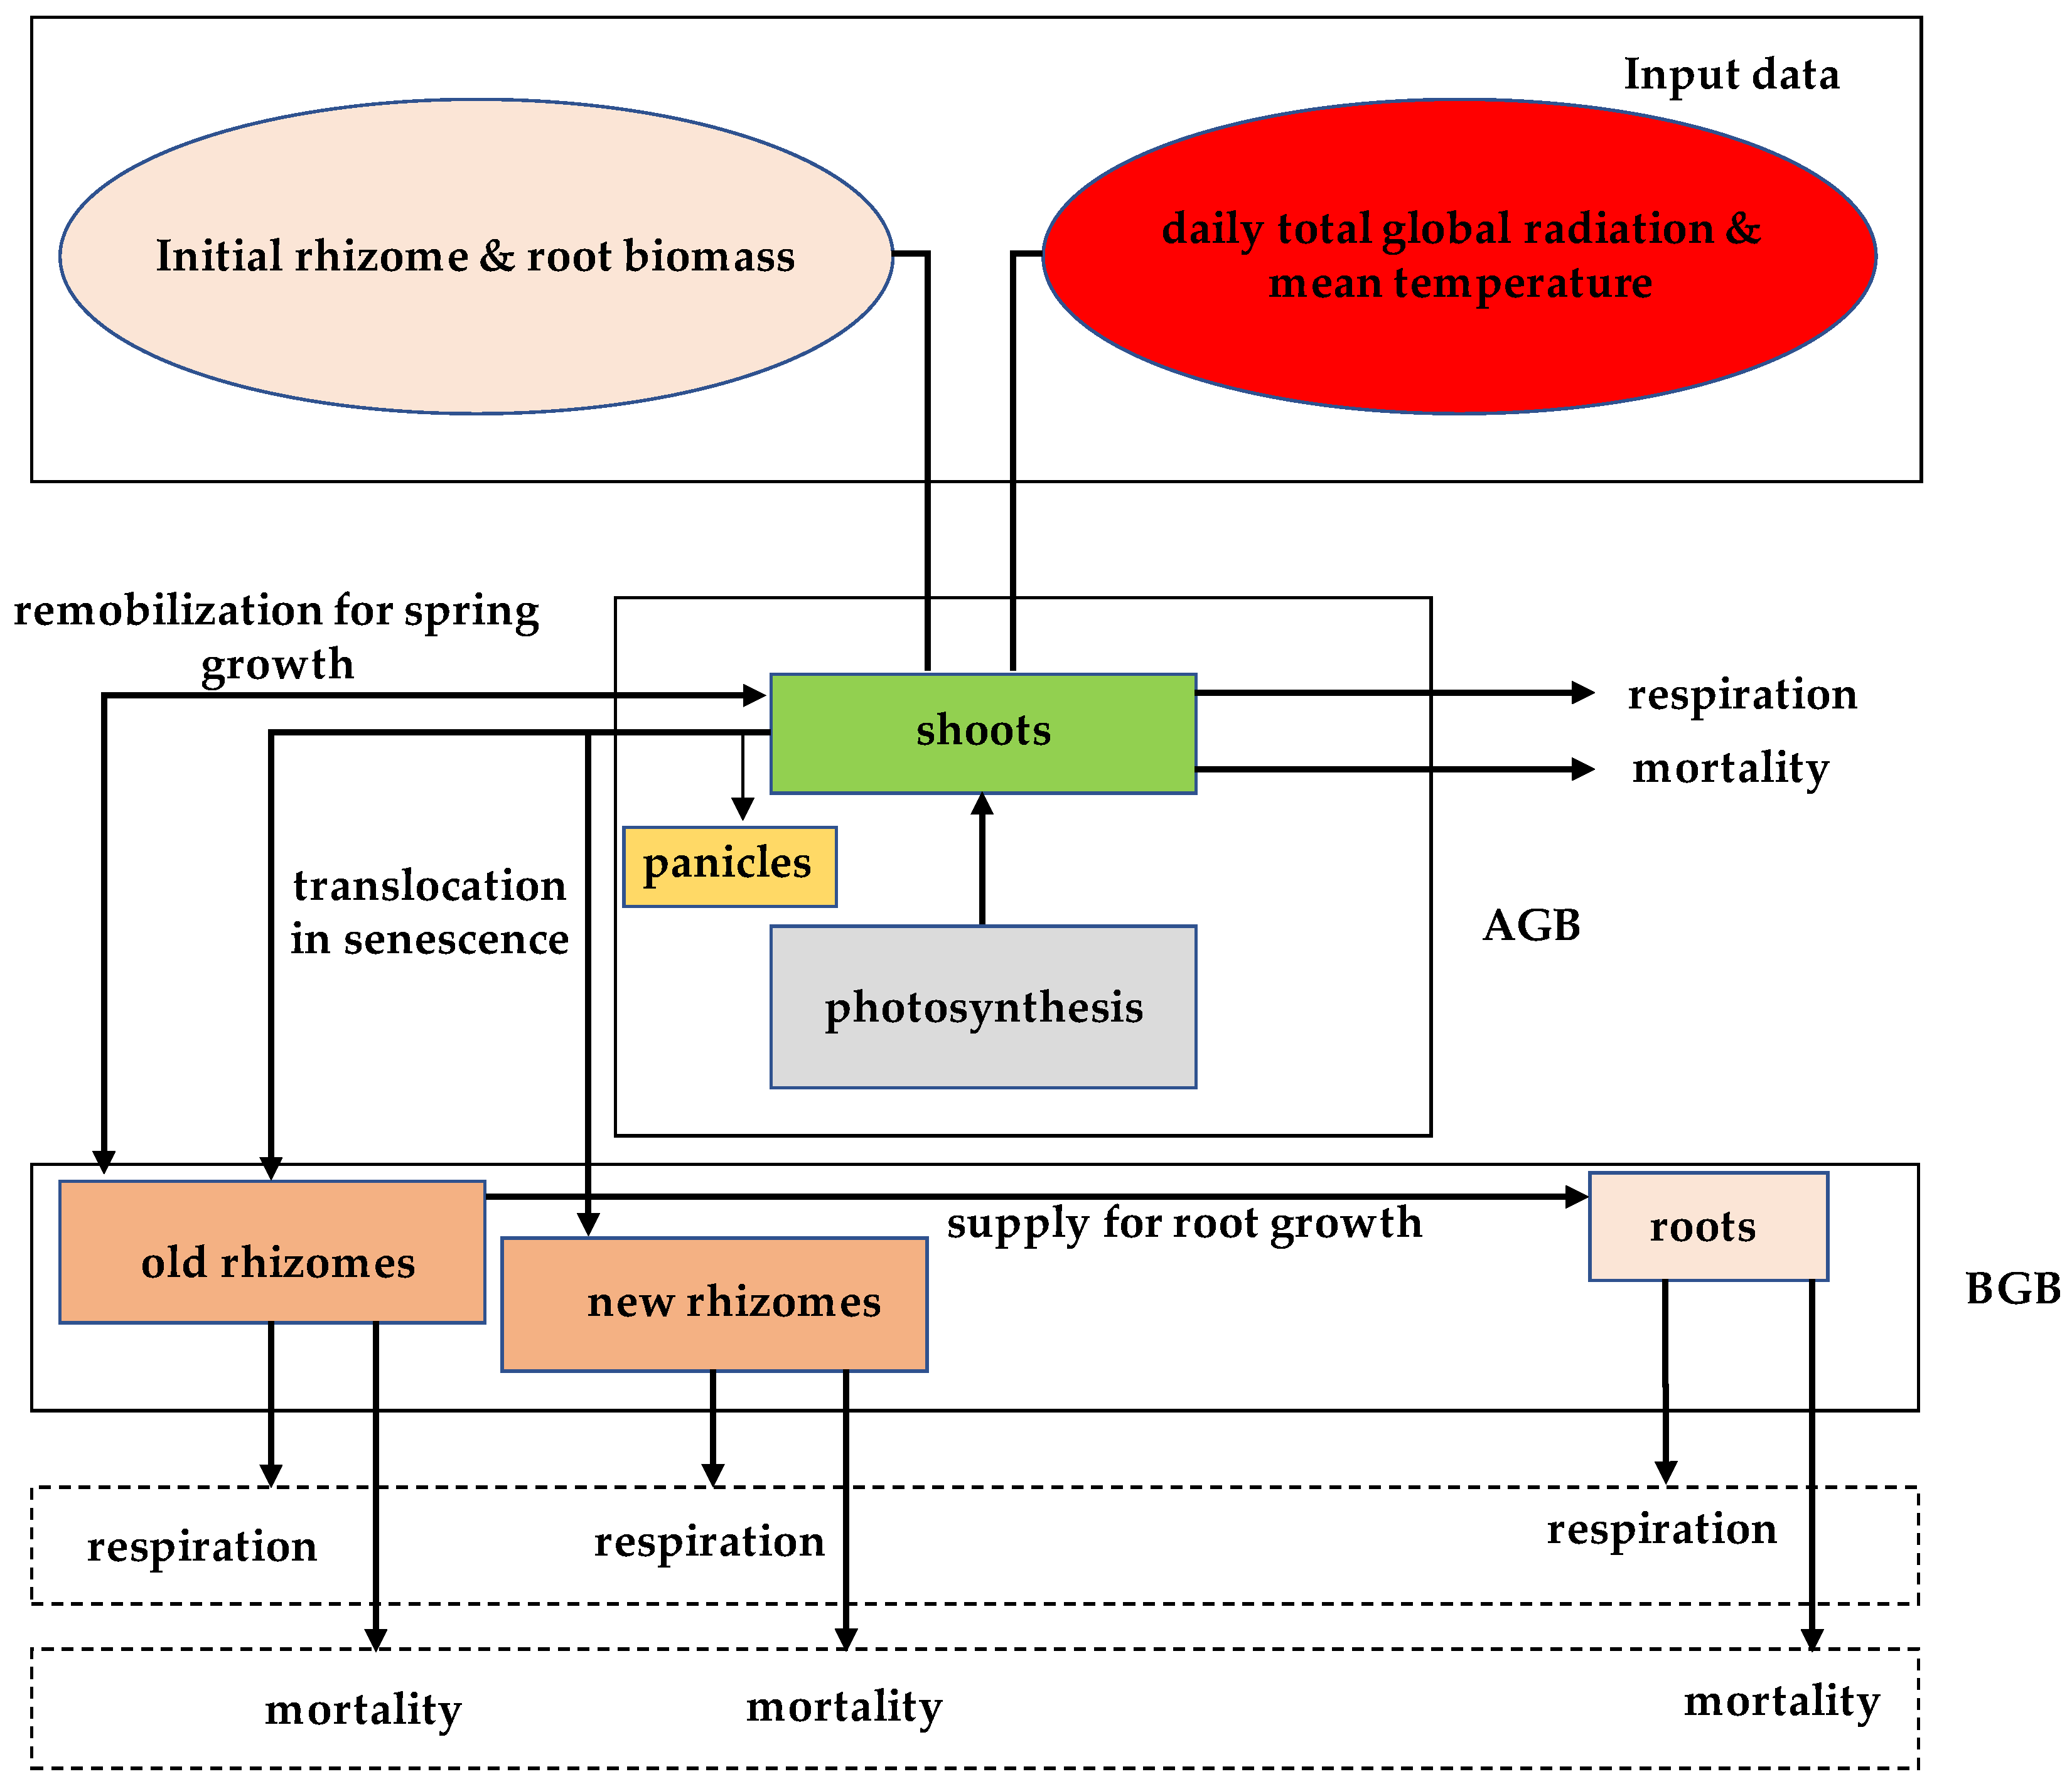
2.2.1. Dynamic Herbaceous Model for Monospecific Stand
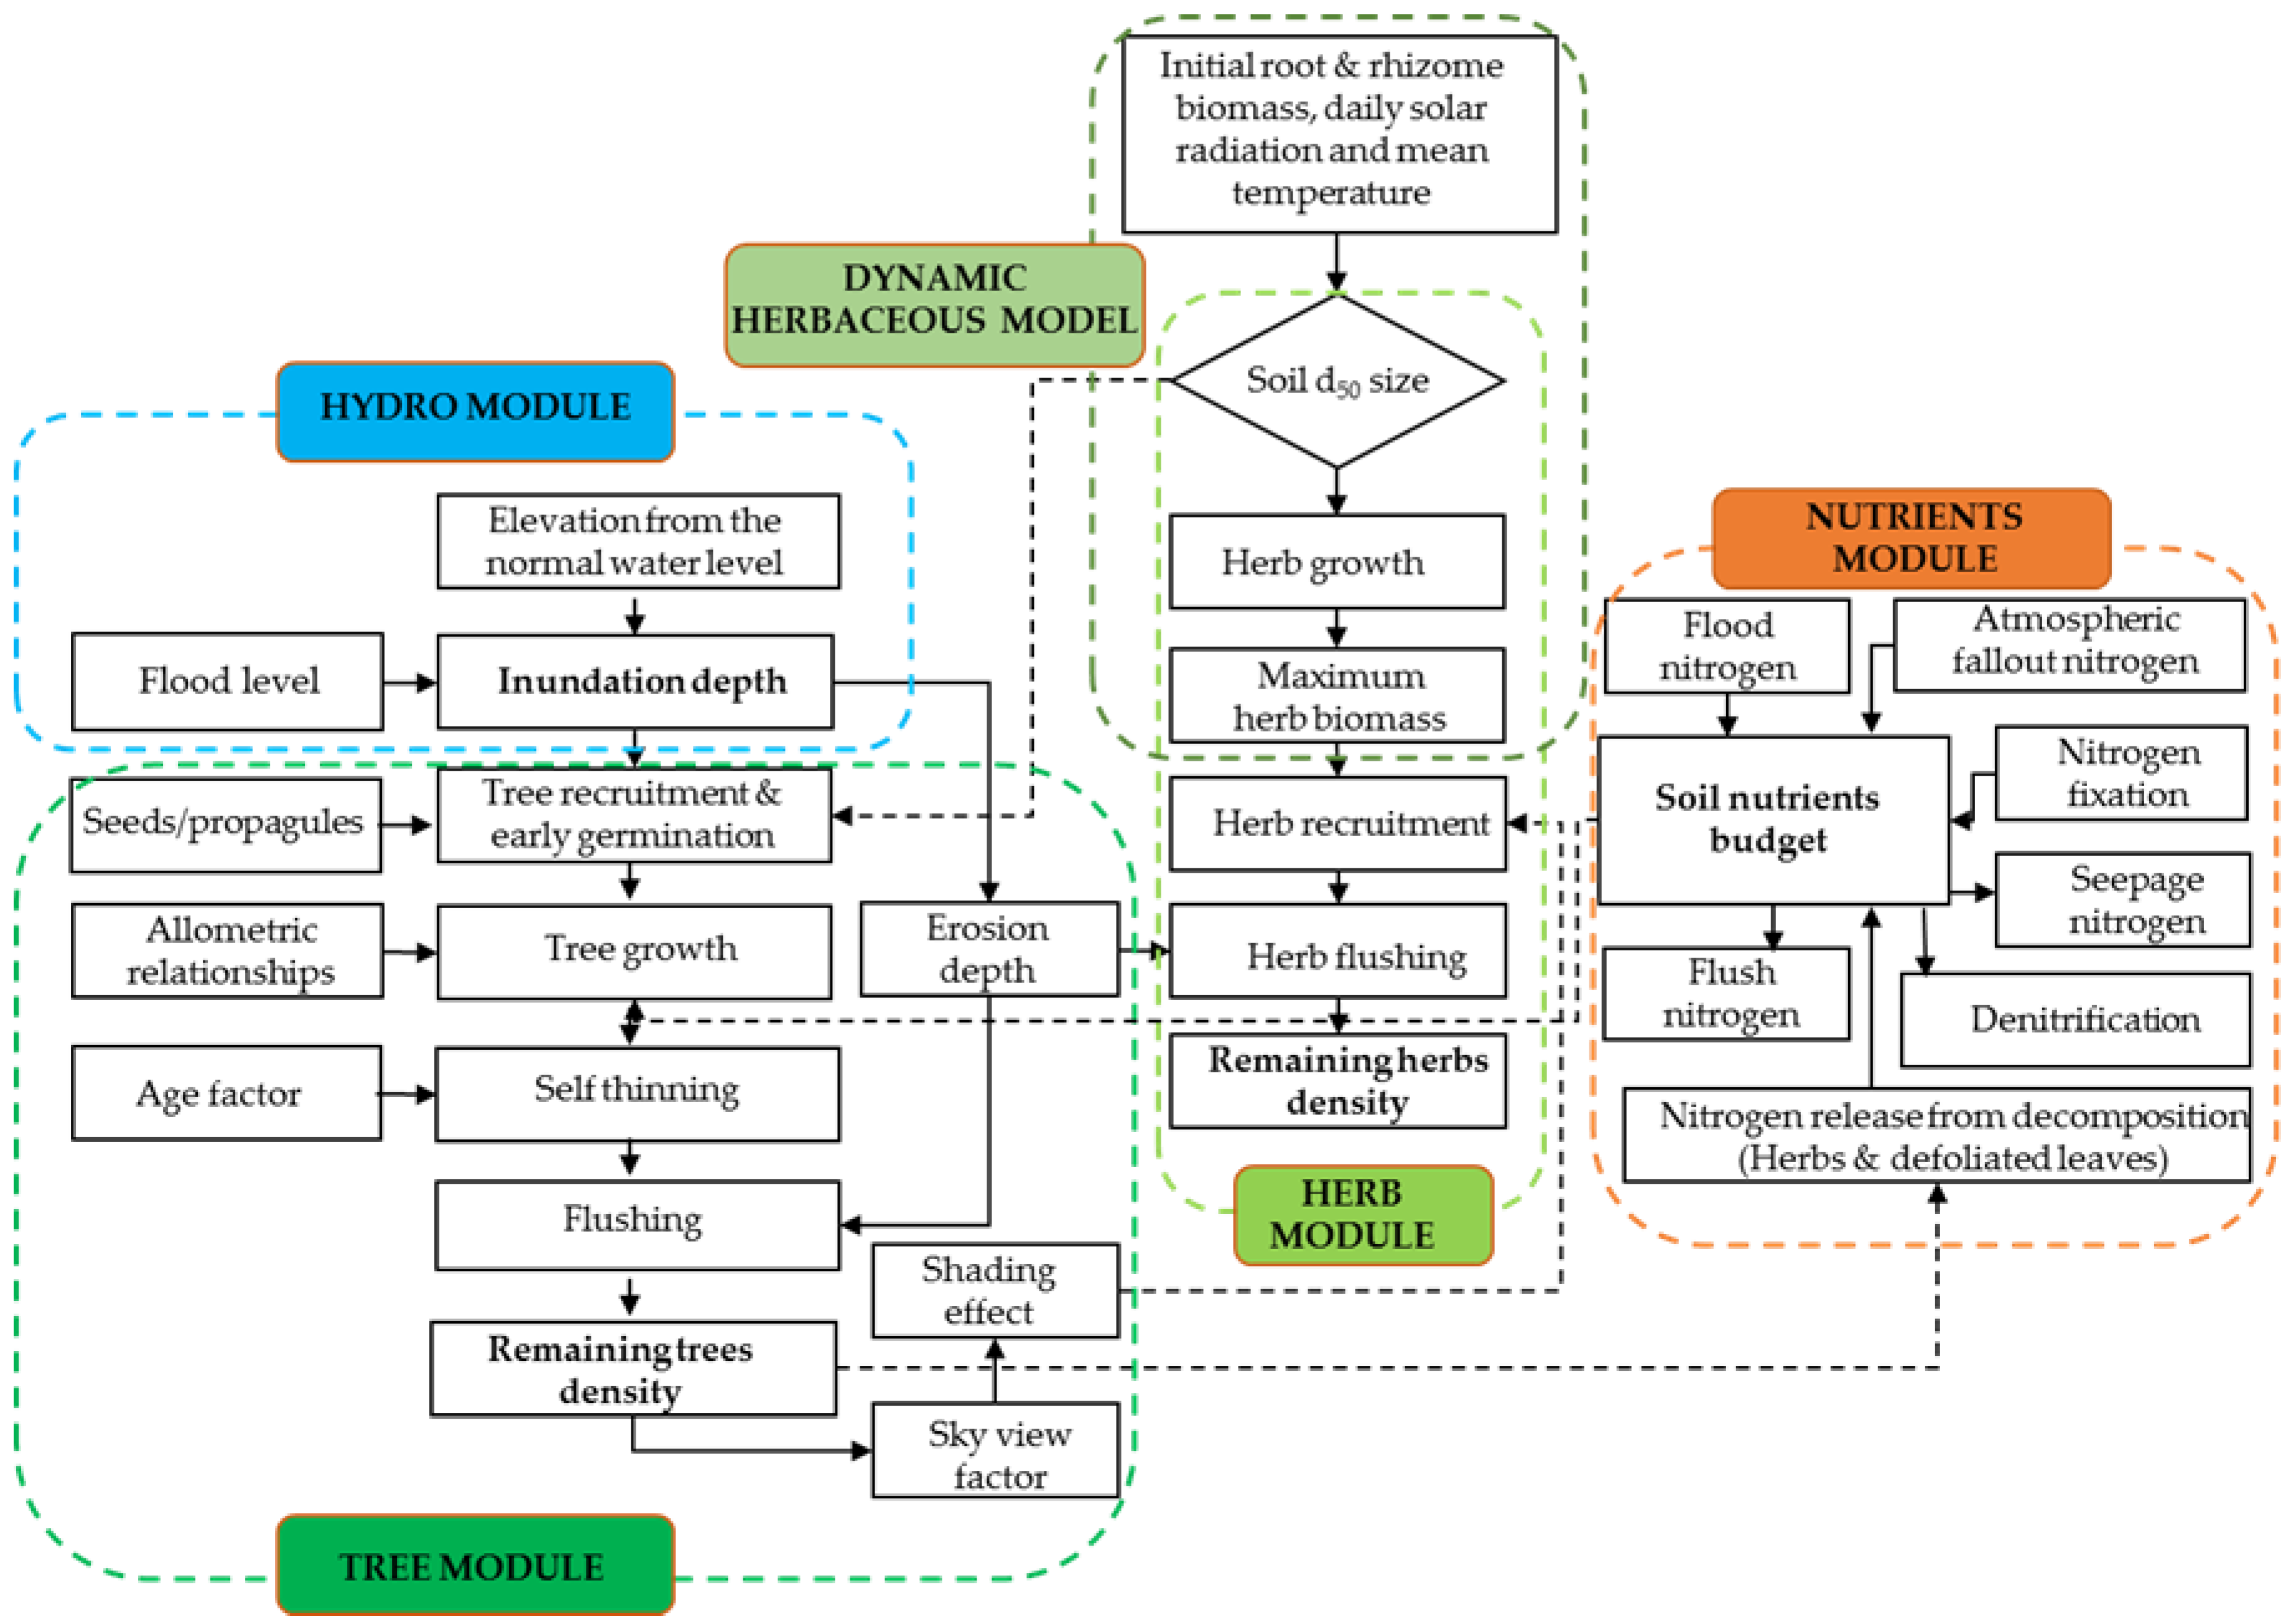
2.2.2. DRIPVEM Coupled with a Dynamic Herbaceous Model
3. Results
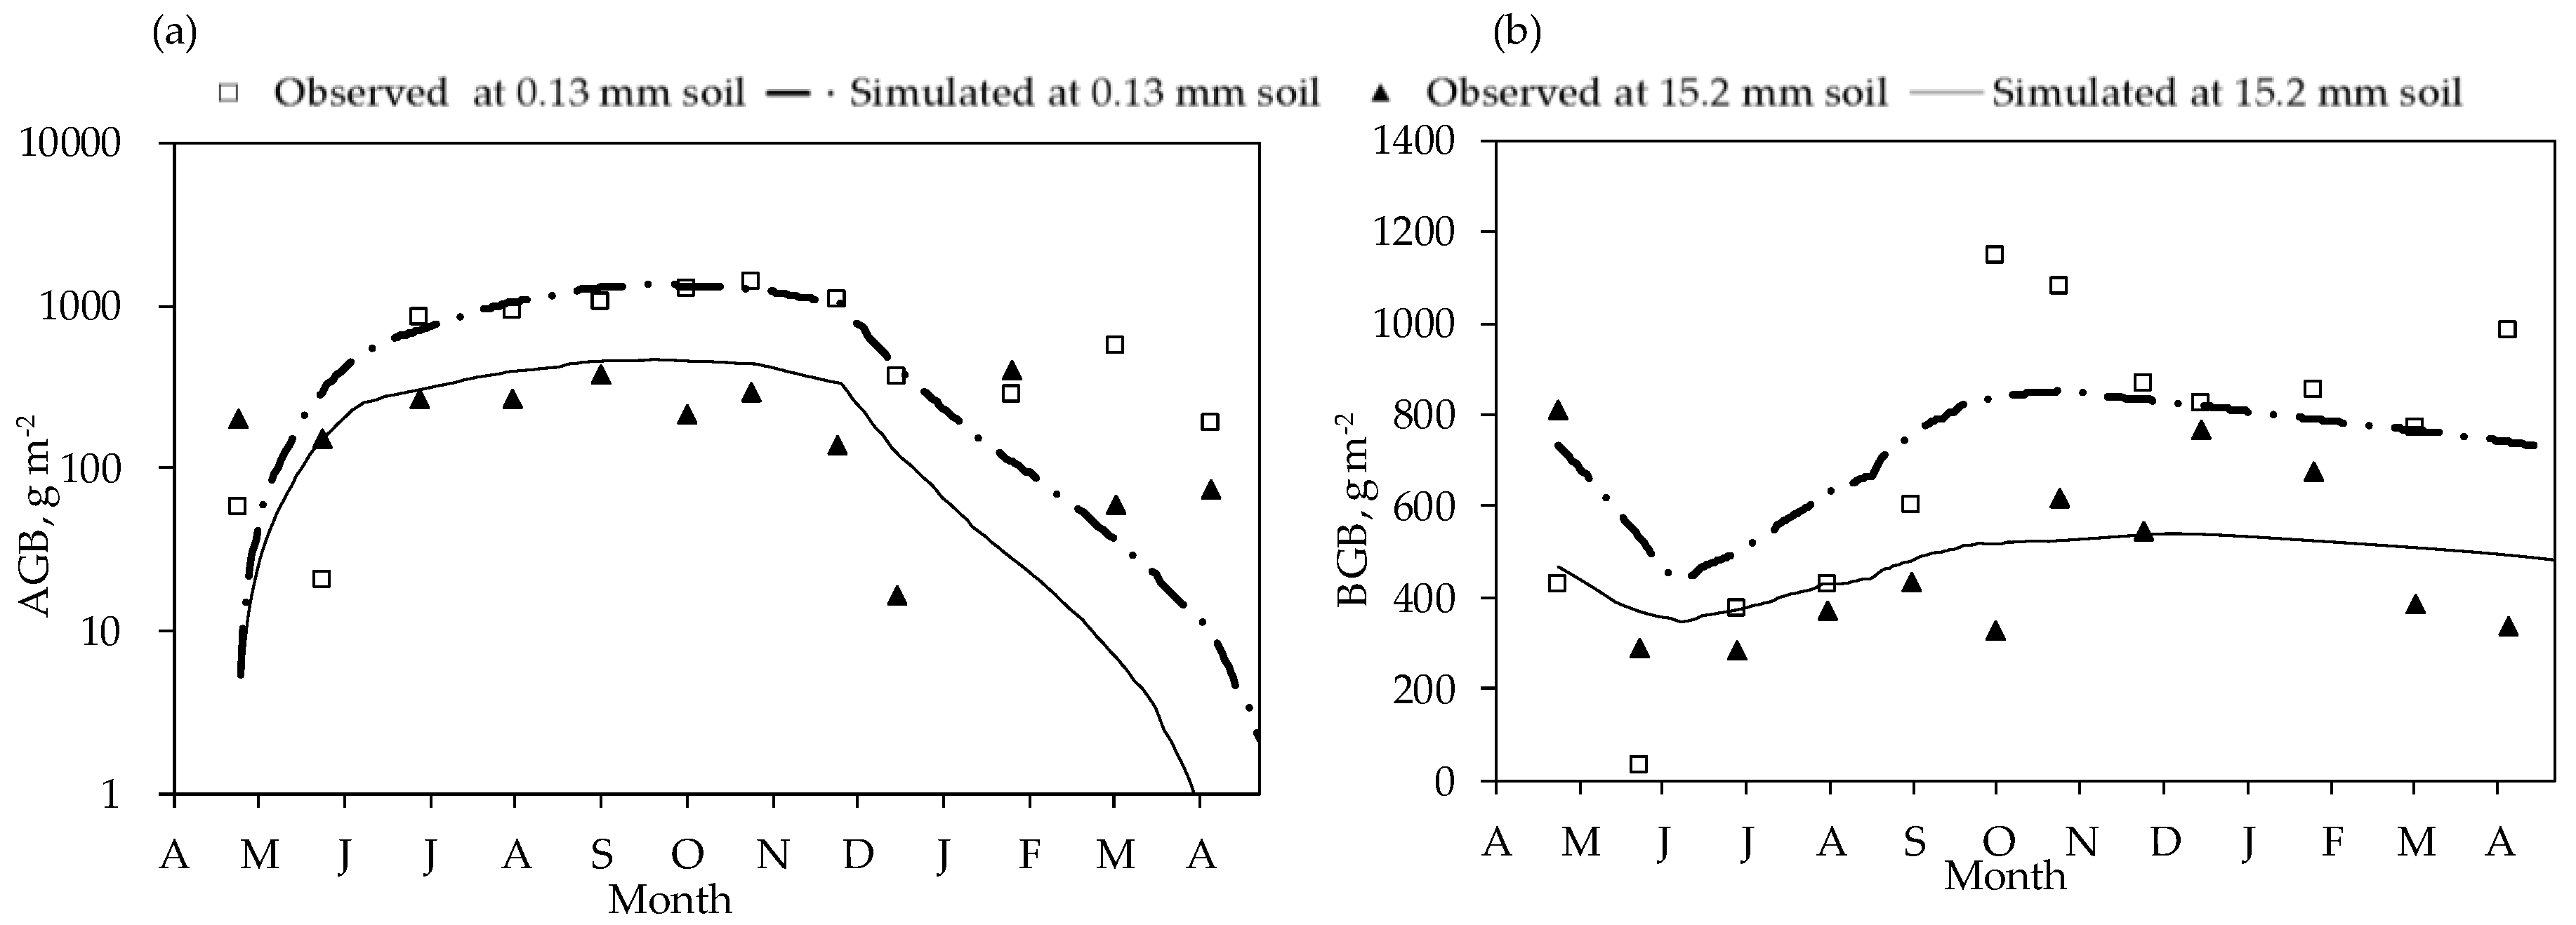
3.1. Seasonal Growth of Herbaceous Plants
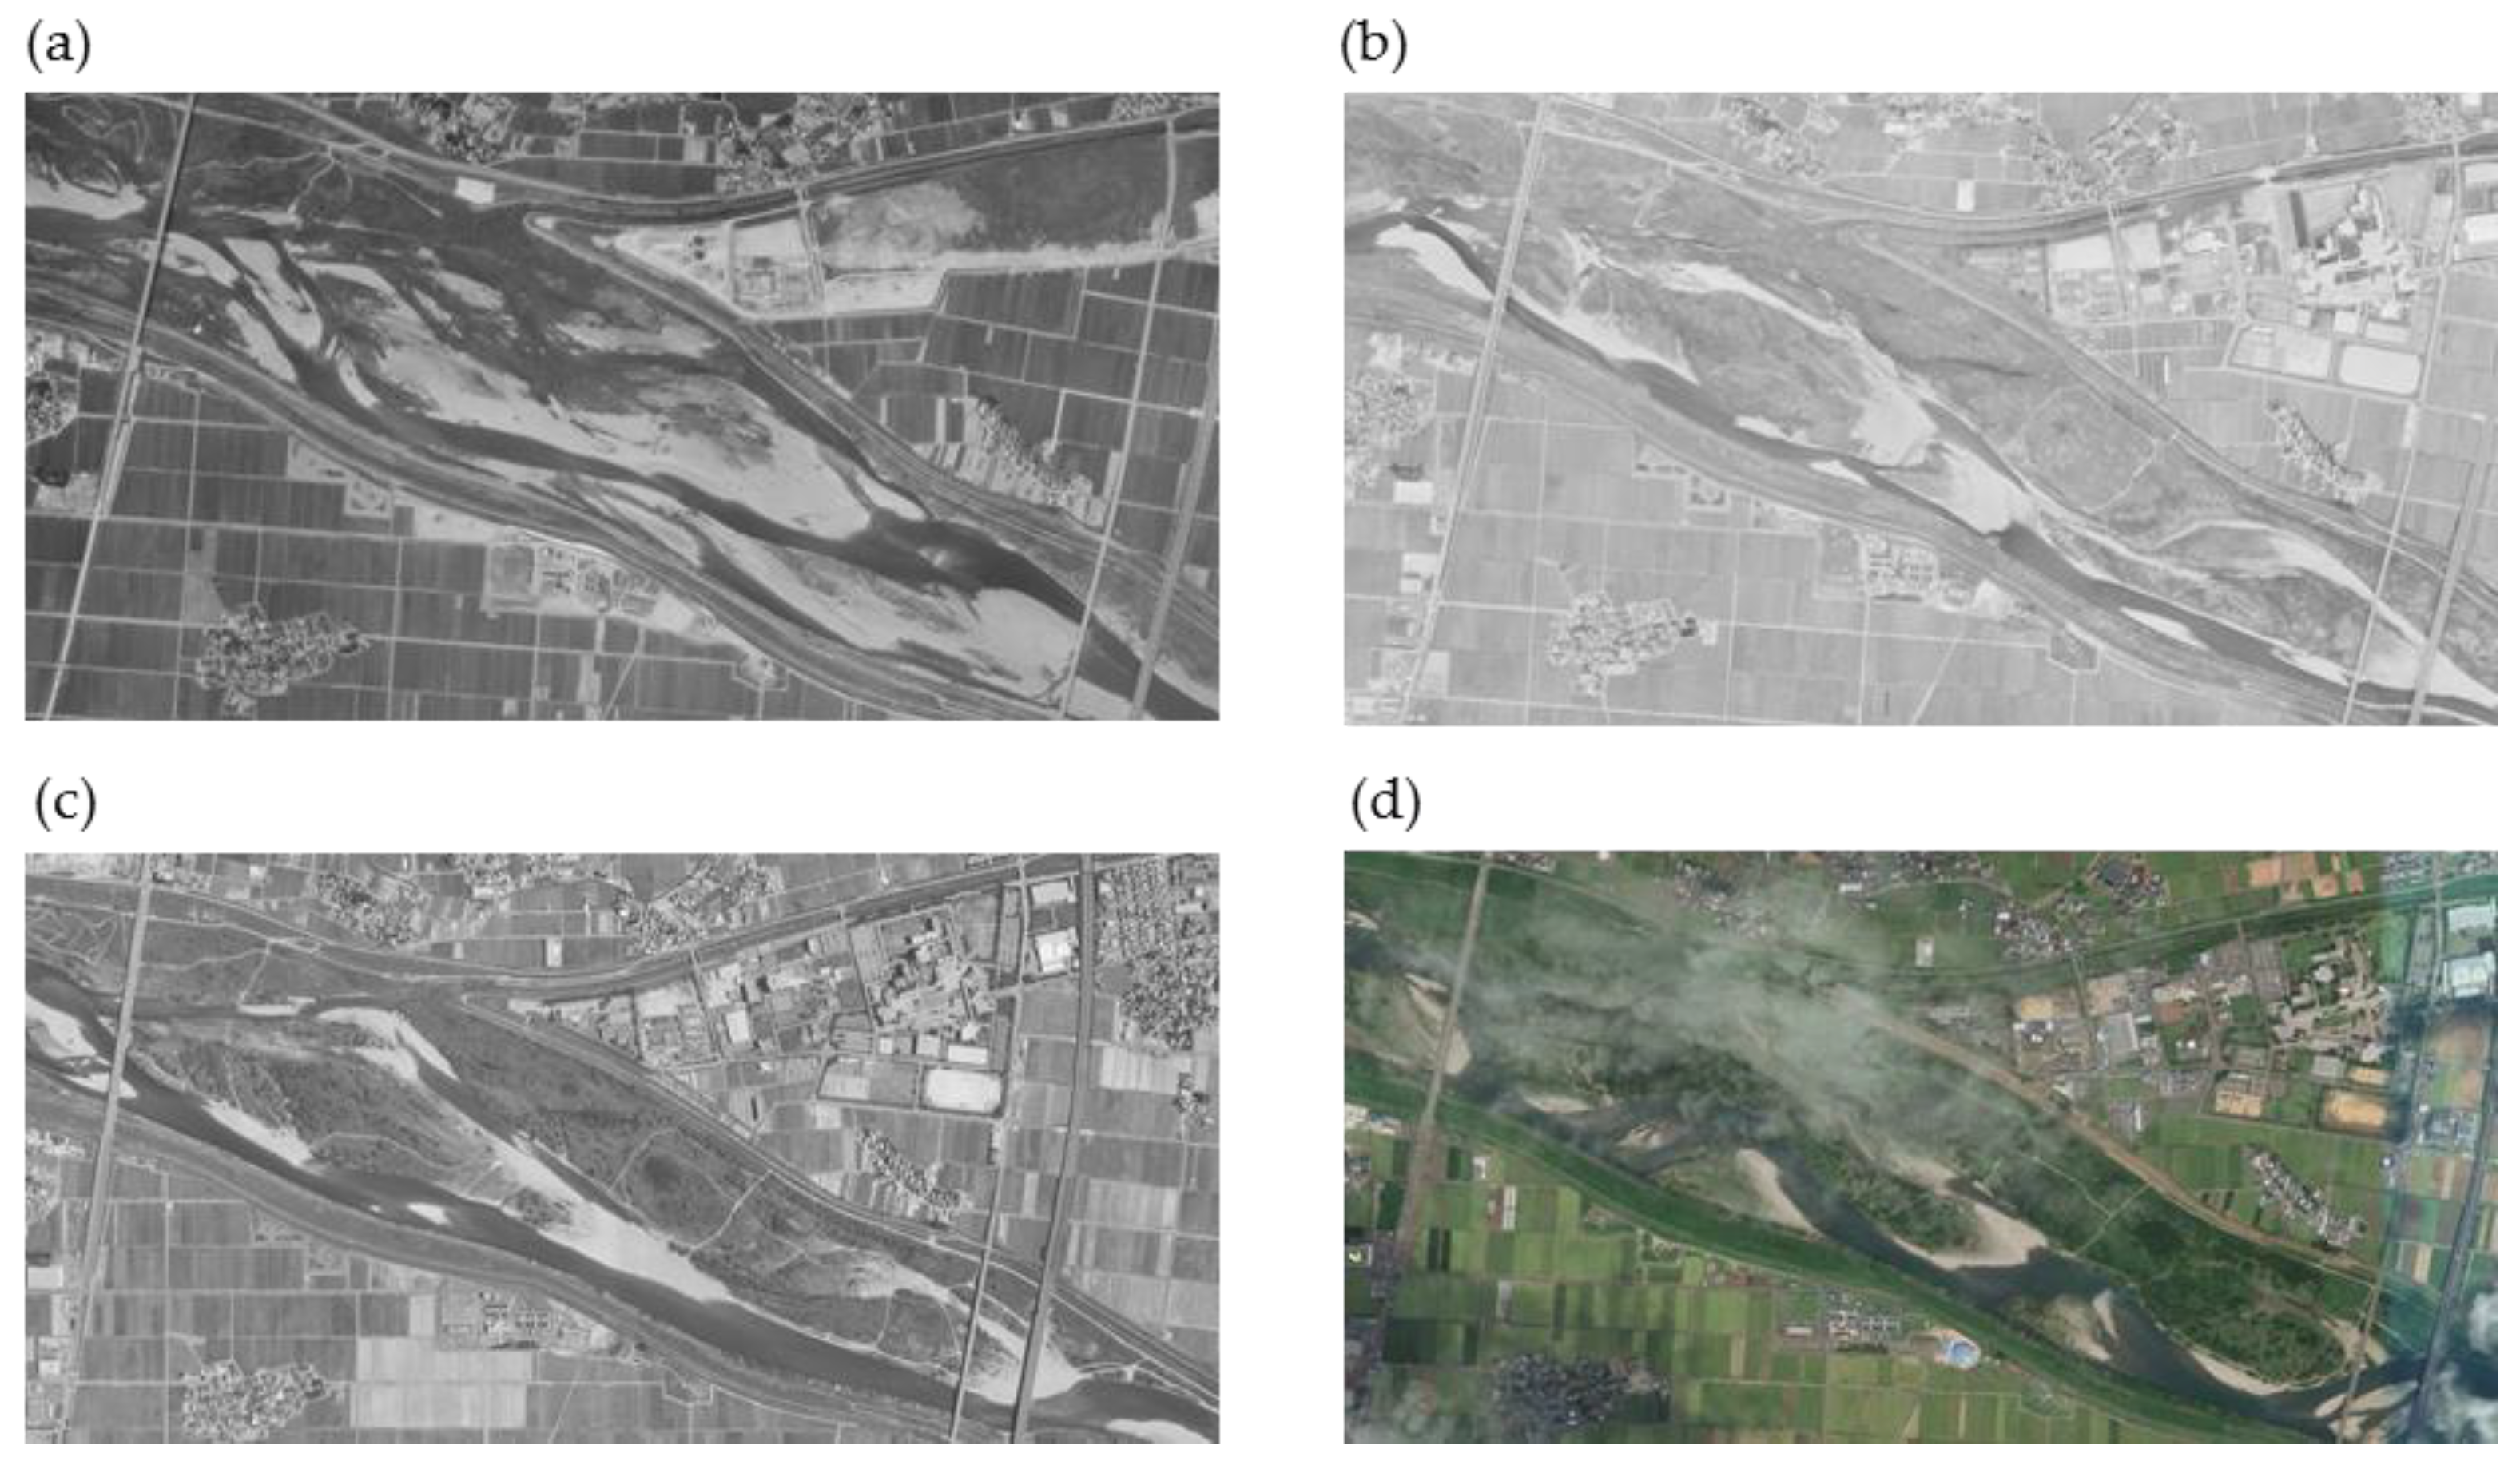
3.2. Historical Evidence of Growth of Herbs and Trees in the Floodplain
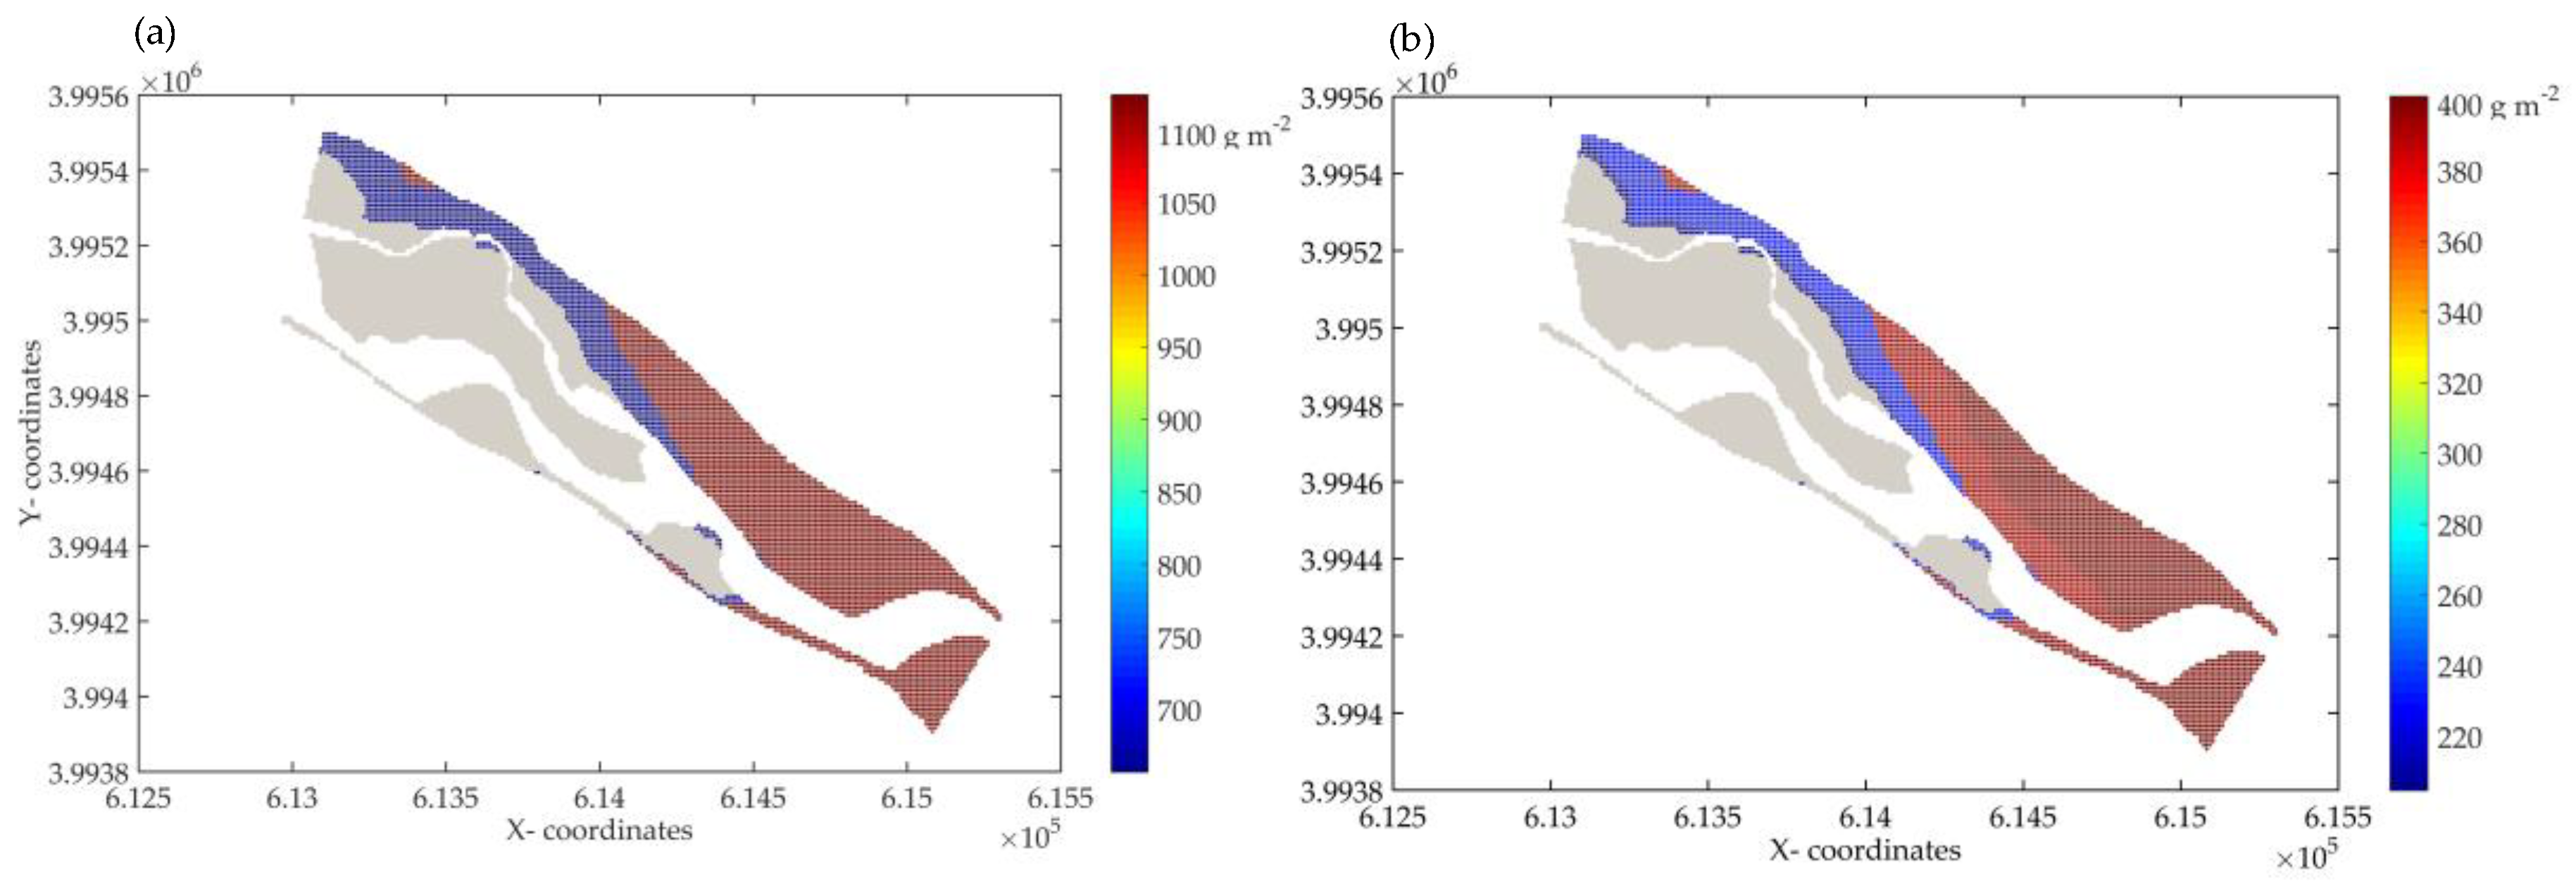
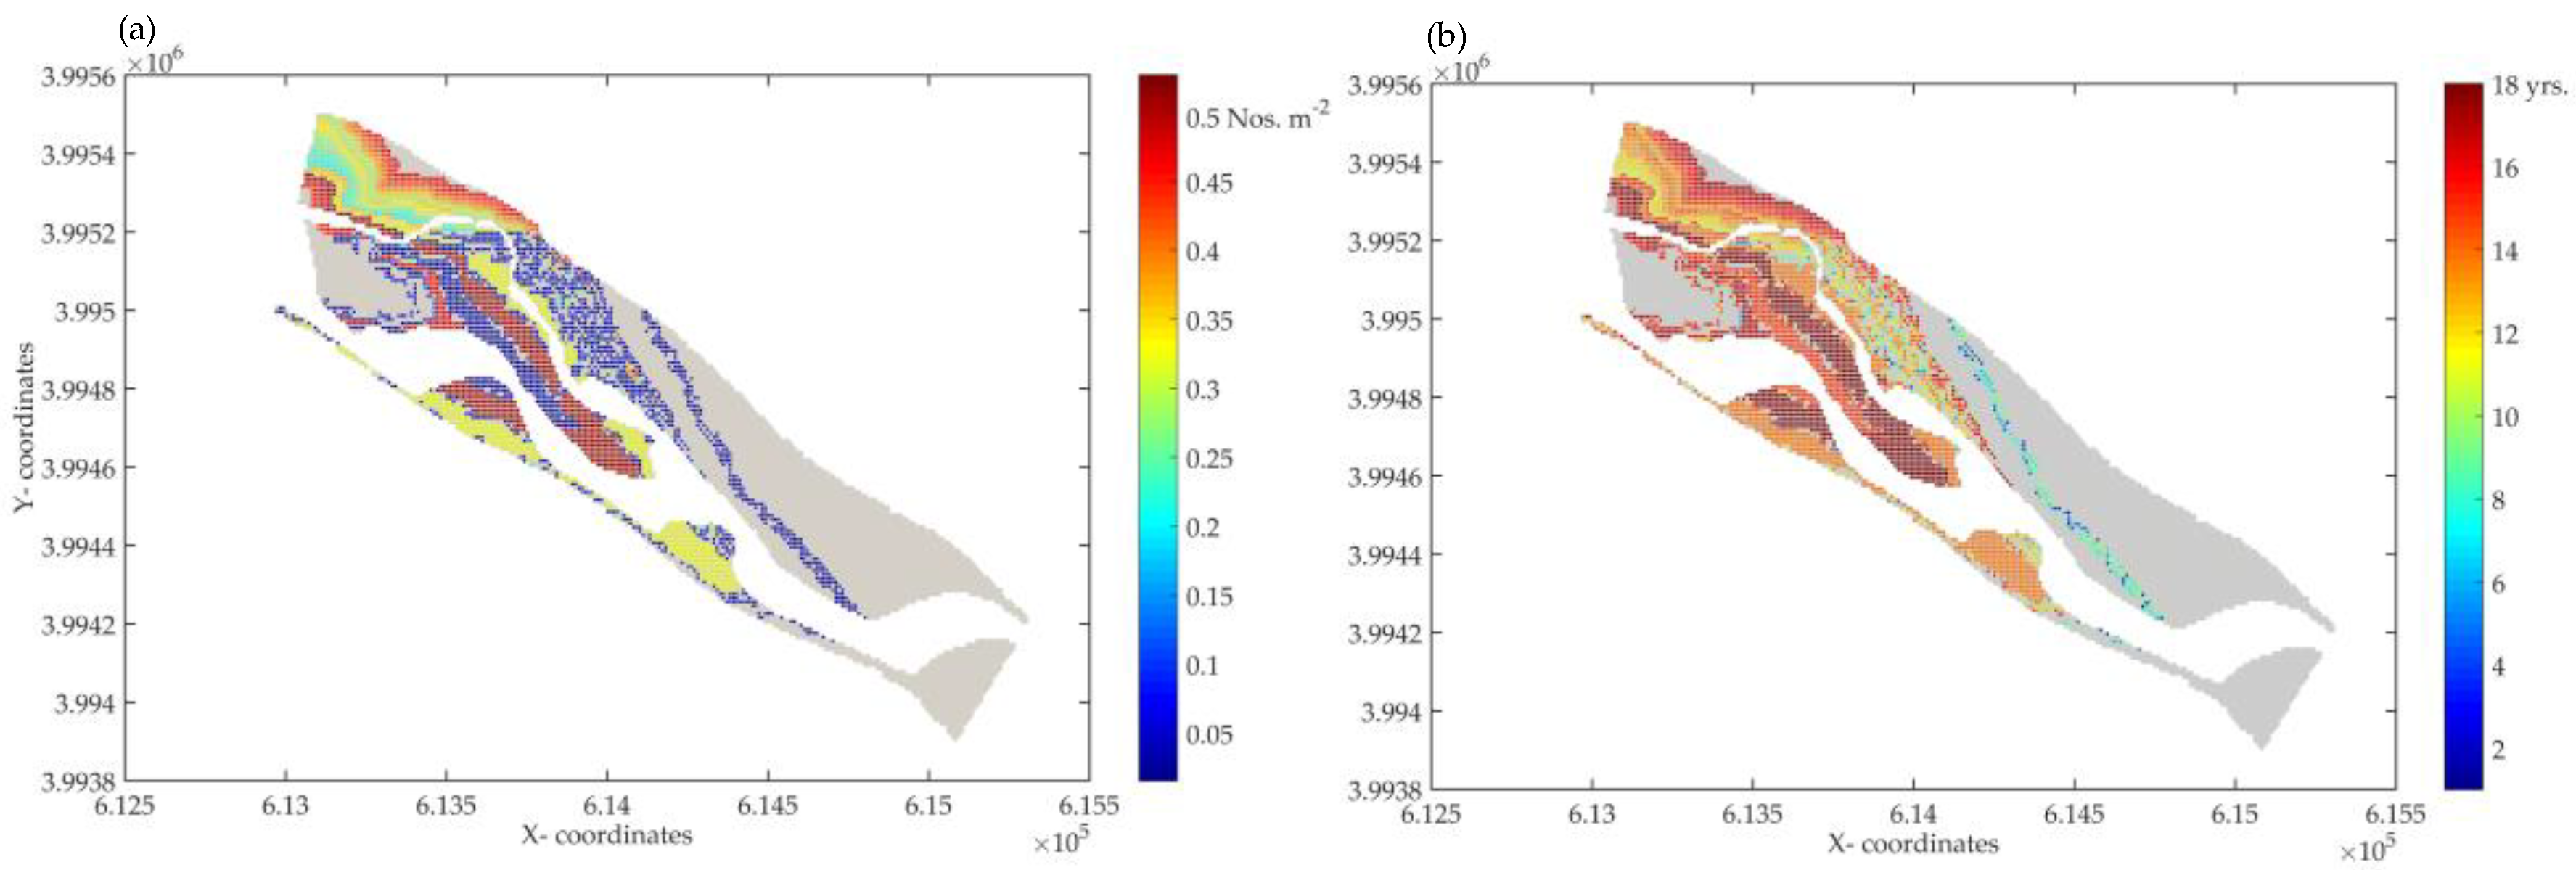
3.3. Prediction of Vegetation Growth by Using DRIPVEM Coupled with Dynamic Herbaceous Plants Model
4. Discussion
4.1. Growth of Herbaceous Plants in the Riparian Zone
4.2. Growth of Trees in the Riparian Zone
5. Conclusions
Author Contributions
Funding
Acknowledgments
Conflicts of Interest
References
- Fu, B.; Li, Y.; Wang, Y.; Zhang, B.; Yin, S.; Zhu, H.; Xing, Z. Evaluation of ecosystem service value of riparian zone using land use data from 1986 to 2012. Ecol. Indic. 2016, 69, 873–881. [Google Scholar] [CrossRef]
- Camporeale, C.; Ridolfi, L. Riparian vegetation distribution induced by river flow variability: A stochastic approach. Water Resour. Res. 2006, 42, 1–13. [Google Scholar] [CrossRef] [Green Version]
- Asaeda, T.; Sanjaya, K. The effect of the shortage of gravel sediment in midstream river channels on riparian vegetation cover. River Res. Appl. 2017, 33, 1107–1118. [Google Scholar] [CrossRef]
- Zhao, H.; Yan, J.; Yuan, S.; Liu, J.; Zheng, J. Effects of Submerged Vegetation Density on Turbulent Flow Characteristics in an Open Channel. Water 2019, 11, 2154. [Google Scholar] [CrossRef] [Green Version]
- Asaeda, T.; Baniya, M.B.; Rashid, M.H. Effect of floods on the growth of Phragmites japonica on the sediment bar of regulated rivers: A modelling approach. Int. J. River Basin Manag. 2011, 9, 211–220. [Google Scholar] [CrossRef]
- Asaeda, T.; Nallaperuma, B.; Baniya, M.B.; Jayashanka, S.M.D.H. Riparian Vegetation Classification using the Dynamic Riparian Vegetation Model. In Proceedings of the E-proceedings 38th IAHR World Congress, Panama City, Panama, 1–6 September 2019. [Google Scholar]
- Asaeda, T.; Fujino, T.; Manatunge, J. Morphological adaptations of emergent plants to water flow: A case study with Typha angustifolia, Zizania latifolia and Phragmites australis. Freshw. Biol. 2005, 50, 1991–2001. [Google Scholar] [CrossRef]
- Asaeda, T.; Rashid, M.D.H. Modelling of nutrient dynamics and vegetation succession in midstream sediment bars of a regulated river. Int. J. River Basin Manag. 2014, 12, 123–133. [Google Scholar] [CrossRef]
- Asaeda, T.; Rashid, M.H.; Abu Bakar, R. Dynamic modelling of soil nitrogen budget and vegetation colonization in sediment bars of a regulated river. River Res. Appl. 2015, 31, 470–484. [Google Scholar] [CrossRef]
- Klaus, K.; Albrecht, Z. Seed Dispersal in Flood Plain Forests of Amazonia. Biotropica 2019, 26, 30–43. [Google Scholar]
- Lytle, D.A.; Poff, N.L. Adaptation to natural flow regimes. Trends Ecol. Evol. 2004, 19, 94–100. [Google Scholar] [CrossRef]
- Boedeltje, G.E.R.; Bakker, J.P.; Ten Brinke, A.; Van Groenendael, J.M.; Soesbergen, M. Dispersal phenology of hydrochorous plants in relation to discharge, seed release time and buoyancy of seeds: The flood pulse concept supported. J. Ecol. 2004, 92, 786–796. [Google Scholar] [CrossRef]
- Vogt, K.; Rasran, L.; Jensen, K. Water-borne seed transport and seed deposition during flooding in a small river-valley in Northern Germany. Flora-Morphol. Distrib. Funct. Ecol. Plants 2004, 199, 377–388. [Google Scholar] [CrossRef]
- Asaeda, T.; Sharma, P.; Rajapakse, L. Seasonal patterns of carbohydrate translocation and synthesis of structural carbon components in Typha angustifolia. Hydrobiologia 2008, 607, 87–101. [Google Scholar] [CrossRef]
- Lippert, I.; Rolletschek, H.; Kühl, H.; Kohl, J.-G. Internal and external nutrient cycles in stands of Phragmites australis—A model for two ecotypes. In Shallow Lakes’ 98; Springer: Berlin/Heidelberg, Germany, 1999; pp. 343–348. [Google Scholar]
- Moriuchi, K.S.; Winn, A.A. Relationships among growth, development and plastic response to environment quality in a perennial plant. New Phytol. 2005, 166, 149–158. [Google Scholar] [CrossRef]
- Asaeda, T.; Siong, K.; Kawashima, T.; Sakamoto, K. Growth of Phragmites japonica on a sandbar of regulated river: Morphological adaptation of the plant to low water and nutrient availability in the substrate. River Res. Appl. 2009, 25, 874–891. [Google Scholar] [CrossRef]
- Asaeda, T.; Rashid, M.H.; Kotagiri, S.; Uchida, T. The role of soil characteristics in the succession of two herbaceous lianas in a modified river floodplain. River Res. Appl. 2011, 27, 591–601. [Google Scholar] [CrossRef]
- Brandt, S.A. Prediction of downstream geomorphological changes after dam construction: A stream power approach. Int. J. Water Resour. Dev. 2000, 16, 343–367. [Google Scholar] [CrossRef]
- Nallaperuma, B.; Asaeda, T. Long-term changes in riparian forest cover under a dam-induced flow scheme: The accompanying a numerical modelling perspective. J. Ecohydraul. 2019, 1–7. [Google Scholar] [CrossRef]
- Sumi, T.; Kantoush, S.A. Integrated management of reservoir sediment routing by flushing, replenishing, and bypassing sediments in Japanese river basins. In Proceedings of the 8th International Symposium on Ecohydraulics, Seoul, Korea, 12–16 September 2010; pp. 12–16. [Google Scholar]
- Asaeda, T.; Rashid, M.H. The impacts of sediment released from dams on downstream sediment bar vegetation. J. Hydrol. 2012, 430, 25–38. [Google Scholar] [CrossRef]
- Baniya, M.B.; Asaeda, T.; KC, S.; Jayashanka, S.M.D.H. Hydraulic Parameters for Sediment Transport and Prediction of Suspended Sediment for Kali Gandaki River Basin, Himalaya, Nepal. Water 2019, 11, 1229. [Google Scholar] [CrossRef] [Green Version]
- Gudino-Elizondo, N.; Biggs, T.W.; Bingner, R.L.; Langendoen, E.J.; Kretzschmar, T.; Taguas, E.V.; Taniguchi-Quan, K.T.; Liden, D.; Yuan, Y. Modelling Runoff and Sediment Loads in a Developing Coastal Watershed of the US-Mexico Border. Water 2019, 11, 1024. [Google Scholar] [CrossRef] [PubMed] [Green Version]
- Mao, L.; Cavalli, M.; Comiti, F.; Marchi, L.; Lenzi, M.A.; Arattano, M. Sediment transfer processes in two Alpine catchments of contrasting morphological settings. J. Hydrol. 2009, 364, 88–98. [Google Scholar] [CrossRef]
- Soler, M.; Regüés, D.; Latron, J.; Gallart, F. Frequency–magnitude relationships for precipitation, stream flow and sediment load events in a small Mediterranean basin (Vallcebre basin, Eastern Pyrenees). Catena 2007, 71, 164–171. [Google Scholar] [CrossRef]
- Asaeda, T.; Gomes, P.I.A.; Sakamoto, K.; Rashid, M.H. Tree colonization trends on a sediment bar after a major flood. River Res. Appl. 2011, 27, 976–984. [Google Scholar] [CrossRef]
- Gurnell, A.; Petts, G. Trees as riparian engineers: The Tagliamento River, Italy. Earth Surf. Process. Landf. 2006, 31, 1558–1574. [Google Scholar] [CrossRef]
- Naiman, R.J.; Bilby, R.E.; Bisson, P.A. Riparian ecology and management in the Pacific coastal rain forest. Bioscience 2000, 50, 996–1011. [Google Scholar] [CrossRef]
- Nones, M.; Di Silvio, G. Modeling of river width variations based on hydrological, morphological, and biological dynamics. J. Hydraul. Eng. 2016, 142, 4016012. [Google Scholar] [CrossRef]
- Perona, P.; Camporeale, C.; Perucca, E.; Savina, M.; Molnar, P.; Burlando, P.; Ridolfi, L. Modelling river and riparian vegetation interactions and related importance for sustainable ecosystem management. Aquat. Sci. 2009, 71, 266. [Google Scholar] [CrossRef] [Green Version]
- Davies-Colley, R.J.; Meleason, M.A.; Hall, R.M.J.; Rutherford, J.C. Modelling the time course of shade, temperature, and wood recovery in streams with riparian forest restoration. N. Z. J. Mar. Freshw. Res. 2009, 43, 673–688. [Google Scholar] [CrossRef] [Green Version]
- Rivaes, R.; Rodríguez-González, P.M.; Albuquerque, A.; Pinheiro, A.N.; Egger, G.; Ferreira, M.T. Riparian vegetation responses to altered flow regimes driven by climate change in Mediterranean rivers. Ecohydrology 2013, 6, 413–424. [Google Scholar] [CrossRef]
- García-Arias, A.; Francés, F.; Ferreira, T.; Egger, G.; Martínez-Capel, F.; Garófano-Gómez, V.; Andrés-Doménech, I.; Politti, E.; Rivaes, R.; Rodríguez-González, P.M. Implementing a dynamic riparian vegetation model in three European river systems. Ecohydrology 2013, 6, 635–651. [Google Scholar] [CrossRef]
- Sanjaya, K.; Asaeda, T. Assessing the performance of a riparian vegetation model in a river with a low slope and fine sediment. Environ. Technol. 2017, 38, 517–528. [Google Scholar] [CrossRef] [PubMed]
- Vargas-Luna, A.; Crosato, A.; Uijttewaal, W.S.J. Effects of vegetation on flow and sediment transport: Comparative analyses and validation of predicting models. Earth Surf. Process. Landf. 2015, 40, 157–176. [Google Scholar] [CrossRef]
- Nepf, H.; Ghisalberti, M. Flow and transport in channels with submerged vegetation. Acta Geophys. 2008, 56, 753–777. [Google Scholar] [CrossRef]
- Sekine, H.; Sakamoto, K.; Nishimura, T.; Asaeda, T. Development of a simulation model considering vegetation growth and flushing in Arakawa River. KSCE J. Civ. Eng. 2012, 16, 239–246. [Google Scholar] [CrossRef]
- Benjankar, R.; Egger, G.; Jorde, K.; Goodwin, P.; Glenn, N.F. Dynamic floodplain vegetation model development for the Kootenai River, USA. J. Environ. Manag. 2011, 92, 3058–3070. [Google Scholar] [CrossRef]
- García-Arias, A.; Francés, F. The RVDM: Modelling impacts, evolution and competition processes to determine riparian vegetation dynamics. Ecohydrology 2016, 9, 438–459. [Google Scholar] [CrossRef]
- Salminen, H.; Lehtonen, M.; Hynynen, J. Reusing legacy FORTRAN in the MOTTI growth and yield simulator. Comput. Electron. Agric. 2005, 49, 103–113. [Google Scholar] [CrossRef]
- Mendoza, G.A.; Vanclay, J.K. Trends in forestry modelling. CAB Rev. Perspect. Agric. Vet. Sci. Nutr. Nat. Resour. 2008, 3, 1–9. [Google Scholar] [CrossRef] [Green Version]
- Pretzsch, H.; Biber, P.; Ďurský, J. The single tree-based stand simulator SILVA: Construction, application and evaluation. For. Ecol. Manag. 2002, 162, 3–21. [Google Scholar] [CrossRef]
- Asaeda, T.; Karunaratne, S. Dynamic modeling of the growth of Phragmites australis: Model description. Aquat. Bot. 2000, 67, 301–318. [Google Scholar] [CrossRef]
- Asaeda, T.; Hai, D.N.; Manatunge, J.; Williams, D.; Roberts, J. Latitudinal characteristics of below-and above-ground biomass of Typha: A modelling approach. Ann. Bot. 2005, 96, 299–312. [Google Scholar] [CrossRef] [PubMed] [Green Version]
- Eid, E.M.; Shaltout, K.H.; Asaeda, T. Modeling growth dynamics of Typha domingensis (Pers.) Poir. ex Steud. in Lake Burullus, Egypt. Ecol. Model. 2012, 243, 63–72. [Google Scholar] [CrossRef]
- Asaeda, T.; Gomes, P.I.A.; Takeda, E. Spatial and temporal tree colonization in a midstream sediment bar and the mechanisms governing tree mortality during a flood event. River Res. Appl. 2010, 26, 960–976. [Google Scholar] [CrossRef]
- Asaeda, T.; Manatunge, J.; Roberts, J.; Hai, D.N. Seasonal dynamics of resource translocation between the aboveground organs and age-specific rhizome segments of Phragmites australis. Environ. Exp. Bot. 2006, 57, 9–18. [Google Scholar] [CrossRef]
- Asaeda, T.; Rajapakse, L. Effects of spates of different magnitudes on a Phragmites japonica population on a sandbar of a frequently disturbed river. River Res. Appl. 2008, 24, 1310–1324. [Google Scholar] [CrossRef]
- Hootsmans, M.J.M. A growth analysis model for Potamogeton pectinatus L. In Lake Veluwe, a Macrophyte-Dominated System under Eutrophication Stress; Springer: Berlin/Heidelberg, Germany, 1994; pp. 250–286. [Google Scholar]
- Soetaert, K.; Hoffmann, M.; Meire, P.; Starink, M.; van Oevelen, D.; Van Regenmortel, S.; Cox, T. Modeling growth and carbon allocation in two reed beds (Phragmites australis) in the Scheldt estuary. Aquat. Bot. 2004, 79, 211–234. [Google Scholar] [CrossRef]
- McConnaughay, K.D.M.; Coleman, J.S. Biomass allocation in plants: Ontogeny or optimality? A test along three resource gradients. Ecology 1999, 80, 2581–2593. [Google Scholar] [CrossRef]
- Funk, J.L. Differences in plasticity between invasive and native plants from a low resource environment. J. Ecol. 2008, 96, 1162–1173. [Google Scholar] [CrossRef]
- Tursun, N.; Seyithanoglu, M.; Nezihi, F.; Ozer, I.; Arzu, E. Seasonal dynamics of soluble carbohydrates in rhizomes of Phragmites australis and Typha latifolia. Flora 2011, 206, 731–735. [Google Scholar] [CrossRef]
- Votrubov, O.; Tylov, E.; Steinbachov, L. Phenology and autumnal accumulation of N reserves in belowground organs of wetland helophytes Phragmites australis and Glyceria maxima affected by nutrient surplus. Environ. Exp. Bot. 2008, 63, 28–38. [Google Scholar]
- Li, J.-F.; Tfwala, S.; Chen, S.-C. Effects of Vegetation Density and Arrangement on Sediment Budget in a Sediment-Laden Flow. Water 2018, 10, 1412. [Google Scholar] [CrossRef] [Green Version]
- Gomes, P.I.A.; Asaeda, T. Spatial and temporal heterogeneity of Eragrostis curvula in the downstream flood meadow of a regulated river. Ann. Limnol. Int. J. Limnol. EDP Sci. 2009, 45, 181–193. [Google Scholar] [CrossRef] [Green Version]
- Kantoush, S.A.; Sumi, T.; Kubota, A.; Suzuki, T. Impacts of sediment replenishment below dams on flow and bed morphology of river. In Proceedings of the First International Conference on Coastal Zone Management of River Deltas & Low Land Coastlines, Alexandria, Egypt, 6–10 March 2010; pp. 285–303. [Google Scholar]
- Steiger, J.; Gurnell, A.M.; Petts, G.E. Sediment deposition along the channel margins of a reach of the middle River Severn, UK. Regul. Rivers Res. Manag. Int. J. Devoted River Res. Manag. 2001, 17, 443–460. [Google Scholar] [CrossRef]
- Standish, R.J.; Williams, P.A.; Robertson, A.W.; Scott, N.A.; Hedderley, D.I. Invasion by a perennial herb increases decomposition rate and alters nutrient availability in warm temperate lowland forest remnants. Biol. Invasions 2004, 6, 71–81. [Google Scholar] [CrossRef]


| Parameters | Descriptions |
|---|---|
| Floodplain size | 2370 × 542 m |
| Mean gradient of river | 0.3% |
| Extreme flood level from normal water level (0.000 m elevation) | 7.54 m in October 2004; 6.24m in October 2002; 6.9 m and 6.82m in September 1998 and 1989 |
| Extreme flood discharge | 3221 m3s−1 in October 2004; 2400 m3s−1 in October 2002; 2517 and 2144 m3s−1 in September 1998 and 1989 |
| Ground elevation ranges from normal water level (0.000 m elevation) | 0.102–7.334 m |
| Precipitation | ≈2200 mm year−1 |
© 2019 by the authors. Licensee MDPI, Basel, Switzerland. This article is an open access article distributed under the terms and conditions of the Creative Commons Attribution (CC BY) license (http://creativecommons.org/licenses/by/4.0/).
Share and Cite
Baniya, M.B.; Asaeda, T.; Fujino, T.; Jayasanka, S.M.D.H.; Muhetaer, G.; Li, J. Mechanism of Riparian Vegetation Growth and Sediment Transport Interaction in Floodplain: A Dynamic Riparian Vegetation Model (DRIPVEM) Approach. Water 2020, 12, 77. https://doi.org/10.3390/w12010077
Baniya MB, Asaeda T, Fujino T, Jayasanka SMDH, Muhetaer G, Li J. Mechanism of Riparian Vegetation Growth and Sediment Transport Interaction in Floodplain: A Dynamic Riparian Vegetation Model (DRIPVEM) Approach. Water. 2020; 12(1):77. https://doi.org/10.3390/w12010077
Chicago/Turabian StyleBaniya, Mahendra B., Takashi Asaeda, Takeshi Fujino, Senavirathna M. D. H. Jayasanka, Guligena Muhetaer, and Jinghao Li. 2020. "Mechanism of Riparian Vegetation Growth and Sediment Transport Interaction in Floodplain: A Dynamic Riparian Vegetation Model (DRIPVEM) Approach" Water 12, no. 1: 77. https://doi.org/10.3390/w12010077