Enhancing Performance of Participatory Water Institutions in the Eastern Indo-Gangetic Plains: What Can We Learn from New Institutional Economics and Governance Theories?


Abstract
:1. Introduction
2. Background and Justification
3. Concepts: New Institutional Economics, Institutional Design and Governance
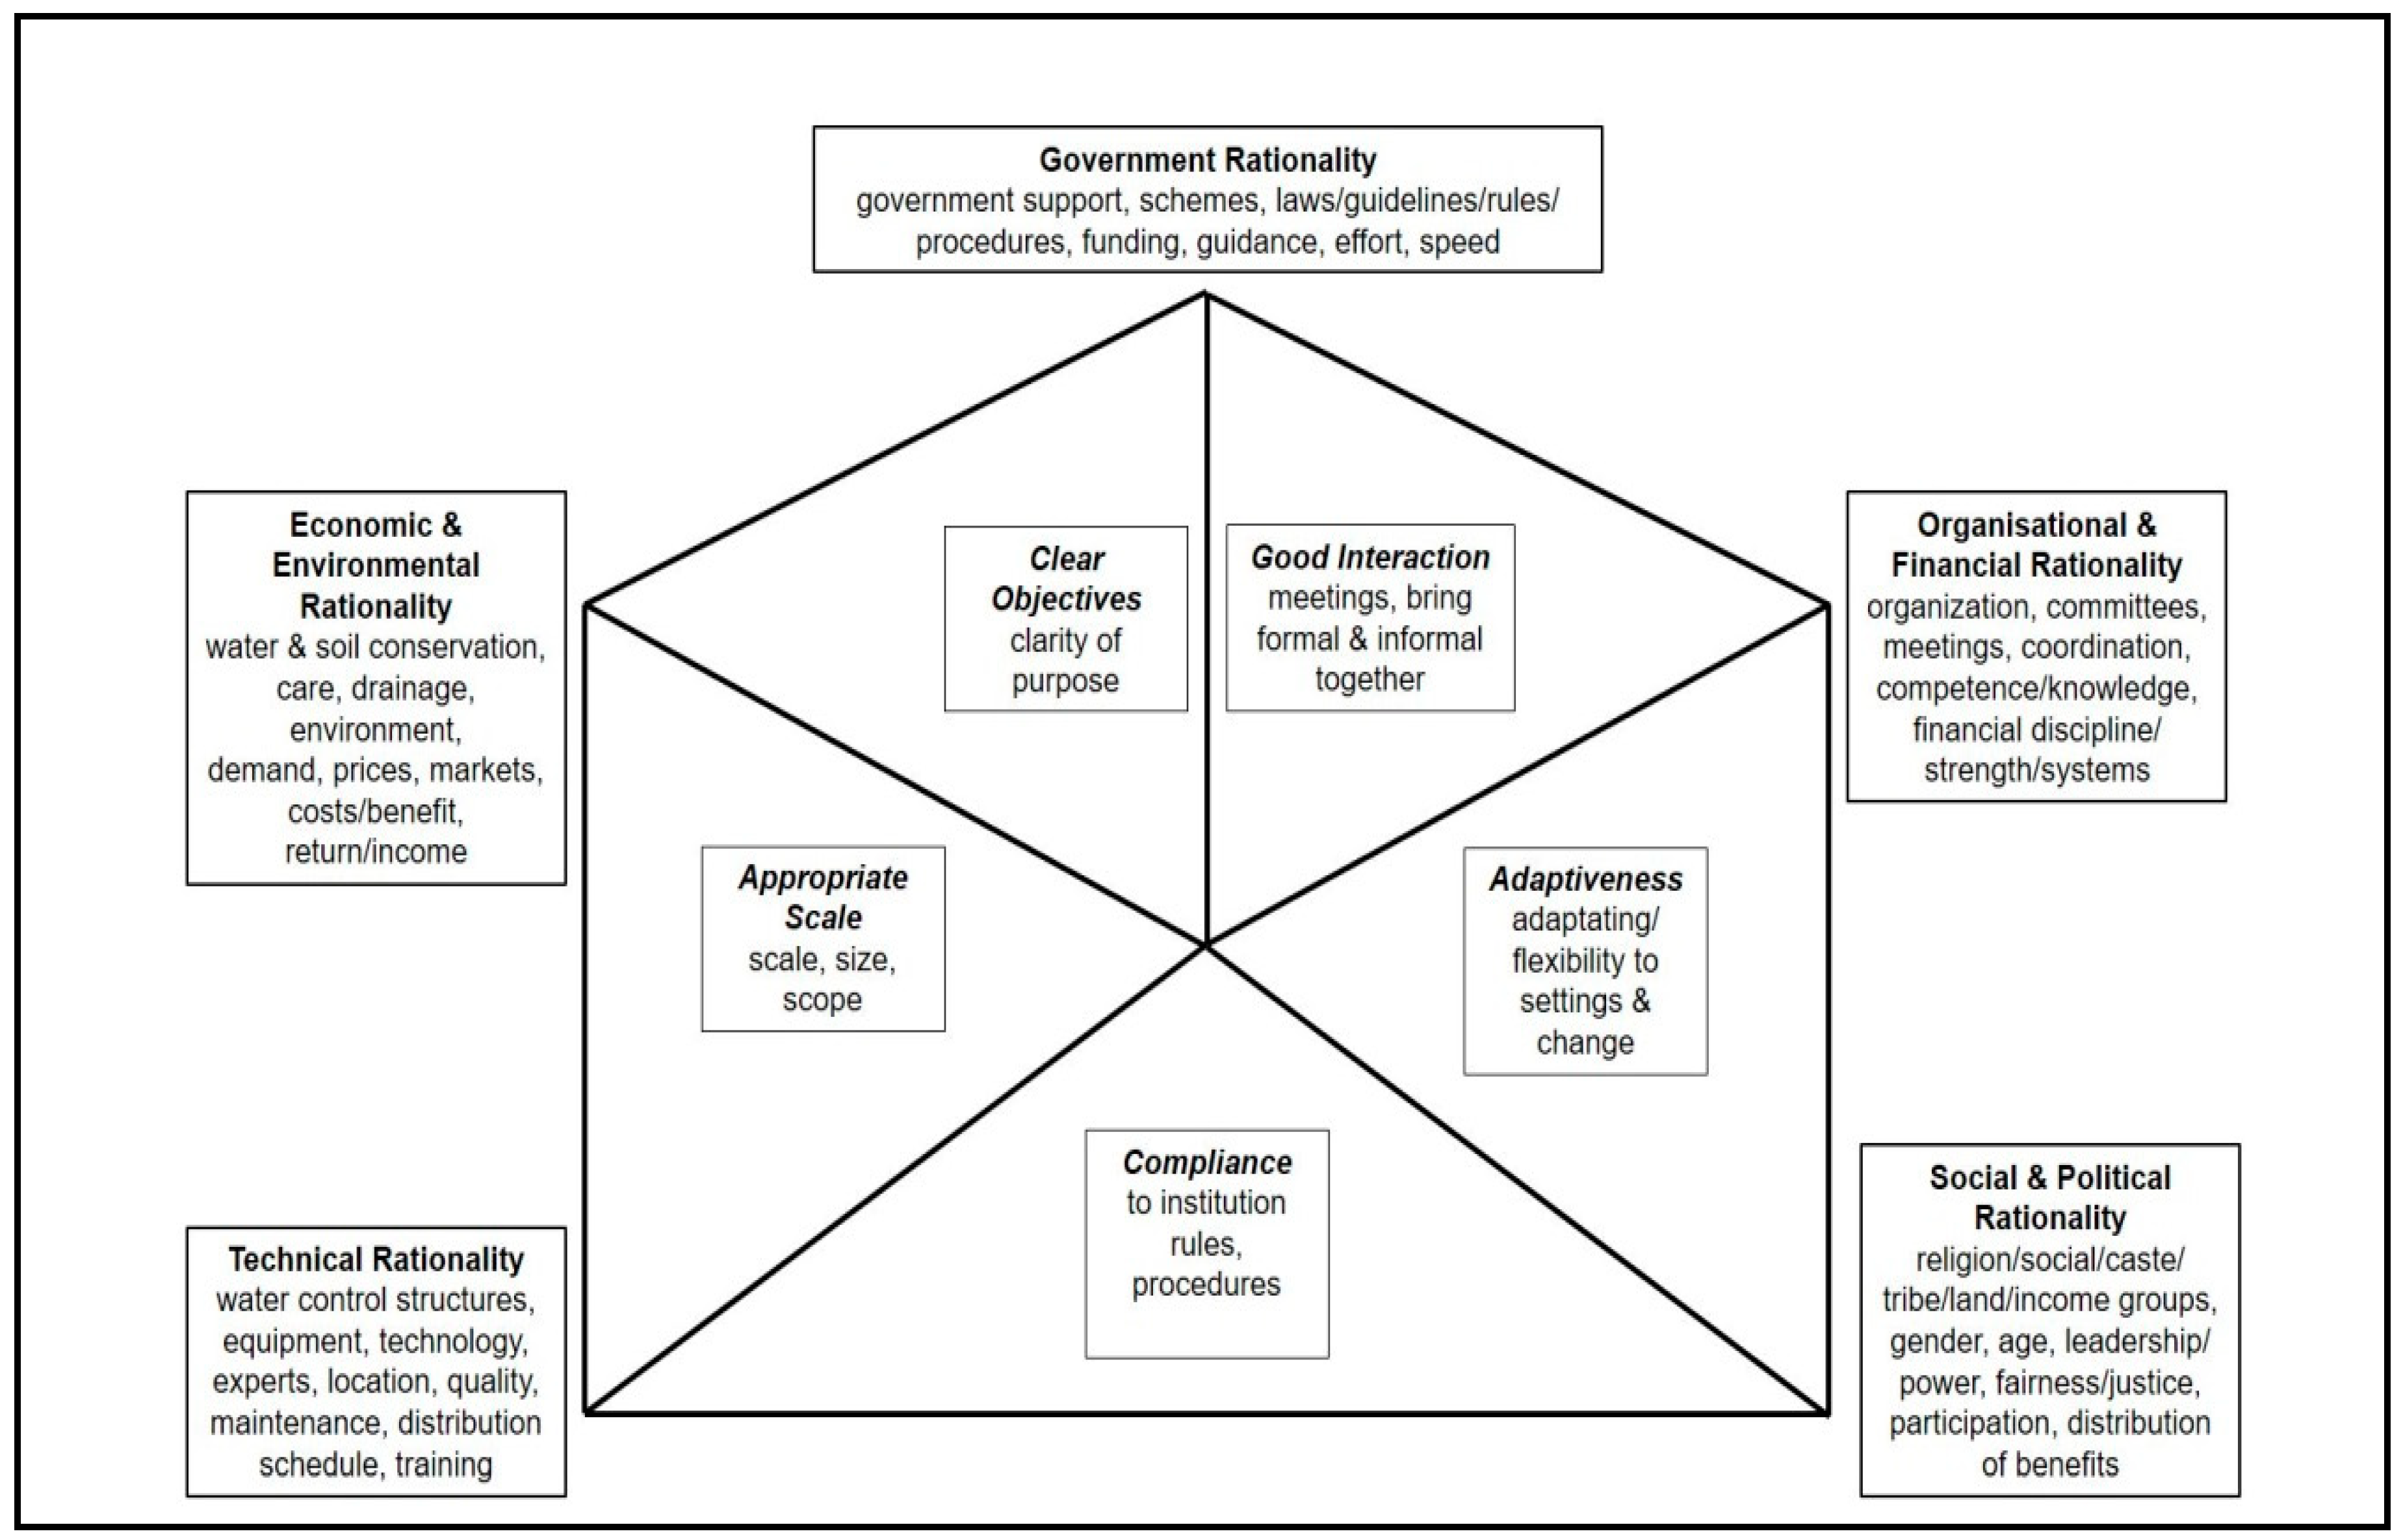
- Clear objectives: clear objectives and clarity of purpose in the institution and their acceptance by all stakeholders leads to better congruence, less conflict, and lower transaction costs.
- Good interaction: good interaction (including meetings) help to bring the formal and informal (rules) together (internal and external), thereby lowering transaction costs, and promoting cooperative solutions—using cumulative experiences and collective learning.
- Adaptiveness: adaptiveness as opposed to rigidity, reduces transaction costs and improves inclusion and sustainability in face of changing internal and external environment.
- Appropriate scale: appropriate scale in size, scope and decision domain. Institutions that are too large have high transaction costs, and if too small, are unable to lower transaction and other costs.
- Compliance: institutions are made up of rules. Without stakeholder compliance to the rules of the institution, they cannot lower transaction costs and create impact.
- Technical rationality: efficient conversion of inputs to outputs: Good institutions must deliver technical rationality leading to high technical efficiency. Requirements include sound technology and other determinants of high productive efficiency such as expertise, design, waste recovery and automated controls.
- Organizational rationality: division of labor, specialization, and effective coordination. Good institutions must deliver organizational rationality. This includes sound division of labor/responsibilities, and specialization in functions, and effective coordination across them to best achieve overall goals.
- Political rationality: sense of fairness and justice. Good larger institutions must provide political rationality. Given human involvement/interdependence in institutions, concerns of fairness and justice must be addressed for sustainable performance.
Expansion of the Framework
- Technical rationality
- Environmental rationality
- Economic rationality
- Social rationality
- Political rationality
- Organizational rationality
- Financial rationality
- Government rationality
4. Survey and Data
Sample Profile and Features
5. Assessment of Rationalities
6. Assessment of Institutional Features
7. Assessment of the Performance of the Water-User Associations
7.1. Regression Analysis: Ordered Probit–Rationalities and Overall Performance
7.2. Regression Analysis: Ordered Probit–Institutional Features and Overall Performance
7.3. Regression Analysis: Ordered Probit–Rationalities and Performance on Different Goals
7.4. Ordered Probit–Financial Performance
8. Conclusions
Author Contributions
Funding
Acknowledgments
Conflicts of Interest
References
- Crase, L.; Gandhi, V.P. Reforming Institutions in Water Resource Management: Policy and Performance for Sustainable Development; Earthscan: London, UK, 2009; ISBN 978-1-138-86692-8. [Google Scholar]
- Gandhi, V.P.; Namboodiri, N.V. Water Resource Development and Institutions in India: Overview and Profile. In Reforming Institutions in Water Resource Management: Policy and Performance for Sustainable Development; Crase, L., Gandhi, V.P., Eds.; Earthscan: London, UK, 2009; pp. 146–165. [Google Scholar]
- Ostrom, E. Crafting Institutions for Self-Governing Irrigation Systems; ICS Press, Distributed to the Trade by National Book Network: San Francisco, CA, USA; Lanham, MD, USA, 1992; ISBN 978-1-55815-168-0. [Google Scholar]
- Gandhi, V.P.; Namboodiri, N.V. Water Resource Management in India: Institutions and Development. In Proceedings of the International workshop held in Bangkok, Bangkok, Thailand, 8–9 June 2001; Brennan, D., Ed.; Australian Centre for International Agricultural Research (ACIAR): Canberra, Australia, 2002; pp. 106–130. [Google Scholar]
- McCarthy, N.; Essam, T. Impact of Water User Associations on Agricultural Productivity in Chile; International Food Policy Research Institute (IFPRI): Washington, DC, USA, 2009. [Google Scholar]
- Zhang, L.; Heerink, N.; Dries, L.; Shi, X. Water users associations and irrigation water productivity in northern China. Ecol. Econ. 2013, 95, 128–136. [Google Scholar] [CrossRef] [Green Version]
- Wang, Y.; Wu, J. An Empirical Examination on the Role of Water User Associations for Irrigation Management in Rural China. Water Resour. Res. 2018, 54, 9791–9811. [Google Scholar] [CrossRef]
- Verghese, B.G. Water Resources in the Northeast: Development Options in a Cooperative Framework; The World Bank: Washington, DC, USA, 2006; Available online: http://web.worldbank.org/archive/website01062/WEB/IMAGES/PAPER_1_.PDF (accessed on 3 December 2019).
- Mahanta, C. Water Resources in the Northeast: State of the Knowledge Base. 2006. Available online: http://siteresources.worldbank.org/INTSAREGTOPWATRES/Resources/Background_Paper_2.pdf (accessed on 3 December 2019).
- Central Water Commission. Water & Related Statistics (2015); Central Water Commission: New Delhi, India, 2018.
- Bank, T.W. India—Development and Growth in Northeast. India: The Natural Resources, Water, and Environment Nexus; The World Bank: Washington, DC, USA, 2007; pp. 1–138. [Google Scholar]
- UNICEF; FAO; SaciWATERs. Water in India: Situation and Prospects; UNICEF, India Country Office: New Delhi, India, 2013. [Google Scholar]
- Douglass, N.C. Institutions, Institutional Change, and Economic Performance; Cambridge University Press: Cambridge, UK; New York, NY, USA, 1990; ISBN 978-0-521-39416-1. [Google Scholar]
- Williamson, O.E. Economic Institutions and Development: A View from the Bottom. In A Not-So-Dismal Science; Olson, M., Kähköhnen, S., Eds.; Oxford University Press: Oxford, UK, 2007; pp. 92–118. ISBN 978-0-19-829490-0. [Google Scholar]
- Olson, M.; Kähkönen, S. Introduction: The Broader View. In A Not-So-Dismal Science: A Broader View of Economies and Societies; Olson, M., Kähkönen, S., Eds.; Oxford University Press: Oxford, UK; New York, NY, USA, 2000; pp. 1–36. ISBN 978-0-19-829369-9. [Google Scholar]
- Picciotto, R. Putting Institutional Economics to Work: From Participation to Governance; World Bank Discussion Papers; The World Bank: Washington, DC, USA, 1995; ISBN 978-0-8213-3458-4. [Google Scholar]
- North, D.C. Prologue. In The Frontiers of the New Institutional Economics; Drobak, J.N., Nye, J.V.C., Eds.; Academic Press: San Diego, CA, USA, 1997; pp. 3–12. ISBN 978-0-12-222240-5. [Google Scholar]
- Drobak, J.N.; Nye, J.V.C. (Eds.) The Frontiers of the New Institutional Economics; Academic Press: San Diego, CA, USA, 1997; ISBN 978-0-12-222240-5. [Google Scholar]
- Crase, L.; Dollery, B.; Lockwood, M. Transaction Costs Emanating from Policy Flexibility in Water Markets. In Proceedings of the International Workshop Held in Bangkok, Bangkok, Thailand, 8–9 June 2001; Brennan, D., Ed.; Australian Centre for International Agricultural Research (ACIAR): Canberra, Australia, 2002; pp. 31–47. [Google Scholar]
- Curtis, A.; Robertson, A. Understanding landholder management of river frontages: The Goulburn Broken. Ecol. Manag. Restor. 2003, 4, 45–54. [Google Scholar] [CrossRef]
- Saleth, R.M.; Dinar, A. The Institutional Economics of Water: A Cross-Country Analysis of Institutions and Performance; Edward Elgar: Cheltenham, UK, 2004; ISBN 978-0-8213-5656-2. [Google Scholar]
- Pagan, P. Laws, Customs and Rules: Identifying the Characteristics of Successful Water Institutions. In Reforming Institutions in Water Resource Management; Crase, L., Gandhi, V.P., Eds.; Earthscan: London, UK, 2009. [Google Scholar]
- Nystrom, P.C.; Starbuck, W.H. (Eds.) Handbook of Organizational Design: 1: Adapting Organizations to Their Environments; Oxford University Press: Oxford, UK; New York, NY, USA, 1981; ISBN 978-0-19-827241-0. [Google Scholar]
- Groth, L. Future Organizational Design: The Scope for the IT-Based Enterprise; Wiley Series in Information Systems; John Wiley & Sons: Chichester, UK; New York, NY, USA, 1999; ISBN 978-0-471-98893-9. [Google Scholar]
- Ackroyd, S. The Organization of Business: Applying Organizational Theory to Contemporary Change; Oxford University Press: Oxford, UK; New York, NY, USA, 2002; ISBN 978-0-19-874269-2. [Google Scholar]
- Gandhi, V.P.; Crase, L.; Herath, G. Comparing Indian Irrigation Institutions: What Determines Institutional Behaviour and Performance? Preliminary Empirical Observations. In Proceedings of the 2006 Conference (50th), Sydney, Australia, 8–10 February 2006; Australian Agricultural and Resource Economics Society: Canberra, Australia, 2006. [Google Scholar]
- Gandhi, V.P.; Crase, L.; Roy, A. Water Institutions in the States of Andhra Pradesh, Gujarat and Maharashtra in India: An Empirical Study. In Reforming Institutions in Water Resource Management: Policy and Performance for Sustainable Development; Crase, L., Gandhi, V.P., Eds.; Earthscan: London, UK, 2009; pp. 20–44. [Google Scholar]
- Gandhi, V.P. A Conceptual Framework for Studying Institutions in Watershed Development; Working Paper. No. 2010-11-04; Indian Institute of Management Ahmedabad: Ahmedabad, India, 2010; Available online: https://core.ac.uk/download/pdf/6443343.pdf (accessed on 2 September 2019).
- Ministry of Agriculture & Farmers Welfare. Agricultural Statistics at a Glance 2018; Ministry of Agriculture & Farmers Welfare: New Delhi, India, 2018. Available online: https://eands.dacnet.nic.in/PDF/Agricultural%20Statistics%20at%20a%20Glance%202018.pdf (accessed on 10 July 2019).
- Greene, W.H. Econometric Analysis; Pearson Education India: Delhi, India, 2003; ISBN 978-81-7758-684-8. [Google Scholar]


| State/U.T. | Major & Medium Irrigation Projects Surface Water | Minor Irrigation | Total (Major, Medium & Minor) | ||
|---|---|---|---|---|---|
| Surface Water | Ground Water | Total | |||
| Arunachal Pradesh | 0 | 150 | 18 | 168 | 168 |
| Assam | 970 | 1000 | 900 | 1900 | 2870 |
| Bihar | 5224 | 1544 | 4120 | 5664 | 10,888 |
| Jharkhand | 1276 | 354 | 830 | 1184 | 2460 |
| Manipur | 135 | 100 | 369 | 469 | 604 |
| Meghalaya | 20 | 85 | 63 | 148 | 168 |
| Mizoram | 0 | 65 | 5 | 70 | 70 |
| Nagaland | 10 | 70 | 5 | 75 | 85 |
| Orissa | 3600 | 1000 | 4203 | 5203 | 8803 |
| Sikkim | 20 | 50 | 0 | 50 | 70 |
| Tripura | 100 | 100 | 81 | 181 | 281 |
| West Bengal | 2300 | 1300 | 3318 | 4618 | 6918 |
| Total | 13,655 | 5818 | 13,912 | 19,730 | 33,385 |
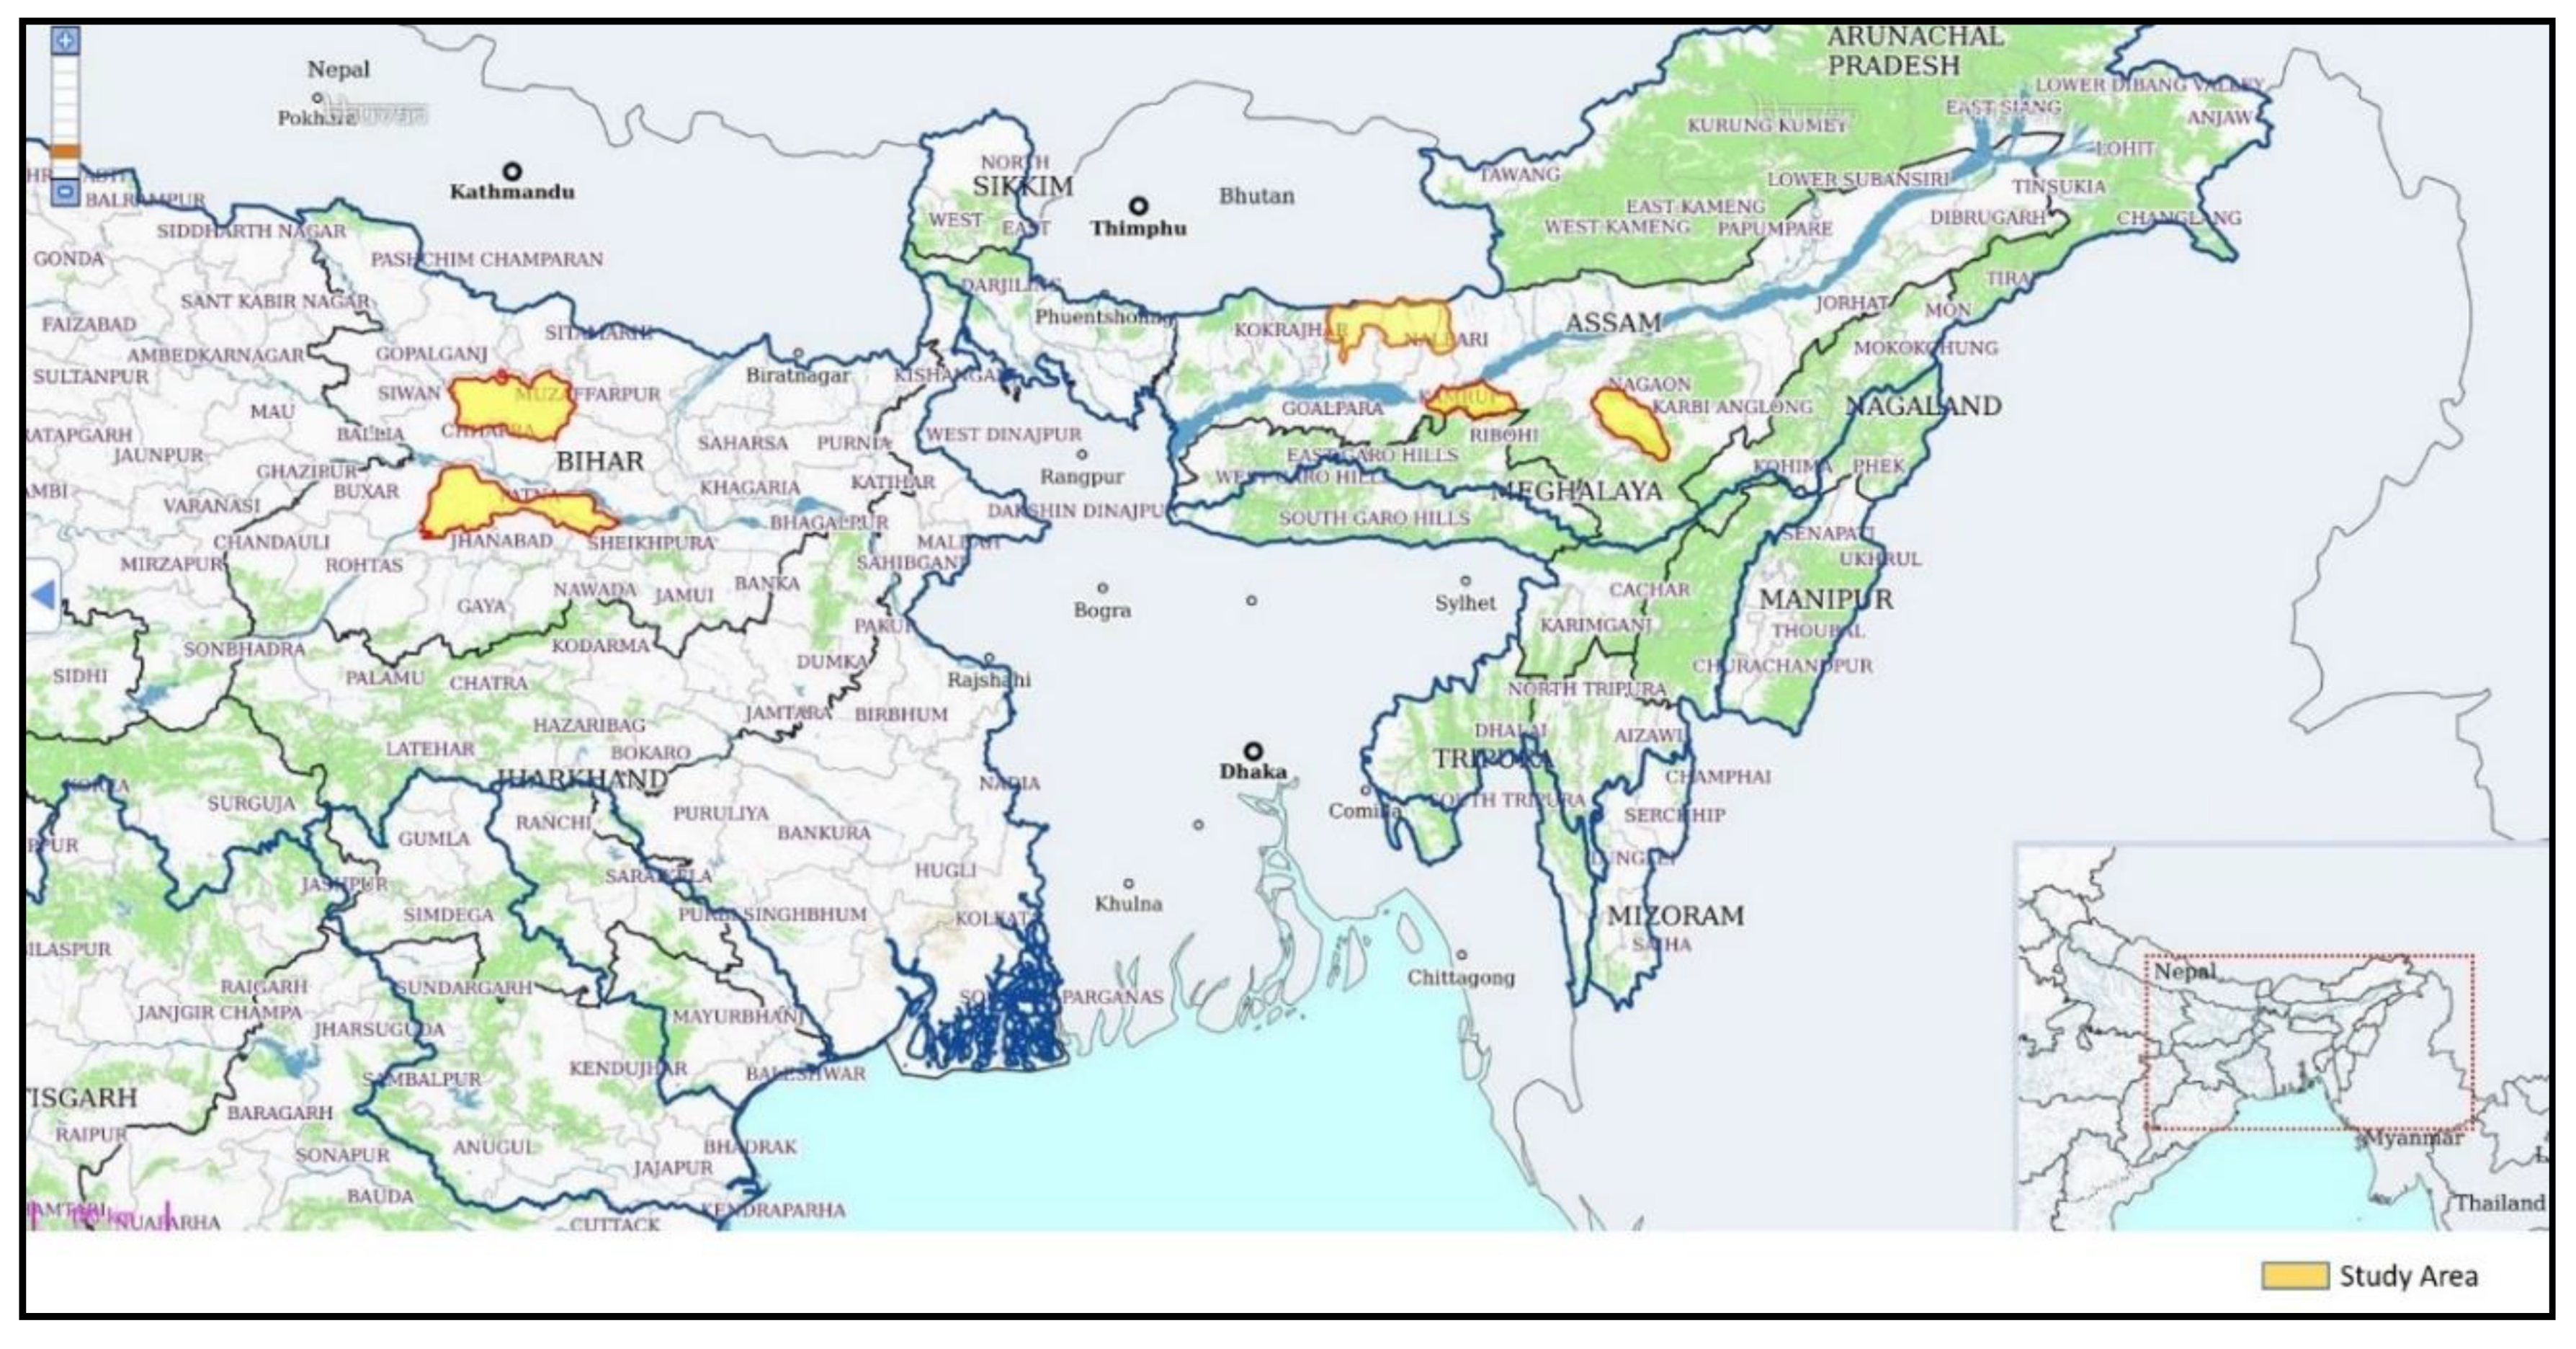
| SI.no. | Water User Association Central Level Committee (CLC) | State | Type |
|---|---|---|---|
| 1 | Maloibari | Assam | River Lift |
| 2 | Sukhajani | Assam | Canal |
| 3 | Khairani | Assam | River Diversion |
| 4 | Paligunj | Bihar | Canal |
| 5 | Jetwalia | Bihar | Canal |
| 6 | R P Channel 3 | Bihar | Canal |
| State | Survey | Sample Size |
|---|---|---|
| Assam | Farmer-Institutional survey | 252 |
| Bihar | Farmer-Institutional survey | 258 |
| Total | Farmer-Institutional survey | 510 |
| Total No. of Water-User Associations | 51 |
| Landholding | Irrigated | Unirrigated | Total |
|---|---|---|---|
| Owned | 1.08 | 0.14 | 1.22 |
| Leased in | 0.16 | 0.01 | 0.17 |
| Leased out | 0.05 | 0.01 | 0.06 |
| Total Operated | 1.18 | 0.14 | 1.32 |
| Features | Percentage | Mean | ||||
|---|---|---|---|---|---|---|
| Strongly Agree (5) | Agree (4) | Partly Agree/Disagree (3) | Disagree (2) | Strongly Disagree (1) | ||
| 1. You face water scarcity on your farm | 23.1 | 45.5 | 6.3 | 22.2 | 2.9 | 3.6 |
| 2. Your farm/village is affected by floods | 7.8 | 12.6 | 2.4 | 22.9 | 54.3 | 2.0 |
| 3. Your farm/village is affected by droughts | 3.3 | 26.1 | 13.9 | 37.3 | 19.4 | 2.6 |
| 4. The water availability has improved over the years | 5.1 | 30.8 | 6.7 | 37.8 | 19.6 | 2.6 |
| 5. The land/soils on your farm are good for cropping | 24.9 | 64.3 | 4.5 | 5.3 | 1.0 | 4.1 |
| 6. You use modern agricultural technology on your farm | 25.7 | 65.9 | 2.9 | 2.9 | 2.6 | 4.1 |
| 7. Your dependence on the WUA is substantial | 24.7 | 31.8 | 5.5 | 21.8 | 16.3 | 3.3 |
| 8. The WUA has been formed by the government | 8.8 | 29.4 | 3.7 | 34.5 | 23.5 | 2.7 |
| 9. The WUA is controlled & managed by the government | 3.9 | 26.3 | 10.2 | 40.2 | 19.4 | 2.6 |
| 10. The WUA is managed by the farmers | 26.1 | 42.2 | 5.5 | 19.0 | 7.3 | 3.6 |
| Rationalities | Agree% | Mean |
|---|---|---|
| 1. Technical Rationality | ||
| 1. The location and placement of the irrigation structures/equipment is technically sound | 83.9 | 4.1 |
| 2. The structures and equipment are of good quality | 44.3 | 3.0 |
| 3. The structures and equipment are adequate | 29.4 | 2.5 |
| 4. The structures and equipment are regularly repaired and well maintained | 39.4 | 2.8 |
| 5. Government/technically trained experts have been always involved | 23.7 | 2.3 |
| 6. The water release/distribution are technically well scheduled and managed | 45.5 | 2.9 |
| 7. Technical training and guidance are available and provided to all involved | 22.5 | 2.3 |
| 2. Environmental Rationality | ||
| 1. The environmental care and problems are well addressed (including water conservation, soil conservation, soil fertility, natural vegetation and life) | 52.5 | 3.1 |
| 2. Drainage system is adequate and well maintained | 49.8 | 2.9 |
| 3. There is no water logging due to irrigation activities | 60.6 | 3.3 |
| 4. Flooding and flood waters are well controlled and damages promptly repaired | 40.6 | 2.7 |
| 5. There is no deterioration in the groundwater table/water resources due to irrigation activities | 46.9 | 2.9 |
| 3. Economic Rationality | ||
| 1. The farming activity and the environment create strong demand for irrigation water from the farmers | 76.3 | 3.9 |
| 2. Improved water management gives substantial increase in production and marketed surplus from the farming activity | 53.5 | 3.3 |
| 3. Improved water management leads to crop diversification and adoption of more profitable crops | 22.4 | 2.3 |
| 4. Adequate infrastructure, marketing/processing arrangements are available to give good prices | 34.1 | 2.7 |
| 5. Improved water availability and management lead to good profitability for the farmers | 55.9 | 3.2 |
| 4. Social Rationality | ||
| 1. Involvement and participation of various social groups is actively done. | 81.8 | 3.9 |
| 2. Benefits and concerns of the small and marginal farmers are actively considered | 68.8 | 3.6 |
| 3. Changes have been made for bringing participation and inclusion of views of women. | 7.1 | 1.6 |
| 4. Benefits and concerns of the poor, landless, and weaker social groups are actively considered | 69.0 | 3.5 |
| 5. Young People/Youth (15–29 years) are involved and participate | 41.8 | 2.8 |
| 6. Older/Experienced people are involved and participate | 87.5 | 4.1 |
| 7. People of all social groups have the opportunity to be members, participate, and be on executive committees/hold posts | 61.8 | 3.3 |
| Rationalities | Agree% | Mean |
|---|---|---|
| 5. Political Rationality | ||
| 1. Participation and representation of all important village leaders/groups is there in the organization and committees of the WUA. | 46.5 | 2.9 |
| 2. There is adequate representation of women in leadership roles | 4.1 | 1.4 |
| 3. There is adequate representation of youth (15–29 years) in leadership roles | 33.7 | 2.6 |
| 4. There is adequate representation of older/experienced people in leadership roles | 76.7 | 3.8 |
| 5. The WUA has strong and politically able leadership | 53.5 | 3.1 |
| 6. There is wide political support, consensus, and no major conflicts in the WUA activities. | 51.8 | 3.0 |
| 7. The WUA is able to ensure fairness and justice | 57.5 | 3.3 |
| 6. Organizational Rationality | ||
| 1. The WUA general bodies meet regularly | 45.3 | 2.8 |
| 2. The WUA Executive Committees (EC) are well composed, and meet regularly. | 49.0 | 3.0 |
| 3. The WUA leadership/staff is knowledgeable and competent in managing the WUA activities. | 61.4 | 3.4 |
| 4. The WUA leaders/staff are competent in bringing/ensuring member participation and contribution including in fees/finance | 47.6 | 3.0 |
| 5. The WUA leadership is competent in handling government relationships, and obtaining government cooperation and support | 48.2 | 2.9 |
| 7. Financial Rationality | ||
| 1. There are good arrangements for receiving money, accounting, auditing and disbursement of funds | 62.2 | 3.3 |
| 2. There is no mismanagement, diversion, loss of funds, or disputes about funds | 51.0 | 3.0 |
| 3. There is regular and adequate collection of the fees and dues from the members | 52.9 | 3.2 |
| 4. The required dues are deposited with the government or banks in time | 32.9 | 2.5 |
| 5. The WUA receives sufficient funds and is financially sound | 41.8 | 2.8 |
| 8. Government Rationality | ||
| 1. The government has formulated appropriate Acts/Laws and plans/schemes for supporting and promoting WUAs | 35.3 | 2.6 |
| 2. The government has sufficient manpower to support the WUA activities | 32.7 | 2.5 |
| 3. The government charges are reasonable/(not too high) | 69.8 | 3.6 |
| 4. The government controls and rules are reasonable/good | 48.0 | 2.9 |
| 5. The government provides sufficient financial resources and on time | 11.2 | 2.0 |
| 6. The government officials help in planning, mobilizing, organizing, and implementation including in resolving disputes and problems | 21.8 | 2.3 |
| 7. The government officials are well trained, provide good training and have a positive attitude in supporting WUAs | 23.9 | 2.3 |
| Institutional Features | Agree% | Mean |
|---|---|---|
| 1. Clear Objectives/Clarity of Purpose | ||
| 1. The WUA has clear objectives and purpose | 64.1 | 3.4 |
| 2. The WUA objectives/purpose/roles are known and clear to everyone | 57.5 | 3.2 |
| 3. The WUA has an agreement with the government clearly specifying the objectives | 20.8 | 2.1 |
| 4. The WUA regularly makes plans and actions towards achievement of the objectives | 46.9 | 2.9 |
| 5. There are no frequent deviations from the WUA objectives and plans | 47.8 | 2.9 |
| 2. Good interaction | ||
| 1. There is good interaction between the WUA and its members/villagers | 60.8 | 3.4 |
| 2. There is good interaction within WUA executive committees/officials | 52.0 | 3.1 |
| 3. All social and farmer groups (including head/tail farmers) have representation in the executive committees | 57.1 | 3.2 |
| 4. There are regular and frequent meetings with participation of all social and farmer groups | 44.1 | 2.9 |
| 5. The meetings discuss all the important WUA objectives, plans, concerns and activities relevant to the members | 47.6 | 3.0 |
| 6. There is good interaction between the WUA and the government including visits and participation in the meetings | 34.7 | 2.6 |
| 7. There is good leadership to help and guide the interactions | 49.2 | 3.0 |
| 3. Adaptiveness | ||
| 1. The WUA rules, plans and procedures are often adapted/changed to member needs, village conditions, water availability and environment variations | 44.5 | 2.9 |
| 2. There are processes/for reviewing and adapting the rules, plans and procedures | 47.5 | 2.9 |
| 3. There are instances when the rules such as water timings/quantity/seasonal availability/plans were changed/adapted | 32.5 | 2.6 |
| 4. Scale/Size | ||
| 1. The scale/scope of operation of the WUA is too large for effective water management | 39.4 | 2.7 |
| 2. The scale/scope of operation of the WUA is too small for effective water management | 33.9 | 2.5 |
| 3. The scale/scope of operation of the WUA is appropriate | 65.1 | 3.5 |
| 4. Greater devolution of powers, resources and responsibility downward from government to WUA’s will be beneficial | 71.6 | 3.8 |
| 5. Greater centralization of powers, resources and responsibility upward (opposite of devolution) from WUA’s to government will be beneficial | 25.3 | 2.4 |
| 6. The current distribution of powers, resources and responsibility between government, WUA and farmers is appropriate | 58.6 | 3.2 |
| 5. Compliance | ||
| 1. The WUA’s rules and schedules for water management are not frequently broken by members/villagers | 52.5 | 3.0 |
| 2. The WUA uses its powers to bring compliance to the rules | 27.6 | 2.5 |
| 3. Penalties and fines are imposed by the WUA for breaking of rules, damage, non-payment and non-participation | 30.8 | 2.5 |
| 4. Members recognize the authority of the WUA to impose penalties | 42.5 | 2.8 |
| 5. The WUA encourages a culture of compliance | 44.3 | 2.9 |
| 6. The WUA encourages members to report non-compliance | 30.4 | 2.5 |
| 7. Members follow the rules about payment of water fees and water extraction/use | 54.3 | 3.1 |
| Performance Aspects | Excellent (5) | Good (4) | Satisfactory (3) | Somewhat Poor (2) | Very Poor (1) | Mean |
|---|---|---|---|---|---|---|
| 1. Overall Assessment of the Performance of the WUA | 5.88 | 39.41 | 13.73 | 28.63 | 12.35 | 2.98 |
| 2. Performance on Water Availability and Use | 2.16 | 29.61 | 27.84 | 29.41 | 10.98 | 2.83 |
| 3. Performance on Economic Benefits | 0.39 | 30.20 | 45.10 | 17.25 | 7.06 | 3.00 |
| 4. Performance on Equity in Water Distribution and Benefits | 2.55 | 32.75 | 26.86 | 29.22 | 8.63 | 2.91 |
| 5. Performance on Environment Care and Impact | 0.78 | 39.22 | 33.14 | 20.59 | 6.27 | 3.08 |
| 6. Performance on Financial Management | 2.75 | 18.82 | 28.63 | 35.69 | 14.12 | 2.60 |
| Parameter Estimates | ||||
|---|---|---|---|---|
| Coefficient | Standard | Approx | ||
| Parameter | Estimate | Error | t Value | Pr > |t| |
| Intercept | −3.481219 | 0.338816 | −10.27 | <0.0001 |
| TechR | 0.462224 | 0.100692 | 4.59 | <0.0001 |
| EnvR | 0.211463 | 0.099028 | 2.14 | 0.0327 |
| EcoR | 0.380315 | 0.079068 | 4.81 | <0.0001 |
| SocR | 0.430323 | 0.108434 | 3.97 | <0.0001 |
| PolR | 0.214952 | 0.116745 | 1.84 | 0.0656 |
| OrgR | 0.245714 | 0.081435 | 3.02 | 0.0026 |
| FinR | 0.188955 | 0.079932 | 2.36 | 0.0181 |
| GovR | −0.227159 | 0.082229 | −2.76 | 0.0057 |
| d1Bihar | −0.439755 | 0.128491 | −3.42 | 0.0006 |
| Pseudo R2: Adjusted Estrella = 0.6065, McKelvey-Zavinova = 0.6244 | ||||
| Parameter Estimates | ||||
|---|---|---|---|---|
| Coefficient | Standard | Approx | ||
| Parameter | Estimate | Error | t Value | Pr > |t| |
| Intercept | −3.142061 | 0.384192 | −8.18 | <0.0001 |
| Clrob | 0.099127 | 0.072542 | 1.37 | 0.1718 |
| GooInt | 0.424164 | 0.08385 | 5.06 | <0.0001 |
| Adap | 0.270281 | 0.070108 | 3.86 | 0.0001 |
| ScSz | 0.675628 | 0.129632 | 5.21 | <0.0001 |
| Compl | 0.272105 | 0.09626 | 2.83 | 0.0047 |
| d1Bihar | 0.152624 | 0.122917 | 1.24 | 0.2144 |
| Pseudo R2: Adjusted Estrella = 0.5865, McKelvey-Zavinova = 0.6031 | ||||
| Parameter Estimates | ||||
|---|---|---|---|---|
| Coefficient | Standard | Approx | ||
| Parameter | Estimate | Error | t Value | Pr > |t| |
| Intercept | −2.740752 | 0.360712 | −7.60 | <0.0001 |
| TechR | 0.383114 | 0.107075 | 3.58 | 0.0003 |
| EnvR | 0.105635 | 0.104989 | 1.01 | 0.3143 |
| EcoR | 0.705363 | 0.089667 | 7.87 | <0.0001 |
| SocR | 0.140418 | 0.116092 | 1.21 | 0.2265 |
| PolR | 0.274024 | 0.124089 | 2.21 | 0.0272 |
| OrgR | 0.260911 | 0.085511 | 3.05 | 0.0023 |
| FinR | 0.096296 | 0.084444 | 1.14 | 0.2541 |
| GovR | 0.195521 | 0.085208 | 2.29 | 0.0218 |
| d1Bihar | -0.804864 | 0.137402 | −5.86 | <0.0001 |
| Pseudo R2: Adjusted Estrella = 0.6523, McKelvey-Zavinova = 0.6777 | ||||
| Parameter Estimates | ||||
|---|---|---|---|---|
| Coefficient | Standard | Approx | ||
| Parameter | Estimate | Error | t Value | Pr > |t| |
| Intercept | −3.539881 | 0.347984 | −10.17 | <0.0001 |
| TechR | −0.079868 | 0.104015 | −0.77 | 0.4426 |
| EnvR | 0.371003 | 0.105366 | 3.52 | 0.0004 |
| EcoR | 0.216499 | 0.080782 | 2.68 | 0.0074 |
| SocR | 0.074102 | 0.112284 | 0.66 | 0.5093 |
| PolR | 0.530874 | 0.123912 | 4.28 | <0.0001 |
| OrgR | 0.522564 | 0.086478 | 6.04 | <0.0001 |
| FinR | 0.085388 | 0.083557 | 1.02 | 0.3068 |
| GovR | 0.11937 | 0.086023 | 1.39 | 0.1652 |
| d1Bihar | 0.21983 | 0.133267 | 1.65 | 0.099 |
| Pseudo R2: Adjusted Estrella = 0.5666, McKelvey-Zavinova = 0.6088 | ||||
| Parameter Estimates | ||||
|---|---|---|---|---|
| Coefficient | Standard | Approx | ||
| Parameter | Estimate | Error | t Value | Pr > |t| |
| Intercept | −1.811805 | 0.323559 | −5.60 | <0.0001 |
| TechR | 0.092052 | 0.098377 | 0.94 | 0.3494 |
| EnvR | 0.373877 | 0.098105 | 3.81 | 0.0001 |
| EcoR | 0.364374 | 0.078006 | 4.67 | <0.0001 |
| SocR | 0.27949 | 0.107367 | 2.60 | 0.0092 |
| PolR | 0.003186 | 0.115544 | 0.03 | 0.978 |
| OrgR | 0.065744 | 0.080312 | 0.82 | 0.413 |
| FinR | 0.054098 | 0.078984 | 0.68 | 0.4934 |
| GovR | 0.095183 | 0.078423 | 1.21 | 0.2249 |
| d1Bihar | 0.846352 | 0.127433 | 6.64 | <0.0001 |
| Pseudo R2: Adjusted Estrella = 0.3251, McKelvey-Zavinova = 0.3861 | ||||
| Parameter Estimates | ||||
|---|---|---|---|---|
| Coefficient | Standard | Approx | ||
| Parameter | Estimate | Error | t Value | Pr > |t| |
| Intercept | −1.864579 | 0.328574 | −5.67 | <0.0001 |
| TechR | 0.05084 | 0.101543 | 0.50 | 0.6166 |
| EnvR | 0.146444 | 0.099701 | 1.47 | 0.1419 |
| EcoR | 0.021094 | 0.079144 | 0.27 | 0.7898 |
| SocR | 0.054526 | 0.110431 | 0.49 | 0.6215 |
| PolR | −0.150727 | 0.118974 | −1.27 | 0.2052 |
| OrgR | 0.143716 | 0.08197 | 1.75 | 0.0796 |
| FinR | 0.526647 | 0.081936 | 6.43 | <0.0001 |
| GovR | 0.552462 | 0.082059 | 6.73 | <0.0001 |
| d1Bihar | −1.257892 | 0.133013 | −9.46 | <0.0001 |
| Pseudo R2: Adjusted Estrella = 0.5575, McKelvey-Zavinova = 0.5851 | ||||
© 2019 by the authors. Licensee MDPI, Basel, Switzerland. This article is an open access article distributed under the terms and conditions of the Creative Commons Attribution (CC BY) license (http://creativecommons.org/licenses/by/4.0/).
Share and Cite
Gandhi, V.P.; Johnson, N. Enhancing Performance of Participatory Water Institutions in the Eastern Indo-Gangetic Plains: What Can We Learn from New Institutional Economics and Governance Theories? Water 2020, 12, 70. https://doi.org/10.3390/w12010070
Gandhi VP, Johnson N. Enhancing Performance of Participatory Water Institutions in the Eastern Indo-Gangetic Plains: What Can We Learn from New Institutional Economics and Governance Theories? Water. 2020; 12(1):70. https://doi.org/10.3390/w12010070
Chicago/Turabian StyleGandhi, Vasant P., and Nicky Johnson. 2020. "Enhancing Performance of Participatory Water Institutions in the Eastern Indo-Gangetic Plains: What Can We Learn from New Institutional Economics and Governance Theories?" Water 12, no. 1: 70. https://doi.org/10.3390/w12010070