Behavior of PBTC, HEDP, and Aminophosphonates in the Process of Wastewater Treatment


1
Institute for Sanitary Engineering, Water Quality and Solid Waste Management, University of Stuttgart, Bandtäle 2, 70569 Stuttgart, Germany
2
TZW: DVGW Water Technology Center, Karlsruher Straße 84, 76139 Karlsruhe, Germany
*
Author to whom correspondence should be addressed.
Water 2020, 12(1), 53; https://doi.org/10.3390/w12010053
Submission received: 25 November 2019
/
Revised: 18 December 2019
/
Accepted: 20 December 2019
/
Published: 21 December 2019
(This article belongs to the Section Wastewater Treatment and Reuse)
Abstract
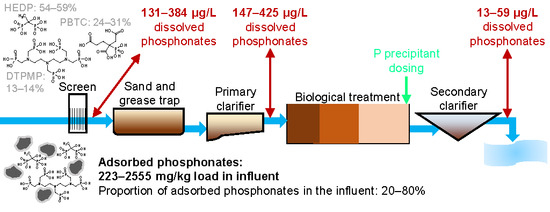
:Ten times at intervals of 1–2 months, individual treatment stages of two wastewater treatment plants (WWTPs) were analyzed for the five quantitatively most widely used phosphonates. The total dissolved concentration of the investigated phosphonates in the influents was between 131 µg/L and 384 µg/L. The nitrogen-free phosphonates 2-phosphonobutane-1,2,4-tricarboxylic acid (PBTC) and 1-hydroxyethylidene(1,1-diphosphonic acid) (HEDP) accounted for an average proportion of 83–85%. Diethylenetriaminepenta(methylene phosphonic acid) (DTPMP) contributed with 13–14%, whereas aminotris(methylphosphonic acid) (ATMP) (≤15 µg/L) and ethylenediaminetetra(methylene phosphonic acid) (EDTMP) (≤11 µg/L) contents detected in the WWTP influents were comparatively low. The application of new analytical methods allowed the quantification of phosphonates in the solid fraction of the WWTP influents for the first time. High loads of phosphonates were determined (223–2555 mg/kg), indicating that 20%–80% of the phosphonates are present in the adsorbed state. The removal of total dissolved phosphonate by secondary clarification was between 69.7% and 92.4% (medians: 90.7% and 87.7%). In both WWTPs, HEDP (medians: 89.2% and 86.4%) was slightly better eliminated than PBTC (medians: 87.2% and 82.5%). In the sand filtration stage of a WWTP, the average removal was not further improved. In contrast, an additional removal of dissolved phosphonates could be achieved by activated carbon treatment (median: 96.4%). The proportion of phosphonate-P in the dissolved unreactive phosphorus fraction was consistently between 10% and 40% throughout all treatment stages.
1. Introduction
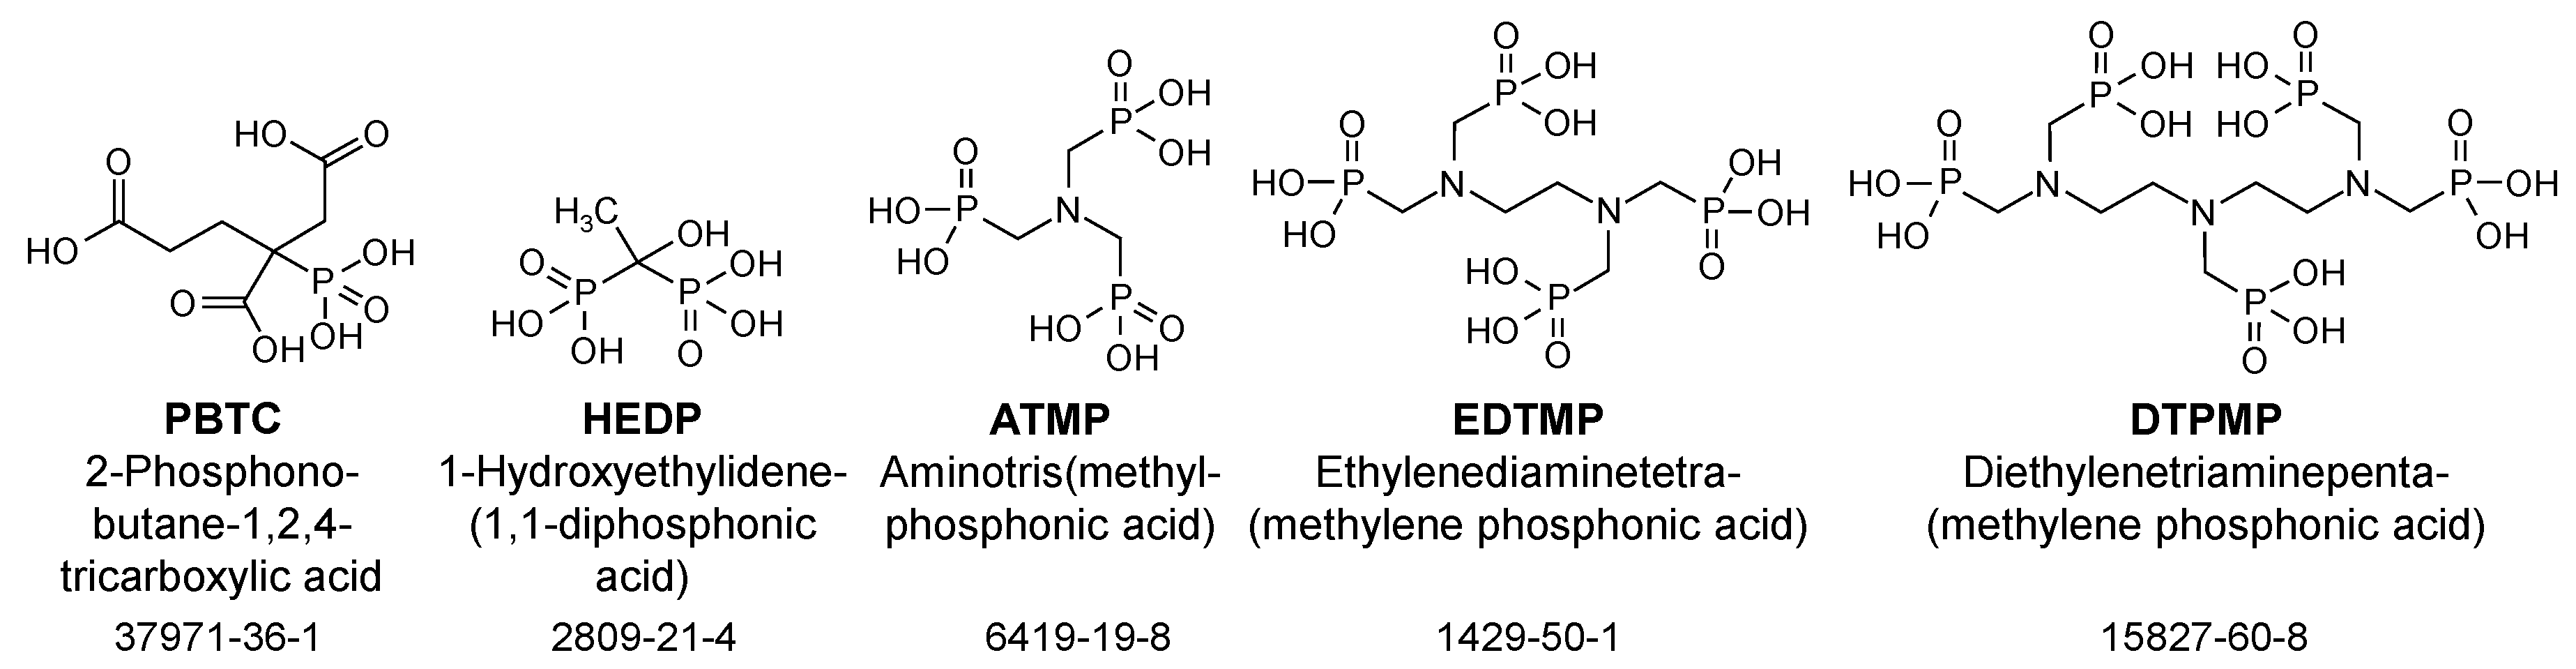
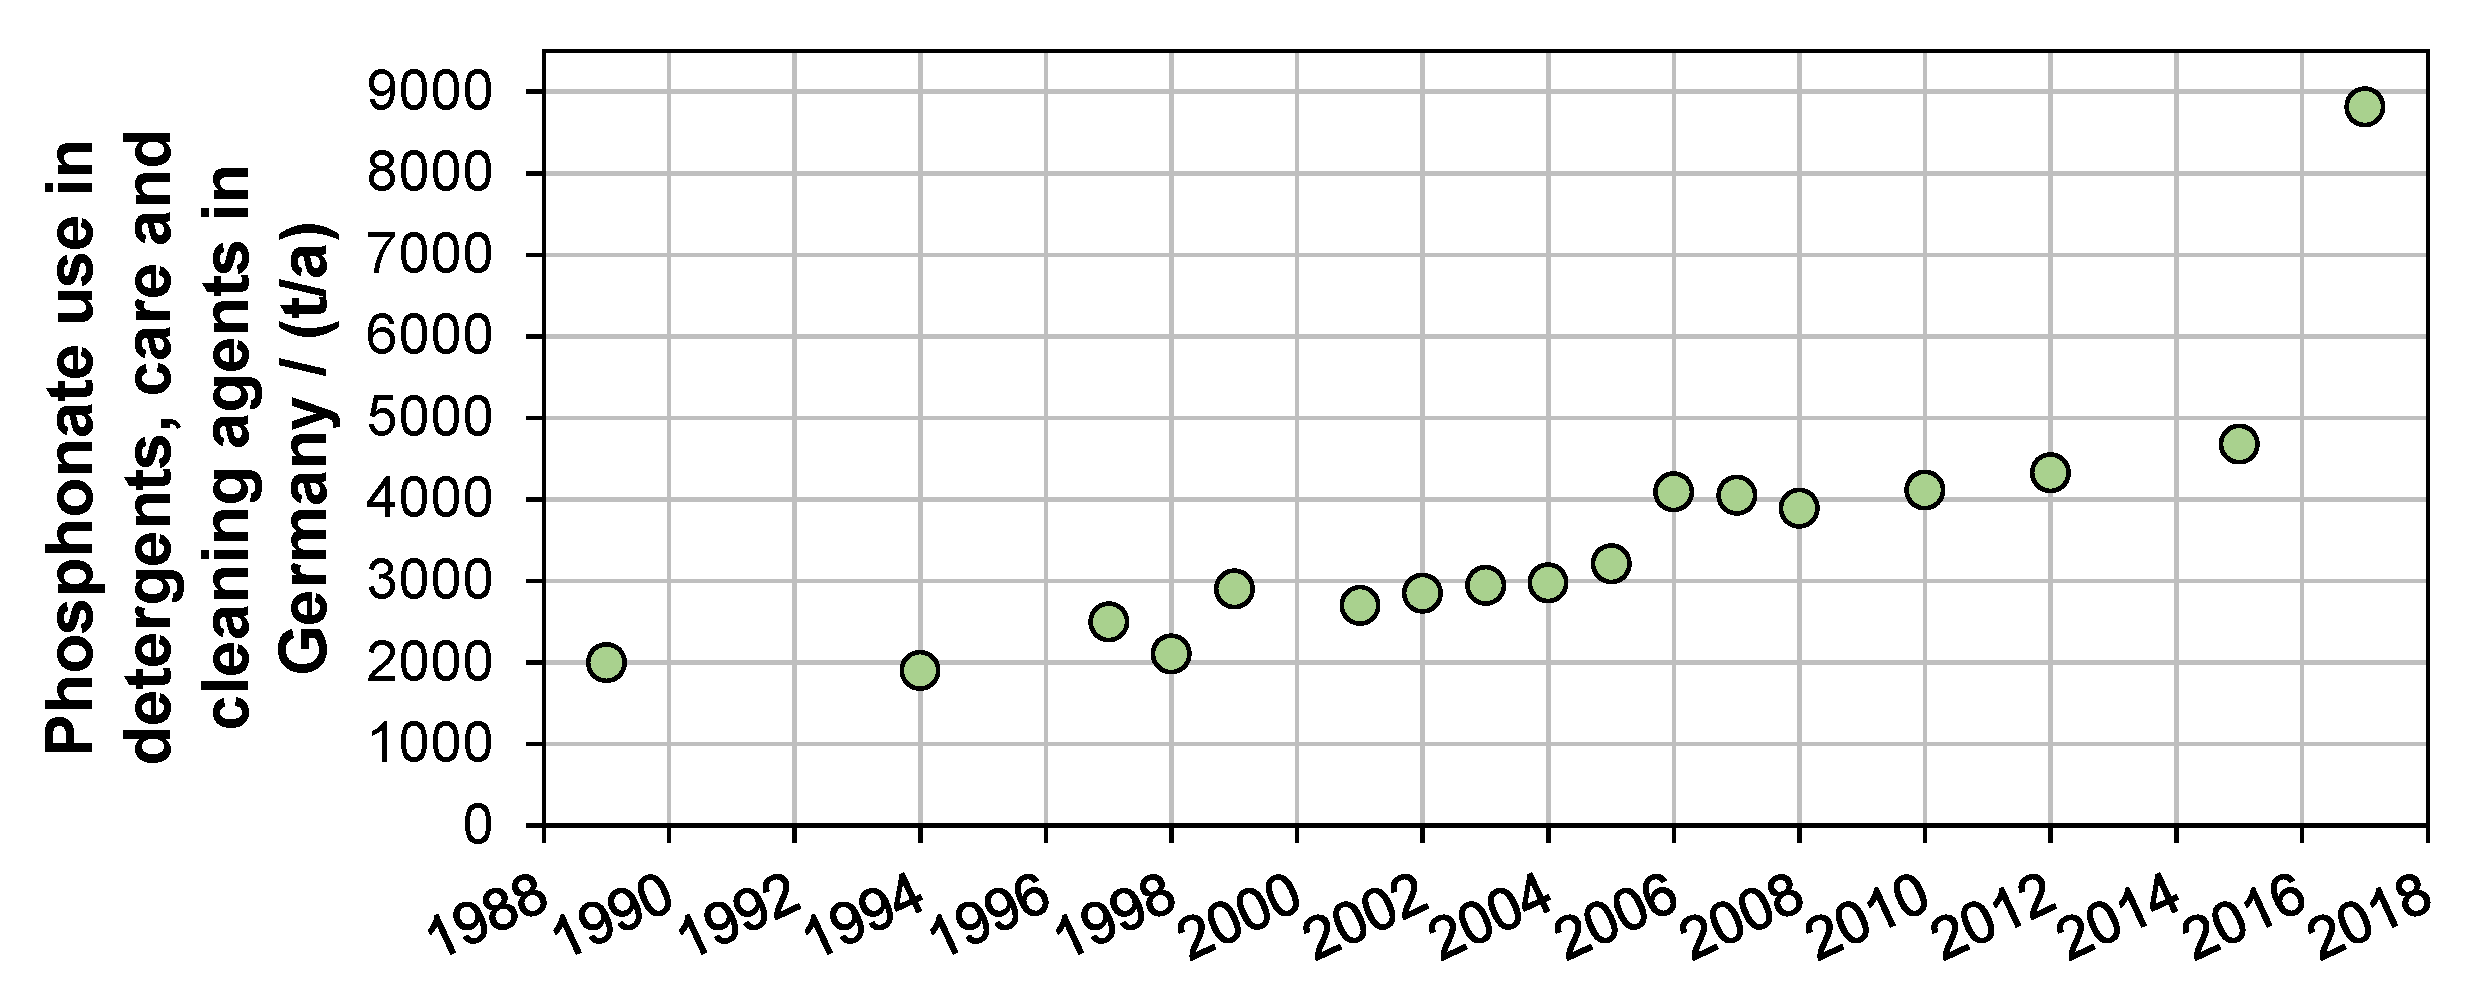
Despite poor biodegradability, phosphonates are increasingly used as complexing agents in detergents, care and cleaning agents (DCC), and as industrial chemicals. The phosphonates most frequently contained in these products are 2-phosphonobutane-1,2,4-tricarboxylic acid (PBTC), 1-hydroxyethylidene(1,1-diphosphonic acid) (HEDP), aminotris(methylphosphonic acid) (ATMP), ethylenediaminetetra(methylene phosphonic acid) (EDTMP), and diethylenetriaminepenta-(methylene phosphonic acid) (DTPMP) (Figure 1) [1]. In Germany, the phosphonate usage in domestic DCC products steadily increased 4.4-fold between 1989 (2000 t/a) and 2017 (8816 t/a) (Figure A1) [2,3]. Together with the use in other applications, e.g., in water treatment, surface coating processes, pulp and paper industry, and textile industry, the total annual use is estimated to add up to 94,000 t/a (in 2012) worldwide, which is about 1.7-fold higher than in 1998 (56,000 t/a) [1,4,5].
Phosphorus in wastewater can essentially be divided into three fractions using the molybdenum blue method and different sample pretreatment techniques. The concentration (c in mg/L) of the particulate P fraction (PP) corresponds to the difference between total P (sample digestion with persulfate and sulfuric acid) and dissolved P (total P of the membrane-filtered sample). The concentration of the dissolved unreactive phosphorus fraction (DUP) corresponds to the difference between dissolved P and ortho-phosphate-P (o-PO4-P, no pretreatment) [6]:
c (PP) = c (total P) − c (dissolved P)
c (DUP) = c (dissolved P) − c (o-PO4-P)
Phosphonates contribute to the PP and DUP fraction. The latter one has been observed with an increasing tendency in wastewater treatment plants (WWTPs) since the early 1980s, i.e., simultaneously with the beginning of the industrial use of phosphonates [7]. The removal of this phosphorus fraction is difficult to control for WWTP operators. Thus, the DUP fraction impedes the compliance with P limits. Until now, no studies on the phosphonate-P/DUP ratio or on the proportion of adsorbed phosphonates in municipal wastewater have been published. Phosphonates are known for their remarkable adsorption affinity towards mineral surfaces [8,9,10]. This is of particular interest in view of the high concentration of solids in municipal wastewater.
Phosphonates are demanding analytes, requiring special analytical methods and sample treatment. Consequently, few publications on the concentrations and behavior of phosphonates in WWTPs exist. Most of these describe field studies in which phosphonates were dosed into the influent in the mg/L-range in order to make them determinable with less sensitive analytical methods [11,12,13,14]. Only four publications specify the actual concentrations of phosphonates in wastewater. However, in three of them the underlying analytical methods had comparatively high limits of detection (LOD) (25–40 µg/L [15] and 15–57 µg/L [14,16]). Thus, no information about the elimination of phosphonates in the trace-concentration range by tertiary treatment stages such as sand filtration and activated carbon treatment could be derived.
Furthermore, these publications only covered the dissolved concentrations of aminophosphonates in the influent and effluent. Only recently, two methods for the analysis of phosphonates with environmentally relevant limits of quantification (LOQs) have been published. The method by Wang et al. [17], which is applicable to wastewater, is based on the pre-methylation of phosphonates and their detection using liquid chromatography coupled to orbitrap mass spectrometry (LC-Orbitrap MS/MS). ATMP, EDTMP, DTPMP, HDTMP, HEDP, and PBTC were investigated in the influent and effluent of three Chinese WWTPs [17]. The analytical method allowed the trace-determination of phosphonates (LOQs: 0.005 µg/L PBTC, 0.010 µg/L HEDP, 0.008 µg/L ATMP, 0.020 µg/L EDTMP, 0.200 µg/L DTPMP) in the effluents and thus the derivation of the elimination rates (>95%) without artificial phosphonate-dosing of the influent. According to our knowledge, it represents the sole study covering the nitrogen-free phosphonates HEDP and PBTC. However, the method did not involve internal phosphonate standards and none of the previously described methods allowed the quantification of phosphonates in the solid fraction of wastewater. For the current study, the method by Armbruster et al. [18] was used, which allows the quantification of phosphonates from liquid and solid matrices. In combination with adapted sample preparation techniques, the method based on ion exchange chromatography coupled to tandem mass spectrometry with electrospray ionization (IC-ESI-MS/MS) involves isotope-labeled internal phosphonate standards and achieves low LOQs (surface water: 0.04–0.16 µg/L, wastewater: 0.6–2.3 µg/L, river sediment and suspended matter: <0.1 mg/kg, and solids of wastewater: <1 mg/kg).
Within the scope of this work, two WWTPs (one of which was equipped with additional sand filtration and, alternatively, activated carbon treatment) were selected for the monitoring of phosphonates. In order to establish a comprehensive phosphonate balancing within municipal wastewater (dissolved phosphonate and particle-bound phosphonate), the solid matter fraction of the WWTP influent was extracted and analyzed for phosphonates in the adsorbed state. The phosphonate-P/DUP ratio was determined for all WWTP stages. Monitoring of phosphonates in WWTPs has never before been performed on such a large time-scale, including all five most-frequently used phosphonates (based on real concentrations) in different treatment stages.
2. Materials and Methods
2.1. Sampling Concept
2.1.1. Overview
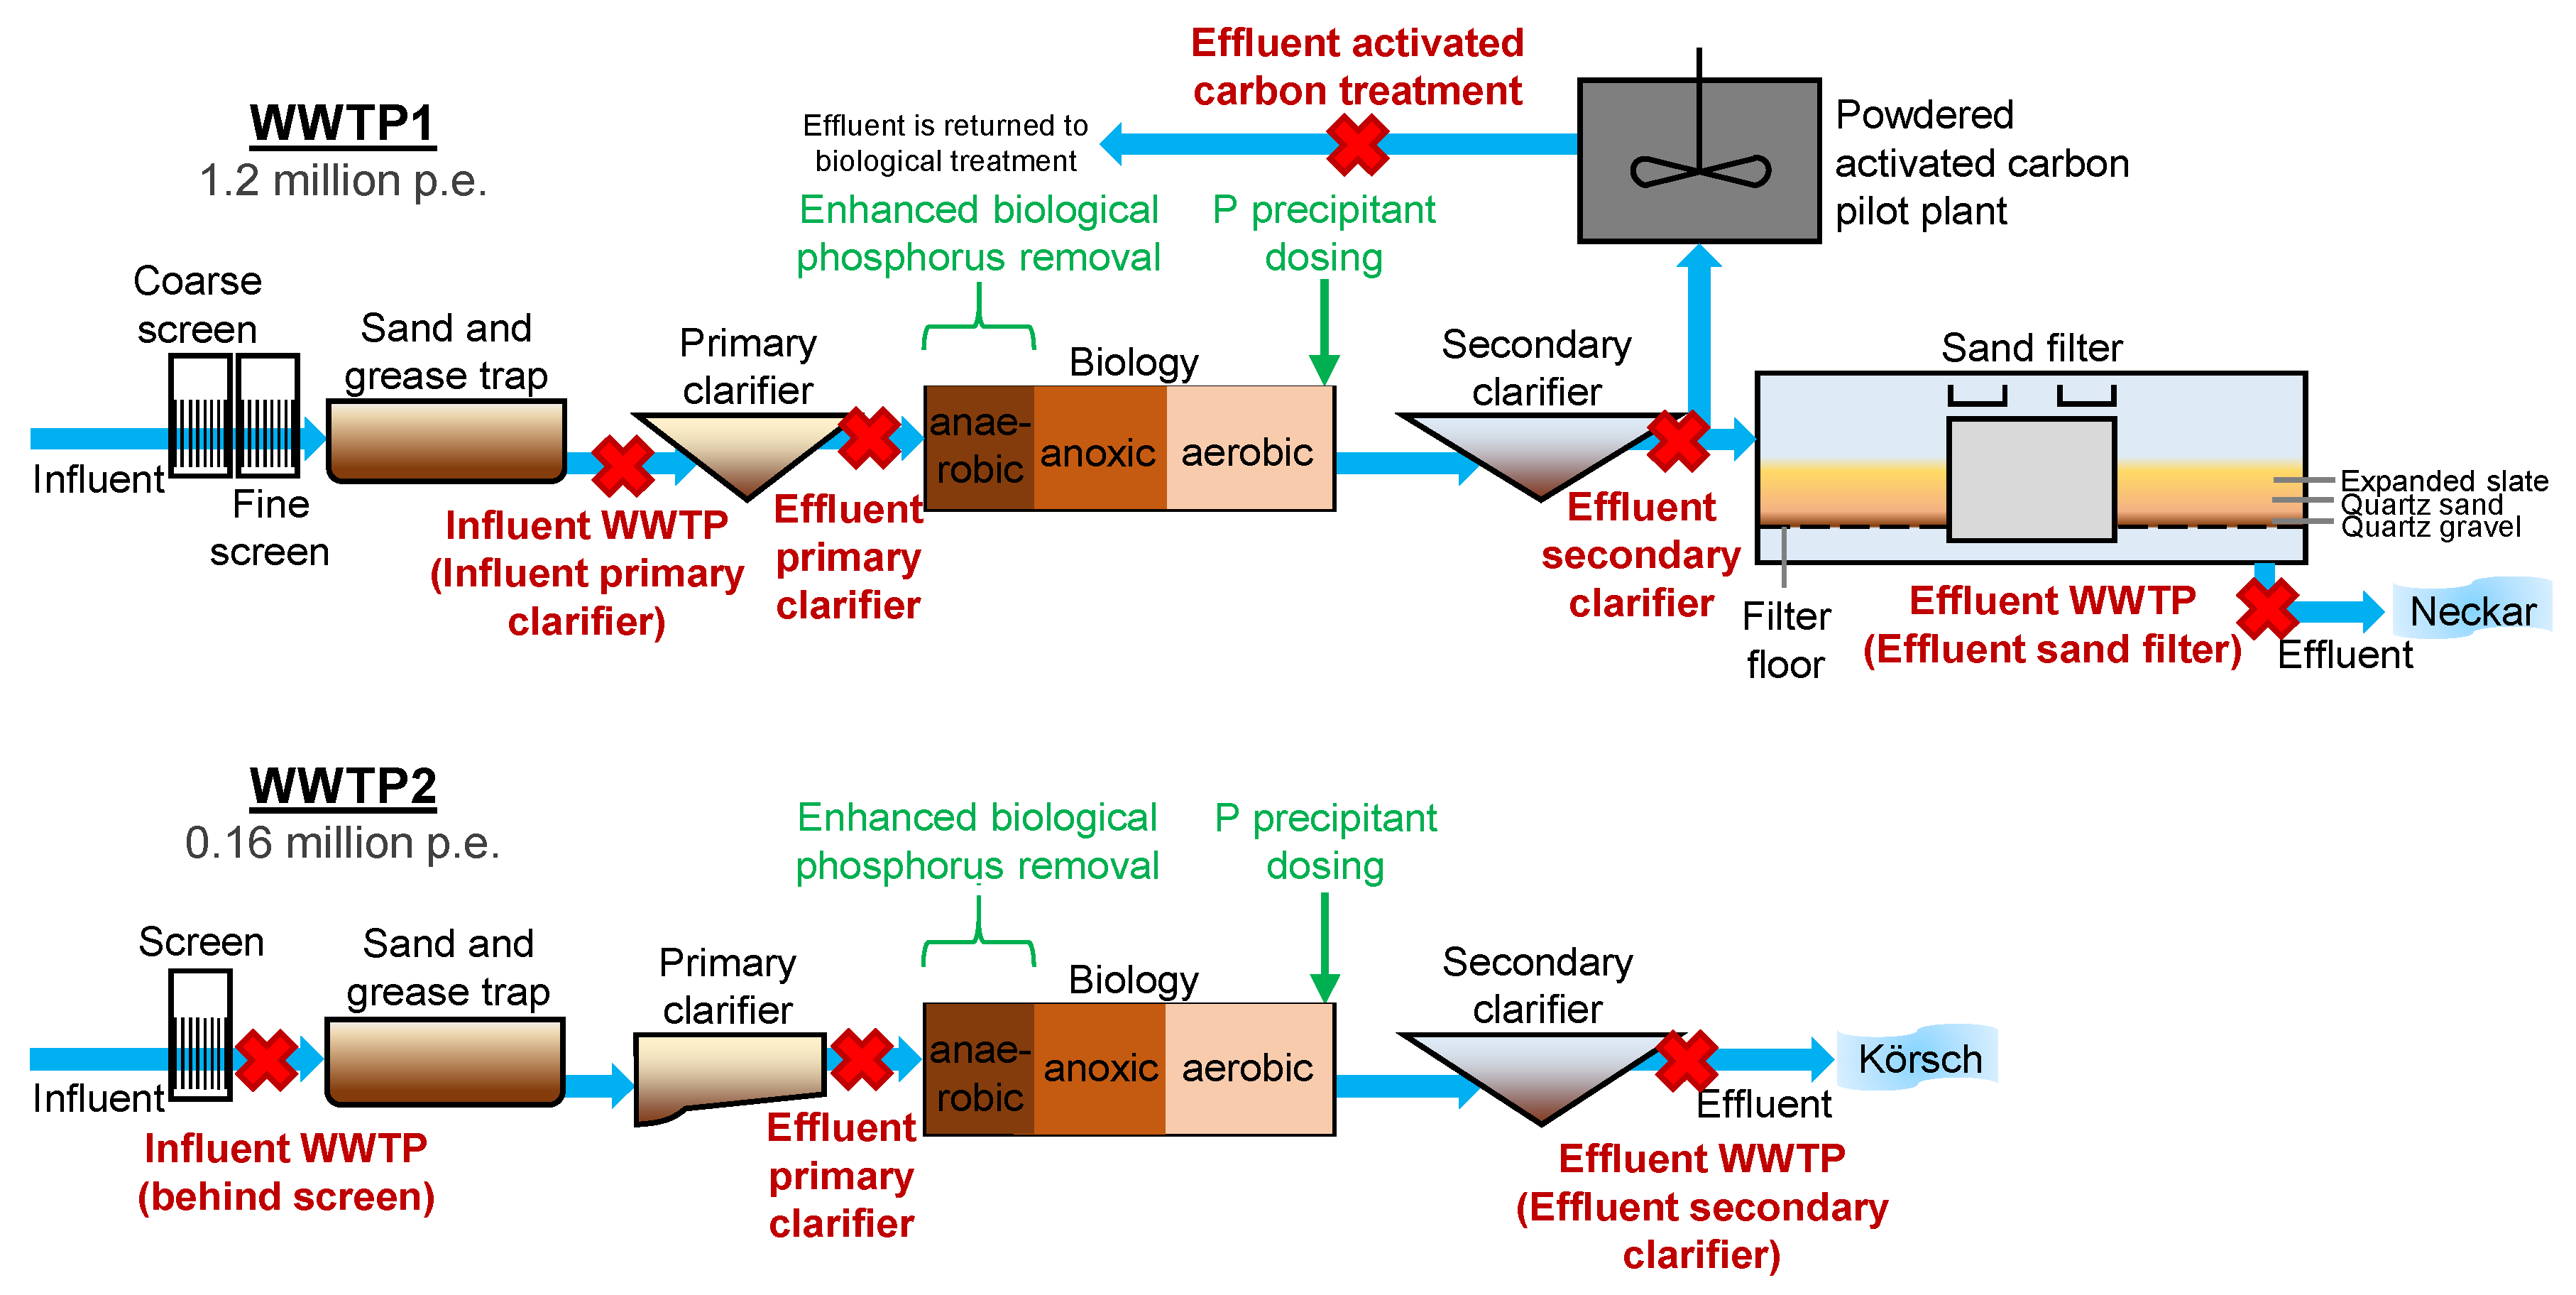
The two largest WWTPs of Stuttgart/Germany WWTP Stuttgart-Mühlhausen (WWTP1, 1.2 million population equivalents, 60 million m3/a wastewater, inflow: 1.5–7.5 m3/s) and WWTP Stuttgart-Möhringen (WWTP2, 160 thousand population equivalents, 6–7 million m3/a wastewater, inflow: 100–200 L/s) were sampled at 10 intervals of 1–2 months. Both WWTPs have anaerobic basins for enhanced biological phosphorus removal (EBPR) as well as chemical P precipitation (Figure 2). WWTP2 is medium-sized, constructed in a typical setup (screen, sand/grease trap, primary sedimentation, denitrification/nitrification tanks, and secondary sedimentation) and represents an average WWTP. This WWTP was chosen in order to investigate the influence of phosphonates originating from domestic products because it is mainly fed with domestic wastewater with negligible industrial wastewater burden. WWTP1 belongs to the ten largest WWTPs in Germany. In this WWTP, a further treatment of the secondary effluent is routinely performed by an additional rapid sand filtration stage. At the time of sampling, a pilot plant was operated for the evaluation of an alternative secondary effluent treatment using powdered activated carbon. Separation of the activated carbon was achieved by flocculation using iron chloride sulfate and a two-layer filter (anthracite and quartz sand).
On each sampling date, the influent (liquid and solid phase in order to determine the load of adsorbed phosphonates in the influent), the primary effluent (only liquid phase here and hereafter), the secondary effluent, and, if applicable, the effluent of additional treatment stages were sampled (Figure 2). On three sampling dates, the activated carbon plant was inactive (calendar week 07, 28, and 40). All samples were analyzed for the five phosphonates shown in Figure 1, pH, concentration of total P, dissolved P and o-PO4-P (thus enabling the calculation of PP and DUP), and the solid matter content in the inflow. The sampling of both WWTPs was performed within the years 2016 and 2017 with the aim of covering an overall evenly distributed range throughout the calendar weeks.
2.1.2. Liquid Samples
The samples were taken as 24-h composite samples by means of automatic samplers. The 24-h composite samples were collected in WWTP1 from 6:00 to 6:00 the following day and in WWTP2 from 8:00 to 8:00 accordingly. The samples were stored at 4 °C in the dark until phosphonate analysis. Phosphonates proved to be stable for a prolonged period of time under these conditions [15].
2.1.3. Solids Extraction from WWTP Influent Samples
Approximately 500 mL of the homogenized WWTP influent sample was centrifuged at 20,000 rpm using a laboratory centrifuge (Sorvall RC-5B Refrigerated Superspeed Centrifuge, Thermo Fisher Scientific, Waltham, MA, USA). The supernatant was decanted and the solid phase was freeze-dried using the freeze-dryer Alpha 2–4 (Christ, Osterode am Harz, Germany). All solids were stored in plastic boxes at room temperature.
2.2. Analytical Methods
2.2.1. pH Determination
The pH was determined by using the pH electrode SenTix 41 and the pH 340i meter (both: WTW GmbH, Weilheim, Germany).
2.2.2. Solids Concentration
The determination of the solids concentration of the WWTP influents was carried out as follows: Filtration of a defined volume of homogenized sample by means of a cellulose-nitrate filter with 0.45 µm pore width; weighing of the dry filter before and after use; calculation of the quotient of the filter load and sample volume.
2.2.3. Phosphorus (Total P, Dissolved P, o-PO4-P)
Total P and o-PO4-P concentrations exceeding 0.05 mg/L were determined using the LCK 349 (0.05–1.50 mg/L P), LCK 348 (0.5–5.0 mg/L P), and LCK 350 (2–20 mg/L P) cuvette rapid tests (minimum–maximum detectable concentrations) and the photometer DR2800 (HachLange, Berlin, Germany). For the determination of total P, the samples were digested for two hours at 120 °C in a heating block HT200S or LT200 (both: HachLange, Berlin, Germany). Values of <0.05 mg/L P were determined according to ISO 6878 (molybdenum blue method using 10 cm measuring cuvettes, LOQ: 5 µg/L, LOD: 1 µg/L) [19]. The ISO specifically mentions that for some polyphosphonic acids up to 90 min of digestion are required. Furthermore, it was shown for all five phosphonates in Figure 1 that a total oxidation of organic P to phosphate-P is ensured with K2S2O8 and H2SO4 as proposed by ISO 6878 and applied in the cuvette rapid tests [20]. For the determination of dissolved P and o-PO4-P, the samples were filtered prior to digestion and analysis (cellulose-nitrate membrane filter with 0.45 µm pore width). Double determinations were performed for all parameters.
2.2.4. Sample Preparation for Phosphonate Analysis
The background and validation of the sample preparation techniques used for this study have already been presented in detail by Armbruster et al. [18] in another publication. In this paragraph, this preparation technique is described briefly. The dissolved phosphonate content of wastewater samples allowed the direct determination after sample treatment involving filtration (syringe filter, 0.45 µm), addition of isotope-labeled internal standard and a cation exchange step (AG MP-50; Bio-Rad Laboratories GmbH, Munich, Germany). Solid samples from WWTPs (0.05 g) were mixed with isotope-labeled internal standard solution and, after 1 h of equilibration time, digested with an extraction medium (15 mL) containing sodium hydroxide (0.5 mol/L) and nitrilotriacetic acid trisodium salt (NTA; 0.1 mol/L) in an ultrasonic bath for 1 h at 50 °C. After centrifugation and separation of the supernatant, the extraction step was repeated. The supernatants were combined at equal proportions and quantified by IC-ESI-MS/MS after cation exchange.
2.2.5. Phosphonate Quantification via IC-ESI-MS/MS
The analysis was carried out via anion exchange chromatography in accordance with Armbruster et al. [18]. The method involves a ten-minute washing step with dilute eluent (18 mmol/L sodium hydroxide) immediately after injection for the chromatographic separation of interfering anions with low charge and NTA (present in the extracts of solid samples), followed by a sodium hydroxide gradient with a constant proportion of 20% methanol and detection via ESI-MS/MS. This chromatography was applied uniformly to all samples. The phosphonate concentrations of wastewater samples and the extracts of solid samples allowed the determination of the target analytes by direct measurement at an injection volume of 25 µL (LOQs: 0.9 µg/L PBTC, 1.1 µg/L HEDP, 0.6 µg/L ATMP, 1.4 µg/L EDTMP, 2.3 µg/L DTPMP). Reliability and robustness of the method are significantly enhanced by the use of isotope-labeled internal standards and were described in detail in the respective publication.
3. Results and Discussion
3.1. Dissolved and Adsorbed Phosphonates in WWTP Influents
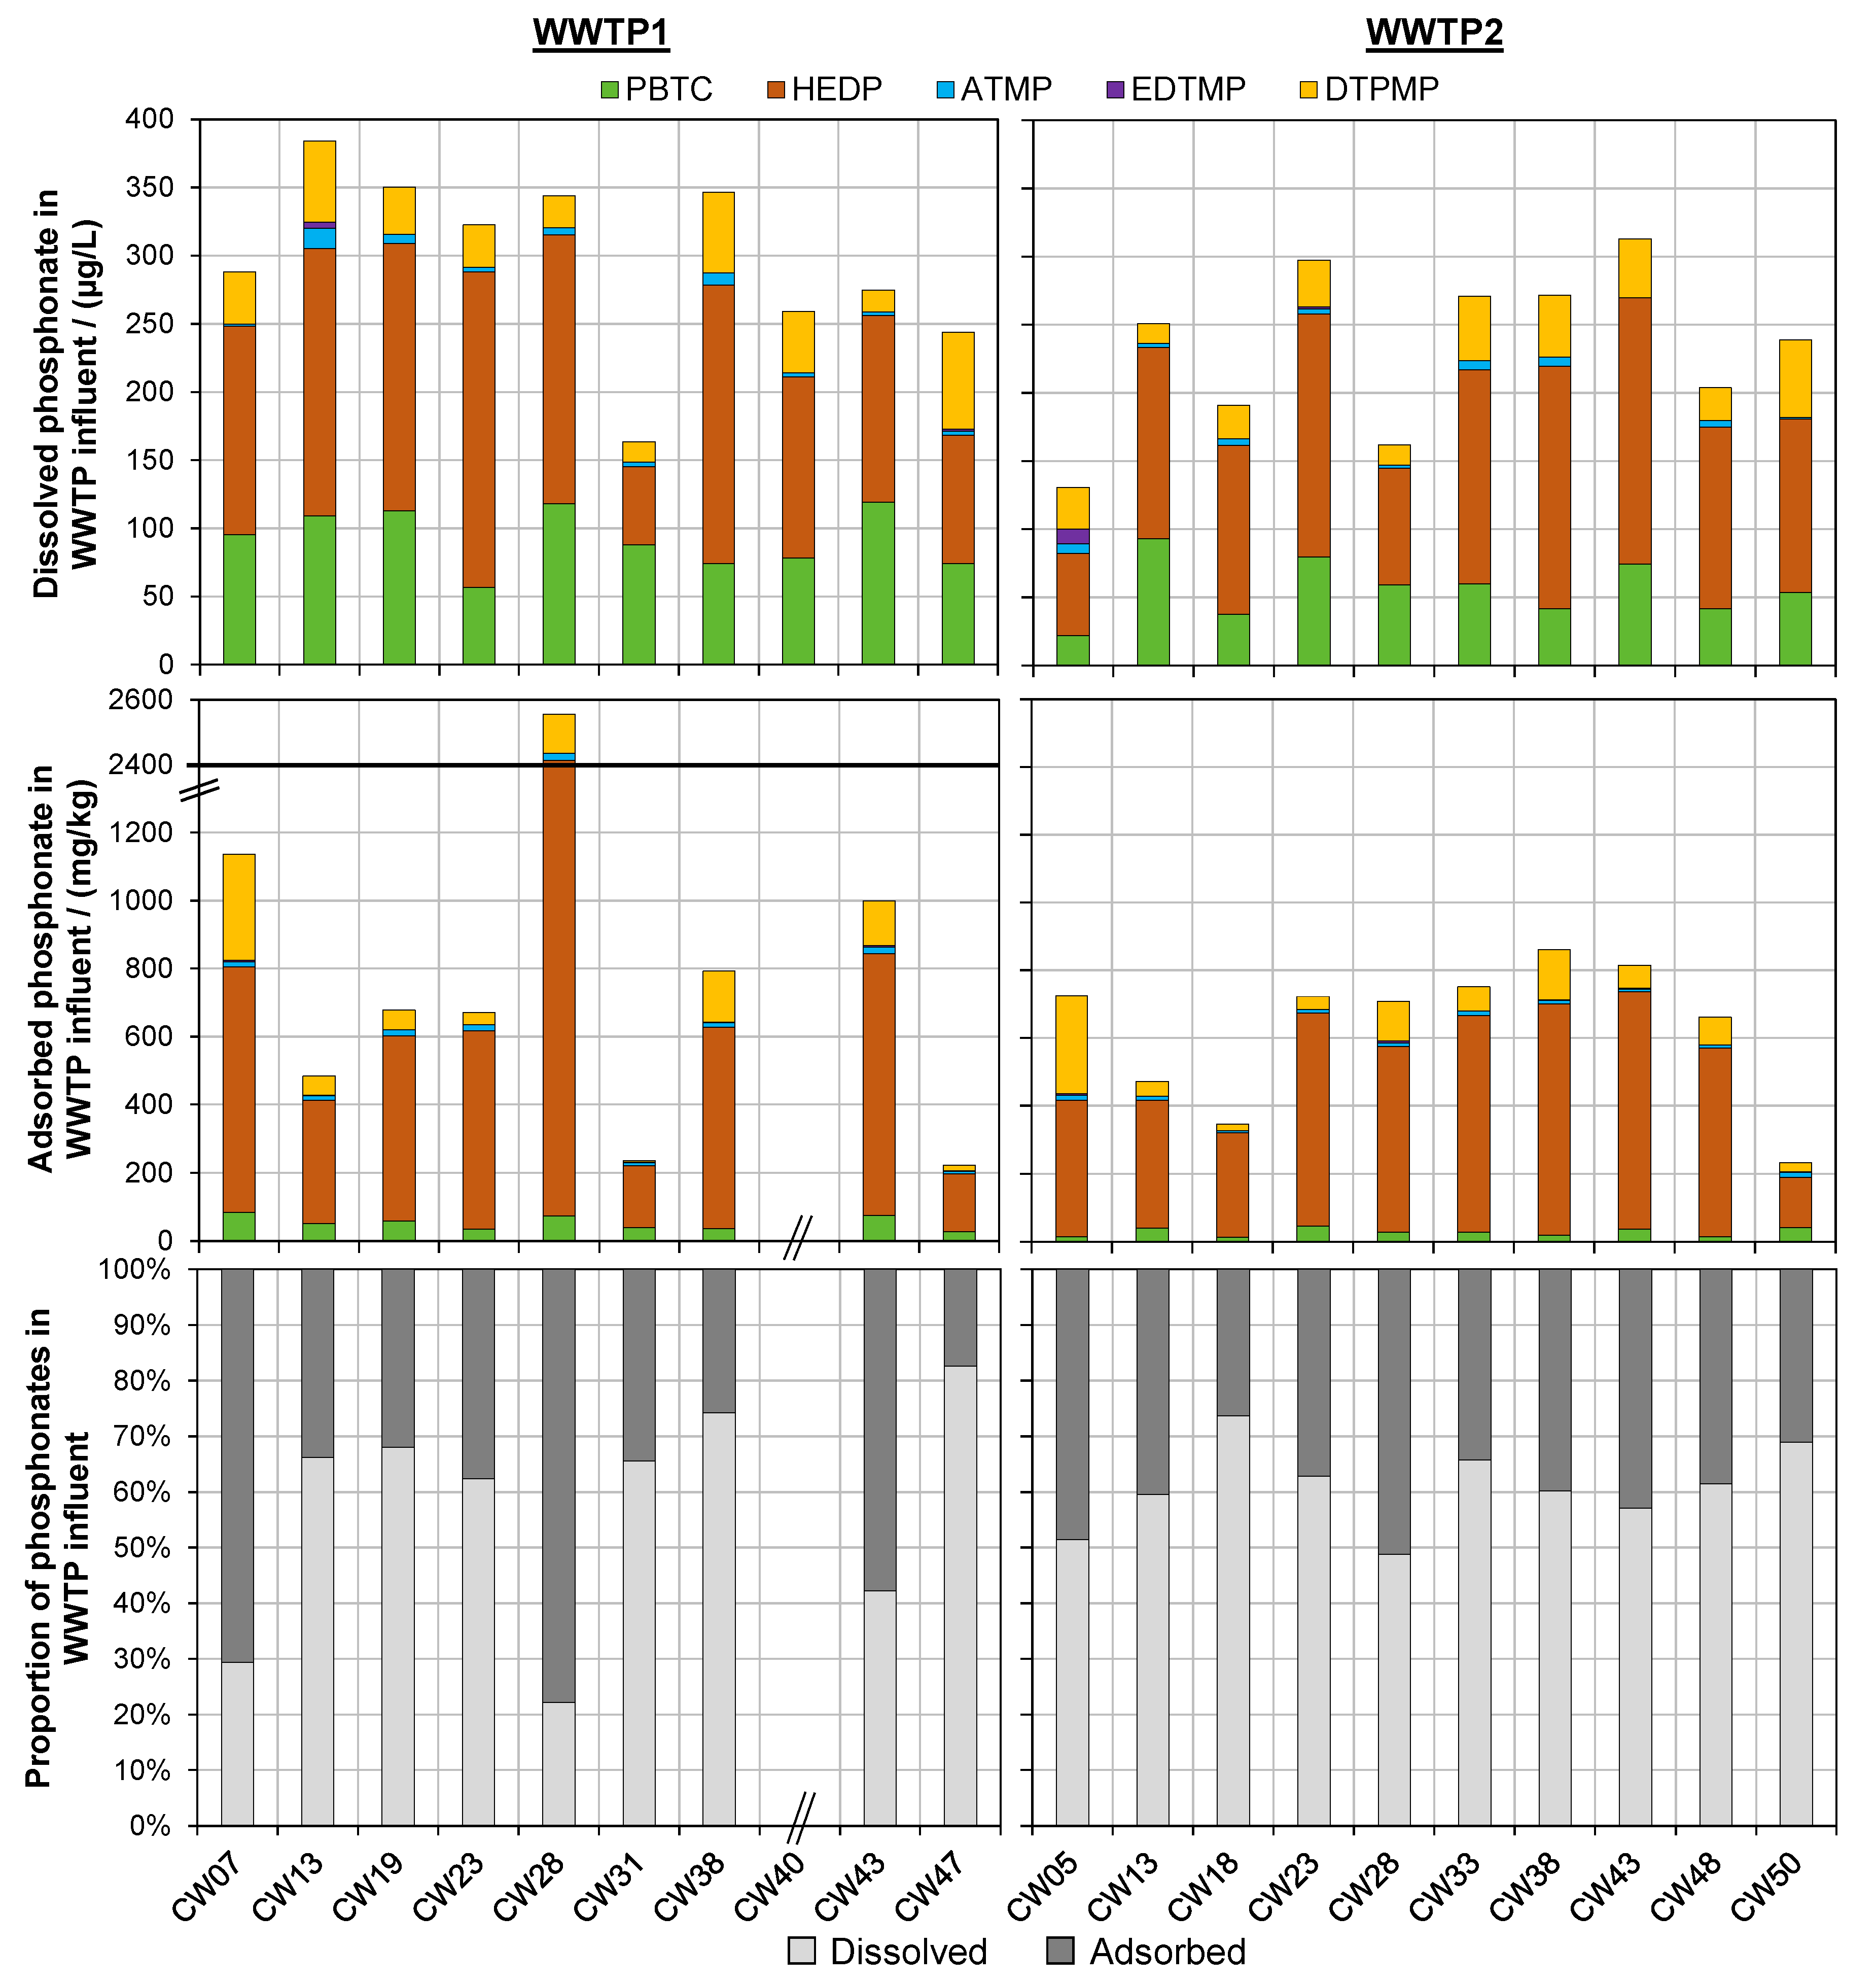
The diagrams in the top row of Figure 3 summarize the dissolved concentrations of each individual phosphonate in the WWTP influents according to the calendar week (CW). Boxplot presentations of the phosphonate concentrations throughout the year are depicted in Figure 4.
The ATMP (<0.6–15 µg/L) and EDTMP (<1.4–11 µg/L) contents detected throughout all twenty samples in the WWTP influents were lower than the contents of ATMP (20–250 µg/L) and EDTMP (30–65 µg/L) detected by Nowack [16] in randomly analyzed influents of seven Swiss WWTPs. The same applies for the concentrations of ATMP (60–330 µg/L) determined by Nowack [14] in a German WWTP and EDTMP (167 µg/L) detected by Fürhacker et al. [15] in an Austrian WWTP. In the current study, however, DTPMP, HEDP, and PBTC were found in comparable concentrations.
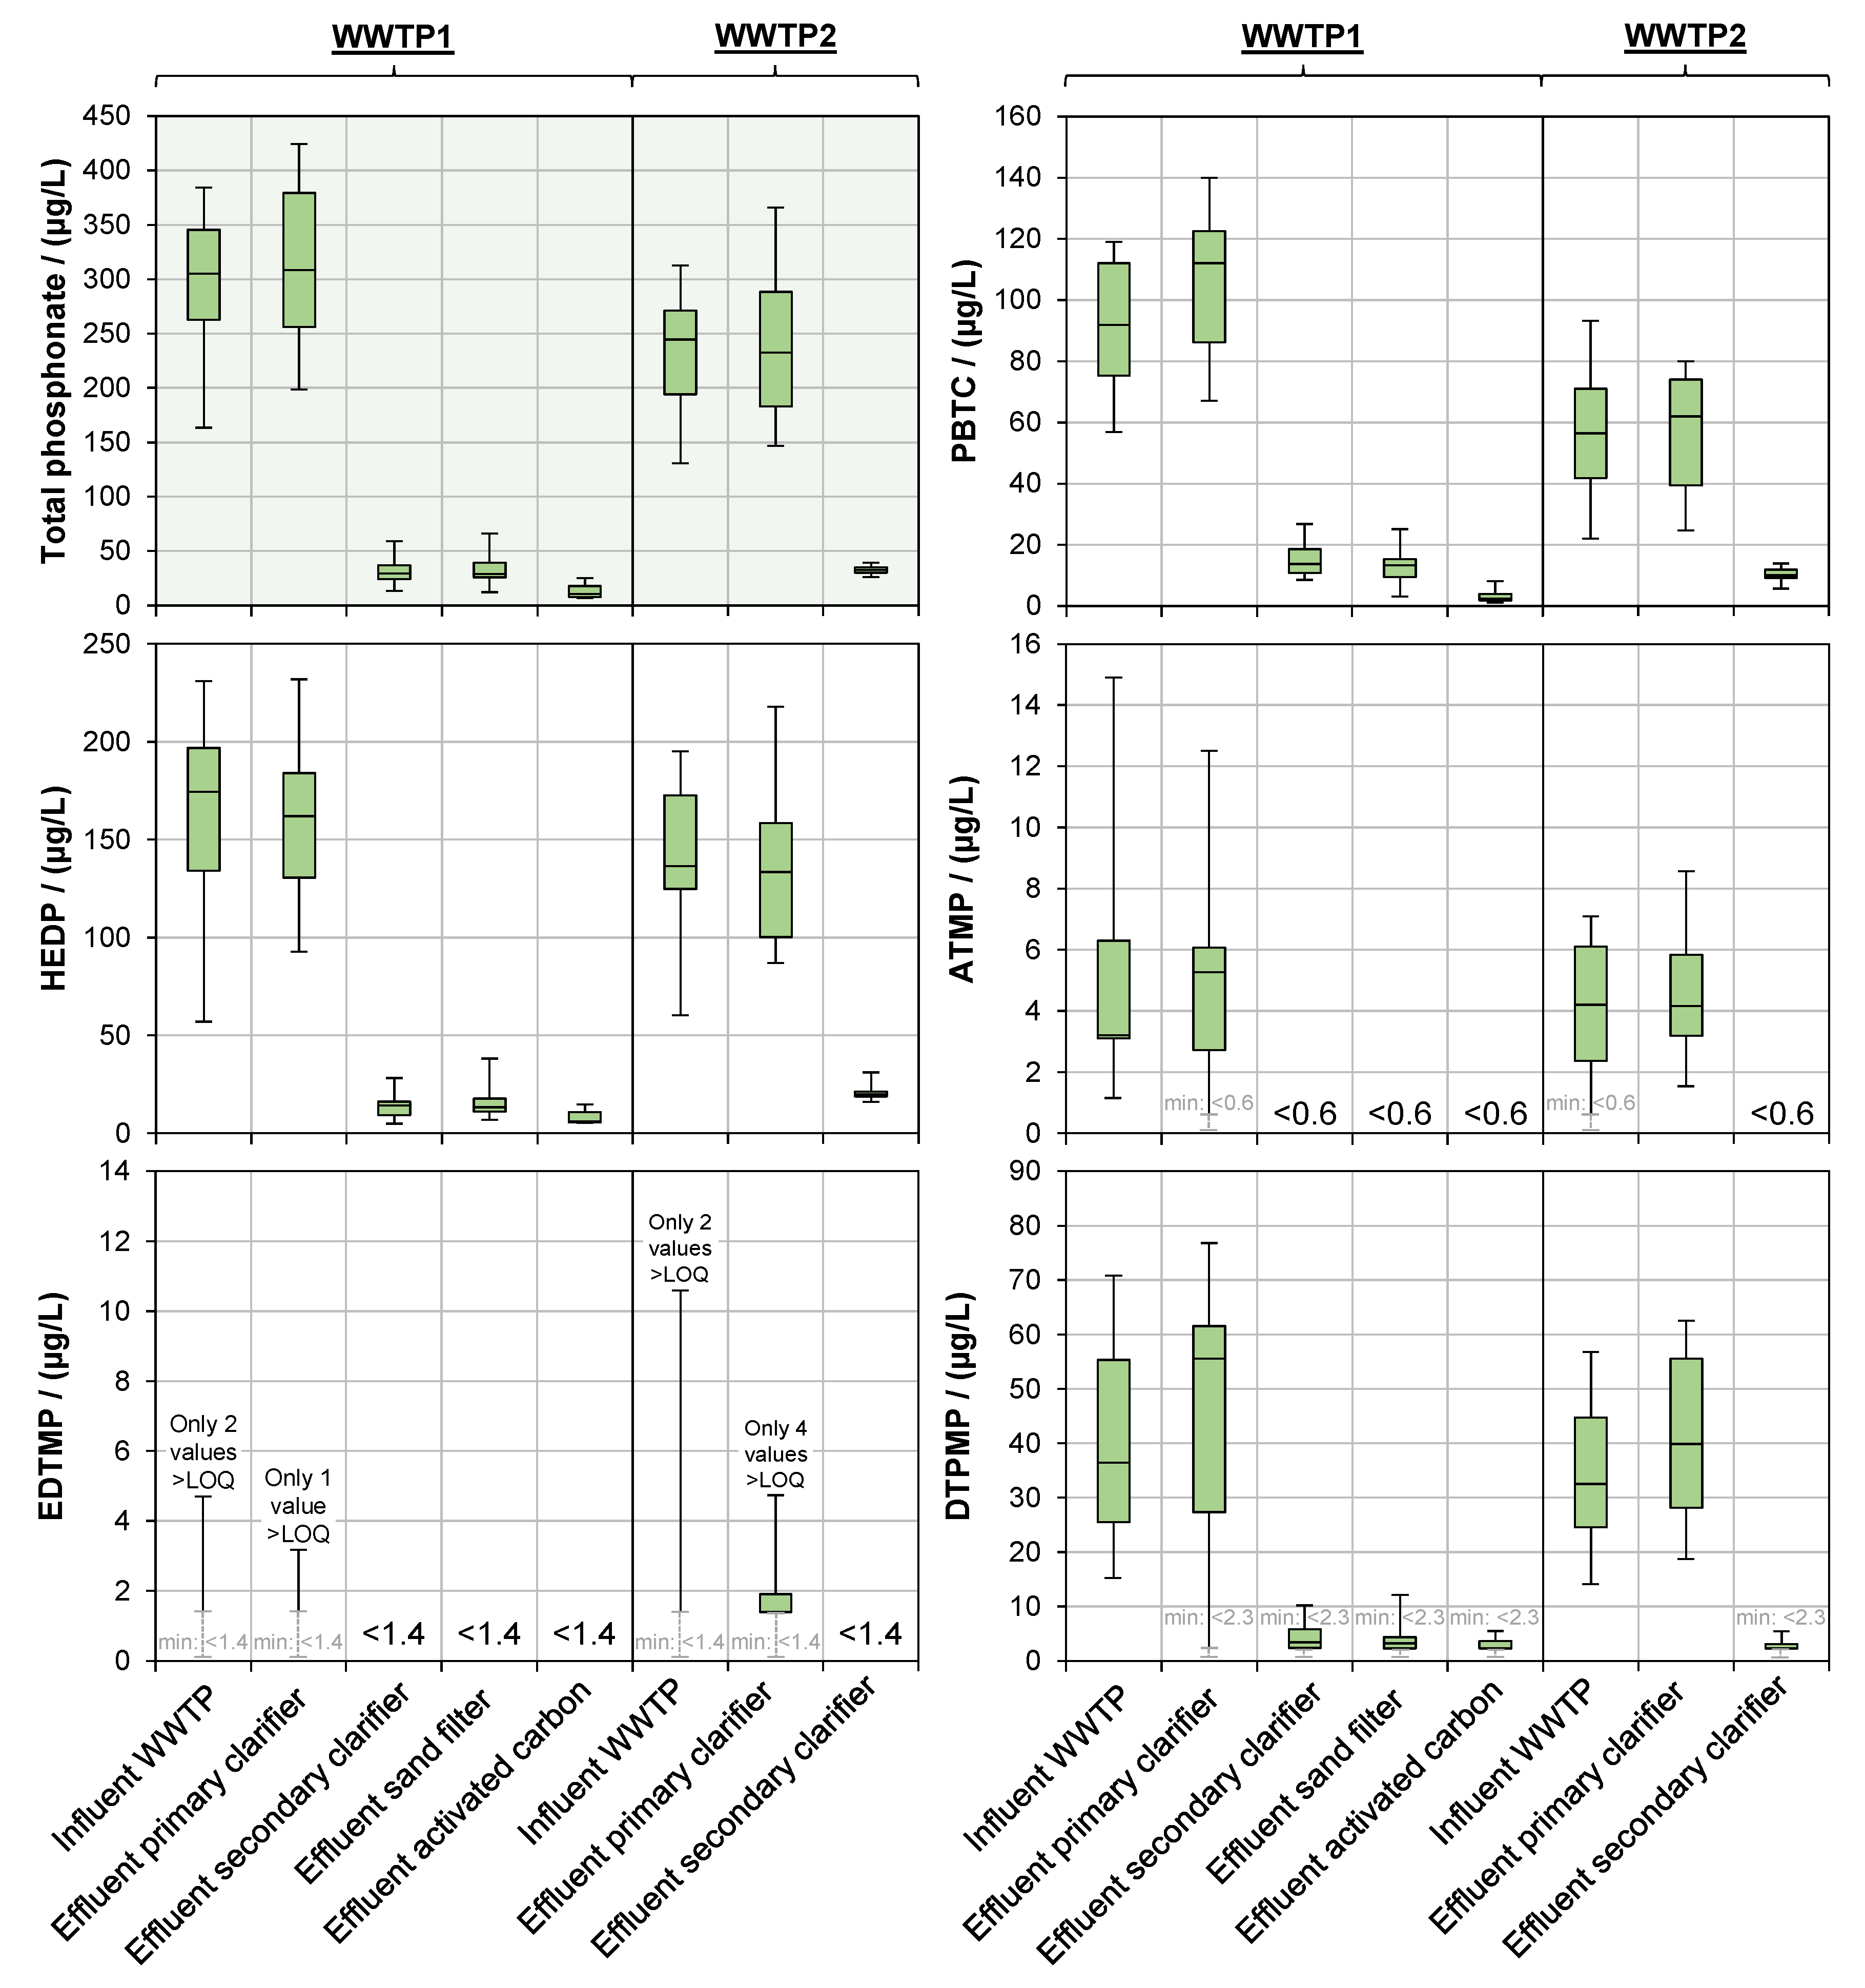
HEDP was determined at similar predominant concentration levels in WWTP1 (57–231 µg/L) and WWTP2 (60–195 µg/L). The concentrations of PBTC, the second most abundant phosphonate, were slightly lower in WWTP2 (WWTP1: 57–119 µg/L; WWTP2: 22–93 µg/L). DTPMP was the third most represented phosphonate in both WWTPs (WWTP1: 15–71 µg/L; WWTP2: 14–57 µg/L). None of the results obtained during the course of this study approximated Nowack’s [16] record of 1030 µg/L DTPMP in a WWTP influent strongly influenced by the textile industry and the record of 7200 µg/L ATMP in heavily industrially polluted wastewater by Wang et al. [17].
Nowack [16] concluded that phosphonate concentrations in the influents of WWTPs are strongly influenced by industrial facilities in the catchment area of the WWTPs. Interestingly, however, in WWTP2, which is almost exclusively fed by municipal wastewater, the total phosphonate content (131–313 µg/L) was similar to WWTP1 (162–384 µg/L), which has a moderate industrial wastewater burden.
The comparatively high contribution of PBTC (24–31% by weight) and HEDP (54–59%) to the total phosphonate content is striking. Nitrogen-free phosphonates thus accounted for 83–85% of the total dissolved phosphonate in both WWTP feeds. DTPMP was present with an average proportion of 13–14%. According to EPA [1] and Groß et al. [21], HEDP is mainly used in consumer detergents such as surface cleaners, dishwashing detergents and powder detergents, whereas PBTC is used in sanitizing agents and cleaners (not detergents). DTPMP is mainly used in liquid detergents and industrial cleaners [21]. Since the wastewater of WWTP2 mainly has a municipal origin, the detected phosphonates may therefore mainly be traced back to domestic wastewater.
The solids in the influent of the WWTPs had surprisingly high phosphonate loads (WWTP1: 223–1136 mg/kg with an outlier at 2555 mg/kg, WWTP2: 234–862 mg/kg; Figure 3, middle row). The loads observed in WWTP1 showed more fluctuation as the dissolved concentrations. Those samples taken in 2016 (CW31, CW40, and CW47 for WWTP1 and CW50 for WWTP2) had slightly lower phosphonate concentrations and loads, which correlates with the increased use of phosphonates in DCC products (Figure A1). Furthermore, a shift in the concentration profile was observed: With an average share of 79–80% of the total phosphonate load, HEDP was even more predominant in the solid fraction of both WWTP influents. Simultaneously, DTPMP (11–14%) made up for a larger proportion than PBTC (5–6%) in terms of load. This observation is interesting because it implies that PBTC has a weaker adsorption affinity towards solids in the WWTP influent than HEDP and DTPMP.
Solids in the WWTP influent are usually composed of sand, feces, food residues, paper, and mineral components. Sand has a smooth surface with low porosity. Fischer [9] investigated the adsorption of HEDP on various soils and sediments and found that the sand content negatively correlated with the binding capacity for HEDP, whereas the presence of metal oxides/hydroxides and organic carbon had an enhancing effect. The WWTP influent samples of WWTP1 were taken behind the grease trap, while the WWTP2 influent samples were taken before the grease trap. However, there was no significant difference in the phosphonate loads between the two WWTP influents. This is in agreement with the findings of Fischer [9] indicating that the phosphonates in the WWTP feed are not adsorbed on sand but on other very fine, fibrous, and voluminous solid components.
Primary sludge is known to contain metals in precipitated, insoluble form: Calcium with >20,000 mg/kg is the most abundant metal in primary sludge [22]. Aluminum and iron follow with contents generally at 4500 mg/kg–14,000 mg/kg [23], followed by Zn, Mn, Cu, Pb, and Cr between 10 mg/kg and 1000 mg/kg each [24]. Phosphonates adsorb preferably on mineral surfaces such as calcite [25], aluminum oxide [26], iron oxide [10], zinc oxide [27], and hydroxyapatite [28]. It appears likely that the phosphonates adsorbed in the WWTP influent are thus predominantly bound to the abundant metal (hydr)oxide flocks, which in return may be bound to, e.g., cellulose fibers.
Both Nowack and Stone [10] and Rott et al. [29] observed a decreasing adsorption affinity of polyphosphonates towards iron hydroxide with increasing molecular weight and number of phosphonate groups: HEDP (206.03 g/mol) > ATMP (299.05 g/mol) > EDTMP (436.12 g/mol) > DTPMP (573.20 g/mol). It is likely that this pattern also applies to the majority of other adsorbents, e.g., calcium-containing materials. As mentioned above, however, the rather small PBTC molecule (270.13 g/mol) appeared to have a lower adsorption affinity towards solids in WWTP influent than the large DTPMP molecule. In contrast to aminophosphonates, PBTC has three carboxyl groups and only one phosphonate group. To better understand the comparatively low adsorption affinity of PBTC, it is therefore essential to compare the adsorption affinity of carboxyl groups with that of phosphonate groups. Fischer [8,9] and Steber and Wierich [30,31] investigated the adsorption of NTA and ATMP on various metal oxide containing sediments, clay minerals, and soils. NTA is a structure homolog of ATMP (Figure 1) carrying carboxyl groups instead of phosphonate groups. ATMP showed significantly enhanced adsorption, implying that phosphonate groups cause stronger adsorption than carboxyl groups. This may explain the weaker adsorption for PBTC in contrast to the aminopolyphosphonates.
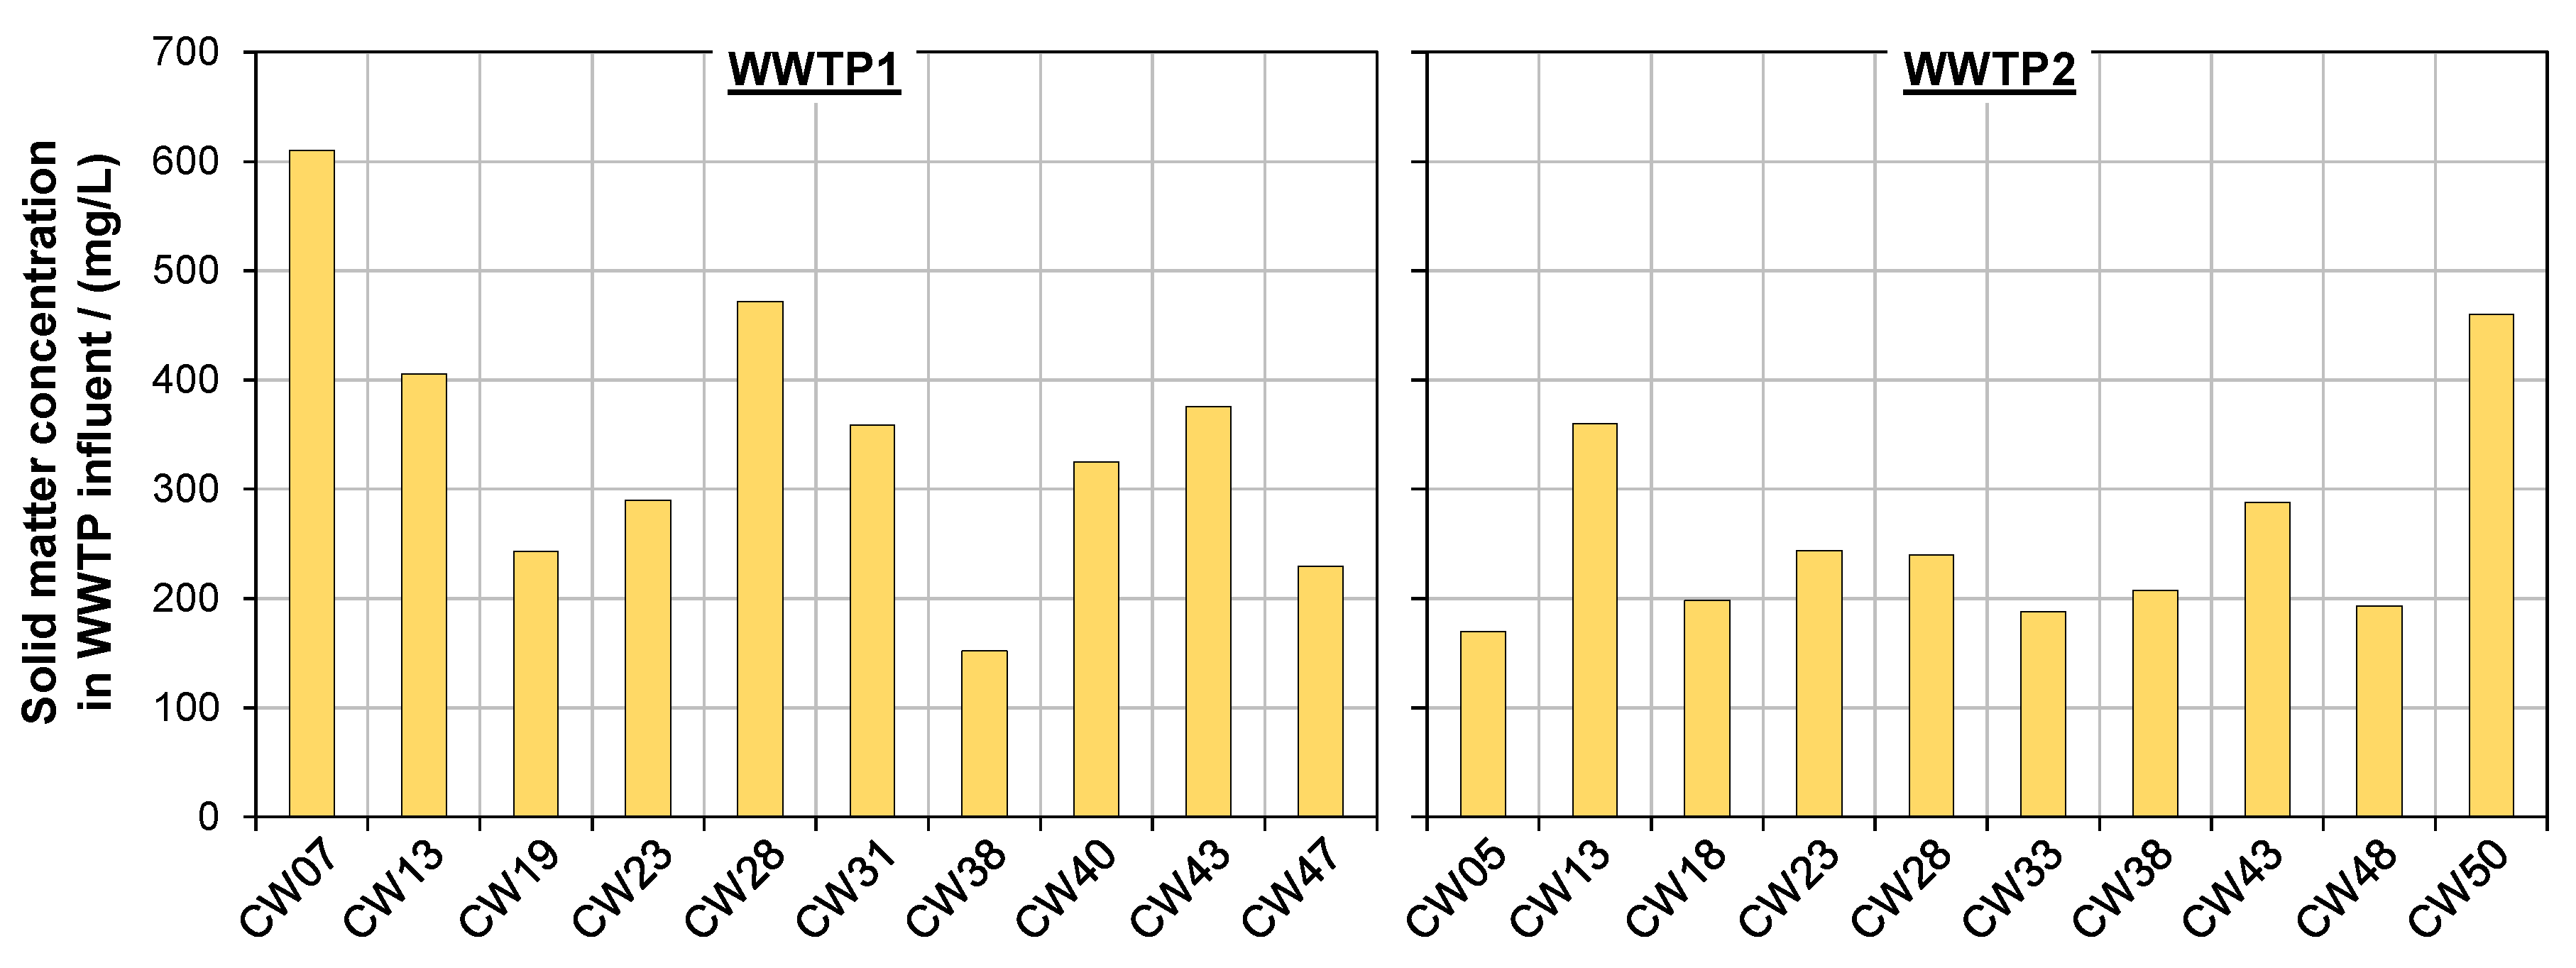
The product of the solid matter concentration in the WWTP influent (in mg/L; Figure A2) and the phosphonate load (transformed into µg/mg; Figure 3, middle row) corresponds to the mass concentration (in µg/L) of the adsorbed phosphonates present in the WWTP influent: 51–693 µg/L (WWTP1; outlier: 1206 µg/L) and 69–235 µg/L (WWTP2). Consequently, the relative proportions of adsorbed and dissolved phosphonates may be compared (Figure 3, bottom row). The proportion of adsorbed phosphonate in the WWTP1 influent varied between 20% and 80%. This strong variation correlated with the respective solid matter concentration. In the influent of WWTP2 it varied between 25% and 50%. The high proportion of adsorbed phosphonate is remarkable and illustrates that the load of adsorbed phosphonates must be considered in order to establish a comprehensive phosphonate balancing. During this work, this was only determined for the WWTP influents. Future investigations should therefore consider the content of adsorbed phosphonate in the effluents of different treatment stages.
3.2. Phosphonates in Individual Treatment Stages
3.2.1. Primary Clarification
Figure 4 summarizes the concentrations of dissolved phosphonates in the different treatment stages of both WWTPs. The relative dissolved analyte concentrations were similar to each other throughout the course of the year, which is why the values derived from 10 sampling dates are shown as boxplots. The ordinate scaling was adapted to the respective phosphonate.
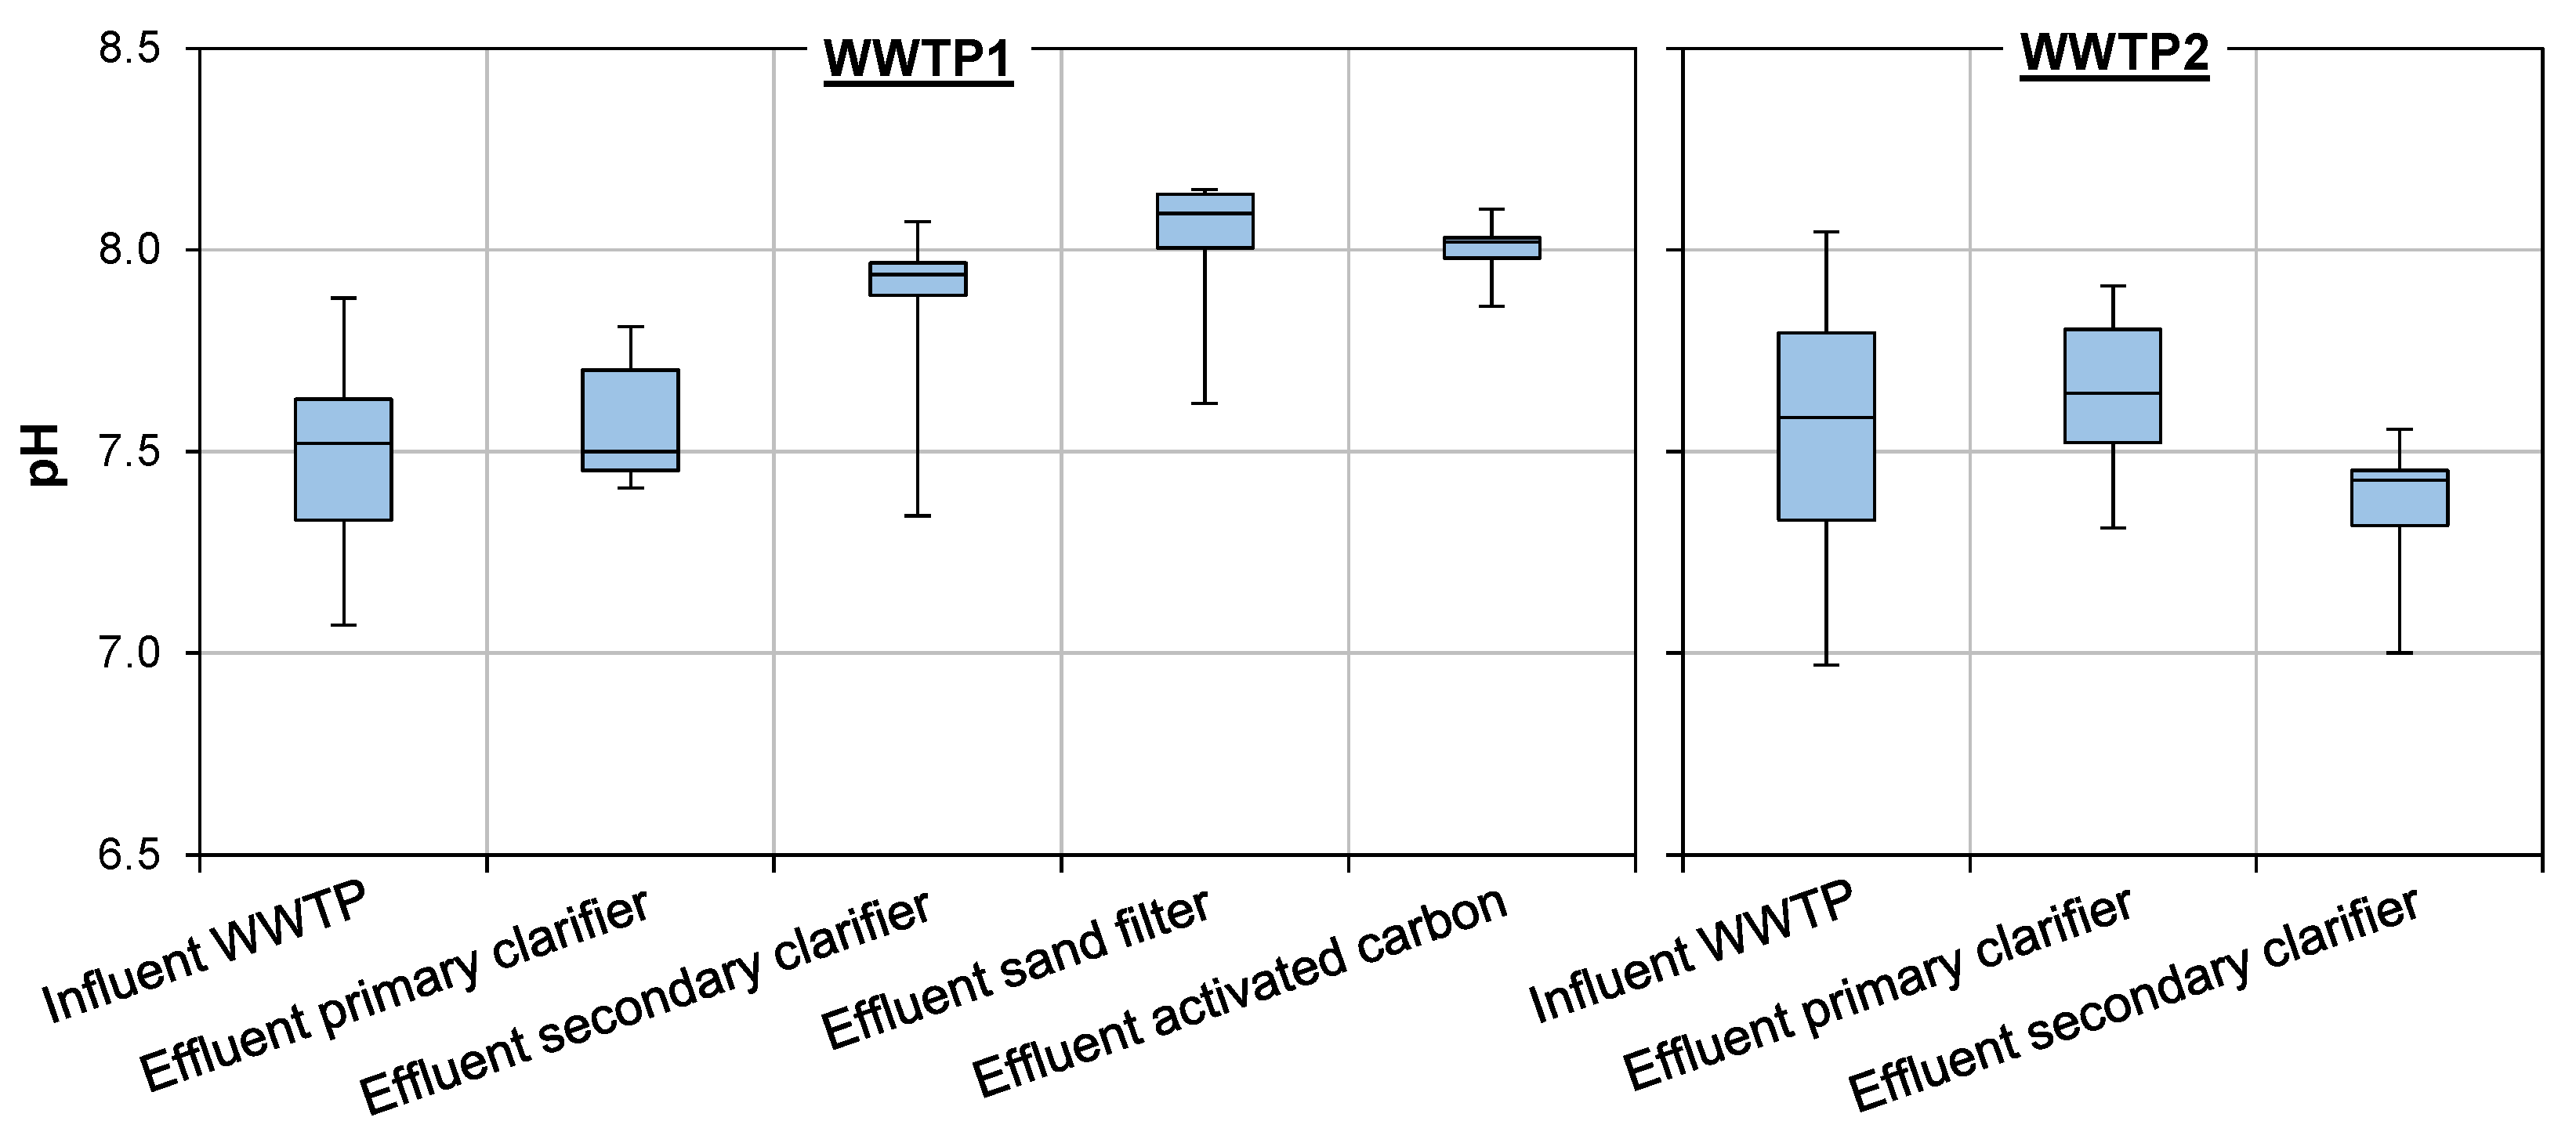
No significant removal of the dissolved phosphonates took place during primary treatment. In some cases, a slight increase in phosphonate levels has even been recorded. This indicates a desorption of adsorbed phosphonates and is quite in line with the findings of Section 3.1, in which it was shown that a considerable proportion of phosphonates is adsorbed in the WWTP influent. The desorption may be explained by the disintegration of adsorbent particles and/or the slight shift of pH into the alkaline range during primary clarification (Figure A3). Phosphonates tend to desorb as the pH raises due to elevated electrostatic charge repulsion between the increasingly negatively charged particle surface and phosphonate species [10].
3.2.2. Secondary Clarification
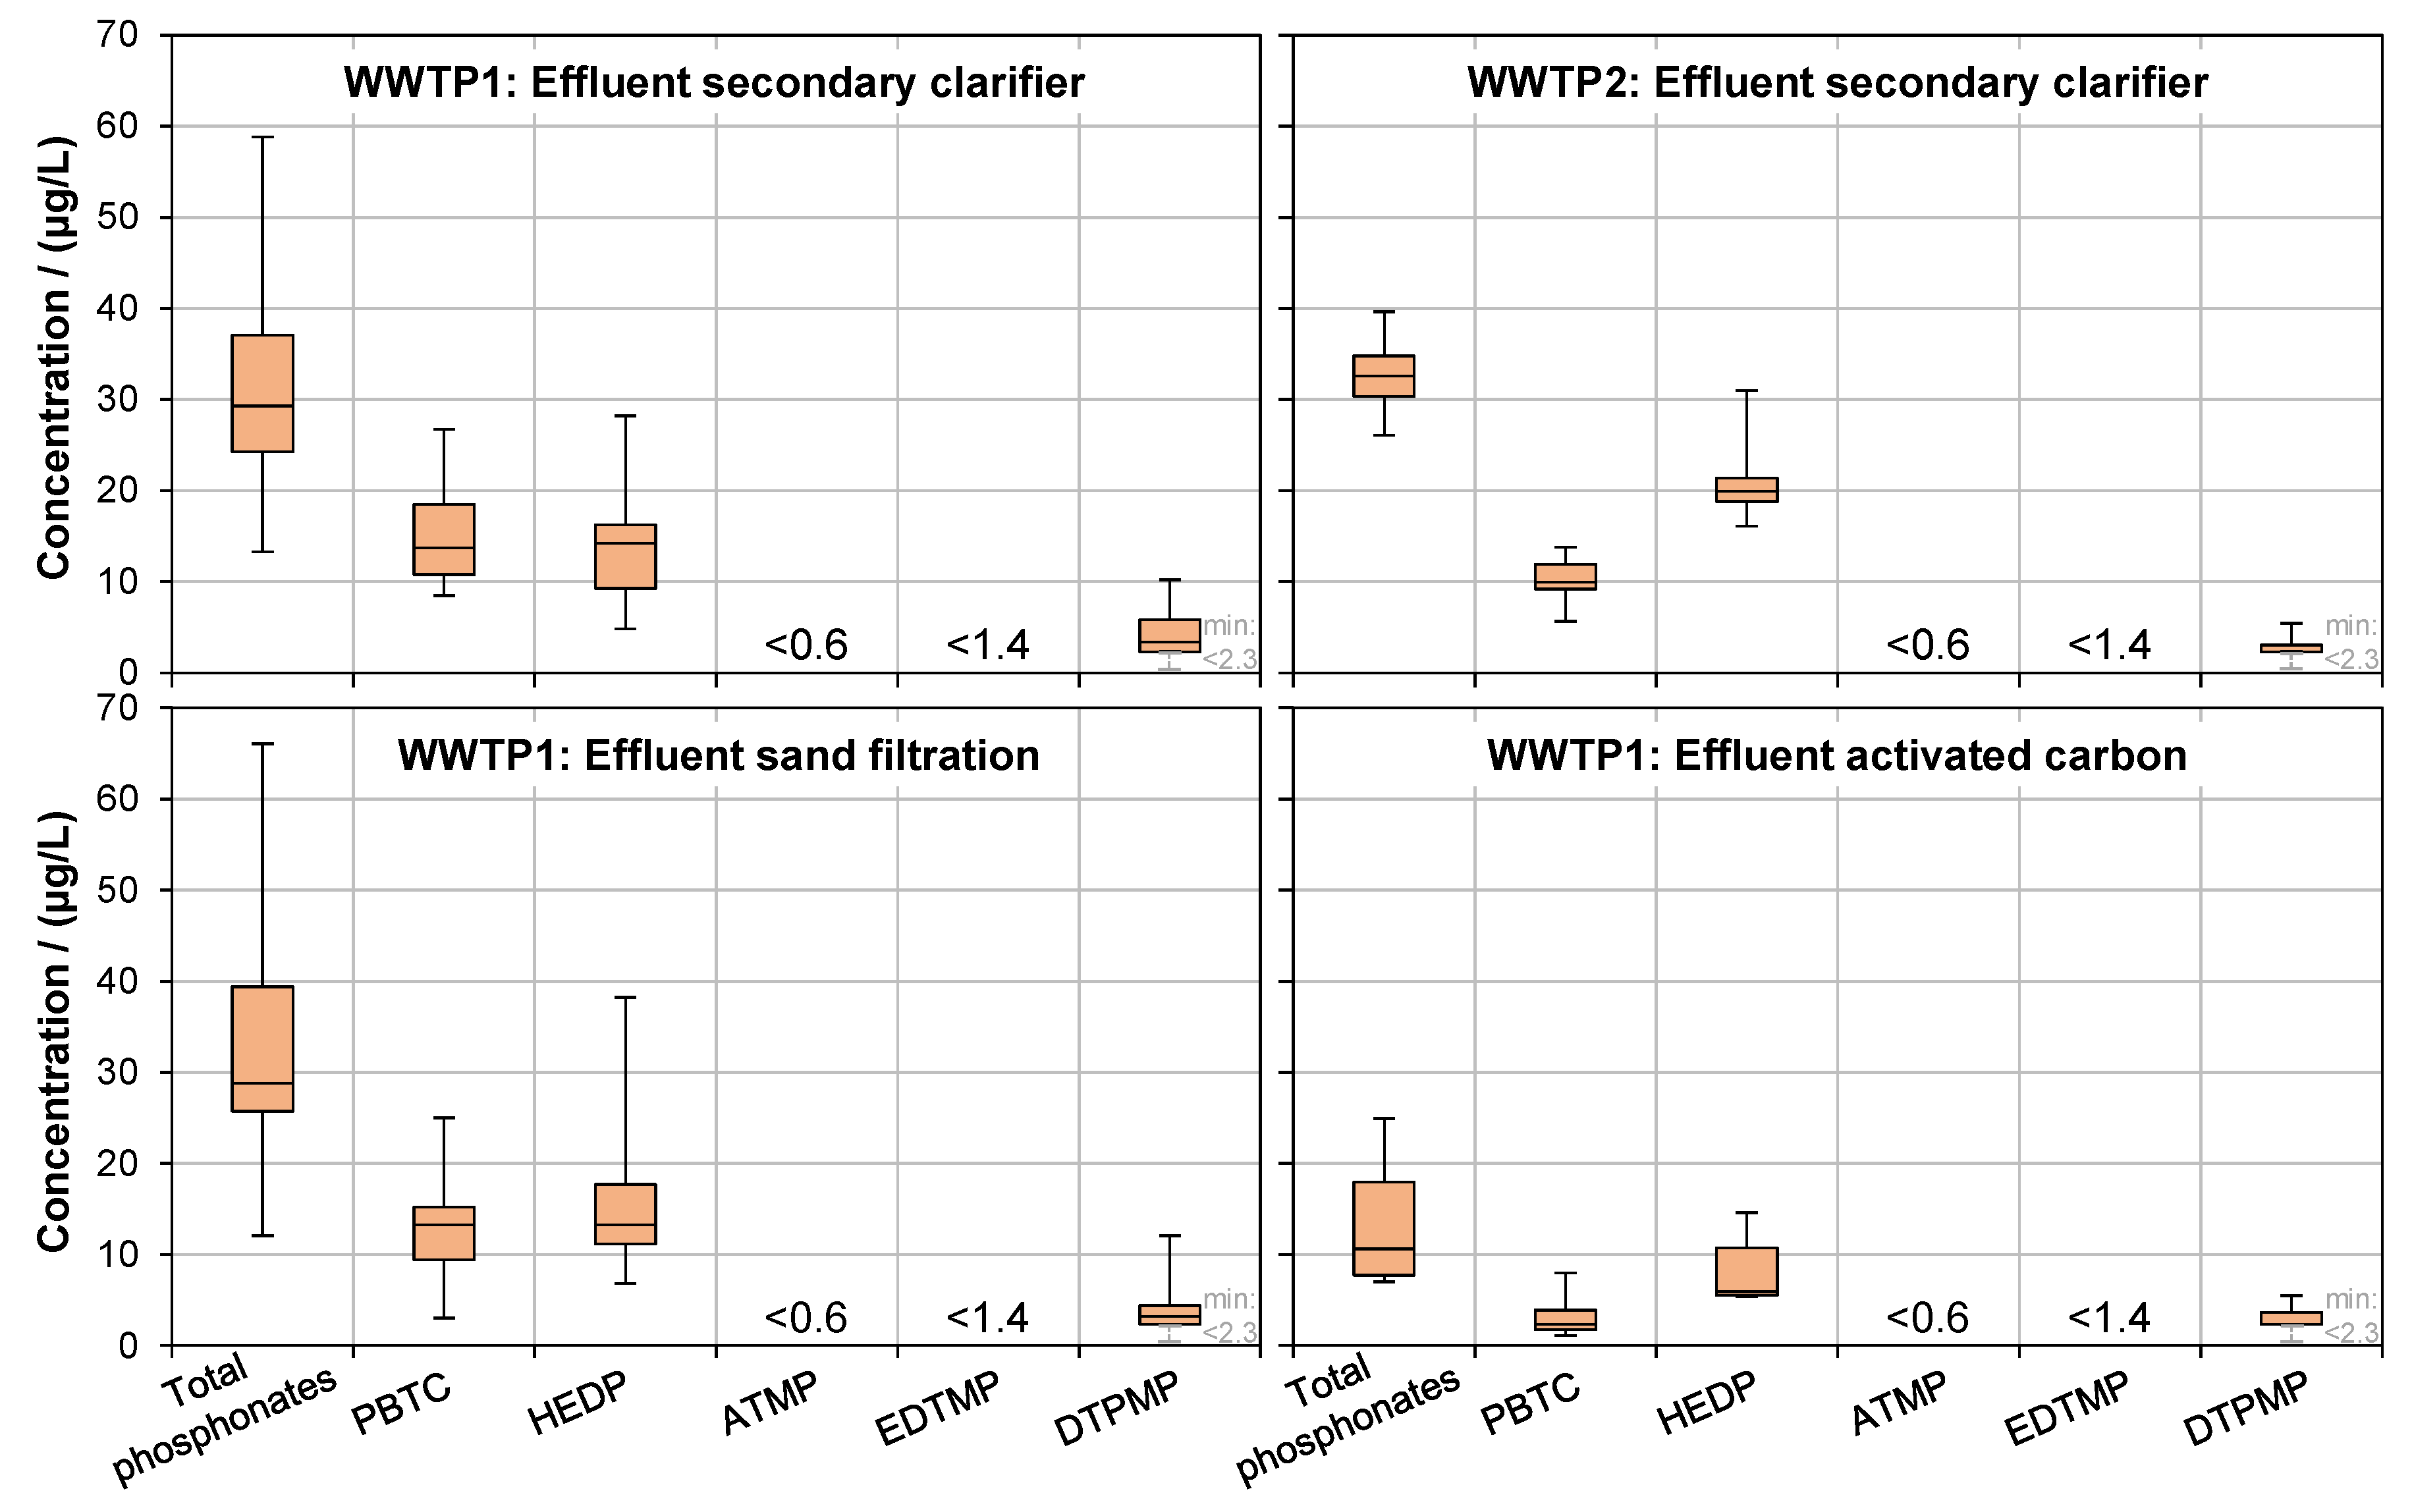
In contrast to primary treatment, much lower concentrations of dissolved phosphonates were determined in the secondary effluent. The concentrations of the individual phosphonates are depicted in Figure 5 with identical ordinate scaling for intuitive comparison. The total phosphonate concentrations were in the same order of magnitude for both WWTPs (WWTP1: 13–59 µg/L; WWTP2: 26–40 µg/L). In WWTP1, PBTC (8–27 µg/L) and HEDP (5–28 µg/L) were found in approximately equal proportions, whereas in WWTP2, HEDP (16–31 µg/L) slightly outweighed PBTC (6–14 µg/L). DTPMP (WWTP1: <2.3–10 µg/L; WWTP2: <2.3–5 µg/L) was the third most represented phosphonate in both WWTPs. ATMP and EDTMP were only present below 0.6 µg/L and 1.4 µg/L, respectively, in the secondary effluent.
In particular the nitrogen-free HEDP and PBTC are thus in a similar concentration range as trace substances typically found in European WWTPs such as acetaminophen, codeine, ibuprofen, naproxen, carbamazepine, and acesulfame, when present at high concentration levels [32]. In the only previously published investigations on real phosphonate concentrations in the effluents of European municipal WWTPs (determined without spiking of the influent), Nowack [14,16] determined phosphonate concentrations generally below the LOD. However, these LODs (ATMP = 15 μg/L, EDTMP = 21 μg/L, and DTPMP = 57 µg/L) were higher than in this work and the nitrogen-free phosphonates HEDP and PBTC were not covered. The effluent concentrations of aminophosphonates determined by Nowack [14,16] are therefore consistent with the results of this work.
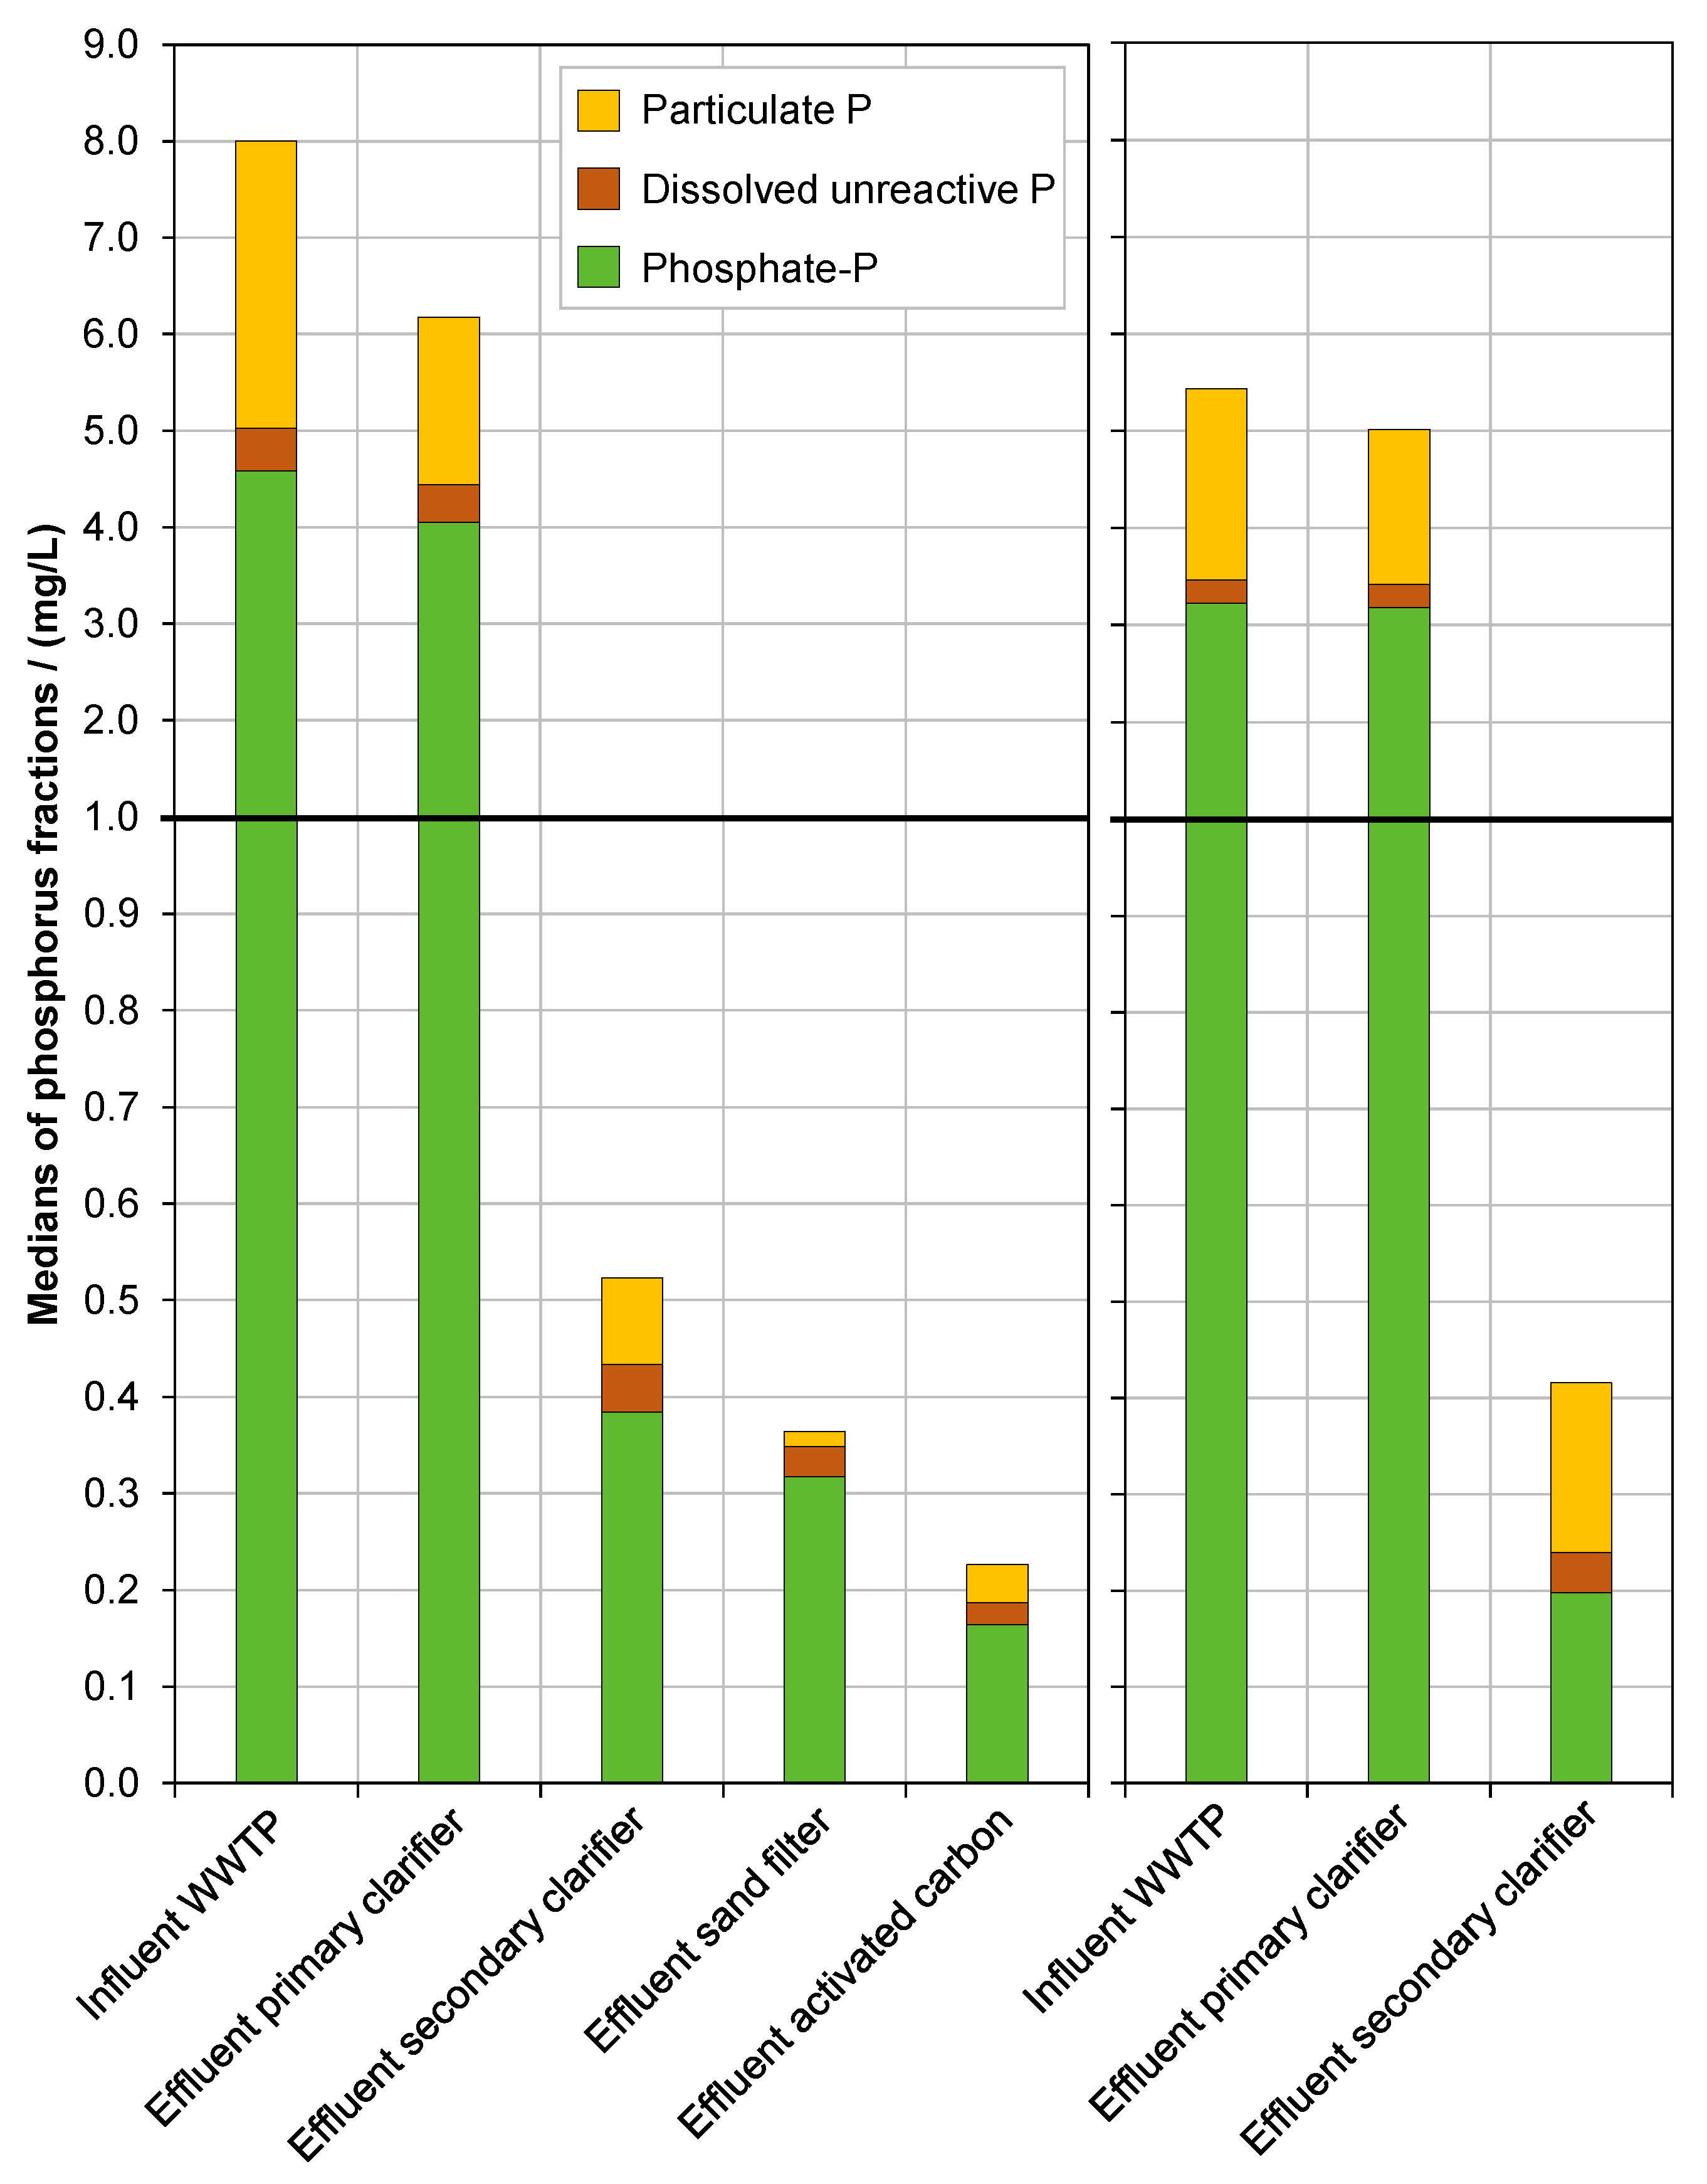
The adsorbed phosphonates in the secondary effluent were not analyzed. Nevertheless, the very low PP concentration in the secondary effluent (WWTP1: 0.02–0.23 mg/L; WWTP2: 0.09–0.37 mg/L) in comparison to the primary effluent (WWTP1: 0.98–3.55 mg/L; WWTP2: 0.97–3.50 mg/L) indicates a high elimination rate of particle-bound phosphorus and thus of particle-bound phosphonates (Figure A4).
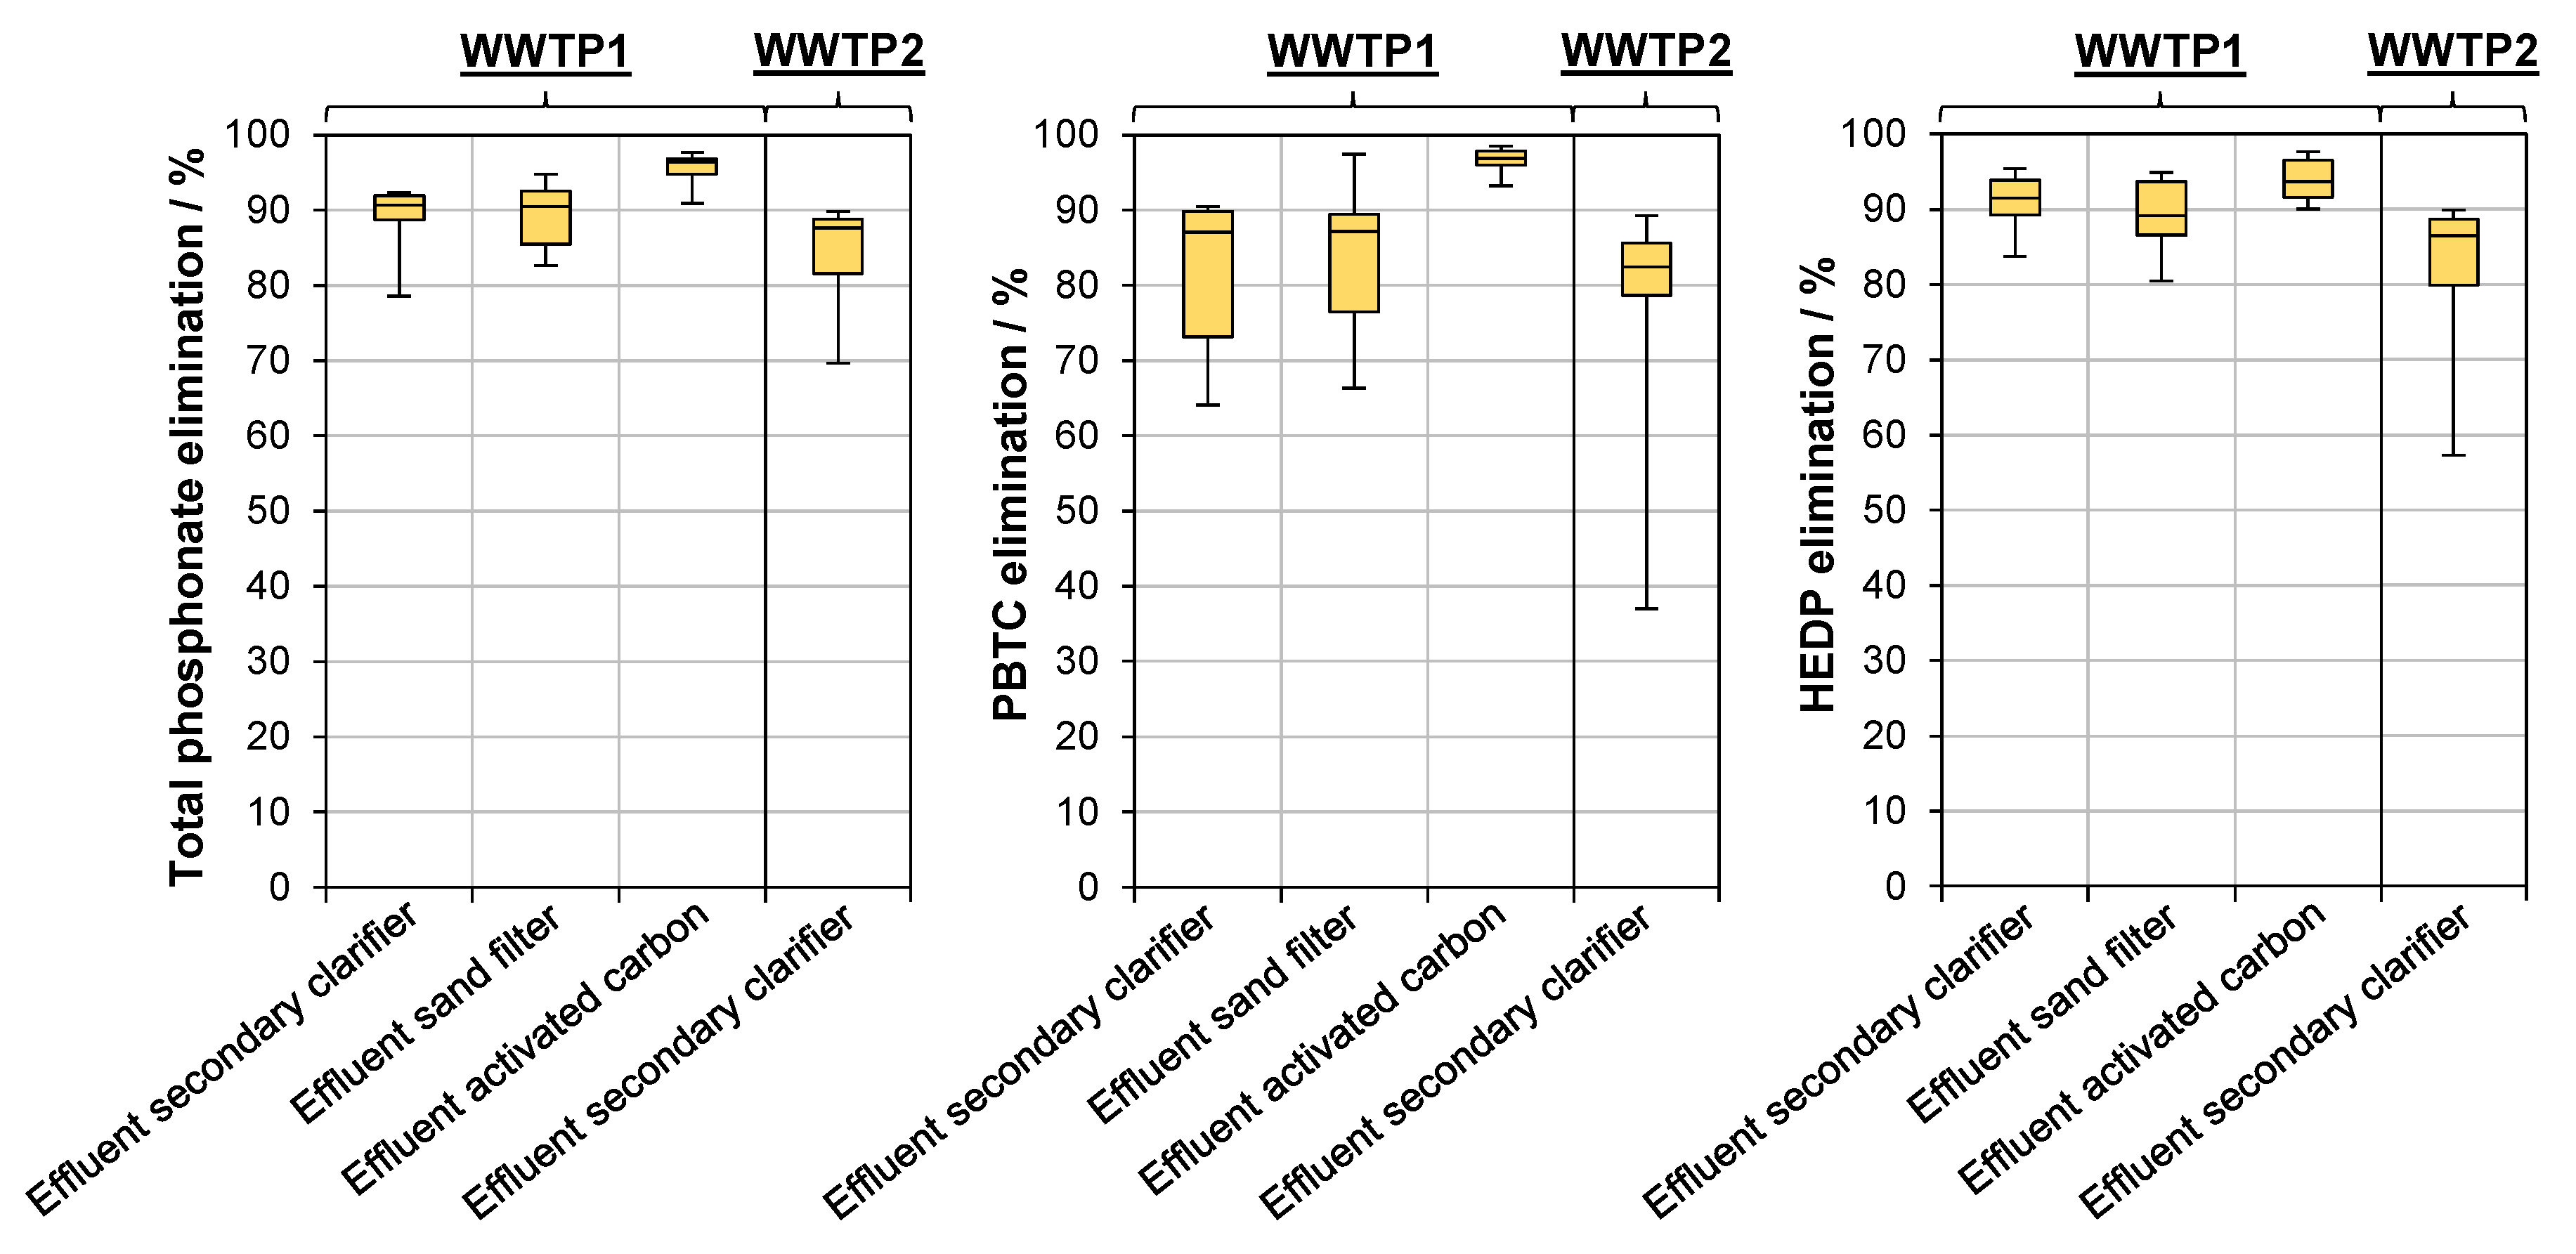
The elimination rates of dissolved total phosphonate, HEDP, and PBTC by individual treatment stages of both WWTPs are shown in Figure 6. The total phosphonate elimination by secondary treatment in WWTP1 was between 78.6% and 92.4% (median: 90.7%). In WWTP2, it was slightly lower (69.7–89.9%, median: 87.7%). In the majority of samples, the secondary effluent concentrations of ATMP (elimination rates: WWTP1: >47.4% to >96.0%, WWTP2: >49.6% to >91.5%), EDTMP (WWTP1: >3.4% to >70.2%, WWTP2: >1.4% to >86.8%), as well as DTPMP in some samples (WWTP1: 72.3% to >96.1%, WWTP2: >83.7% to >96.0%) were below the LOQ, which is why only minimum degrees of elimination could be derived. Aminophosphonates are therefore not listed in Figure 6. HEDP (WWTP1: 83.7–95.4%, median: 91.5%; WWTP2: 57.3–89.8%, median: 86.4%) was eliminated slightly better than PBTC (WWTP1: 64.1–90.5%, median: 87.0%; WWTP2: 37.0–89.3%, median: 82.5%). Nevertheless, the HEDP effluent concentration in WWTP2 was significantly higher than that of PBTC (Figure 5). The degree of elimination is therefore not the sole criterion for the emissivity of phosphonates by WWTPs and should therefore always be considered in relation to the initial and discharge concentration. Furthermore, it is striking that, in contrast to aminophosphonates, the elimination rate of PBTC during secondary treatment never exceeded 91%.
PBTC thus appears to be the phosphonate with the lowest elimination, yet present in significant concentrations in the WWTP influent. For this phosphonate, on one day in CW05, even an elimination as low as 37% was found in WWTP2. At this sampling, the wastewater temperature (8.8 °C) was the lowest of all samplings (all other wastewater temperatures were >11 °C). The adsorption of phosphonates onto metal (hydr)oxides is enhanced at elevated temperatures and attenuated at lower temperatures [33]. Assuming the elimination of phosphonates in WWTPs is mainly attributed to adsorption on activated sludge and on metal (hydr)oxide flocks, this observation appears plausible. Indications for the lower elimination of PBTC, as compared to polyphosphonates, have already been derived from laboratory tests investigating the adsorption of phosphonates on activated sludge. Reichert [7] and Metzner and Nägerl [34] determined maximum PBTC adsorption rates of 50%, while aminophosphonates were found to adsorb to a higher extent [35]. In laboratory tests, PBTC even showed a slight tendency towards desorption (about 30%) from digested sludge under anaerobic conditions [7], implying a possible accumulation of PBTC in the WWTP. Possible reasons for the weaker adsorption of PBTC are discussed in Section 3.1.
DTPMP belongs to the best investigated phosphonates with published elimination rates of >90% [11], 95–97% [14], 85% [16], and 99.3% [17]. Only the last two results derive from studies involving real DTPMP concentrations without artificial dosing. The high removal rates were generally confirmed in the current study. However, elimination rates as low as 72.3% were also observed.
The elimination of HEDP in European WWTPs has been previously investigated in two field studies involving spiking of the influent. In these studies, the elimination significantly differed (25–70% [12] and >90% [13]). Possibly, the relatively low HEDP elimination found by Metzner [12] could be ascribed to missing P precipitation. In a recent Chinese study, elimination rates of 98.2–99.4% in three WWTPs were reported for HEDP in the trace-concentration range of unspiked wastewater [17]. The authors stated that two of the WWTPs were operated with the coagulation process. The one WWTP with the highest initial HEDP concentration of 5 mg/L was set up based on acidification-anaerobic/oxic-air flotation treatment (no coagulation mentioned). The difference in elimination as compared to the current study can be influenced by many factors such as adaption of activated sludge, composition of wastewater, and process control of the WWTP.
At present, very little is known about the actual elimination process of phosphonates in WWTPs. Three elimination mechanisms have been presumed, which are briefly discussed below: (1) Microbial degradation, (2) adsorption on microbial activated sludge or on mineral precipitates bound to activated sludge, e.g., metal (hydr)oxides, (3) adsorption due to the dosing of precipitants during wastewater treatment, such as iron hydroxide or iron phosphate.
On (1): Schowanek and Verstraete [36] and Raschke et al. [37] showed that, despite ubiquitous occurrence, the proportion of PBTC- and polyphosphonate-degrading microorganisms is very small, even in activated sludge. Beyond this, the degradation of phosphonates is strongly inhibited by the presence of easily utilizable inorganic phosphate, which is abundantly present in municipal wastewater. Various standard methods on the investigation of biological phosphonate degradation, based on the monitoring of CO2 evolution, have been applied. A total mineralization of phosphonates either by activated sludge or digested sludge is not to be expected within several weeks [30,31,38]. Thus, adsorption is expected to predominantly contribute to the observed elimination.
On (2) and (3): The small number of studies on the elimination of phosphonates in WWTPs allows only little conclusions to be drawn about the actual adsorption process onto activated sludge. Most of the WWTPs investigated had a simultaneous chemical P precipitation or the laboratory studies did not indicate whether the analyzed activated sludge derived from WWTPs with simultaneous chemical P precipitation [13,15,16,35]. An indication for a possibly high elimination rate of DTPMP without P precipitation is pointed out by Nowack [14]. In this field study, 95% of DTPMP was eliminated solely by biological treatment. The elimination was increased up to 97% by means of aluminum dosing. In contrast to this, HEDP and ATMP could not be eliminated by more than 70% without P precipitation in the field studies of Metzner [12]. Chemical P precipitation was performed by the two WWTPs investigated in the current study, which is why no distinctive conclusion can be derived here with this regard as well. The difference in phosphonate elimination efficiency between WWTPs applying and not applying chemical precipitation has therefore yet to be elucidated. The two examples [12,14] imply that this may vary for different phosphonates too.
3.2.3. Tertiary Treatment
The special situation in WWTP1 allowed the investigation of phosphonate elimination by two additional treatment stages following secondary clarification. Generally, the sand filtration stage did not increase the average removal rate by more than 0.2 percentage points compared to secondary treatment. In case of HEDP, a slight increase of the dissolved concentration was even observed (medians: 90.7% total phosphonate elimination by secondary clarification vs. 90.5% total phosphonate elimination by sand filtration; 87.0% vs. 87.2% PBTC elimination; 91.5% vs. 89.2% HEDP elimination; 89.1% vs. 90.5% DTPMP elimination; in most cases, the ATMP and EDTMP concentrations were below the LOQ after secondary treatment). The scant elimination by sand filtration was also reflected by the insignificant change of total dissolved phosphonate concentration between secondary clarification and sand filtration (secondary effluent: 13–59 µg/L; sand filtration effluent: 12–66 µg/L). This observation is in conformance with the function of sand filtration, mainly targeting at the physical removal of solid particles (23–227 µg/L PP fraction in the secondary effluent vs. 6–57 µg/L PP fraction in the sand filtration effluent; Figure A4). As discussed in Section 3.1, phosphonates are not expected to significantly adsorb on sand, gravel, and slate, as these materials have a smooth surface.
In contrast to the sand filtration stage, an additional removal of the dissolved phosphonates was observed by activated carbon treatment (medians: 90.7% total phosphonate elimination by secondary clarification vs. 96.4% total phosphonate elimination by activated carbon treatment; 87.0% vs. 96.9% PBTC elimination; 91.5% vs. 93.7% HEDP elimination; 89.1% vs. 92.7% DTPMP elimination; in most cases the ATMP and EDTMP concentrations were below the LOQ after secondary treatment). Noteworthy, the minimum elimination rate of the nitrogen-free phosphonates after the activated carbon treatment exceeded 90% during all sampling dates, indicating a high stability and efficiency of the process. The activated carbon treatment significantly contributed to the reduction of the total dissolved phosphonate concentration (secondary clarification: 13–59 µg/L; activated carbon treatment: 7–25 µg/L). The dissolved phosphonate-P after the activated carbon treatment amounted to only 2–6 µg/L (median: 3 µg/L), approximately half the amount recorded in the secondary effluent (2–13 µg/L, median: 7 µg/L). At the same time, the elimination of the PP fraction by the activated carbon treatment proved inferior compared to the sand filtration (6–57 µg/L PP fraction in the sand filtration effluent vs. 11–80 µg/L PP fraction after activated carbon treatment; Figure A4). Despite of the very efficient elimination of dissolved phosphonates, thus, a somewhat lower elimination of adsorbed phosphonates may have simultaneously occurred during the activated carbon treatment. Since the phosphonate content of the particulate phase was only determined for the influent of the WWTPs, this circumstance remains yet to be elucidated.
At pH 7.0–7.5, the load of ATMP on powdered activated carbon (<10 mg/g) [39] was found to be significantly lower than on iron hydroxide granulate (~30 mg/g; initial pH 8.3) [40] or freshly precipitated iron (hydr)oxide flocks (~120 mg/g FeOOH) [29]. A metal-containing flocculant (iron chloride sulfate) was added to promote the separation of activated carbon from the water. It is therefore more likely that the increased elimination in this stage was due to preferred phosphonate adsorption onto abundant polar iron hydroxide flocks.
3.3. Contribution of Phosphonate-P to the DUP Fraction
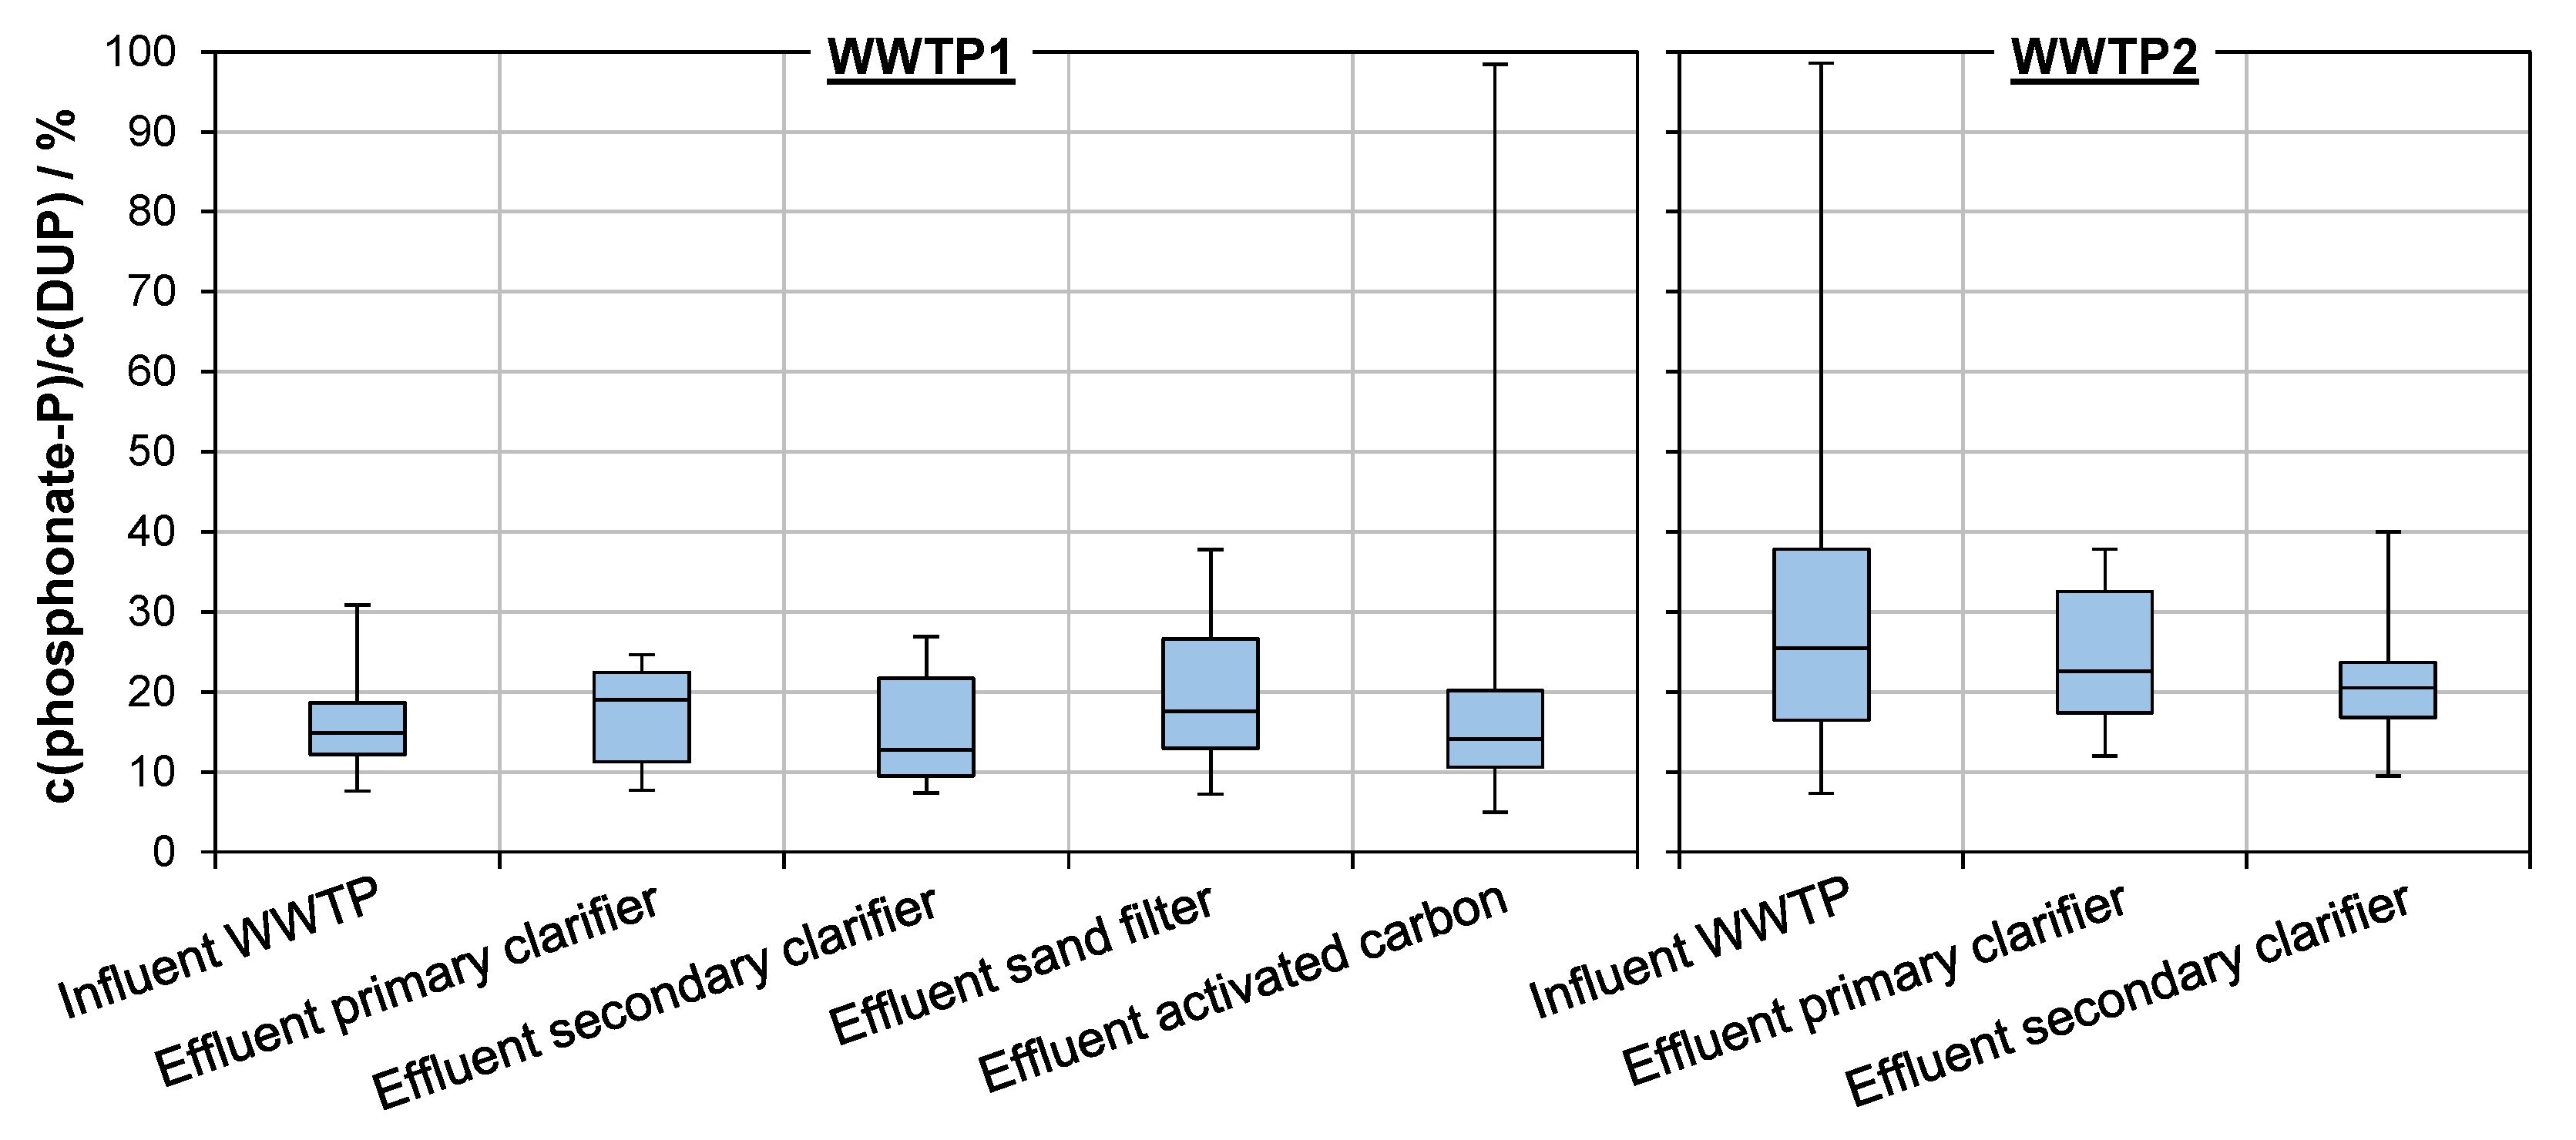
In both WWTPs, the concentration of the DUP fraction strongly dropped between influent and effluent (median DUP concentrations: 0.44 mg/L in WWTP1 influent and 0.031 mg/L in WWTP1 effluent; 0.24 mg/L in WWTP2 influent and 0.042 mg/L in WWTP2 effluent; Figure A4). In most samples, the contribution of phosphonate-P to the DUP fraction was between 10% and 30% (WWTP1) and between 15% and 40% (WWTP2) and therefore significant (Figure 7). Two times the maximum ratio was almost 100% (effluent activated carbon and influent WWTP2). In both cases, the lowest DUP concentrations of all 10 samples at atypically high phosphonate concentrations were measured. The DUP concentration is calculated from two values, which themselves can have minor errors. It is therefore also possible that an exceptionally slightly incorrect determination of the DUP concentration may have occurred in these samples. The relative proportion remained in a comparable range throughout all stages of the wastewater treatment process, implying that the elimination of DUP correlates well with the elimination of dissolved phosphonates.
Investigations on the purity of phosphonate-based antiscalants have shown that a significant proportion of the phosphorus within technical phosphonate solutions may be present in the form of organophosphorus synthesis by-products [41]. For instance, this proportion of structurally related compounds, belonging to the chemical group of phosphonic acids, may account for over 50% of the total phosphorus within technical DTPMP. During the current study, only the nominal phosphonate components and not their synthesis by-products or degradation products were monitored. Taking also into account that phosphonates can be subject to abiotic transformation [35], the proportion of this extended group of phosphonates in the DUP fraction may be significantly higher.
The concentrations and proportions of phosphonates adsorbed to solids in the effluents of the various treatment stages were not determined within the scope of this study. For this reason, no exact statement can be made about the phosphonate-P/PP ratios. The phosphonate loads of activated sludge are expected to be significant. A Europe-wide balancing of phosphonate freights implied an estimated average sewage sludge load of 1.2–1.5 g/kg [35]. Since the drift of activated sludge particles originating from the secondary treatment makes up for the major part of the solids occurring in the WWTP effluents, the quantification of adsorbed phosphonates should be considered in future investigations.
Worldwide, more and more countries are aiming at increasingly stringent total P limit values for WWTPs, in some cases even down to 0.2 mg/L. Figure A4 shows that currently phosphate-P usually accounts for the largest proportion of total P in the WWTP effluent. This fraction may be reduced by more efficient chemical precipitation, filtration, or EBPR. If the DUP fraction cannot be further eliminated in a similar extent and the use of phosphonates is further increased in the future, phosphonates, their synthesis by-products and metabolites may become more relevant for WWTP operators, despite the seemingly low proportion of phosphonate-P in total P (in WWTP1 effluent: 0.6–7.2%, median: 1.6%; in WWTP2 effluent: 1.1–4.1%, median: 1.9%). This might especially be the case for heavily industrially burdened WWTPs less equipped with P removal processes.
4. Conclusions
The recent development of analytical methods suited for the determination of phosphonates from matrix-burdened samples allowed the first comprehensive monitoring of the five most widely used phosphonates throughout the process of wastewater treatment and their balancing in the liquid and solid phases of wastewater. Solids in the influent of two WWTPs contained high phosphonate loads (223–2555 mg/kg). The proportion of adsorbed phosphonate in the influent varied between 20% and 80%, demonstrating that future investigations should consider adsorbed phosphonates in different WWTP stages. The concentrations of the nitrogen-free PBTC and HEDP, quantified for the first time in European WWTPs at real concentration levels, significantly exceeded the dissolved concentrations of the aminophosphonates (83–85% share in the dissolved total phosphonate content of 131–384 µg/L). The majority of total phosphonate elimination (medians: 90.7% & 87.7%) occurred in the biological stage. PBTC showed the lowest elimination of all five phosphonates (medians: 87.2% & 82.5%). A sand filtration stage did not improve the removal of dissolved phosphonates. By activated carbon treatment, in contrast, enhanced elimination of dissolved phosphonates (median: 96.4%) was achieved, presumably promoted by the iron-containing precipitant. The proportion of phosphonate-P in the DUP fraction was consistently 10–40% throughout all WWTP stages. Thus, the DUP elimination correlates well with the elimination of dissolved phosphonates. In the future, phosphonates, their synthesis by-products, and metabolites may become more relevant for WWTP operators, considering increasingly stringent P limit values and the increase of phosphonate use.
Author Contributions
Conceptualization: E.R., D.A., O.H. and R.M.; phosphonate analysis: D.A. and O.H.; sampling and standard parameter analysis: E.R.; writing—original draft preparation: E.R., D.A. and O.H.; writing—review and editing: E.R., D.A. and O.H.; project administration: O.H. and R.M.; funding acquisition: O.H., R.M., D.A. and E.R. All authors have read and agreed to the published version of the manuscript.
Funding
This work was funded by the German Environment Agency as part of the UFOPLAN 3715651410 project.
Acknowledgments
We wish to thank Marcus Gast (German Environment Agency) for the support and fruitful discussions. We gratefully thank the employees of the wastewater treatment plants Stuttgart-Mühlhausen and Stuttgart-Möhringen for the regular and very reliable provision of wastewater samples and Beat Schmutz (TZW) for his support during the laborious sample preparations.
Conflicts of Interest
The authors declare no conflict of interest.
Appendix A

Figure A2.
Solid matter concentration in WWTP influent of both WWTPs investigated.

Figure A3.
pH in different WWTP stages of both WWTPs investigated (boxplots: minimum, first quartile, median, third quartile, maximum).
Figure A3.
pH in different WWTP stages of both WWTPs investigated (boxplots: minimum, first quartile, median, third quartile, maximum).

Figure A4.
Medians of phosphorus fractions in different WWTP stages of both WWTPs investigated.

References
- EPA. Phosphonates in Detergents. European Phosphonate Association Detergent Phosphonates Dossier; EPA: Brussels, Belgium, 2013. [Google Scholar]
- Industrieverband Körperpflege- und Waschmittel e.V. Report Sustainability in the Detergent, Care and Cleaning Products Sector in Germany 2015–2016 (Bericht Nachhaltigkeit in der Wasch-, Pflege- und Reinigungsmittelbranche in Deutschland 2015–2016); Industrieverband Körperpflege- und Waschmittel e.V.: Frankfurt am Main, Germany, 2017. [Google Scholar]
- Industrieverband Körperpflege- und Waschmittel e.V. Report Sustainability in the Detergent, Care and Cleaning Products Sector in Germany Edition 2019 (Bericht Nachhaltigkeit in der Wasch-, Pflege- und Reinigungsmittelbranche in Deutschland Ausgabe 2019); Industrieverband Körperpflege- und Waschmittel e.V.: Frankfurt am Main, Germany, 2019. [Google Scholar]
- Davenport, B.; DeBoo, A.; Dubois, F.; Kishi, A. CEH Report: Chelating Agents; Cited by Nowack (2003); IHS Markit: London, UK, 2000. [Google Scholar]
- Nowack, B. Environmental chemistry of phosphonates. Water Res. 2003, 37, 2533–2546. [Google Scholar] [CrossRef]
- Lucci, G.M.; McDowell, R.W.; Condron, L.M. Phosphorus source areas in a dairy catchment in Otago, New Zealand. Soil Res. 2012, 50, 145. [Google Scholar] [CrossRef]
- Reichert, J.K. Organophosphonic Acids Evaluation of the Performance of Biological Sewage Treatment Plants for Their Elimination and Assessment of Their Environmental Risk Potential (Organophosphonsäuren Bewertung der Leistungsfähigkeit biologischer Abwasserbehandlungsanlagen zu ihrer Eliminierung und Beurteilung ihres Umweltgefährdungspotentials); Final report to Deutsche Bundesstiftung Umwelt: Osnabrück, Germany, 1996. [Google Scholar]
- Fischer, K. Sorption of chelating agents (HEDP and NTA) onto mineral phases and sediments in aquatic model systems: Part I: Sorption onto clay minerals. Chemosphere 1991, 22, 15–27. [Google Scholar] [CrossRef]
- Fischer, K. Sorption of chelating agents (HEDP and NTA) onto mineral phases and sediments in aquatic model systems: Part II: Sorption onto sediments and sewage sludges. Chemosphere 1992, 24, 51–62. [Google Scholar] [CrossRef]
- Nowack, B.; Stone, A.T. Adsorption of Phosphonates onto the Goethite-Water Interface. J. Colloid Interface Sci. 1999, 214, 20–30. [Google Scholar] [CrossRef] [PubMed] [Green Version]
- Hoelger, C.; Held-Beller, S.; Palmtag, J. Phosphonates as an ecologically sensible alternative to DTPA - results of a study at MD Albbruck (Phosphonate als ökologisch sinnvolle Alternative zur DTPA - Ergebnisse einer Studie bei MD Albbruck). Wochenblatt für Papierfabrikation, Chemische Technologie 2008, 11–12, 666–669. [Google Scholar]
- Metzner, G. Behaviour of organic complexing agents based on phosphonic acid in sewage treatment plants (Verhalten von organischen Komplexbildnern auf Phosphonsäurebasis in Kläranlagen). In Umweltverträglichkeit von Wasch- und Reinigungsmitteln: Münchener Beiträge zur Abwasser-, Fischerei- und Flußbiologie; Bayerische Landesanstalt für Wasserforschung, Ed.; R. Oldenbourg Verlag GmbH: Munich, Germany, 1990; pp. 323–336. ISBN 3-486-26198-3. [Google Scholar]
- Müller, G.; Steber, J.; Waldhoff, H. On the influence of hydroxyethanediphosphonic acid on phosphate elimination with FeCl3 and the remobilization of heavy metals: Results of laboratory and field tests (Zum Einfluß von Hydroxyethandiphosphonsäure auf die Phosphatelimination mit FeCl3 und die Remobilisierung von Schwermetallen: Ergebnisse von Labor- und Feldversuchen). Vom Wasser 1984, 63, 63–78. [Google Scholar]
- Nowack, B. Aminopolyphosphonate removal during wastewater treatment. Water Res. 2002, 36, 4636–4642. [Google Scholar] [CrossRef]
- Fürhacker, M.; Lesueur, C.; Pfeffer, M.; Köllensperger, G.; Popp, M.; Mentler, A. Phosphonates - AMPA (aminomethylphosphonic acid). Assessing Origin, Environmental Concentrations and Photolysis Degradation (Phosphonate – AMPA (Aminomethylphosphonsäure). Herkunftsabschätzung, Umweltkonzentrationen und Photolyseabbau); Final report (project no. 1378); Institute of Sanitary Engineering and Water Pollution Control, University of Natural Resources and Life Sciences: Vienna, Austria, 2005. [Google Scholar]
- Nowack, B. The behavior of phosphonates in wastewater treatment plants of Switzerland. Water Res. 1998, 32, 1271–1279. [Google Scholar] [CrossRef]
- Wang, S.; Sun, S.; Shan, C.; Pan, B. Analysis of trace phosphonates in authentic water samples by pre-methylation and LC-Orbitrap MS/MS. Water Res. 2019, 161, 78–88. [Google Scholar] [CrossRef]
- Armbruster, D.; Rott, E.; Minke, R.; Happel, O. Trace-level determination of phosphonates in liquid and solid phase of wastewater and environmental samples by IC-ESI-MS/MS. Anal. Bioanal. Chem. 2019. [Google Scholar] [CrossRef] [PubMed]
- International Organization for Standardization. ISO 6878:2004, Water Quality – Determination of Phosphorus – Ammonium Molybdate Spectrometric Method; International Organization for Standardization: Geneva, Switzerland, 2004. [Google Scholar]
- Rott, E.; Reinhardt, T.; Wasielewski, S.; Raith-Bausch, E.; Minke, R. Optimized Procedure for Determining the Adsorption of Phosphonates onto Granular Ferric Hydroxide using a Miniaturized Phosphorus Determination Method. J. Vis. Exp. 2018, 135. [Google Scholar] [CrossRef] [PubMed] [Green Version]
- Groß, R.; Leisewitz, A.; Moch, K. Investigation of the application quantities of hardly degradable organic ingredients in detergents and cleaning agents in comparison to the use of these substances in other industries with regard to the benefit of a substitution (Untersuchung der Einsatzmengen von schwer abbaubaren organischen Inhaltsstoffen in Wasch- und Reinigungsmitteln im Vergleich zum Einsatz dieser Stoffe in anderen Branchen im Hinblick auf den Nutzen einer Substitution); UFOPLAN FKZ 3709 65 430; Öko-Institut e.V., Institute for Applied Ecology: Freiburg, Germany, 2012. [Google Scholar]
- Batarseh, M.I. Polynuclear Aromatic Hydrocarbons (PAH) and Heavy Metals in Dry and Wet Sludge from As-Samra Wastewater Treatment Plant, Jordan. Soil Sediment Contam. 2011, 20, 535–549. [Google Scholar] [CrossRef]
- Álvarez, E.A.; Mochón, M.C.; Sánchez, J.C.J.; Rodríguez, M.T. Heavy metal extractable forms in sludge from wastewater treatment plants. Chemosphere 2002, 47, 765–775. [Google Scholar] [CrossRef]
- Gianico, A.; Braguglia, C.M.; Mascolo, G.; Mininni, G. Partitioning of nutrients and micropollutants along the sludge treatment line: A case study. Environ. Sci. Pollut. Res. Int. 2013, 20, 6256–6265. [Google Scholar] [CrossRef]
- Frigge, E.; Jackwerth, E. Preconcentration and determination of organophosphonic acids: Application to natural waters. Anal. Chim. Acta 1991, 254, 65–73. [Google Scholar] [CrossRef]
- Zenobi, M.C.; Rueda, E.H. Adsorption of Me(II), HEDP, and Me(II)−HEDP onto Boehmite at Nonstoichiometric Me(II)−HEDP Concentrations. Environ. Sci. Technol. 2006, 40, 3254–3259. [Google Scholar] [CrossRef]
- Dange, C.; Phan, T.N.T.; André, V.; Rieger, J.; Persello, J.; Foissy, A. Adsorption mechanism and dispersion efficiency of three anionic additives poly(acrylic acid), poly(styrene sulfonate) and HEDP on zinc oxide. J. Colloid Interface Sci. 2007, 315, 107–115. [Google Scholar] [CrossRef]
- Jung, A.; Bisaz, S.; Fleisch, H. The binding of pyrophosphate and two diphosphonates by hydroxyapatite crystals. Calc. Tis. Res. 1973, 11, 269–280. [Google Scholar] [CrossRef]
- Rott, E.; Minke, R.; Steinmetz, H. Removal of phosphorus from phosphonate-loaded industrial wastewaters via precipitation/flocculation. J. Wat. Proc. Eng. 2017, 17, 188–196. [Google Scholar] [CrossRef]
- Steber, J.; Wierich, P. Properties of hydroxyethane diphosphonate affecting its environmental fate: Degradability, sludge adsorption, mobility in soils, and bioconcentration. Chemosphere 1986, 15, 929–945. [Google Scholar] [CrossRef]
- Steber, J.; Wierich, P. Properties of aminotris (methylenephosphonate) affecting its environmental fate: Degradability, sludge adsorption, mobility in soils, and bioconcentration. Chemosphere 1987, 16, 1323–1337. [Google Scholar] [CrossRef]
- Tran, N.H.; Reinhard, M.; Gin, K.Y.-H. Occurrence and fate of emerging contaminants in municipal wastewater treatment plants from different geographical regions-a review. Water Res. 2018, 133, 182–207. [Google Scholar] [CrossRef] [PubMed]
- Rott, E.; Nouri, M.; Meyer, C.; Minke, R.; Schneider, M.; Mandel, K.; Drenkova-Tuhtan, A. Removal of phosphonates from synthetic and industrial wastewater with reusable magnetic adsorbent particles. Water Res. 2018, 145, 608–617. [Google Scholar] [CrossRef] [PubMed]
- Metzner, G.; Nägerl, H.-D. Environmental behavior of two water conditioning agents based on phosphonate and polyacrylate (Umweltverhalten zweier Wasserkonditionierungsmittel auf Phosphonat- und Polyacrylatbasis). Tenside Deterg. 1982, 19, 23–29. [Google Scholar]
- Rott, E.; Steinmetz, H.; Metzger, J.W. Organophosphonates: A review on environmental relevance, biodegradability and removal in wastewater treatment plants. Sci. Total Environ. 2018, 615, 1176–1191. [Google Scholar] [CrossRef] [PubMed]
- Schowanek, D.; Verstraete, W. Phosphonate utilization by bacterial cultures and enrichments from environmental samples. Appl. Environ. Microbiol. 1990, 56, 895–903. [Google Scholar] [PubMed]
- Raschke, H.; Rast, H.-G.; Kleinstück, R.; Sicius, H.; Wischer, D. Utilization of 2-phosphonobutane-1,2,4-tricarboxylic acid as source of phosphorus by environmental bacterial isolates. Chemosphere 1994, 29, 81–88. [Google Scholar] [CrossRef]
- Schöberl, P.; Huber, L. Ecologically relevant data from non-surfactant ingredients in detergents and cleaners (Ökologisch relevante Daten von nichttensidischen Inhaltsstoffen in Wasch- und Reinigungsmitteln). Tenside Surfactant Deterg. 1988, 25, 99–107. [Google Scholar]
- Klinger, J.; Sacher, F.; Brauch, H.-J.; Maier, D.; Worch, E. Behaviour of Phosphonic Acids During Drinking Water Treatment. Vom Wasser 1998, 91, 15–27. [Google Scholar]
- Chen, Y.; Baygents, J.C.; Farrell, J. Removing phosphonate antiscalants from membrane concentrate solutions using granular ferric hydroxide. J. Wat. Proc. Eng. 2017, 19, 18–25. [Google Scholar] [CrossRef] [Green Version]
- Armbruster, D.; Müller, U.; Happel, O. Characterization of phosphonate-based antiscalants used in drinking water treatment plants by anion-exchange chromatography coupled to electrospray ionization time-of-flight mass spectrometry and inductively coupled plasma mass spectrometry. J. Chromatogr. A 2019, 1601, 189–204. [Google Scholar] [CrossRef] [PubMed]
- Industrieverband Körperpflege und Waschmittel e.V. Available online: http://web.archive.org/web/20040404120236/http://umweltbundesamt.de/uba-info-daten/daten/wasch/trends.htm (accessed on 18 December 2019).
- Industrieverband Körperpflege- und Waschmittel e.V. Sustainability Report for the 2006 Reporting Year for the Detergents and Cleaning Agents Sector (Nachhaltigkeitsbericht für das Berichtsjahr 2006 für die Wasch- und Reinigungsmittelbranche); Industrieverband Körperpflege- und Waschmittel e.V.: Frankfurt am Main, Germany, 2006. [Google Scholar]
- Industrieverband Körperpflege- und Waschmittel e.V. Sustainability Report Laundry & Detergent Industry in Germany Reporting Years 2007 and 2008 (Nachhaltigkeitsbericht Wasch- und Reinigungsmittelbranche in Deutschland Berichtsjahre 2007 und 2008); Industrieverband Körperpflege- und Waschmittel e.V.: Frankfurt am Main, Germany, 2009. [Google Scholar]
Figure 1.
Structures of the investigated phosphonates and their CAS numbers.

Figure 2.
Process overview of both investigated wastewater treatment plants (WWTPs) (p.e.: population equivalents, red crosses: sampling points).
Figure 2.
Process overview of both investigated wastewater treatment plants (WWTPs) (p.e.: population equivalents, red crosses: sampling points).

Figure 3.
Distribution of dissolved and adsorbed phosphonates in the influent of the two WWTPs investigated. In the sample of CW40 (WWTP1) the solids were not extracted due to insufficient sample volume.
Figure 3.
Distribution of dissolved and adsorbed phosphonates in the influent of the two WWTPs investigated. In the sample of CW40 (WWTP1) the solids were not extracted due to insufficient sample volume.

Figure 4.
Concentrations of dissolved phosphonates in various stages of the two monitored WWTPs (boxplots: minimum, first quartile, median, third quartile, maximum).
Figure 4.
Concentrations of dissolved phosphonates in various stages of the two monitored WWTPs (boxplots: minimum, first quartile, median, third quartile, maximum).

Figure 5.
Concentrations of dissolved phosphonates in the effluent of different stages of the two WWTPs investigated (boxplots: minimum, first quartile, median, third quartile, maximum).
Figure 5.
Concentrations of dissolved phosphonates in the effluent of different stages of the two WWTPs investigated (boxplots: minimum, first quartile, median, third quartile, maximum).

Figure 6.
Elimination rates of dissolved phosphonates in consecutive treatment stages of the two WWTPs investigated (boxplots: minimum, first quartile, median, third quartile, maximum). The exact degrees of aminotris(methylphosphonic acid) (ATMP), ethylenediaminetetra(methylene phosphonic acid) (EDTMP), and diethylenetriaminepenta(methylene phosphonic acid) (DTPMP) elimination could not be calculated since the concentrations determined in the secondary effluent and tertiary effluent were frequently below the limits of quantification (LOQ).

Figure 7.
Contribution of the five phosphonates investigated to the dissolved unreactive phosphorus (DUP) of each individual WWTP stage (boxplots: minimum, first quartile, median, third quartile, maximum).
Figure 7.
Contribution of the five phosphonates investigated to the dissolved unreactive phosphorus (DUP) of each individual WWTP stage (boxplots: minimum, first quartile, median, third quartile, maximum).

© 2019 by the authors. Licensee MDPI, Basel, Switzerland. This article is an open access article distributed under the terms and conditions of the Creative Commons Attribution (CC BY) license (http://creativecommons.org/licenses/by/4.0/).
Share and Cite
MDPI and ACS Style
Rott, E.; Happel, O.; Armbruster, D.; Minke, R. Behavior of PBTC, HEDP, and Aminophosphonates in the Process of Wastewater Treatment. Water 2020, 12, 53. https://doi.org/10.3390/w12010053
AMA Style
Rott E, Happel O, Armbruster D, Minke R. Behavior of PBTC, HEDP, and Aminophosphonates in the Process of Wastewater Treatment. Water. 2020; 12(1):53. https://doi.org/10.3390/w12010053
Chicago/Turabian StyleRott, Eduard, Oliver Happel, Dominic Armbruster, and Ralf Minke. 2020. "Behavior of PBTC, HEDP, and Aminophosphonates in the Process of Wastewater Treatment" Water 12, no. 1: 53. https://doi.org/10.3390/w12010053
Note that from the first issue of 2016, this journal uses article numbers instead of page numbers. See further details here.