Article

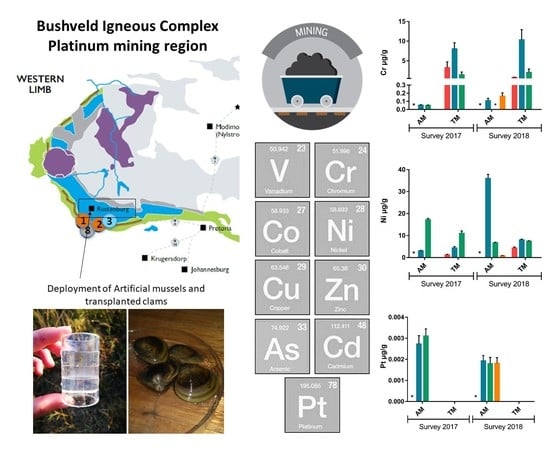
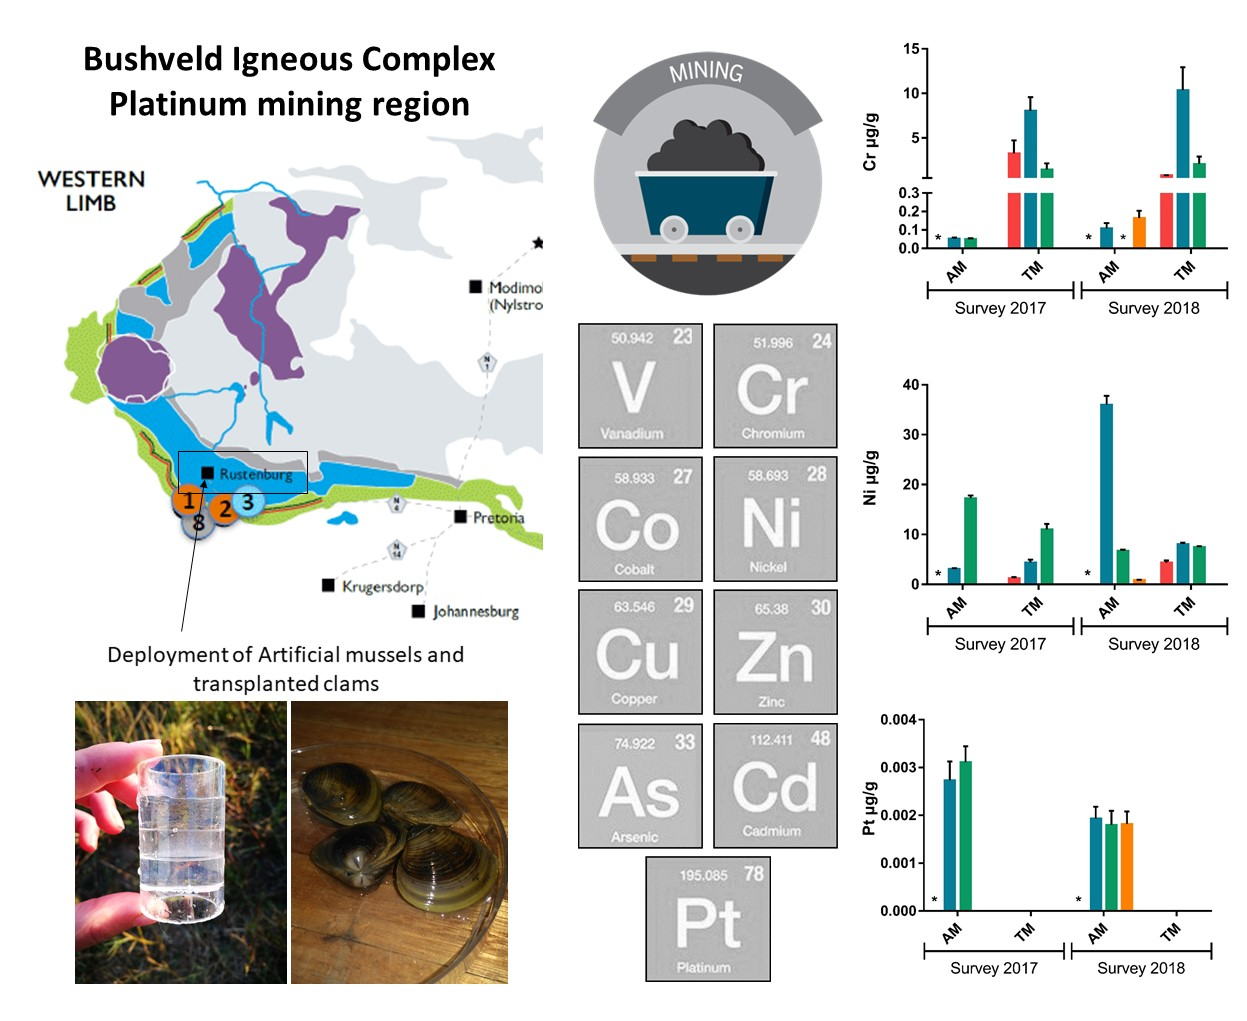
The Application of Artificial Mussels in Conjunction with Transplanted Bivalves to Assess Elemental Exposure in a Platinum Mining Area

1
Water Research Group, Unit for Environmental Sciences and Management, North-West University, 2520 Potchefstroom, South Africa
2
Department of Aquatic Ecology and Centre for Water and Environmental Research, University of Duisburg-Essen, 45141 Essen, Germany
*
Author to whom correspondence should be addressed.
Water 2020, 12(1), 32; https://doi.org/10.3390/w12010032
Submission received: 31 October 2019 / Revised: 6 December 2019 / Accepted: 17 December 2019 / Published: 20 December 2019

Abstract

:
There is increasing evidence that platinum group elements (PGE) are pollutants of emerging concern worldwide. Limited information exists on levels, particularly in regions where PGEs are mined. A passive sampling device (i.e., the artificial mussel (AM)) and transplanted indicator organisms (i.e., the freshwater clam Corbicula fluminalis africana) were deployed along a PGE mining gradient in the Hex River, South Africa, and concentrations of As, Cd, Co, Cr, Ni, Pb, Pt, V, and Zn were determined after six weeks of exposure. Results showed differential uptake patterns for Pt, Cr, and Ni between the AMs and clams indicating availability differences. For monitoring purposes, a combination of AMs and indicator organisms provides a more holistic assessment of element exposure in aquatic environments.

Graphical Abstract

1. Introduction

In recent decades, the environmental concentrations of platinum group elements (PGE) have increased in different environmental matrices worldwide since these precious metals have been used more often in a number of applications [1]. The biggest contributors to PGEs in the environment are the use of automotive catalytic converters and the mining activities. Mining activities in South Africa greatly contribute to PGE emissions in the environment [1]. It is particularly in the platinum mining regions of the North-West Province of South Africa where PGE and associated metals show increased levels in the aquatic environment [2,3].
Bioaccumulation is an important process where living organisms take up toxicants at a greater rate than the rate at which they eliminate these substances [4]. Many factors can influence the bioaccumulation of metals in the environment such as pH, conductivity, temperature, and salinity, as well as biotic factors such as age, body size, and reproductive status of the bioaccumulating organism [4].
It is this process of bioaccumulation that is applied in monitoring studies where organisms such as bivalves are used as indicators of metal exposure [5]. Traditionally, resident bivalve populations are used as indicator species (passive biomonitoring) [6]. However, in instances where no resident species are available, organisms that were collected from an unstressed or otherwise unpolluted population can be translocated to a selected site to determine its degree of pollution (active biomonitoring) [7].
Suitable transplanted organisms are selected based on biological characteristics, such as tolerance and abundance. Transplanted organisms facilitate the investigation of areas where native specimens are absent or compensatory adaptive mechanisms occur in the native populations from contaminated areas [8]. For this study, the freshwater clam Corbicula fluminalis africana was selected as a bioindicator organism. Bivalves are excellent bioindicators because of their sensitivity to contaminants, sedentary lifestyle, wide geographical distribution, high abundance, high bioaccumulation capacity, and their sturdiness for both laboratory and field studies [4].
Despite the widespread use of living organisms as indicators of metal bioaccumulation, they also have disadvantages. The kinetics of metal uptake and elimination by these organisms are sometimes not well understood [9] and are affected by factors such as temperature, life stage of the organism (e.g., larval versus adult), size, depth, and reproduction [7]. Different indicator species have different natural distribution patterns. Therefore, they are not always present in all ecosystems that need to be monitored to prevent the comparison between different sites [7].
To overcome these disadvantages, passive sampling devices such as the artificial mussel (AM) have been utilised. The advantages of using AMs for monitoring metals are the provision of time-integrated estimates of metal concentrations within the aquatic ecosystems, the possibility of monitoring water bodies with unfavourable conditions for living indicator species, and the avoidance of killing organisms [10,11]. These devices are not affected by biotic and abiotic factors and, thus, can be deployed in marine and freshwater ecosystems [12,13].
Several studies included both AMs and transplanted organisms to monitor metal exposure. The results of these studies indicate that AMs are less affected by salinity and temperature than transplanted organisms [10,14,15] and that AMs and bivalves accumulate metals at different levels but in a similar pattern [13,15].
The present study aims to determine if the AM can be used as a tool to determine the biologically available concentrations of Pt and other elements in freshwater ecosystems. The AM was tested in a field study alongside an established bivalve bioaccumulation indicator to determine the degree of similarity in element bioaccumulation. Additionally, the concentrations measured in the AMs and bivalves were related to the environmental concentrations in the water at each of the study sites.

2. Materials and Methods

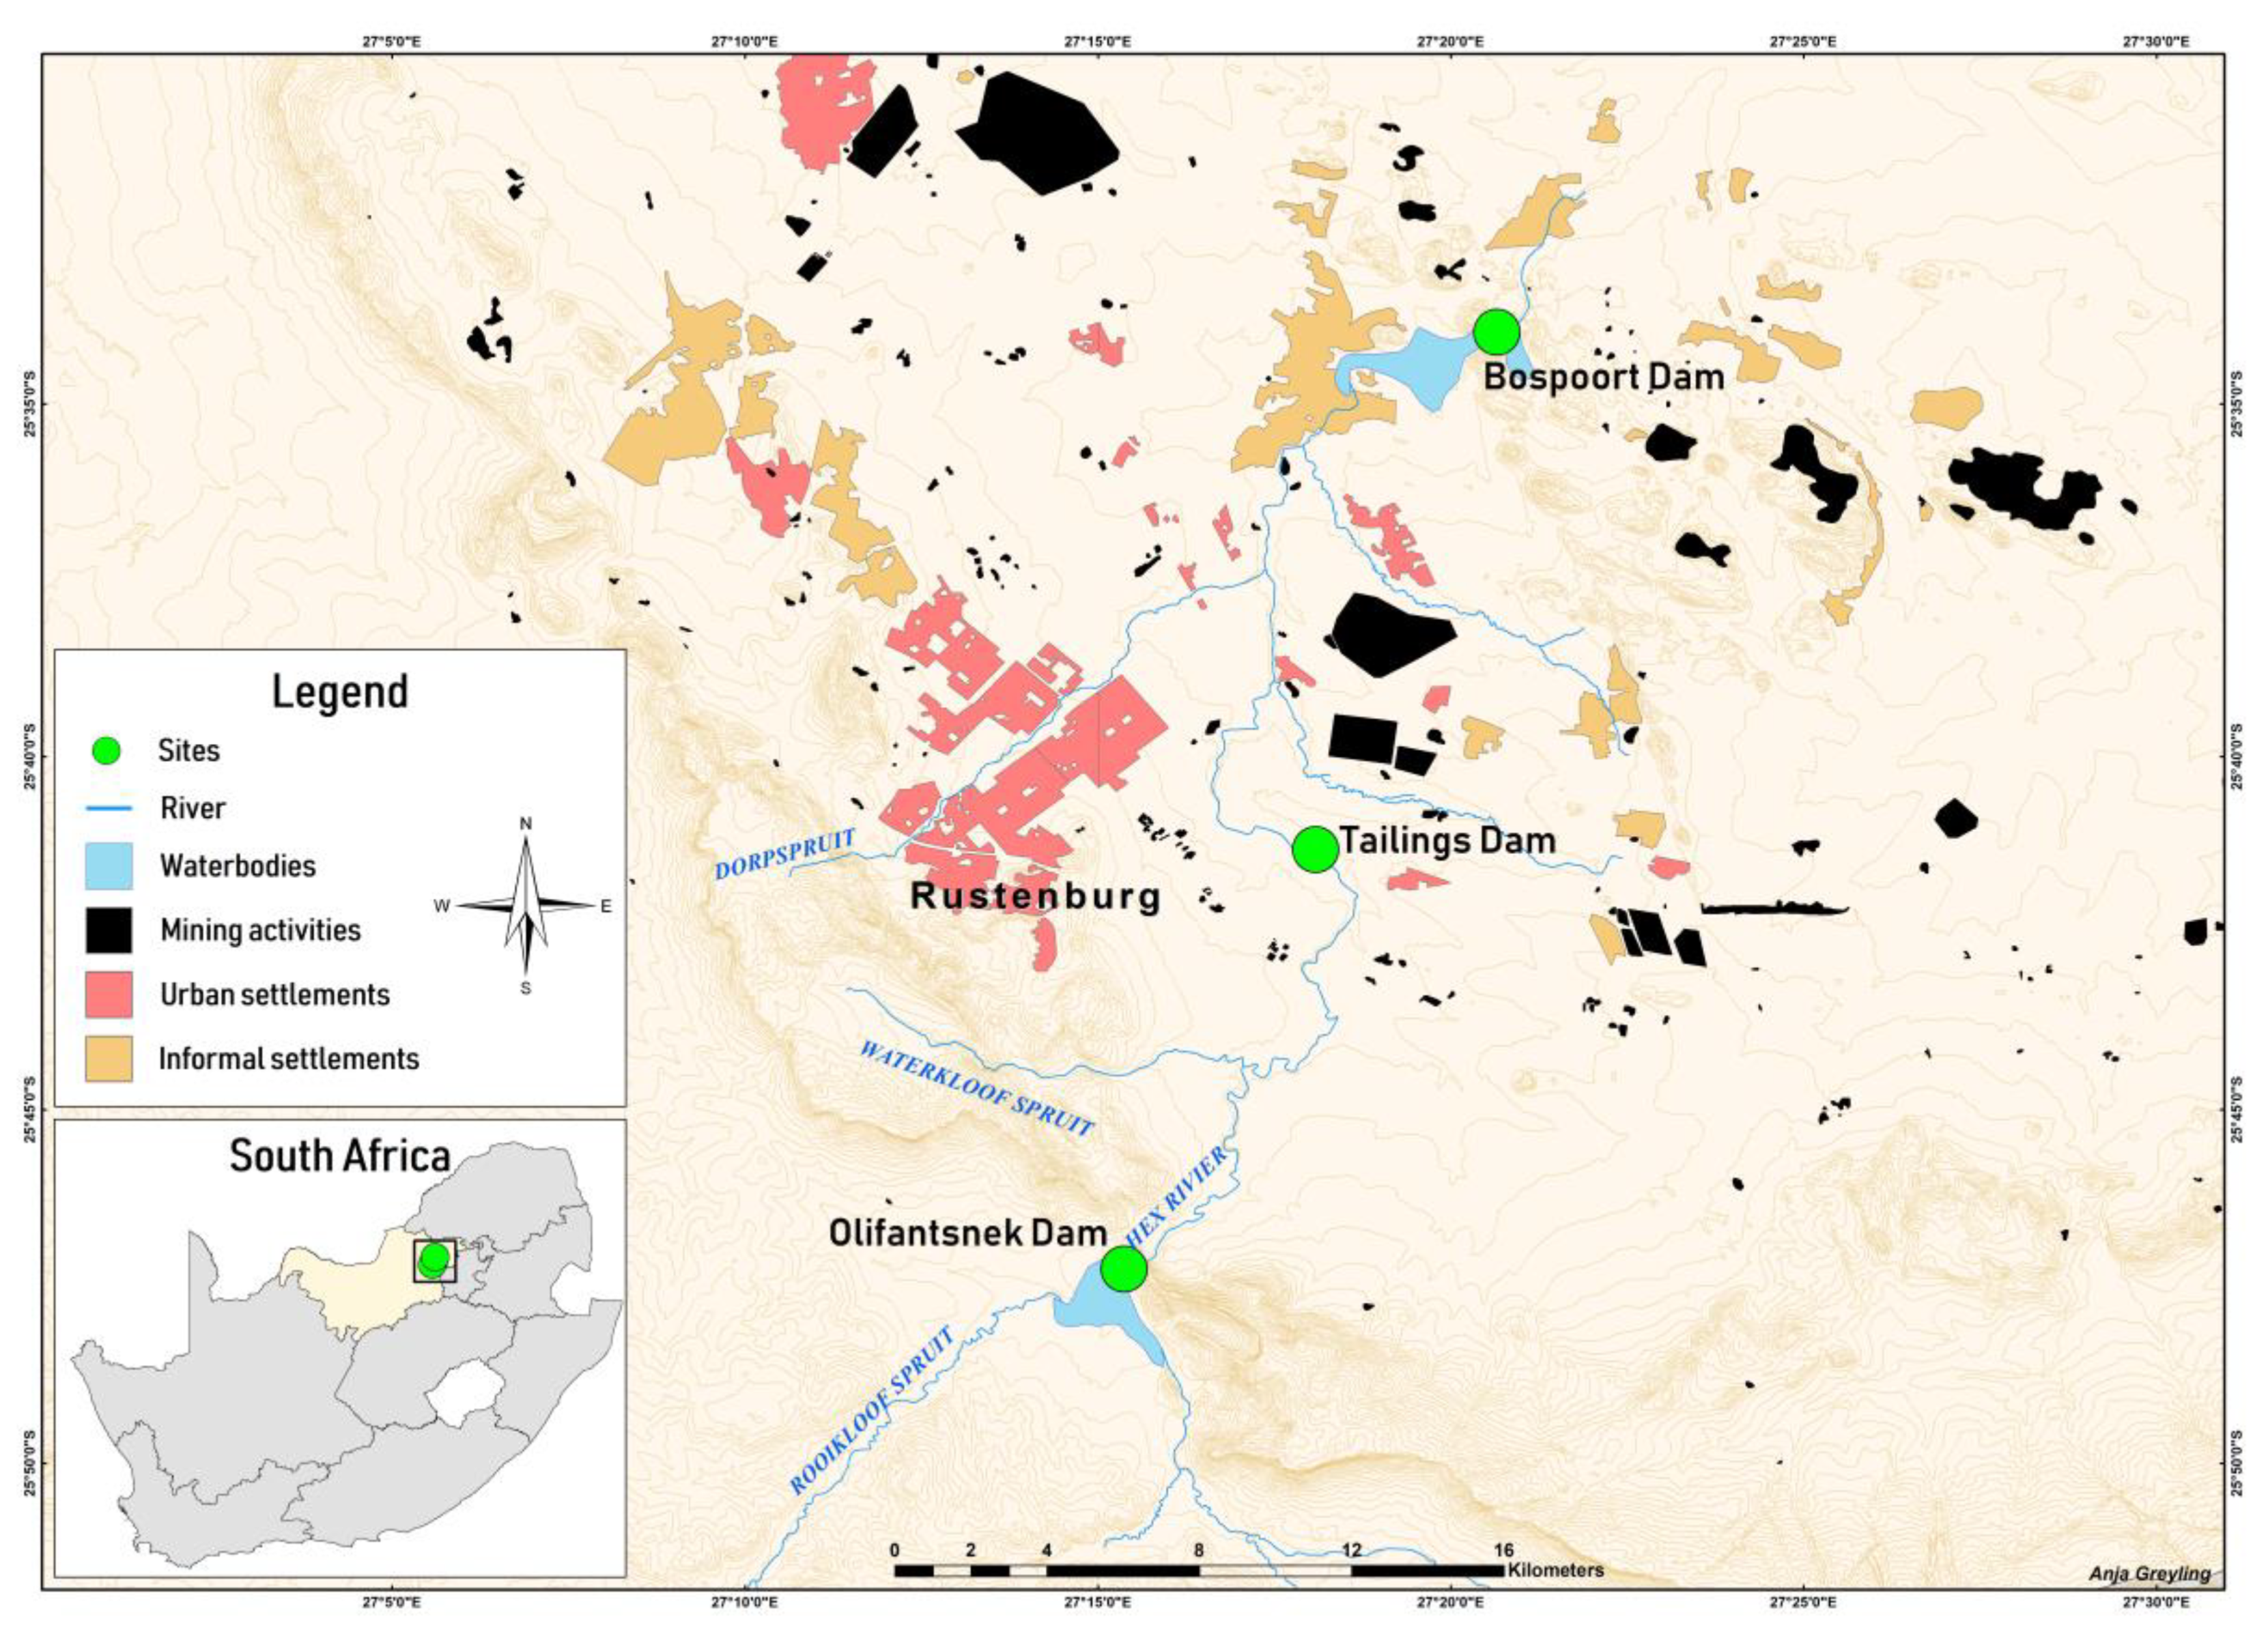
2.1. Description of the Study Area and Sampling Sites

The Hex River flows through the city of Rustenburg, which is the most populated municipality in the North West Province of South Africa. Rustenburg is located on the western limb of the Bushveld Igneous Complex where the main industrial activity is mining [16]. These mining activities include mining for platinum and chromium. Along the course of the Hex River, there are impoundments, which can be affected by mining activities [17].
Olifantsnek Dam is situated to the south of Rustenburg near the origin of the Hex River and is separated from the mining area by the Magaliesberg Mountain range. It was, therefore, chosen as the reference site [17]. According to Roux [18], the part of the Hex River that joins with Olifantsnek Dam is in a good to fair ecological state. The main impacts on this impoundment include water abstraction and farming activities. The ecological category of this stretch of the river classifies it as largely natural/moderately modified. Olifantsnek Dam is managed by private owners, where the main activity is recreation, e.g., fishing and sailing [18].
Bospoort Dam is a small state-owned impoundment situated along the course of the Hex River in Rustenburg [17]. The land-uses in the catchment include urban developments, intensive mining activities, and agricultural activities [19]. The water of Bospoort Dam is also used for irrigation and, in the past, for domestic water supply. However, due to a decrease in the water quality and an increase in algal blooms that influenced the taste and odor of the water, Bospoort Water Treatment Works (WTW) ceased to operate [19]. The Bospoort Dam is classified as being in a hypereutrophic state, where the possible influences include sewage treatment works, agricultural and urban run-offs, as well as recirculation of nutrients that can be found in the sediments [19]. In 2008, a report was published on the water quality of Bospoort Dam stating that the Cd, As, and Pb concentrations in the water are of concern [19]. The system also shows a high salt content, which is generally indicated by high conductivity values [19]. Urban surface runoff and mining activities are possible sources of ions that contributed to the high conductivity in the Bospoort dam, while the possible sources of elevated metal concentrations include mining activities and runoff from agricultural fields [19]. According to Roux [18], the Hex River upstream of Bospoort Dam is classified as seriously to critically modified, whereas the river below the dam is in a moderate to largely modified category.
Two sampling surveys during the low flow periods (dry seasons—May to June) in 2017 and 2018 were undertaken at the selected sites (Figure 1). In the second survey, a third site was added, which was located in a pollution control dam on the premises of a platinum mine to quantify the release of Pt and other elements by that mine. At each of these sampling sites, water samples were taken and AMs and clams were collected after exposure.

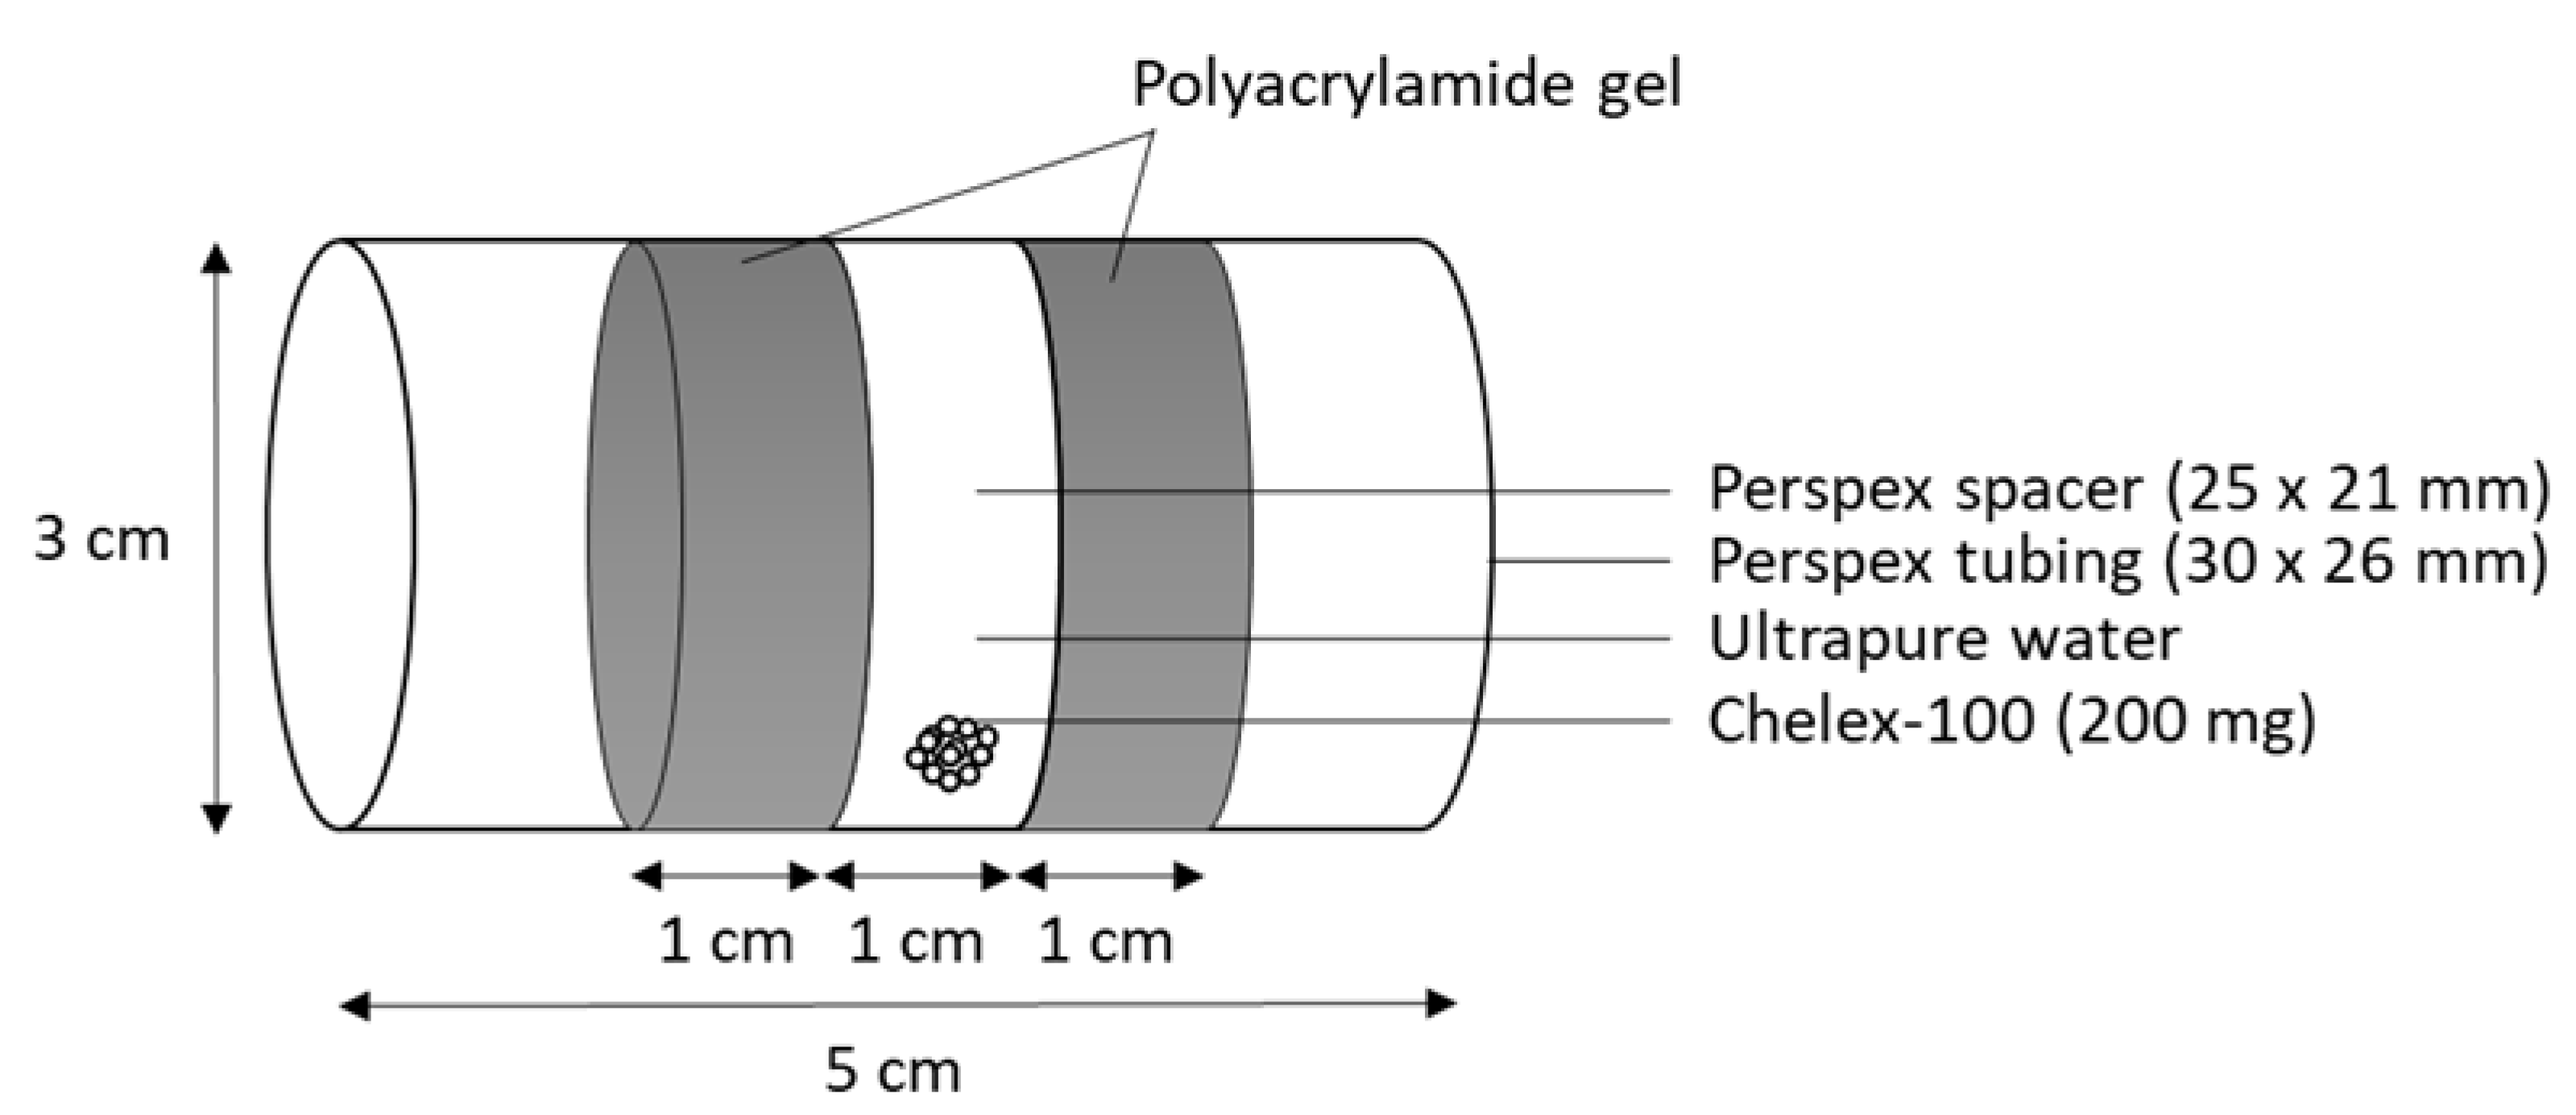
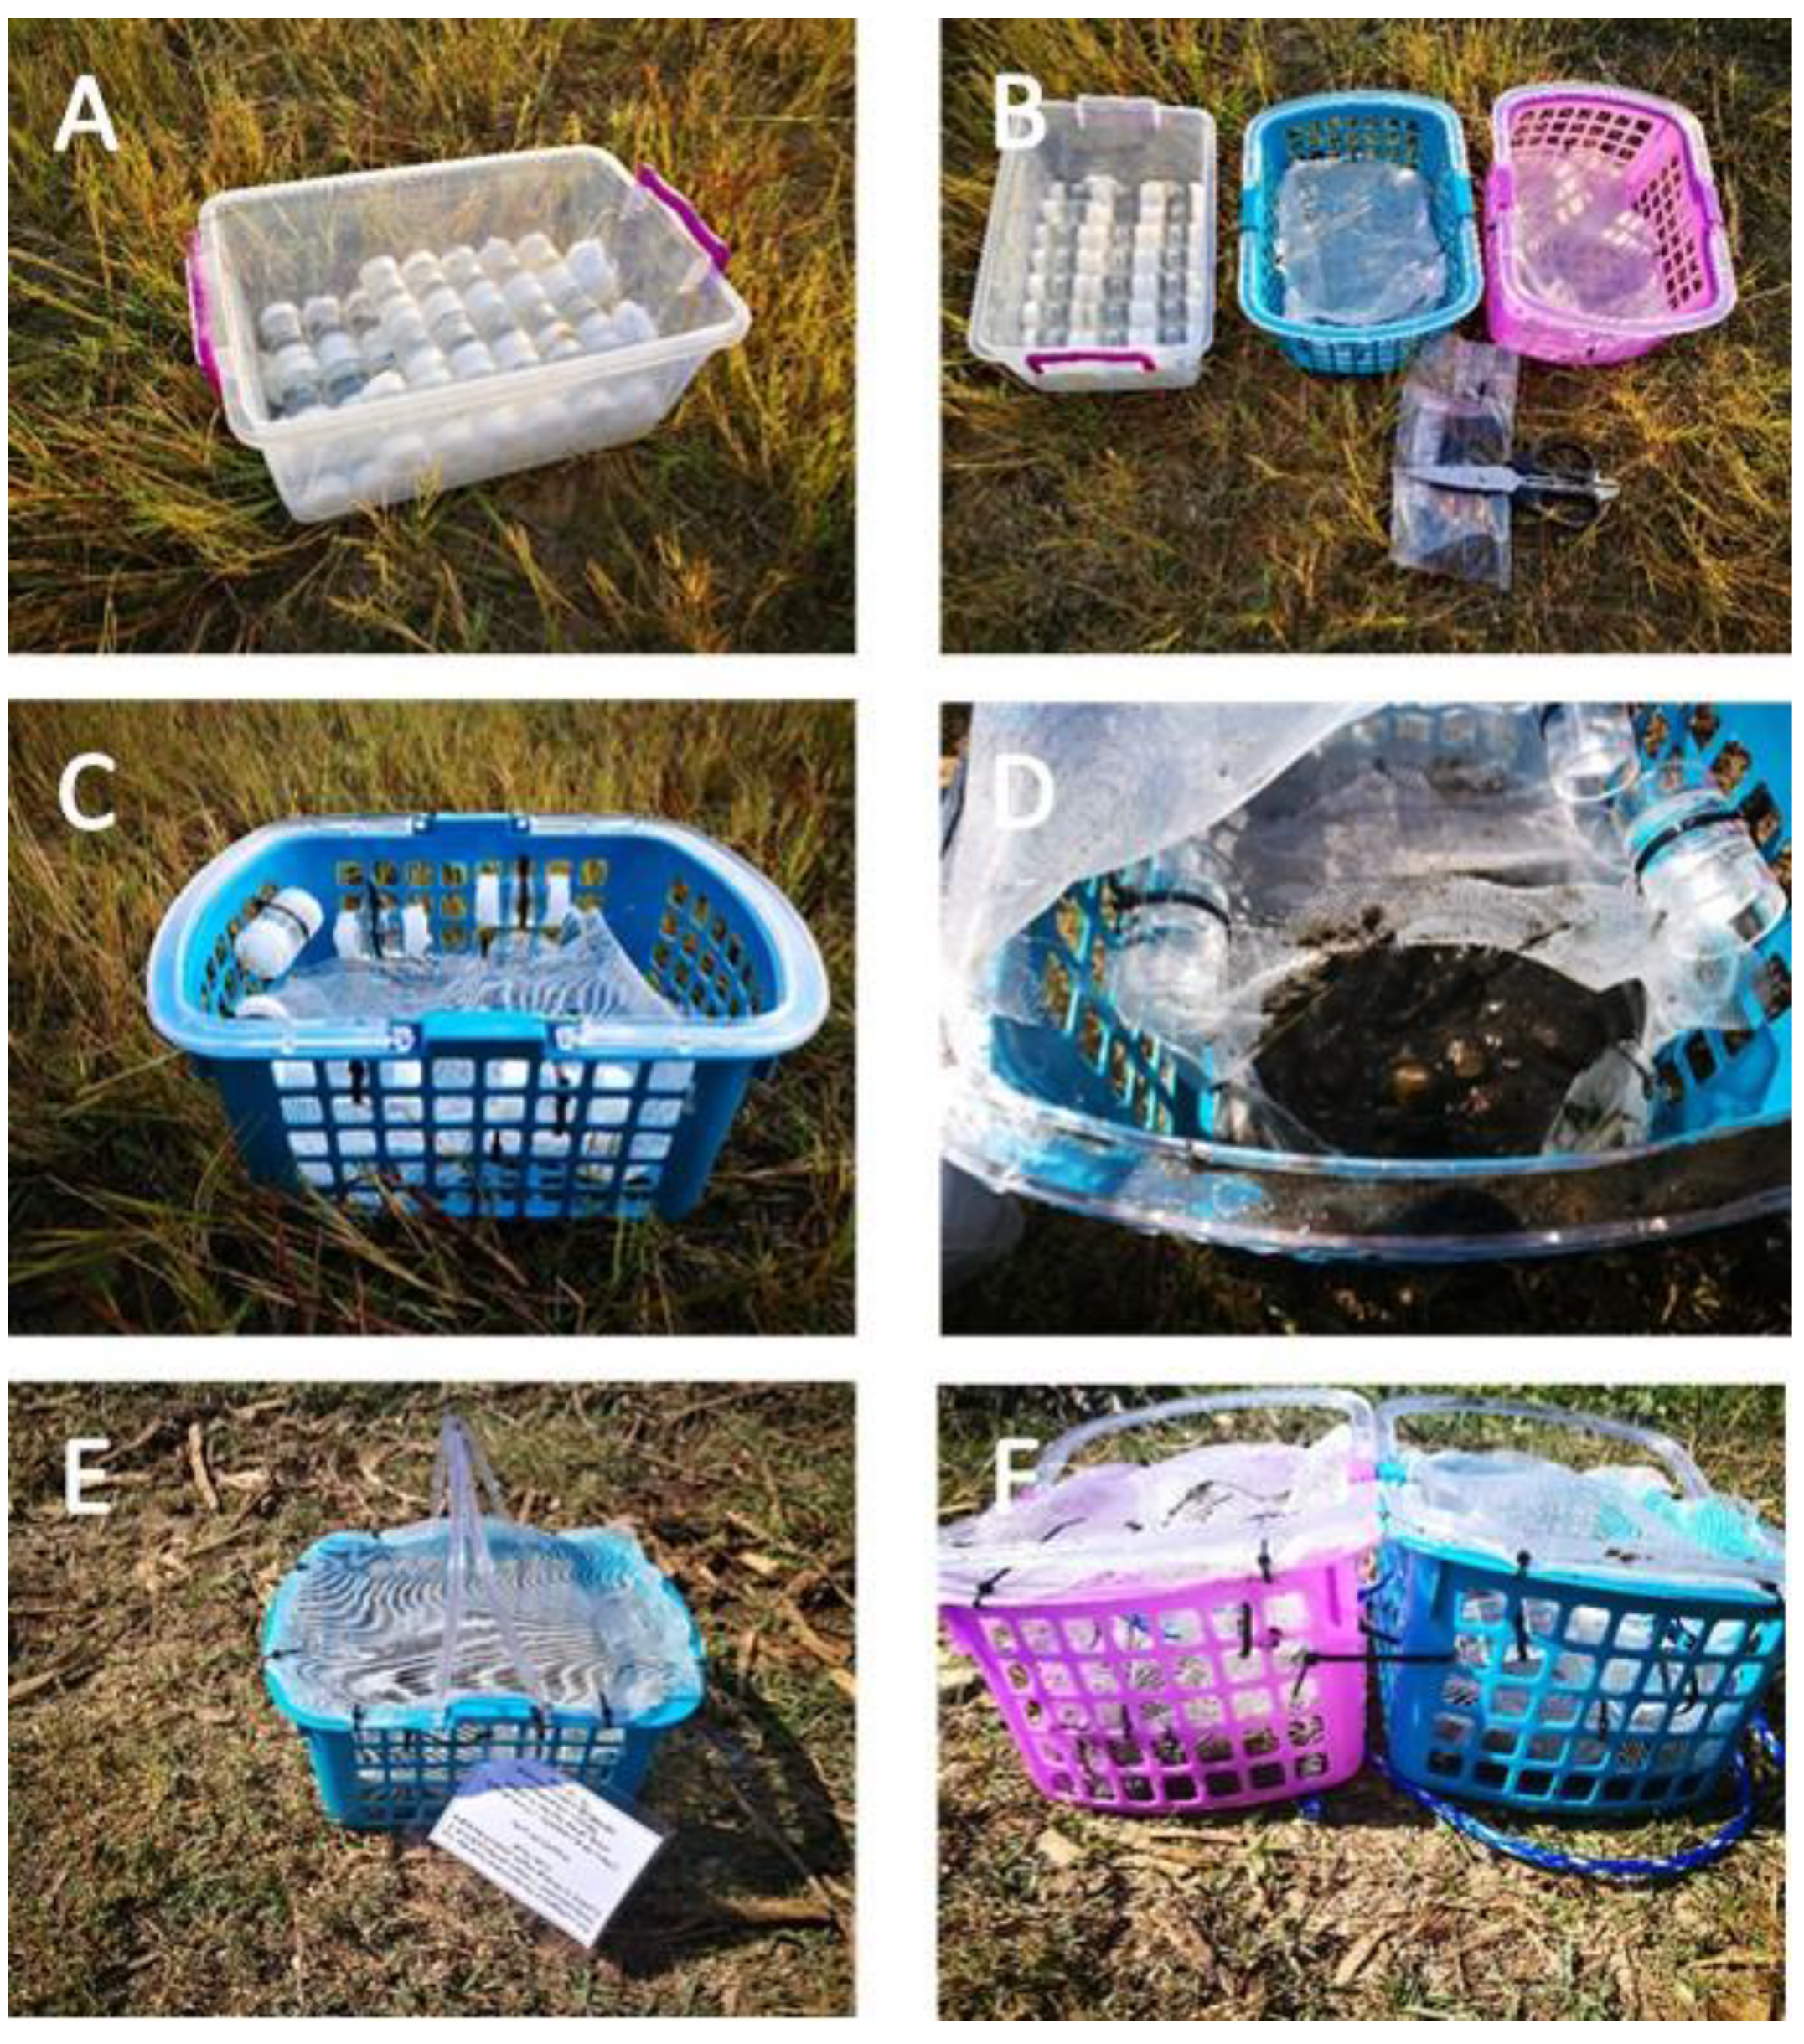
2.2. Passive Sampling Device—Artificial Mussel

The artificial mussel design was adapted for use in freshwater from the original design developed for marine environments by Wu, Lau, Fung, Ko, and Leung [10]. The artificial mussel consists of a Perspex tubing, containing 200 mg Chelex beads suspended in ultrapure water inside a 1 cm Perspex spacer (Figure 2). These components are enclosed between two polyacrylamide gel layers that consist of acrylamide (Acrylamide for electrophoresis, ≥99% (HPLC) powder, Sigma, Germany), N,N methylenebis-acrylamide (BioReagent, suitable for electrophoresis, 99%, Sigma, Germany), ammonium peroxidisulfate (Reagent grade, 98%, Sigma, Germany), and N,N,N’,N′-Tetramethylethylenediamine (BioReagent, for molecular biology, ≥99% (GC), Sigma, Germany) [20].
Once the AMs were assembled, the devices were placed in containers filled with ultrapure water and stored in the laboratory until being deployed. For the transportation of the AMs to the field, the devices were removed from the water and both ends of the tube were plugged with cotton soaked in ultrapure water. This prevents any damage that may occur during transportation. One set of 10 AMs was kept in the laboratory to serve as a non-exposed control.

2.3. Corbicula Fluminalis Africana

In addition to the deployment of the AM, an established bioaccumulation indicator species was concomitantly deployed. Freshwater clams, Corbicula fluminalis africana, with an average shell length of 28 ± 5 mm were collected from the Mooi River, Potchefstroom, South Africa. The clams were transported to the laboratory, where they were kept in reconstituted freshwater for mussels [21] for a depuration period of two weeks. During laboratory maintenance, the clams were fed with Spirulina cultured in the laboratory at the North-West University. Water was changed regularly throughout the two-week depuration period. For active biomonitoring, the clams were transported to the field in plastic containers filled with reconstituted freshwater and supplied with oxygen using a portable pump. A control group of clams was prepared for metal analyses to determine the initial concentrations before the clams were deployed at the sampling sites.

2.4. Deployment of the Artificial Mussels and Clams

The AMs and clams were deployed at each sampling site in two plastic baskets (Figure 3). Each basket was fitted with a mesh bag in the bottom of the basket. In addition, a mesh covered the top of the basket. Once arriving at the site, the mesh bags were filled with sediment from that site. This was done to create a natural habitat for the clams for the exposure period. Thereafter, 10 clams were transferred to each basket. In total, 20 transplanted clams were deployed at each site. After transferring the clams, the mesh bags were closed to prevent the organisms from escaping. The top half of each basket was then used to attach the AMs. Fifteen AMs were deployed at each site by fastening them to the side of the plastic baskets with cable ties. The baskets were covered with mesh to prevent objects from damaging the AMs during the survey. Once the AMs and transplanted clams were secured, the baskets were tied together with rope and cable ties and secured to a weight. The weights ensured the submersion of the baskets within the water body. The baskets were secured to buoys and permanent structures within the impoundments and the pollution control dam on the mine site.

2.5. Retrieval of Artificial Mussels and Clams

Each batch of AMs and transplanted clams were retrieved after six weeks of exposure. Each AM was then rinsed with water from the site to remove any silt or algae that might have accumulated at the surface during the exposure period [20]. Cotton pads were soaked in water from the site, and placed in both ends of the AM to form a plug. This ensured that the gel would not get damaged during transportation in order to prevent the water and Chelex beads from seeping from the AM. At the laboratory, the containers with the AMs were placed at room temperature until further analysis.
The transplanted clams were retrieved at the same time as the AMs. These organisms were removed from the mesh bags and placed in containers that were fitted with an oxygen pump and water from the site. They were transported back to the laboratory and were killed by deep-freezing after they were measured and weighed. For each sampling site, soft tissues were dissected from the shells, placed in acid pre-washed polypropylene tubes, and frozen at −4 °C until further preparation. The clam tissue samples were freeze-dried before elemental analysis.

2.6. Water Quality Parameters and Sample Collection

In situ water quality parameters, i.e., pH, electrical conductivity (EC), total dissolved solids (TDS), temperature, and dissolved oxygen (DO) concentrations, were determined at each sampling site at the day of deployment as well as at the day of retrieval of the AMs and clams. At the same time, three water samples were collected at each site. The sampling procedure was as follows: 10 mL water was taken and acidified with 10 µL HNO3 (sub-boiled from 65%; p.a. quality, Merck, Darmstadt, Germany) and stored in polypropylene tubes at room temperature until elemental analysis.

2.7. Element Analysis

For elemental analysis, the content of each control (n = 10) and field-deployed (n = 15) AM was emptied into a 15-mL polypropylene tube. After centrifugation (2 min at 1000× g), the supernatant was removed and the beads were rinsed with 5 mL of ultrapure water. The supernatant was removed and the beads were eluted with a mixture of 4.5 mL 6 M HNO3 (sub-boiled from 65%, Merck, Darmstadt, Germany) and 0.5 mL HCl (37%, suprapure, Merck, Darmstadt, Germany) for approximately 2 hours to ensure that all bound elements were released from the beads. After centrifugation, the supernatant was removed and placed in polypropylene tubes at room temperature for further analysis.
For digestion of the freeze-dried clam soft tissue, five replicate samples of at least 60 mg (dry weight) were weighed into 20-mL TFM® vessels (MarsXpress, CEM, Kamp-Lintfort, Germany). The digestion was carried out in a microwave digestion system (CEM, Mars 6) with a mixture of 2.5 mL H2O2 (30%, Suprapur®, Merck, Darmstadt, Germany) and 1.3 mL HNO3 (sub-boiled from 65%, p.a. quality, Merck, Darmstadt, Germany), according to Zimmermann et al. [22]. The clear digest solutions were then transferred to 5-mL glass flasks and brought to volume with 1% HNO3. The digested solutions were stored at room temperature in polypropylene tubes until elemental detection.
Concentrations of As, Cd, Co, Ni, Pb, Pt, V, and Zn in the water samples, AMs, and clam tissue samples were determined using a quadrupole Inductively Coupled Plasma Mass Spectrometry (ICP-MS) system (Elan 6000, Perkin Elmer, Rodgau, Germany) equipped with an autosampler system (AS-90, Perkin Elmer, Rodgau, Germany). Cr concentrations were analyzed by atomic absorption spectrometry (AAS) as described by Erasmus et al. [3]. Hafnium oxide interference rates on Pt-194 were below 2%. Therefore, no Hf correction was performed. For the ICP-MS analysis, the wash time was set to 30 s with 2% HNO3 to avoid contamination. After every 10 samples, a standard solution (10 µg/L), for all elements measured, was used to control the accuracy and stability of the measurements. Before measuring, samples were diluted 1:10 with an internal standard solution, which consisted of 1% HNO3 and 10 µg/L thulium and yttrium (Certipur®, Merck, Darmstadt, Germany). Calibration of the instrument was performed using a series of 11 dilutions of the standard solution. With this, the concentrations of the sample analytes were calculated using regression lines with a correlation factor of ≥0.999. Detection limits were calculated as three times the standard deviation of the concentrations in 10 analytical blanks (Table 1).
The AM data was converted to µg/g units by referring the total eluted analyte mass (in µg) to the mass of Chelex beads (200 mg) in an AM. Thus, the AM data of the present study is comparable with the concentrations measured in the transplanted clams and other studies [20,23].

2.8. Statistical Analysis
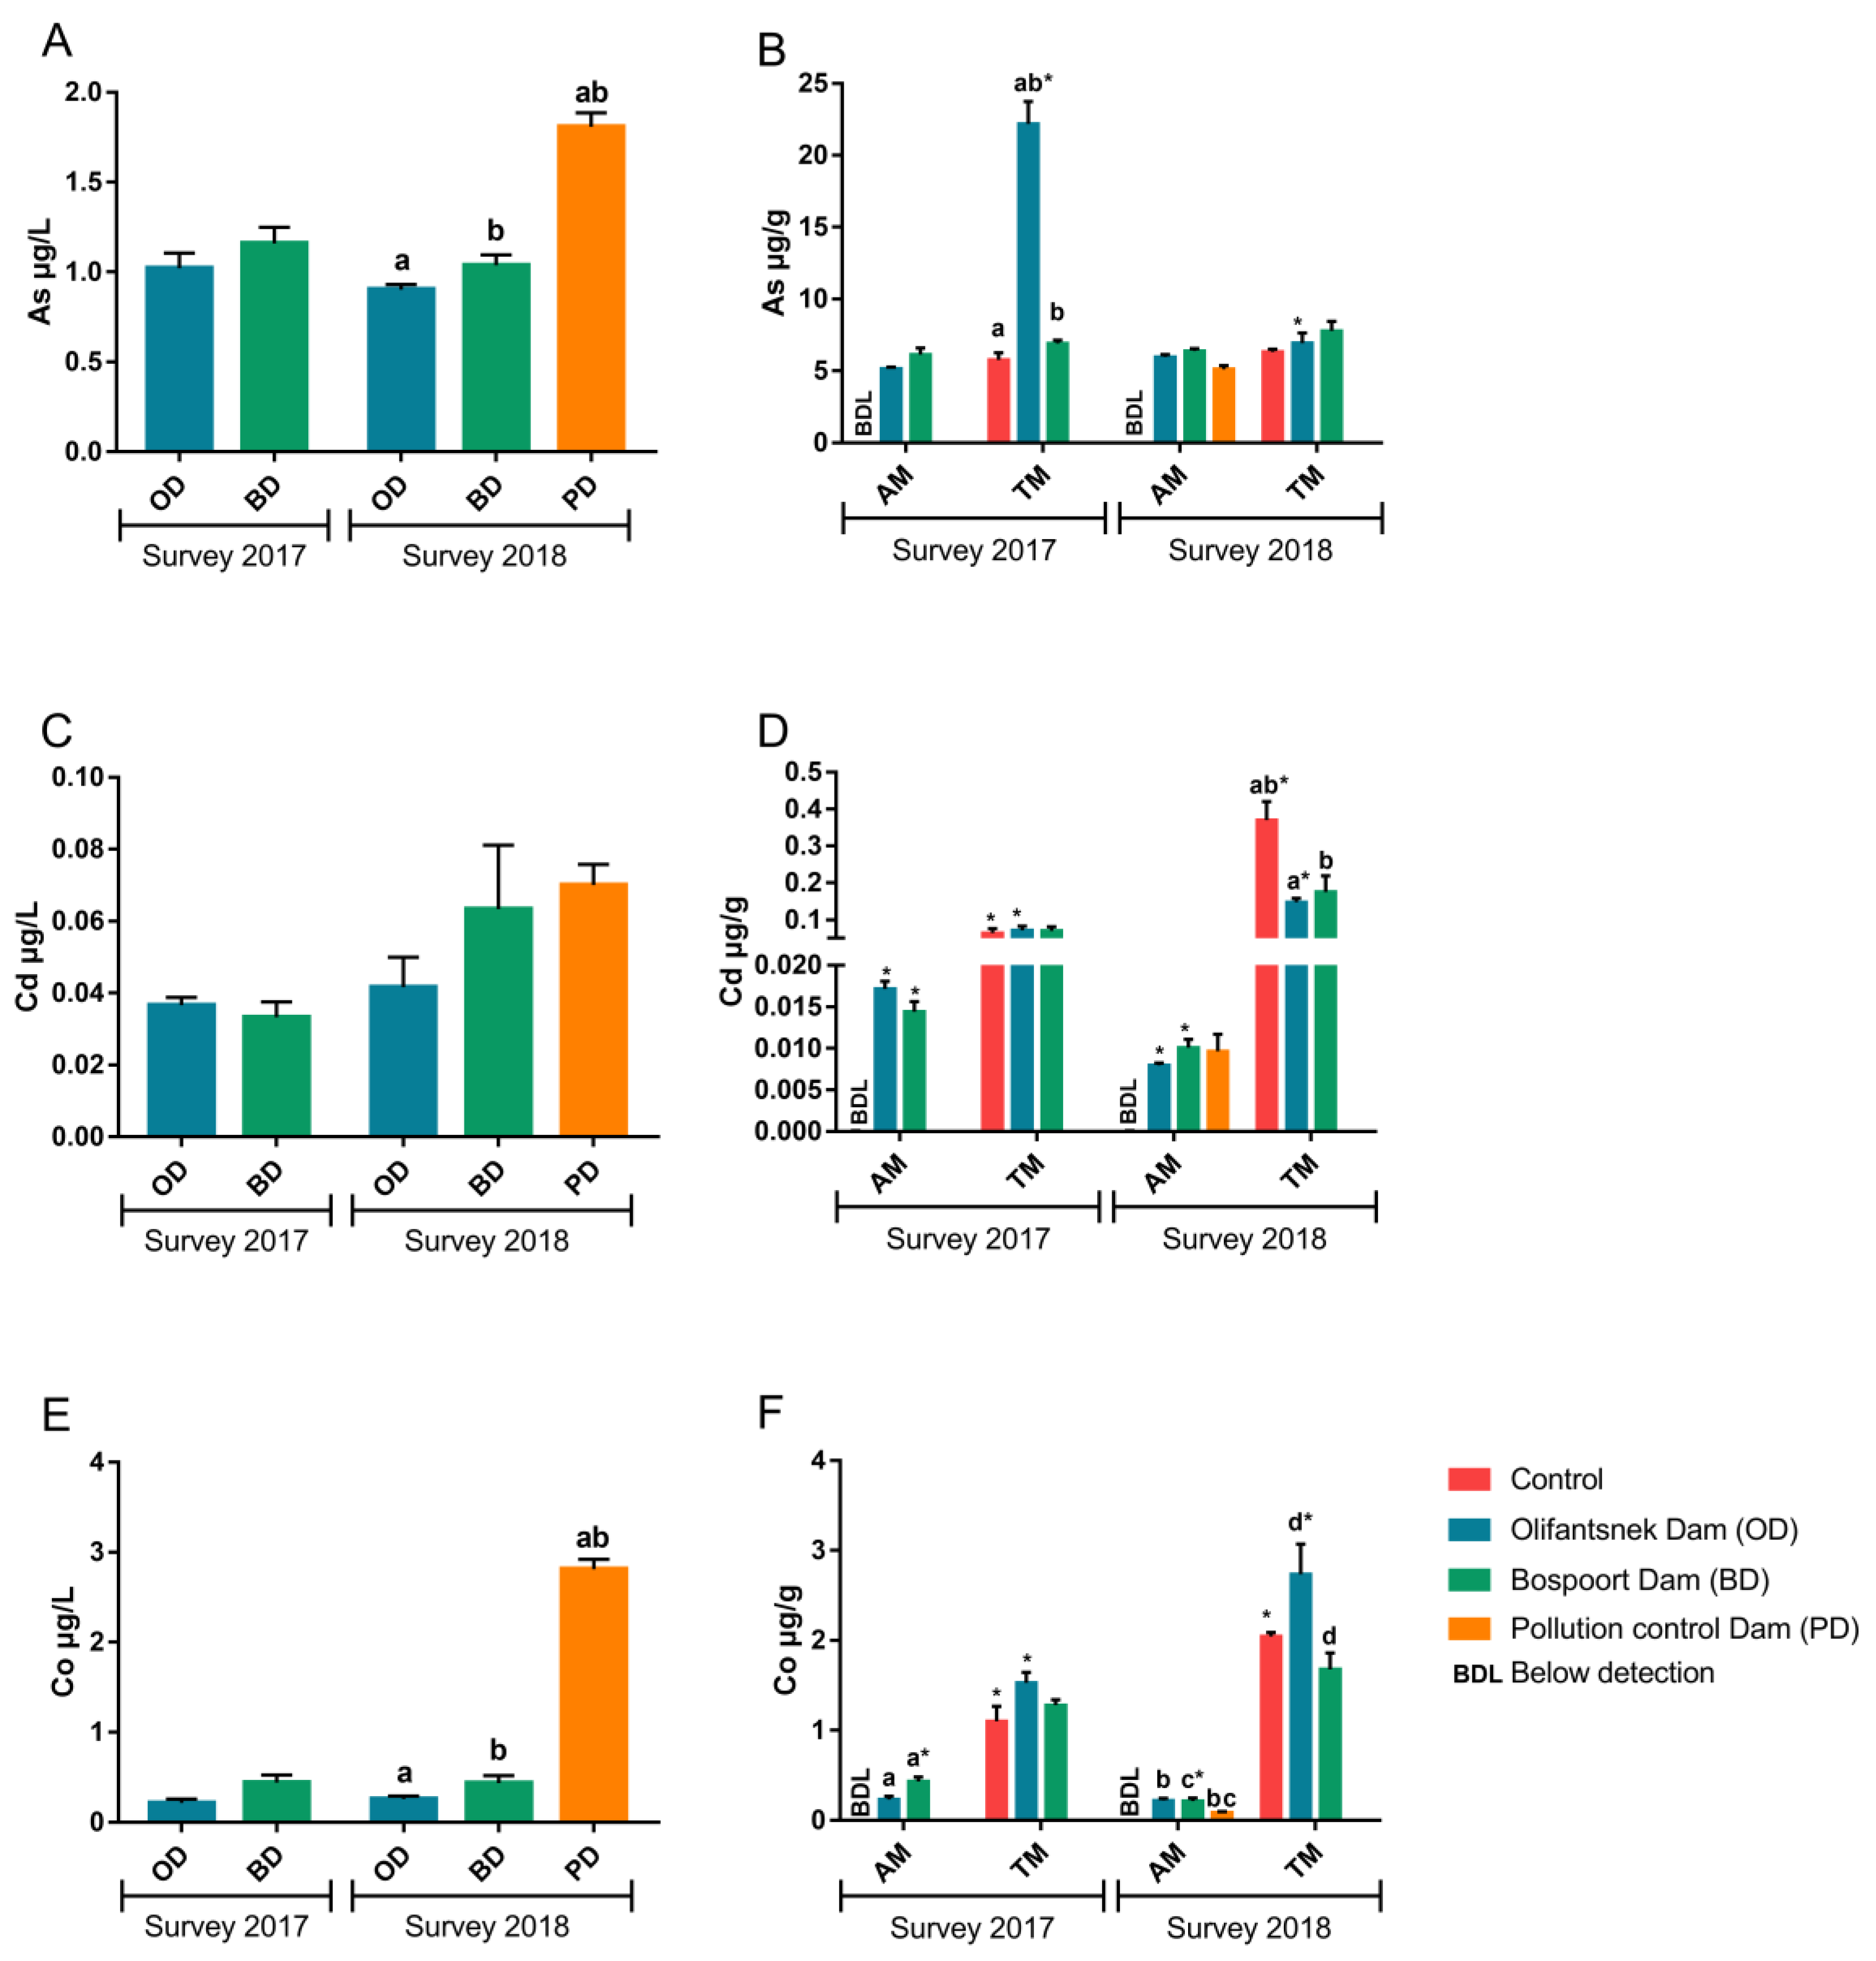
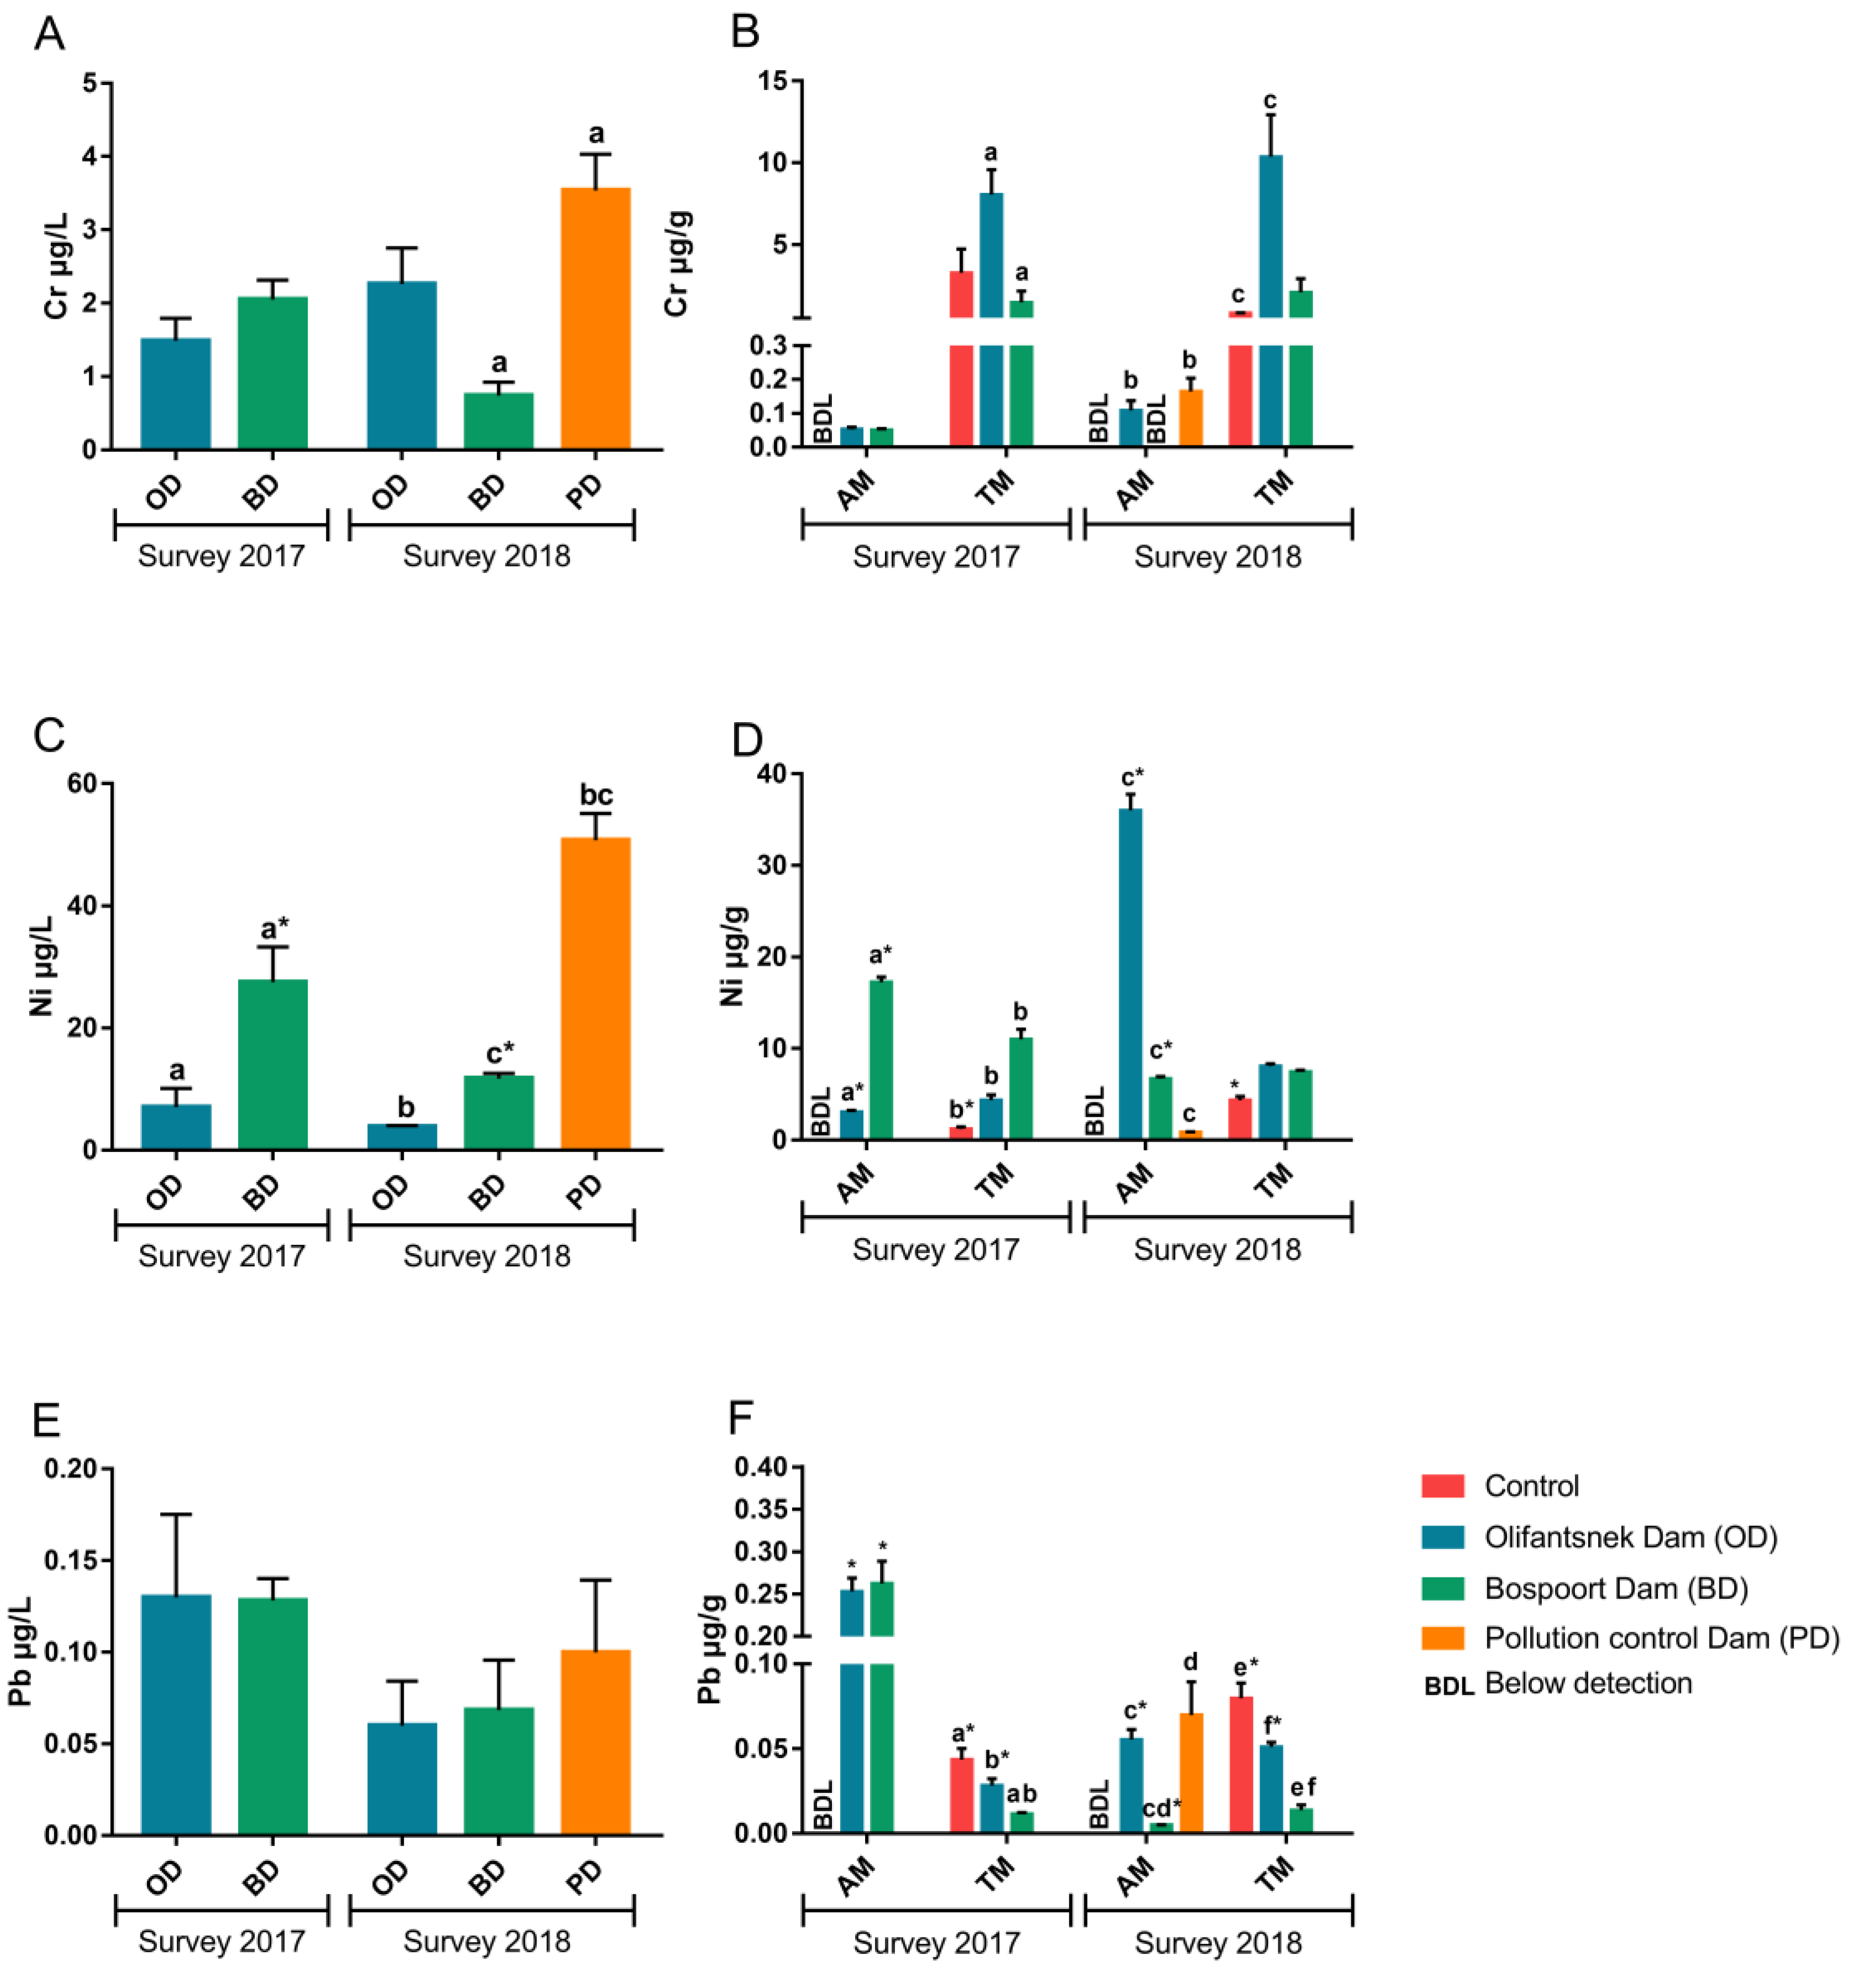
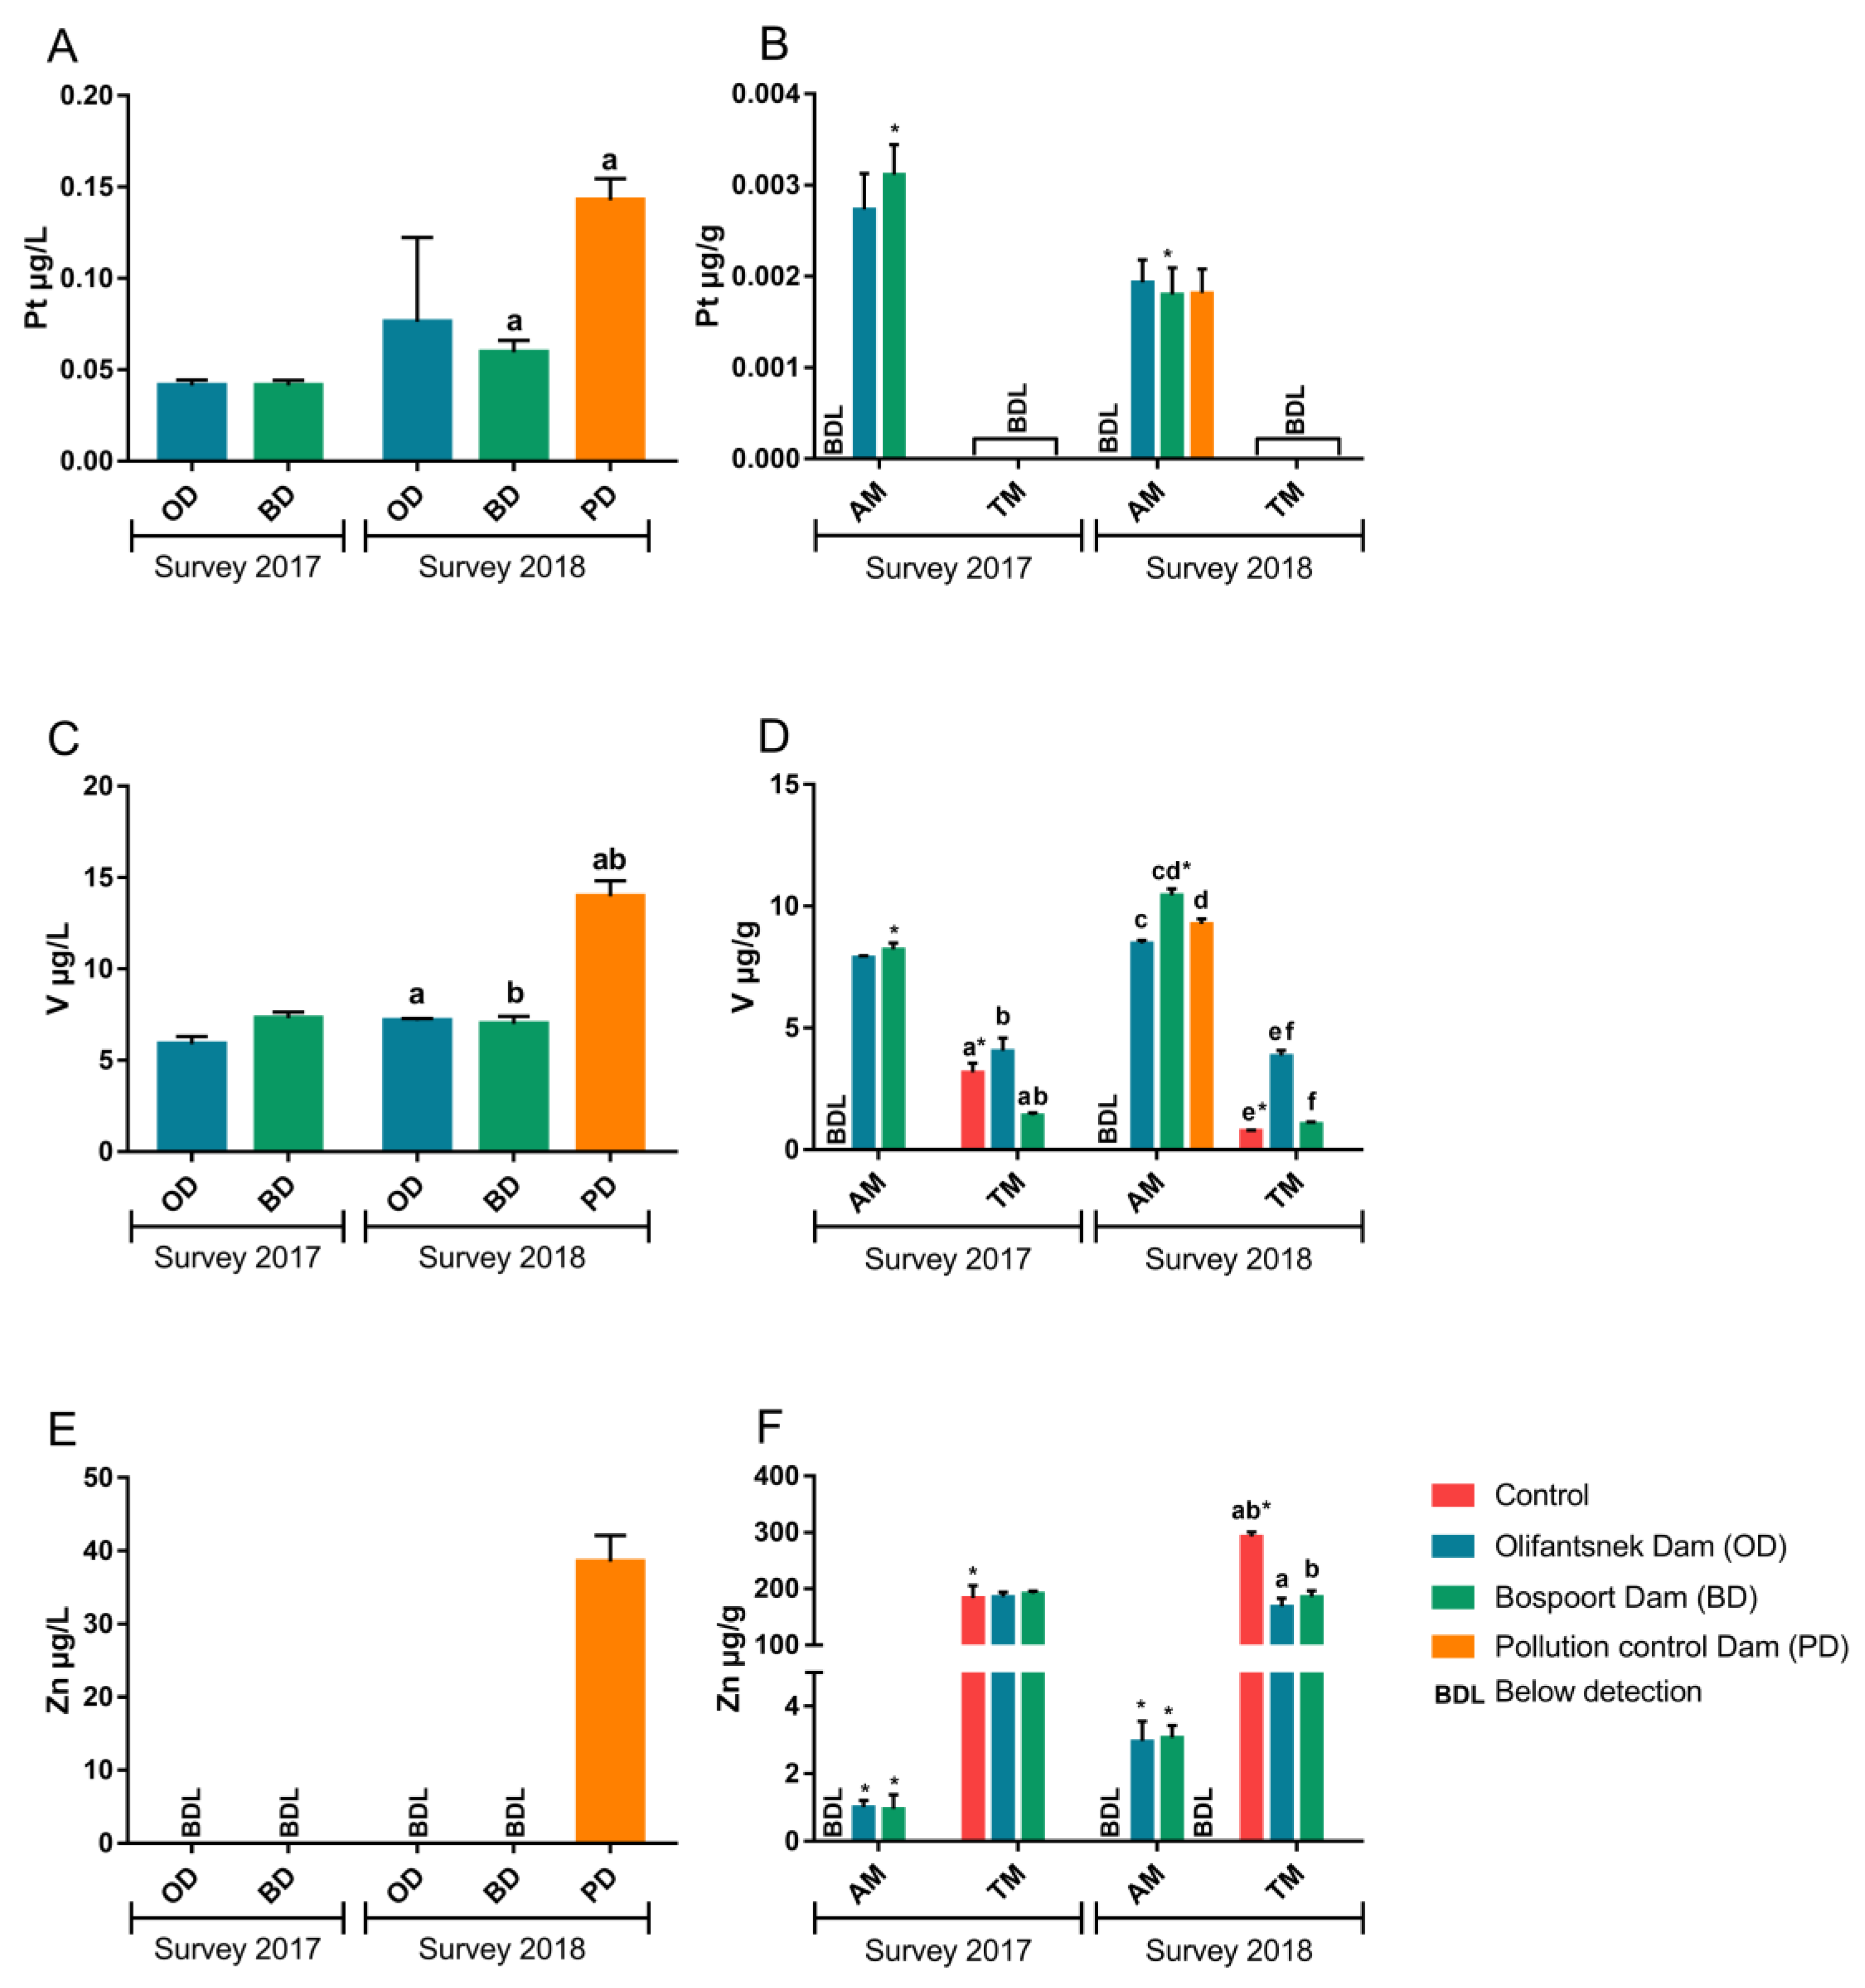
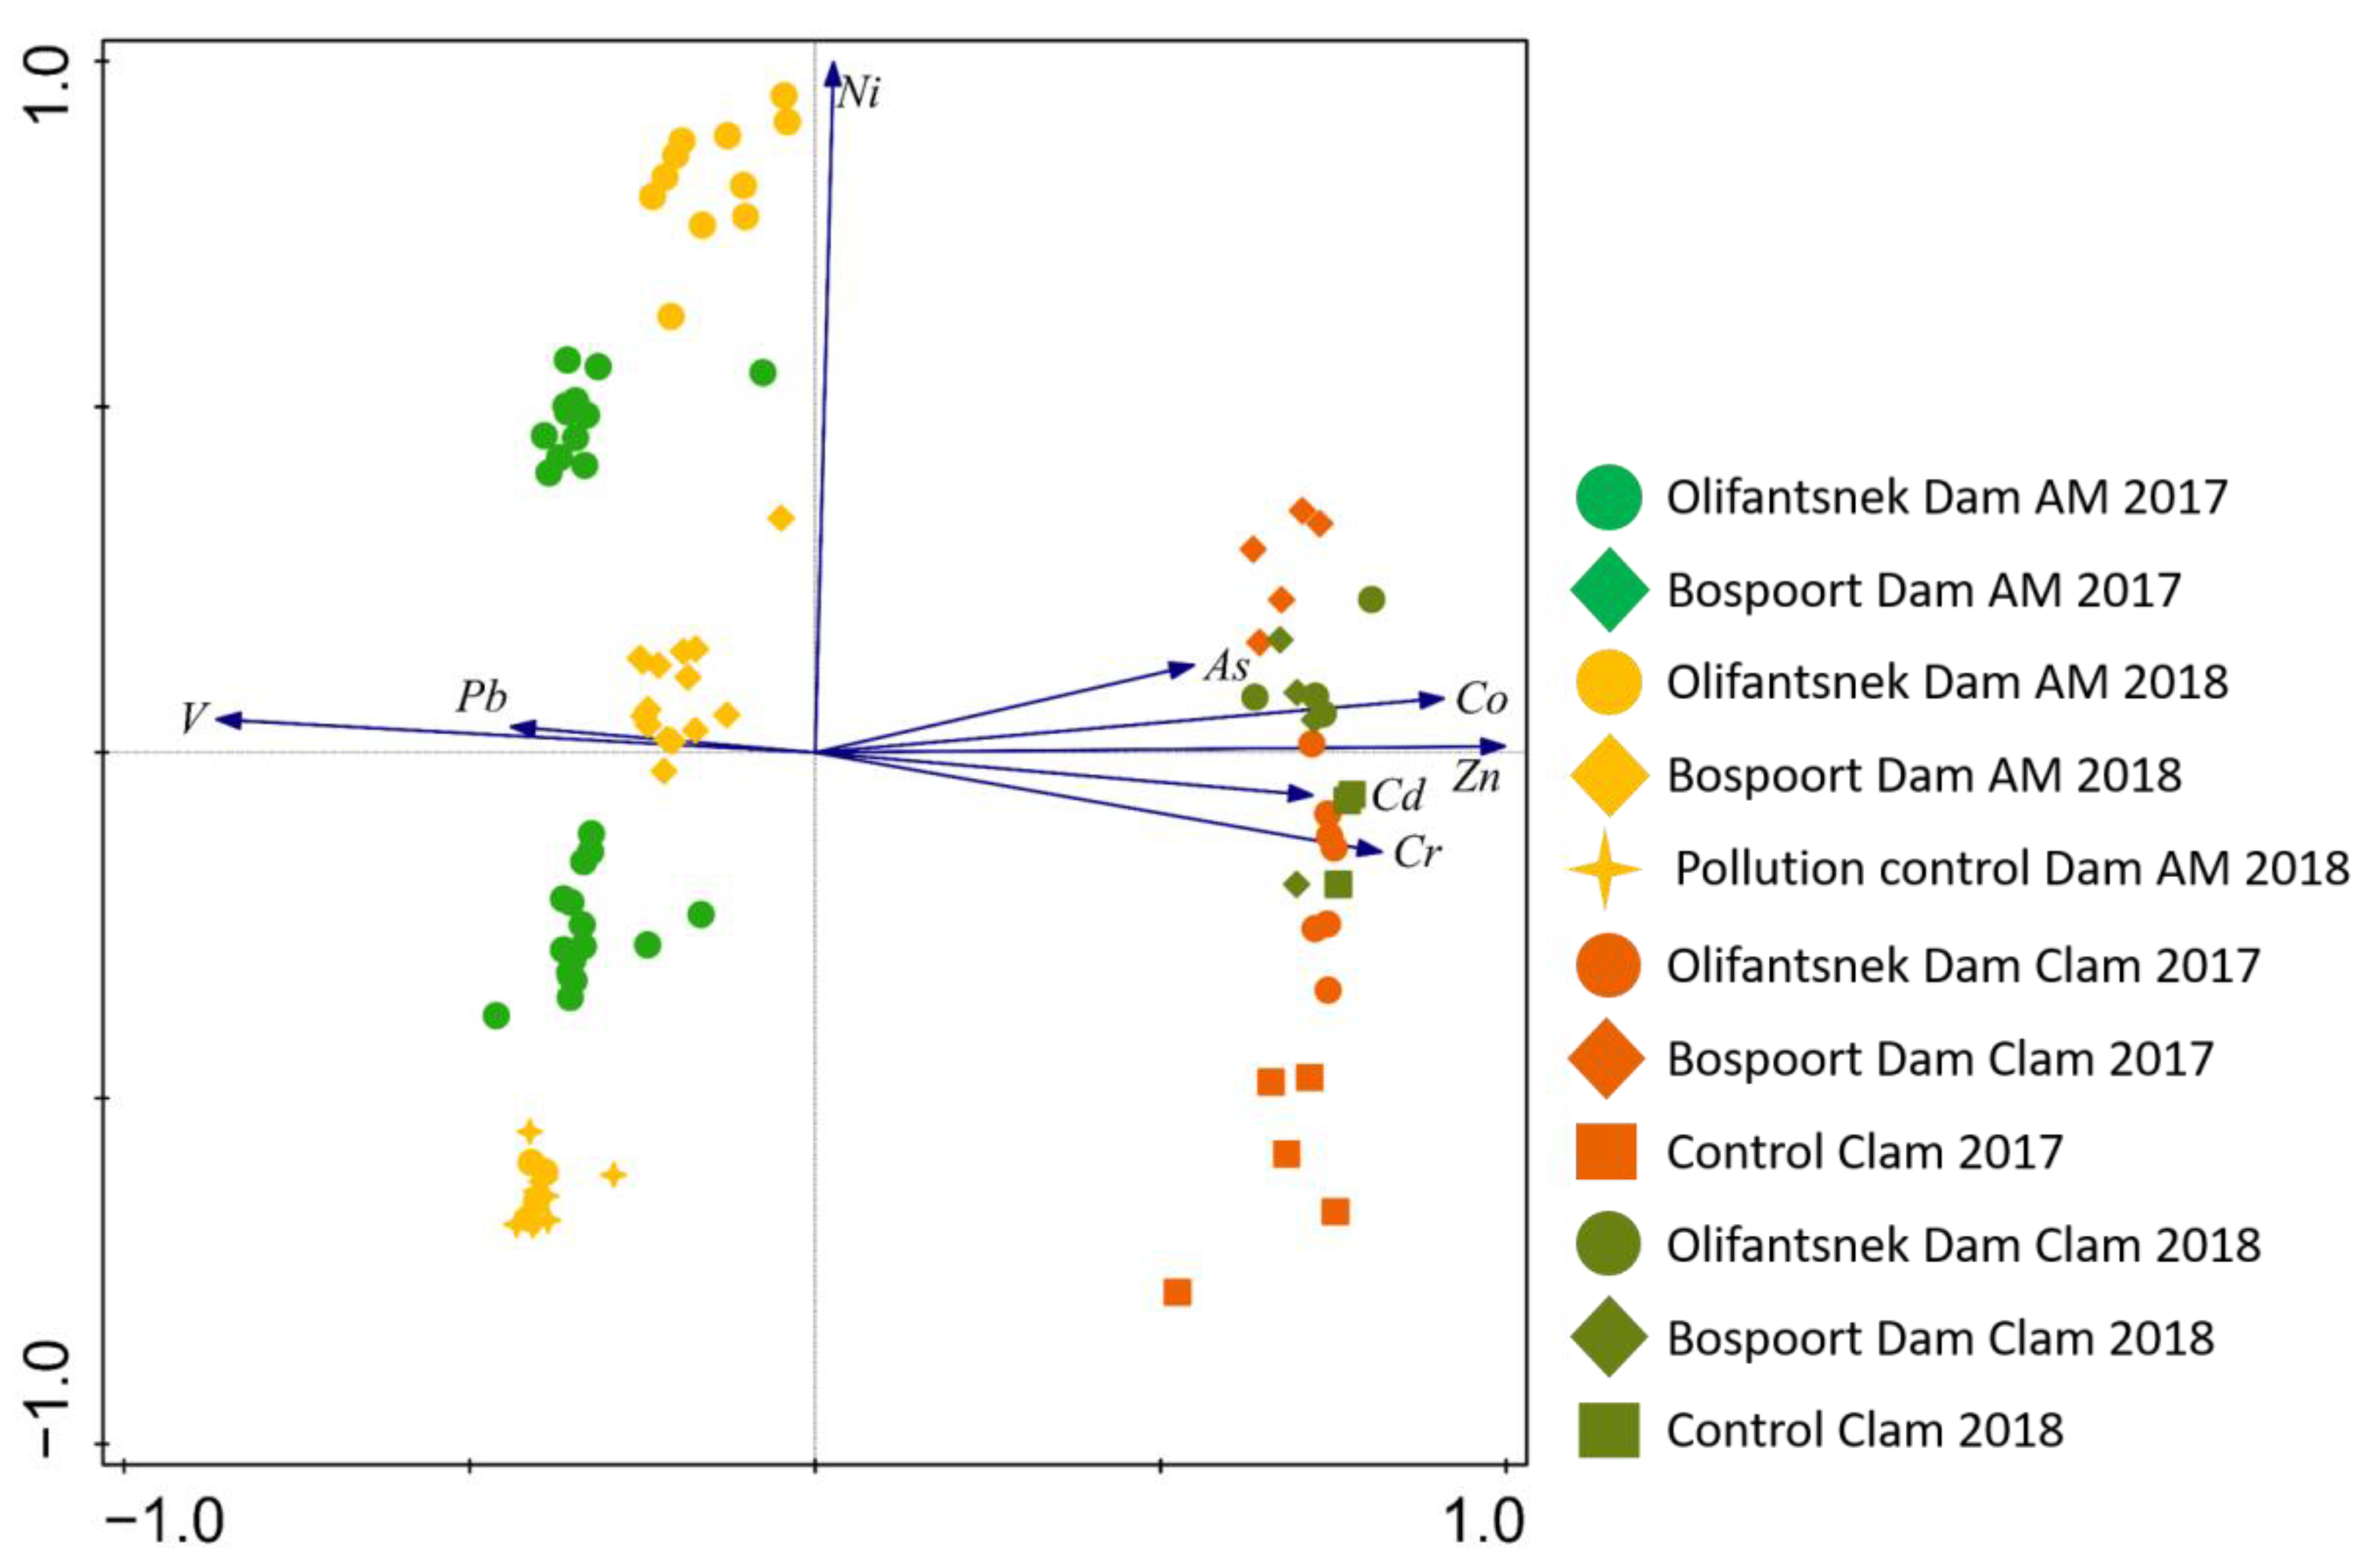
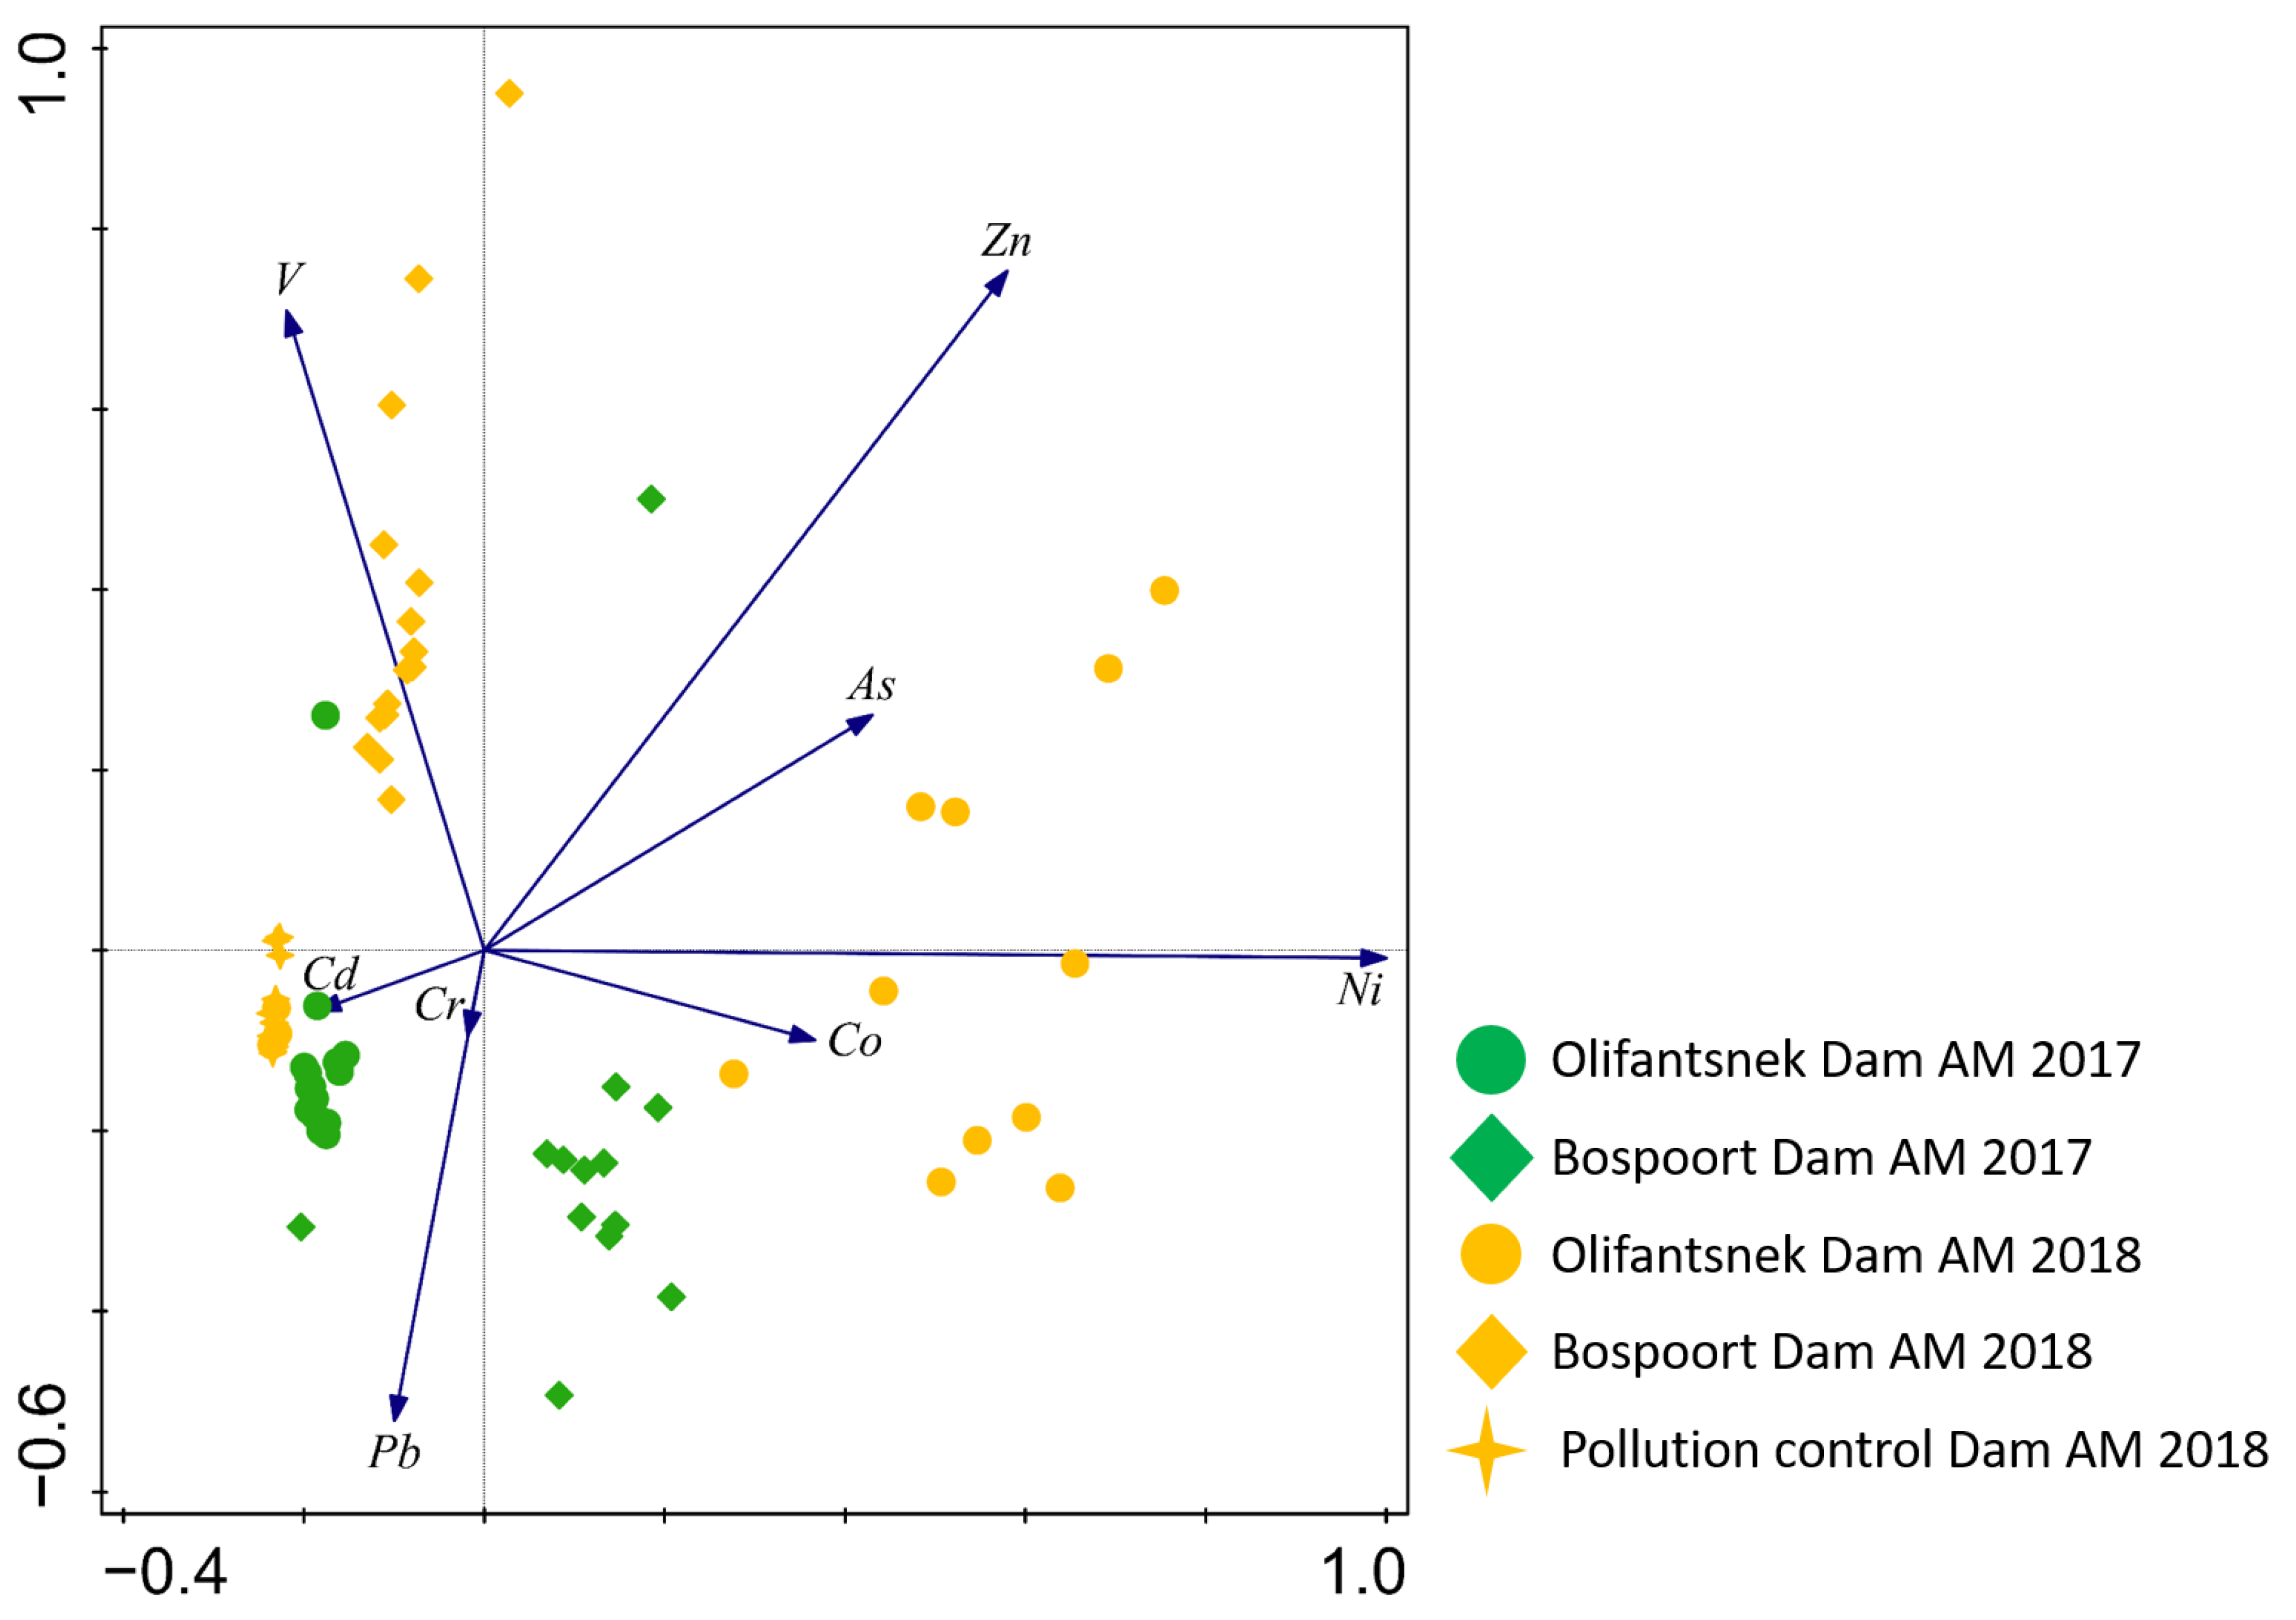
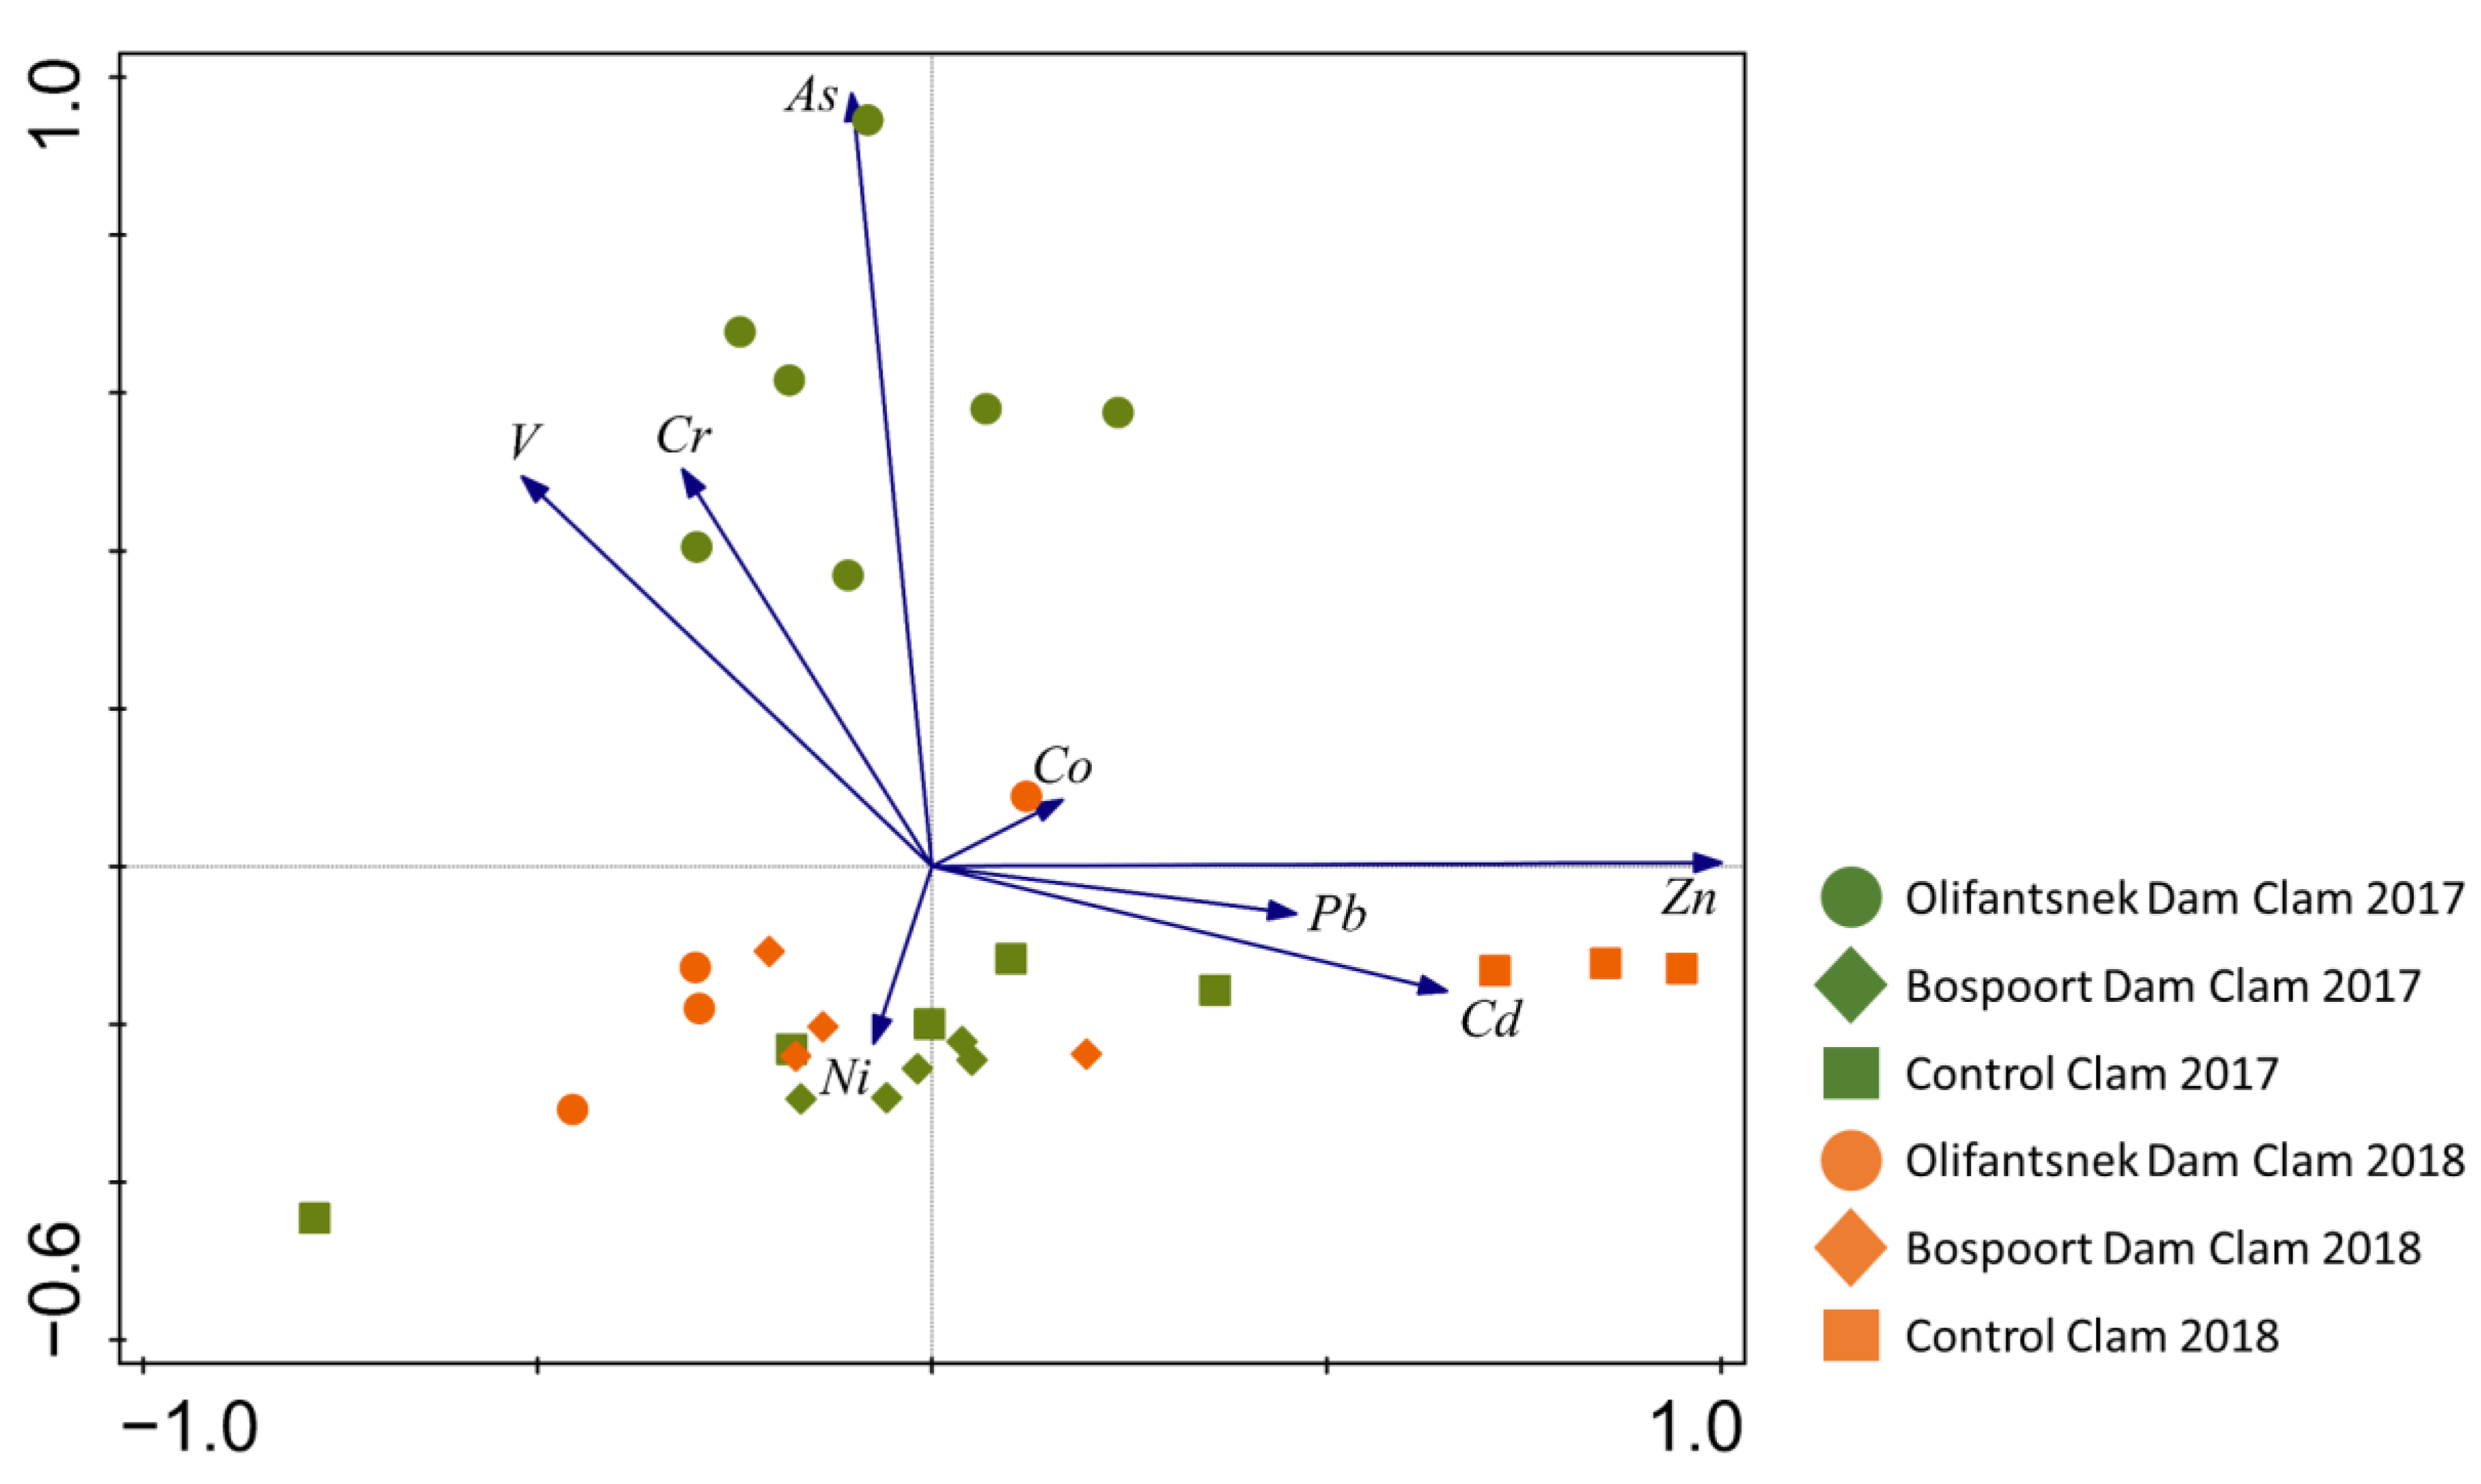
Normal distribution of data was checked using the Kolmogorov-Smirnov test with a Dallal-Wilkinson-Lilliefor P-value. For element analyses in water samples of different sites, two-way ANOVAs were performed, which were followed by Tukey’s multiple comparison test. For element analyses of both the AMs and transplanted clams, the data were log-transformed to compare all data sets since not all data passed normality. For statistical analyses, all samples that were below the detection limit were set to the detection limit divided by two [24]. A two-way ANOVA was performed to determine significant differences between surveys and sites for the AMs and transplanted clams. Thereafter, Tukey’s multi-comparisons test was performed. Statistical significance was set at p < 0.05 for all comparisons. Principal component analyses (PCA) were conducted using Canoco 5 showing the grouping of AMs and transplanted clams based on the similarity of element concentrations at the different sites and surveys.

3. Results

The water quality parameters, i.e., pH, electrical conductivity (EC), total dissolved solids (TDS), temperature (Temp), and dissolved oxygen (DO) concentrations showed differences between sampling sites and survey years, respectively (Table 2). The temperature for the first survey was cooler than during the second survey, which influences the DO concentrations. During the second survey, the DO concentration was less than during the first survey. In both surveys, the Bospoort Dam had lower DO concentrations than the Olifantsnek Dam. The EC and TDS values differed significantly between the three sites. Bospoort Dam had significantly higher EC and TDS values than Olifantsnek Dam, whereas the pollution control dam showed the highest values. The pH was relatively stable throughout both surveys.
The concentrations of the different elements in the water of the three sampling sites showed different patterns (Figure 4, Figure 5 and Figure 6, left). The element concentrations in the water of the two impoundments, Olifantsnek Dam and Bospoort Dam, revealed no significant differences in a specific survey except for Ni in the first survey, where the water of Bospoort Dam contained significantly higher concentrations. However, in the second survey, the water of the pollution control dam contained significantly higher As, Co, Ni, V, and Zn concentrations than the other impoundments and significantly higher Cr and Pt concentrations when compared to only the Bospoort Dam.
Concentrations measured in the control AMs were below detection limits (Table 1) for all elements. Therefore, the element concentrations measured in the field-deployed AMs are attributed to accumulation from the ambient environment during the exposure period. In the first survey, the Co and Ni concentrations of the AMs from Bospoort Dam were significantly higher when compared to the Olifantsnek Dam. In the second survey, the AMs of the Olifantsnek Dam contained significantly higher Cr, Ni, and Pb concentrations, but significantly lower V concentrations when compared to Bospoort Dam. The AMs from the pollution control dam in the second survey contained similar As, Cd, and Pt concentrations, but significantly lower Co, Ni, and Zn concentrations when compared to the other impoundments. There were significant differences in the Cr concentrations of the AMs decreasing in the following order: pollution control dam > Olifantsnek Dam > Bospoort Dam.
The element concentrations in the transplanted clams showed a heterogeneous picture (Figure 4, Figure 5 and Figure 6, right). The concentrations of Cd, Pb, Pt, and Zn in the transplanted clams of all three sampling sites and both surveys did not exceed the respective concentrations of the controls. Significantly higher concentrations occurred only for As and Ni (survey 2017), when compared to the control, as well as for Cr and V (survey 2018) in the clams of Olifantsnek Dam. However, for some elements, the transplanted clams contained lower concentrations as compared to the control, as seen for Cd and Zn (survey 2018) in both impoundments as well as for Pb (both surveys) and V (survey 2017) in Bospoort Dam. The Pt concentrations in all of the clams were below the detection limit. Unfortunately, no comparison can be made between the transplanted clams of the impoundments and the pollution control dam since all of the organisms died during the exposure period.
Thus, the AMs and transplanted clams accumulated different elements from the two impoundments, including Olifantsnek Dam and Bospoort Dam, in different patterns. This can be seen by the clear dissimilarity between the AMs and transplanted clams on the PCA (Figure 7). The AMs correlate strongly with Pb and V, while the transplanted clams correlate with Cd, Cr, Co, Zn, and As. The groupings of element accumulation in the AMs indicated site-specific and survey-specific patterns, while the temporal and spatial groups were less clear for the clams.
The PCA also indicated some groupings and correlations within the AMs (Figure 8). The AMs from the Olifantsnek Dam in 2017 and the pollution control dam in 2018 correlated strongly with Cd, while there was a strong correlation of the AMs with Pb and Pt in both impoundments in 2017. Olifantsnek Dam correlated with As, Co, and Ni, Bospoort Dam correlated with V, and the pollution control dam correlated with Cd in 2018. The grouping of the AMs of the three impoundments of the survey in 2018 indicated spatial differences.
Within the transplanted clams, the PCA revealed groupings and correlations, which were different from the AM results (Figure 9). The bioaccumulation patterns of the clams from the Olifantsnek Dam in 2017 were distinctly different from all other clams and correlated strongly with As, Cr, and V. Additionally, the clams from Bospoort Dam correlated strongly with Ni. Furthermore, the control clams in 2018 showed a strong correlation with Cd, Pb, and Zn.

4. Discussion

Point and diffuse source pollution from mining and production activities are recognized as an important source of contamination in the environment [16]. Platinum group elements are mined from primary deposits where they are associated with other elements such as Cu and Ni [16]. Elevated concentrations of PGE and other mining-associated elements have been reported in the vicinity of mining areas [2]. Analyses of road dust samples from four highly populated cities in South Africa demonstrated that Rustenburg had the most elevated Pt concentrations associated with mining and production activities [16]. The Hex River, which flows through Rustenburg, drains one of the most important mining areas in the western limb of the Bushveld Igneous Complex [2]. Rustenburg is located in a large basin, which forms part of the Bushveld Igneous Complex, where the ore mainly consists of PGEs. In addition to the PGEs and chromite, the ore contains deposits of gold and sulphides of nickel, copper, and iron [17].

4.1. Metals in Water

Olifantsnek Dam is geographically separated from the mining area in Rustenburg, while the Bospoort Dam is located in the vicinity of many informal settlements as well as many of the mines found in this area [17]. The element concentrations in the water showed that Bospoort Dam was slightly more polluted than the Olifantsnek Dam. The Hex River flows in a northerly direction through all the industrial and mining areas [2]. Consequently, wastes from these activities, which is discharged into the environment, will end up in the Hex River, where Bospoort Dam acts as a sink by accumulating the discharged elements. Since both of these impoundments are located in an area that contains geologically-rich deposits, it is assumed that some elements will occur naturally in high concentrations in both impoundments [2,25].
According to the weather data of the Rustenburg region, there was almost no rain during the first survey [26]. This resulted in very low flow to no flow in the river between the two impoundments during the first survey. The rainfall and ensuing run-off were much greater and more variable during the second survey in 2018. This is also reflected in the far greater variation in physic-chemical parameters. This is supported by Prathumratana et al. [27] who showed that rainfall and associated run-off influences variations in site-specific water quality.
The increase in element concentrations measured in Bospoort Dam compared to Olifantsnek Dam can be linked to a local point source located along the course of the Hex River and not from run-off from the greater catchment. Bospoort Dam contained slightly higher Cd, Co, and Ni concentrations than the Olifantsnek Dam. In general, element concentrations in the water of the Bospoort Dam were higher when compared to the Olifantsnek Dam. The significant difference in metal concentrations from the two impoundments at the end of the first survey can be attributed to the change in season, where there was almost no rainfall during this period. During this period, metal concentrations within the water became more concentrated due to low inflow and outflow of the impoundment and water evaporation.
The water data indicated that almost all of the analysed elements were present in concentrations below South Africa’s target water quality range (see supplement data Table S2), for both aquatic ecosystems and domestic use [28,29]. However, the Zn concentrations in the pollution control dam were above the Target Water Quality Range (TWQR) (2 µg/L) for aquatic ecosystems. The concentrations found in the pollution control dam were above the acute effect value (36 µg/L) [29].
The pollution control dam from the mine contained significantly higher As, Co, Cr, Ni, Pt, V, and Zn concentrations than the other two impoundments. Pollution control dams are generally constructed to collect the sludge containing the residues rejected from the ore, to allow solids to settle and to let the liquid phase evaporate [17]. The main environmental risk of such pollution control dams is the possibility that the wall of the dam comes apart and the sludge flows over the mining areas, farmlands, and roads and into aquatic ecosystems [17]. Furthermore, the pollution control dam can be overflown during heavy rain so that over-spilling water containing soluble contaminants and re-mobilized particles can enter the nearby aquatic system. Therefore, it is important to control the element concentrations within these dams. The pollution control dam of the present study is located near the river, which facilitates an entry of contaminants into the Hex River system.
South Africa is a mineral resource-rich region and, consequently, metal and metalloid concentrations are elevated in rivers that drain through mining regions. The Olifants River is generally regarded as the most metal-enriched system in South Africa. Studies by Gerber et al. recorded average concentrations of 0.75 µg/L As, 7.41 µg/L Cd, 5.26 µg/L Co, 4.24 µg/L Cr, 1.43 µg/L Ni, 4.74 µg/L Pb, and 2.68 µg/L Zn [30]. In this case, Cd concentrations were orders of magnitude higher than the values in the present study. Additionally, the highest Cr concentrations measured in the Olifants River were approximately double than those measured in the Olifantsnek Dam and the Bospoort Dam. However, the Ni concentrations were 3, 13, and 35 times higher in the Olifantsnek Dam, the Bospoort Dam, and the pollution control dam, respectively. In addition, the Zn concentrations in the water of the pollution control dam of the present study were 14 times higher than in the study by Gerber et al. [30].
For the water of the Marico River system, which is one of the least impacted systems in a mining region in South Africa [31], levels of 0.858 ± 0.1912 µg/L As, <0.0001 µg/L Cd, 0.693 ± 0.056 µg/L Co, 5.9 ± 0.154 µg/L Cr, 7.158 ± 0.586 µg/L Ni, 0.009 ± 0.007 µg/L Pb, and 2.275 ± 1.33 µg/L Zn were reported. The aqueous As concentrations in the Olifantsnek Dam and the Bospoort Dam were similar. The Co concentration was even lower when compared to the Marico River. The pollution control dam, however, contained 2-times and 4-times the concentrations of As and Co, respectively, which was found within the Marico River. However, the As, Co, Ni, and Zn concentrations in the water of the pollution control dam significantly exceeded the respective concentrations in the two other impoundments as well as in the Marico River system, which indicated that these elements were derived from the nearby mines. In contrast, although the mining activities near Rustenburg include Cr mining, the Cr concentrations within the impoundments and the pollution control dam were lower than those found in the Marico River. A different picture shows the aqueous Cd and Pb concentrations, which were higher at all three sites of the present study. Higher Cd and Pb concentrations observed upstream of the mining and other human activities may be the result of the geogenic input from the natural geology [2].
In recent decades, the demand and consumption of platinum group elements, especially in the automobile catalytic converter production, has continuously increased, which resulted in increasing anthropogenic emissions of these metals worldwide [32]. In general, the water solubility of PGE from road dust as well as their biological availability decreased in the order Pd > Pt > Rh [32,33]. Studies on Pt concentrations in the water of rivers without a PGE mining impact recorded levels between 0.006–2.6 ng/L [34,35,36,37]. In the present study, the concentrations found within the two impoundments were considerably higher and ranged between 41.5–76.2 ng/L. The water of the pollution control dam contained Pt concentrations (145 ng/L), which were three times higher than the highest concentration found in the two impoundments. This clearly indicates the entry of Pt from the mining activities into the aquatic ecosystem.

4.2. Transplanted Organisms

In the present study, C. fluminalis africana was used for active monitoring of metal and metalloid contaminations. Significantly higher concentrations when compared to the control occurred only for As, Cr, Ni, and V, but not for all sampling sites and surveys, respectively. The pre-exposure of the transplanted organisms from a presumed non-contaminated reference site could have resulted in high background levels so that additional bioaccumulation due to the active biomonitoring is not detectable or depressed. In a study by Ruchter and Sures, Corbicula sp. were analysed to determine the influence of road runoff near Karlsruhe, Germany [38]. Reference Corbicula sp. were analysed to determine background levels of Cd, Cr, Ni, Pb, Pt, and Zn in the organisms before the inlet [38]. These concentrations were much lower than the concentrations measured in the control group in this study except Pb. They were able to detect Pt concentrations. Furthermore, the effects of upswelling and the change in habitat of the transplanted clams can affect the outcome of active biomonitoring studies [7]. The transplanted clams contained higher As, Cd, Co, Cr, and Zn concentrations. The Olifantsnek Dam in 2017 was the only group that was distinctly different.
In studies that make use of transplanted organisms, it is difficult to compare the results to data found in the literature. Nevertheless, when comparing the bioaccumulation by the clams with aquatic snails that were transplanted to a gold mining area [13], both transplanted organisms show similar Co concentrations. However, the As, Cr, Ni, V, and Zn concentrations of the clams were lower when compared with the snails, while the Cd and Pb concentrations were much higher [13].
The higher water temperatures recorded in Bospoort Dam may have resulted in the metabolism of the transplanted clams being higher than in the Olifantsnek Dam since increased temperature and the subsequent metabolism results in aquatic organisms accumulating more metals [39].
When PGEs from road dust accumulated in the soft tissue of bivalves, e.g., Dreissena polymorpha, the bioaccumulation of metals decreased in the following order: Cu > Cd > Ag > Pd > Pb > Sb > Fe > Pt > Rh [33]. Platinum concentrations in bivalves sampled from different freshwater ecosystems ranged between 0.00001–0.0013 µg/g [33,38,40], whereas the Pt levels of the transplanted clams from the present study were all under the detection limit of 0.0009 µg/g.
The bioaccumulation in the transplanted clams did not correlate with the exposure concentration in the water column. Claassens et al. [13] made use of transplanted organisms at different localities within the Koekemoer Spruit, South Africa, and found no correlation between the concentrations in the transplanted organisms and the ambient water. This may be explained by the fact that the indicator organisms integrate the pollutants over the whole exposure period, while water samples only indicate the exposure concentration at the time of sampling. Many factors can influence the bioaccumulation of metals in field studies, i.e., among others’ seasonality, the bioavailability of metals, and toxicokinetic processes in the indicator organism [41]. Bivalves are filter feeders. Therefore, both the dissolved metal fraction and the particle-bound metals play a crucial role in the metal bioaccumulation.

4.3. Artificial Mussels

The present study reported the uptake of Pt in AMs for the first time. Although the AMs are only able to take up dissolved metals, the availability of Pt could only be shown by the use of the AMs and not by the transplanted clams, where the Pt levels were below the detection limit.
Artificial mussels have successfully been used as monitoring tools for metal bioaccumulation in the aquatic environment [11,13,20,23,42]. Many of these studies endorse the use of AMs during biomonitoring studies since they are not affected by water quality conditions that would greatly effect a bioindicator. Artificial mussels that were used for monitoring aquatic systems in a gold mining region [13] accumulated higher concentrations of Cr, Co, Cd, Pb, V, and Zn than in the present study. In contrast, AMs exposed to potentially less impacted sites along the Nyl River, Limpopo, South Africa [20] contained either similar or higher element concentrations when compared to this study.
The element concentrations in the water indicated that Bospoort Dam contained higher concentrations than those found in the Olifantsnek Dam. During the first survey, the AMs in the two impoundments had similar concentrations, while, in the second survey, there were some significant differences between the sampling sites. However, these results (AMs) did not indicate a specific site has higher concentrations. Other field studies using AMs also show variations in data.
The AMs contained higher Pb and V concentrations when compared to the transplanted clams. The element accumulation in the AMs indicated site-specific and survey-specific patterns.

4.4. Comparison of Artificial Mussels and Transplanted Clams

For almost all of the elements, in the present study, the transplanted clams contained significantly higher concentrations than the AMs. According to Wu et al. [10], the AM and any bioindicator species bioaccumulate different metal fractions during field exposures. Due to the assembly of the AM, large molecules and particle-bound metals are not able to cross the polyacrylamide gel barrier, which acts as a surrogate on the double lipid layer of a cell membrane. However, metals and metalloids occur in the environment in different complexes or may be attached to particles. Many factors can influence their speciation. In contrast to AMs, the transplanted clams can ingest different metals and metalloids from the food that is available within the environment and living organisms can regulate their concentrations by toxicokinetic processes [10]. The characteristics of the permeability of the AM and the binding capacity of the Chelex beads can also have an influence [10,23]. A combination of all of these factors may explain the differences in the accumulation capacity between AM and TM.
The partitioning (dissolve vs. particulate bound) and speciation of metals are dependent on several chemical and physical properties, such as pH, temperature, and the presence of ligands and particulates [43]. Morquecho and Pitt [43] filtered several stormwater samples to determine the colloidal bound metals, metals bound to ligands, and the ionic/dissolved fraction. After adding Chelex beads to the filtered samples, they found that the ionic form of the metals had bound to the beads, while the particle-bound metals remained in the solution. More than 90%, 80%, 80%, and 30% of the filtered Zn, Cr, Pb, and Cd were in an ionic form, respectively [43]. These percentages reflect the amount of each metal that was bound to the Chelex beads during the filtering process. Therefore, in the present study, the elements being accumulated by the AMs belong to the dissolved fraction, whereas the TMs accumulated the dissolved and particulate bound fraction. This may explain the different accumulation patterns for the AMs and TMs.
Claassens et al. [13] found that the AMs accumulated higher concentrations of Cd, Pb, V, and Zn than the transplanted organisms. This is partly in accordance with the present study showing that the AMs accumulated higher concentrations of Pb, Pt, and V. However, a direct comparison of the concentrations in the AM and TM is problematic since, for the AMs, the concentrations were calculated by dividing the total mass of the element that has bound to the Chelex beads by the mass (200 mg) of the Chelex beads. Assuming that not all binding sites of the Chelex beads were saturated, a lower mass of Chelex beads would have resulted in the same amount of metal uptake but a higher calculated concentration in the AM. Thus, it should be considered in future studies that the total mass is a more reliable measure for the uptake by the AM than the concentration. However, as in all studies on AMs published so far, 200 mg of Chelex beads were used since a comparison between these studies is possible by using the concentrations.
Other studies demonstrated that AMs and transplanted organisms accumulate metals in similar patterns but at different concentrations [13,23]. In contrast, in the present study, the accumulation patterns of the AMs indicated significant accumulation when compared to the initial concentrations, whereas, for the transplanted clams for most elements, no clear bioaccumulation was found during the biomonitoring period. Thus, since the AMs have low initial background levels, they can indicate the bioaccumulation of low element concentrations in biomonitoring studies.
During the second survey, over six weeks, there was a massive water hyacinth (Eichhornia crassipes) bloom that occurred in the Bospoort Dam. These water plants covered more than 50% of the impoundment at the end of the exposure period. The water hyacinth can accumulate high levels of metals from solutions such as Cd, Co, Cr, Cu, Ni, Pb, V, and Zn [44,45] and the PGEs Pt, Pd, Os, Ru, Ir, and Rh [42]. When considering the biomass of the water hyacinth in the dam, the plants likely had reduced the metal concentrations in the water. This may explain why the concentrations in the water of Bospoort Dam were not significantly different from those found in the Olifantsnek Dam during the second survey whereas the concentrations during the first survey were much higher in the Bospoort Dam.
During the second survey, transplanted clams and AMs were deployed in the pollution control dam on the mine ground, but none of the transplanted clams survived. It is presumed that the transplanted clams died due to a layer of oil on the water surface and decreasing water levels than due to very high metal concentrations. This shows the practicability of the AMs in ecosystems where adverse environmental conditions affect the survival of living organisms. However, it is possible that the oil layer obstructed the metals from diffusing through the gel layers. The metal and metalloid concentrations within the water from the pollution control dam were significantly higher than the impoundments. However, the AMs did not indicate this difference.

5. Conclusions

Different bioindicator species have different accumulation strategies. They are affected by many factors within the environment and can regulate internal metal concentrations through physiological processes [13,15]. The difference between the results of the AMs and the transplanted clams should not be seen as a shortcoming and was expected based on results from previous studies. The present study demonstrated that the transplanted clams and AMs accumulated different metals at different concentrations, which could be attributed to the accumulation of metals in different forms (dissolved or particle-bound) showing different biological availabilities. The AMs and transplanted clams accumulated similar As concentrations, while the AMs preferentially accumulated Pb, Ni, Pt, and V. The AMs are a promising tool for metals and metalloids occurring at low environmental concentrations close to the analytical detection limit and when organisms for the transplantation during active biomonitoring approaches already show high background levels. Metals can be found in various forms within the aquatic environment. The semi-permeable membrane of the AM permits the bioavailable metal ions to pass through and bind to the Chelex beads. Some metal ions have a stronger binding affinity toward the Chelex beads, where these ions may compete for binding sites within the AMs. For that reason, it is possible that some metals can be more abundant in the environment but the AMs will not be able to indicate these concentrations due to competition by other metals. Nonetheless, in this study, it was shown that the AM successfully accumulated Pt and all the other metals that were studied. Traditional bioindicator bivalves were more successful in indicating exposure to metals such as Cd, Co, Cr, and Zn. Thus, the combination of AMs and living bioaccumulation indicator organisms will provide a holistic assessment of metal and metalloid exposure in aquatic environments.

Supplementary Materials

The following are available online at https://www.mdpi.com/2073-4441/12/1/32/s1. Table S1: Metal concentrations measured in the transplanted clams (TM), artificial mussels (AM), and water from two surveys conducted in Bospoort Dam, Olifantsnek Dam, and the pollution control dam. The control refers to concentrations in reference clams that were maintained in the laboratory. Concentrations are presented in μg/g dry mass for transplanted clams, μg/g Chelex for the AMs, and water concentrations in µg/L (mean ± SEM, ND = below detection limit, the * indicates significant difference from the control group in a specific survey). Table S2: Target water quality ranges for domestic use and aquatic ecosystems as set by the Department of Water Affairs and Forestry.

Author Contributions

Conceptualization, B.S. and N.J.S. Formal analysis, M.L., M.N., S.Z., B.S., and N.J.S. Investigation, M.L. Methodology, M.L. and V.W. Resources, B.S. and N.J.S. Supervision, V.W. and S.Z. Validation, V.W., M.N., and S.Z. Writing-original draft, M.L. Writing-review & editing, V.W., S.Z., B.S., and N.J.S. All authors have read and agreed to the published version of the manuscript.

Funding

The financial assistance of the NRF (National Research Foundation, South Africa), [UID108852] towards this research is hereby acknowledged. This work is based on the research and researchers supported by the National Research Foundation (NRF) of South Africa (NRF Project GERM160623173784; grant 105875; NJ Smit, PI) and BMBF/PT-DLR (Federal Ministry of Education and Research, German, grant 01DG17022; B Sures, PI). Opinions, findings, conclusions, and recommendations expressed in this publication are that of the authors, and the NRF and BMBF/PT-DLR accept no liability whatsoever in this regard.

Acknowledgments

This is the contribution number 360 of the North-West University (NWU) Water Research Group. The assistance of Anja Greyling, Hannes Erasmus, and Rian Pienaar is hereby acknowledged for their help during sampling trips and the map of the study site.

Conflicts of Interest

The authors declare no conflict of interest.

References

  1. Rauch, S.; Peucker-Ehrenbrink, B. Sources of Platinum Group Elements in the Environment. In Platinum Metals in the Environmen; Zereini, F., Wiseman, C.L.S., Eds.; Springer: Heidelberg, Germany, 2015; Volume 1, pp. 3–17. [Google Scholar]
  2. Almécija, C.; Cobelo-García, A.; Wepener, V.; Prego, R. Platinum group elements in stream sediments of mining zones: The Hex River (Bushveld Igneous Complex, South Africa). J. Afr. Earth Sci. 2017, 129, 934–943. [Google Scholar] [CrossRef] [Green Version]
  3. Erasmus, J.; Malherbe, W.; Zimmermann, S.; Lorenz, A.; Nachev, M.; Wepener, V.; Sures, B.; Smit, N. Metal accumulation in riverine macroinvertebrates from a platinum mining region. Sci. Total Environ. 2019, 703, 134738. [Google Scholar] [CrossRef] [PubMed]
  4. Zhou, Q.; Zhang, J.; Fu, J.; Shi, J.; Jiang, G. Biomonitoring: An appealing tool for assessment of metal pollution in the aquatic ecosystem. Anal. Chim. Acta 2008, 606, 135–150. [Google Scholar] [CrossRef]
  5. Gupta, S.K.; Singh, J. Evaluation of mollusc as sensitive indicator of heavy metal pollution in aquatic system: A review. IIOAB J. 2011, 2, 49–57. [Google Scholar]
  6. Farris, J.L.; Van Hassel, J.H. Freshwater Bivalve Ecotoxicology; CRC Press: Boca Raton, FL, USA, 2006. [Google Scholar] [CrossRef]
  7. Wepener, V. Application of active biomonitoring within an integrated water resources management framework in South Africa. S. Afr. J. Sci. 2008, 104, 367–373. [Google Scholar]
  8. Giarratano, E.; Duarte, C.A.; Amin, O.A. Biomarkers and heavy metal bioaccumulation in mussels transplanted to coastal waters of the Beagle Channel. Ecotoxicol. Environ. Saf. 2010, 73, 270–279. [Google Scholar] [CrossRef]
  9. Wu, R.S.S.; Lau, T.C. Polymer-ligands: A novel chemical device for monitoring heavy metals in the aquatic environment? Mar. Pollut. Bull. 1996, 32, 391–396. [Google Scholar] [CrossRef]
  10. Wu, R.S.S.; Lau, T.C.; Fung, W.K.M.; Ko, P.H.; Leung, K.M.Y. An ‘artificial mussel’ for monitoring heavy metals in marine environments. Environ. Pollut. 2007, 145, 104–110. [Google Scholar] [CrossRef]
  11. Kibria, G.; Lau, T.; Wu, R. Innovative ‘Artificial Mussels’ technology for assessing spatial and temporal distribution of metals in Goulburn–Murray catchments waterways, Victoria, Australia: Effects of climate variability (dry vs. wet years). Environ. Int. 2012, 50, 38–46. [Google Scholar] [CrossRef]
  12. Hossain, M.M.; Kibria, G.; Nugegoda, D.; Lau, T.; Wu, R. A Training Manual for Assessing Pollution (trace/heavy metals) in Rivers, Estuaries and Coastal waters-Using Innovative “Artificial Mussel (AM) Technology”—Bangladesh Model. Research collaboration between Scientists of the IMSF, University of Chittagong, Bangladesh, RMIT University, Australia, the City University of Hong Kong, and the University of Hong Kong; FAO: Rome, Italy, 2015; Volume 1, pp. 1–24. [Google Scholar] [CrossRef]
  13. Claassens, L.; Dahms, S.; Van Vuren, J.; Greenfield, R. Artificial mussels as indicators of metal pollution in freshwater systems: A field evaluation in the Koekemoer Spruit, South Africa. Ecol. Indic. 2016, 60, 940–946. [Google Scholar] [CrossRef]
  14. Leung, K.M.Y.; Furness, R.W.; Svavarsson, J.; Lau, T.C.; Wu, R.S.S. Field validation, in Scotland and Iceland, of the artificial mussel for monitoring trace metals in temperate seas. Mar. Pollut. Bull. 2008, 57, 790–800. [Google Scholar] [CrossRef] [PubMed]
  15. Degger, N.; Wepener, V.; Richardson, B.J.; Wu, R.S.S. Application of artificial mussels (AMs) under South African marine conditions: A validation study. Mar. Pollut. Bull. 2011, 63, 108–118. [Google Scholar] [CrossRef] [PubMed]
  16. Rauch, S.; Fatoki, O.S. Impact of Platinum Group Element Emissions from Mining and Production Activities. In Platinum Metals in the Environment; Zereini, F., Wiseman, C.L.S., Eds.; Springer: Heidelberg, Germany, 2015; pp. 19–29. [Google Scholar] [CrossRef]
  17. Wittmann, G.; Förstner, U. Heavy metal enrichment in mine drainage: 1. The Rustenburg platinum mining area. Science 1976, 72, 242–246. [Google Scholar]
  18. Roux, H. Status of the yellowfish populations & River health Programme in NW Province. In Proceedings of the 15th Yellowfish Working Group Conference, Mpumalanga, South Africa, 18–20 February 2011. [Google Scholar]
  19. Mogakabe, D.; Van Ginkel, C. The Water Quality of the Bospoort Dam; Internal Report No. N/0000/00/DEQ/0108; Department of Water Affairs and Forestry: Pretoria, South Africa, 2008.
  20. Dahms-Verster, S.; Baker, N.; Greenfield, R. A multivariate examination of ‘artificial mussels’ in conjunction with spot water tests in freshwater ecosystems. Environ. Monit. Assess. 2018, 190, 427. [Google Scholar] [CrossRef] [PubMed]
  21. Brand, S.J.; Erasmus, J.H.; Labuschagne, M.; Grabner, D.; Nachev, M.; Zimmermann, S.; Wepener, V.; Smit, N.; Sures, B. Bioaccumulation and metal-associated biomarker responses in a freshwater mussel, Dreissena polymorpha, following short-term platinum exposure. Environ. Pollut. 2019, 246, 69–78. [Google Scholar] [CrossRef]
  22. Zimmermann, S.; Menzel, C.M.; Berner, Z.; Eckhardt, J.-D.; Stüben, D.; Alt, F.; Messerschmidt, J.; Taraschewski, H.; Sures, B. Trace analysis of platinum in biological samples: A comparison between sector field ICP-MS and adsorptive cathodic stripping voltammetry following different digestion procedures. Anal. Chim. Acta 2001, 439, 203–209. [Google Scholar] [CrossRef]
  23. Degger, N.; Chiu, J.M.Y.; Po, B.H.K.; Tse, A.C.K.; Zheng, G.J.; Zhao, D.-M.; Xu, D.; Cheng, Y.-S.; Wang, X.-H.; Liu, W.-H.; et al. Heavy metal contamination along the China coastline: A comprehensive study using Artificial Mussels and native mussels. Environ. Manag. 2016, 180, 238–246. [Google Scholar] [CrossRef]
  24. Kushner, E. On determining the statistical parameters for pollution concentration from a truncated data set. Atmos. Environ. 1976, 10, 975–979. [Google Scholar] [CrossRef]
  25. Cawthorn, R.G. The platinum group element deposits of the Bushveld Complex in South Africa. Platin. Met. Rev. 2010, 54, 205–215. [Google Scholar] [CrossRef]
  26. Thorsen, S. Past Weather in Rustenburg, South Africa—May 2017. Available online: https://www.timeanddate.com/weather/south-africa/rustenburg/historic?month=5&year=2017 (accessed on 1 October 2018).
  27. Prathumratana, L.; Sthiannopkao, S.; Kim, K.W. The relationship of climatic and hydrological parameters to surface water quality in the lower Mekong River. Environ. Int. 2008, 34, 860–866. [Google Scholar] [CrossRef]
  28. Department of Water Affairs and Forestry (DWAF). South African Water Quality Guidelines (Second Edition). Volume 1: Domestic Use; DWAF: Pretoria, South Africa, 1996.
  29. Department of Water Affairs and Forestry (DWAF). South African Water Quality Guidelines. Volume 7: Aquatic Ecosystems; DWAF: Pretoria, South Africa, 1996.
  30. Gerber, R.; Smit, N.J.; van Vuren, J.H.; Wepener, V. Metal concentrations in Hydrocynus vittatus (Castelnau 1861) populations from a premier conservation area: Relationships with environmental concentrations. Ecotoxicol. Environ. Saf. 2016, 129, 91–102. [Google Scholar] [CrossRef] [PubMed]
  31. Kemp, M.; Wepener, V.; de Kock, K.; Wolmarans, C. Metallothionein Induction as Indicator of Low Level Metal Exposure to Aquatic Macroinvertebrates from a Relatively Unimpacted River System in South Africa. Bull. Environ. Contam. Toxicol. 2017, 99, 662–667. [Google Scholar] [CrossRef] [PubMed]
  32. Hoppstock, K.; Sures, B. Platinum-Group Metals. In Elements and Their Compounds in the Environment: Occurrence, Analysis and Biological Relevance, 2nd ed.; Merian, E., Anke, M., Ihnat, M., Stoeppler, M., Eds.; WILEY-VCH Verlag GMBH & Co. KGaA: Weinheim, Germany, 2004; pp. 1047–1086. [Google Scholar]
  33. Zimmermann, S.; Alt, F.; Messerschmidt, J.; von Bohlen, A.; Taraschewski, H.; Sures, B. Biological availability of traffic-related platinum-group elements (palladium, platinum, and rhodium) and other metals to the zebra mussel (Dreissena polymorpha) in water containing road dust. Environ. Toxicol. Chem. 2002, 21, 2713–2718. [Google Scholar] [CrossRef] [PubMed]
  34. Hoppstock, K.; Alt, F. Voltammetric determination of ultratrace platinum and rhodium in biological and environmental samples. In Anthropogenic Platinum-Group Element Emissions; Fathi, Z., Friedrich, A., Eds.; Springer: Heidelberg, Germany, 2000; pp. 145–152. [Google Scholar] [CrossRef]
  35. Moldovan, M.; Gomez, M.M.; Palacios, M.A. On-line preconcentration of palladium on alumina microcolumns and determination in urban waters by inductively coupled plasma mass spectrometry. Anal. Chim. Acta 2003, 478, 209–217. [Google Scholar] [CrossRef]
  36. Monticelli, D.; Carugati, G.; Castelletti, A.; Recchia, S.; Dossi, C. Design and development of a low cost, high performance UV digester prototype: Application to the determination of trace elements by stripping voltammetry. Microchemical 2010, 95, 158–163. [Google Scholar] [CrossRef]
  37. Cobelo-García, A.; López-Sánchez, D.E.; Almécija, C.; Santos-Echeandía, J. Behavior of platinum during estuarine mixing (Pontevedra Ria, NW Iberian Peninsula). Mar. Chem. 2013, 150, 11–18. [Google Scholar] [CrossRef] [Green Version]
  38. Ruchter, N.; Sures, B. Distribution of platinum and other traffic related metals in sediments and clams (Corbicula sp.). Water Res. 2015, 70, 313–324. [Google Scholar] [CrossRef]
  39. van Heerden, D.; van Rensburg, P.J.; Nikinmaa, M.; Vosloo, A. Gill damage, metallothionein gene expression and metal accumulation in Tilapia sparrmanii from selected field sites at Rustenburg and Potchefstroom, South Africa. Afr. J. Aquat. Sci. 2006, 31, 89–98. [Google Scholar] [CrossRef]
  40. Ruchter, N.; Zimmermann, S.; Sures, B. Field studies on PGE in aquatic ecosystems. In Platinum Metals in the Environment; Zereini, F., Wiseman, C.L.S., Eds.; Springer: Heidelberg, Germany, 2015; pp. 351–360. [Google Scholar] [CrossRef]
  41. Greenfield, R.; Brink, K.; Degger, N.; Wepener, V. The usefulness of transplantation studies in monitoring of metals in the marine environment: South African experience. Mar. Pollut. Bull. 2014, 85, 566–573. [Google Scholar] [CrossRef]
  42. Genç, T.O.; Po, B.H.; Yılmaz, F.; Lau, T.C.; Wu, R.S.; Chiu, J.M. Differences in metal profiles revealed by native mussels and artificial mussels in Sarıçay Stream, Turkey: Implications for pollution monitoring. Mar. Freshw. Res. 2018, 69, 1372–1378. [Google Scholar] [CrossRef]
  43. Morquecho, R.; Pitt, R. Stormwater heavy metal particulate associations. Proc. Water Environ. Fed. 2003, 2003, 774–803. [Google Scholar] [CrossRef]
  44. Nor, Y.M. The absorption of metal ions by Eichhornia crassipes. Chem. Speciat. Bioavailab. 1990, 2, 85–91. [Google Scholar] [CrossRef] [Green Version]
  45. Shirinpur-Valadi, A.; Hatamzadeh, A.; Sedaghathoor, S. Study of the accumulation of contaminants by Cyperus alternifolius, Lemna minor, Eichhornia crassipes, and Canna generalis in some contaminated aquatic environments. Environ. Sci. Pollut. Res. Int. 2019, 26, 21340–21350. [Google Scholar] [CrossRef] [PubMed]
Figure 1. Map of the Hex River System in Rustenburg, North West Province, South Africa indicating the position of the sampling sites.
Water 12 00032 g001
Figure 2. The artificial mussel design (Wu et al., 2007).
Water 12 00032 g002
Figure 3. Steps taken to assemble the plastic baskets for the artificial mussels and transplanted clams. (A) Storage of artificial mussels before deployment. (B) Plastic baskets in which the artificial mussels and transplanted clams were deployed. (C) The AMs were secured to the plastic basket with cable ties. (D) Sediment from each site was placed in a mesh bag in the bottom of the basket for the transplanted clams. (E,F) Two baskets were deployed at each site. These baskets were secured together with rope and cable ties before submerging them in the water.
Water 12 00032 g003
Figure 4. Arsenic (A,B), cadmium (C,D), and cobalt (E,F) concentrations (mean ± SEM) in water (left), artificial mussels (AM) and transplanted clams (TM) (right) during the two surveys in 2017 and 2018. Concentrations are presented in μg/L for water (n = 3), μg/g Chelex for the AMs (n = 15), and μg/g dry weight for transplanted clams (n = 5). Within a survey period, bars with a common letter superscript represent significant differences between different sites for the particular indicator group. Between surveys, an asterisk (*) indicates a significant temporal difference between the specific indicator at the particular site. Significance was regarded as p < 0.05. BDL = below detection limit.
Water 12 00032 g004
Figure 5. Chromium (A,B), nickel (C,D), and lead (E,F) concentrations (mean ± SEM) in water (left), and artificial mussels (AM) and transplanted clams (TM) (right) during the two surveys in 2017 and 2018. Concentrations are presented in μg/L for water (n = 3), μg/g Chelex for the AMs (n = 15), and μg/g dry weight for transplanted clams (n = 5). Within a survey, period bars with a common letter superscript represent significant differences between different sites for the particular indicator group. Between surveys, an asterisk (*) indicates a significant temporal difference between the specific indicator at the particular site. Significance was regarded as p < 0.05. BDL = below detection limit.
Water 12 00032 g005
Figure 6. Platinum (A,B), vanadium (C,D), and zinc (E,F) concentrations (mean ± SEM) in water (left), and artificial mussels (AM) and transplanted clams (TM) (right) during the two surveys in 2017 and 2018. Concentrations are presented in μg/L for water (n = 3), μg/g Chelex for the AMs (n = 15), and μg/g dry weight for transplanted clams (n = 5). Within a survey, period bars with common letter superscript represent significant differences between different sites for the particular indicator group. Between surveys, an asterisk (*) indicates a significant temporal difference between the specific indicator at the particular site. Significance was regarded as p < 0.05. BDL = below detection limit.
Water 12 00032 g006
Figure 7. Principal component analysis (PCA) showing the grouping of AMs and transplanted clams based on the similarity of element bioaccumulation at the different sites and surveys. The ordination explains 93.7% of the total variation in the data with 79.5% on axis 1 and 14.2% on axis 2.
Water 12 00032 g007
Figure 8. PCA illustrating the grouping of AMs within the three impoundments during the two surveys based on the similarity of metal bioaccumulation at the different sites and surveys. The ordination explains 98.9% of the total variation in the data with 97.3% on axis 1 and 1.6% on axis 2.
Water 12 00032 g008
Figure 9. PCA illustrating the grouping of transplanted clams within the two impoundments during the two surveys based on the similarity of metal bioaccumulation at the different sites and surveys. The ordination explains 98.5% of the total variation in the data with 95.7% on axis 1 and 2.8% on axis 2.
Water 12 00032 g009
Table 1. Detection limits for metal concentrations analyzed in water, artificial mussels, and transplanted clams.
Metal AnalysedDetection Limit for Water (µg/L)Detection Limit for Artificial Mussels (µg/g)Detection Limit for Transplanted Clams (µg/g)
As0.2030.00560.0169
Cd0.0220.00040.0018
Co0.1120.0030.0099
Cr0.1510.0390.130
Ni0.4630.0110.0386
Pb0.02370.00030.0020
Pt0.01070.000150.0009
V0.960.0250.0798
Zn17.70.0531.48
Table 2. Water quality parameters were measured at each site during the first survey (2017) and the second survey (2018). The results are the average of parameters measured during a survey. For abbreviations, see text.
SitepHTemp (°C)EC (μS/cm)TDS (mg/L)DO (mg/L)DO (%)
Survey 2017
Olifantsnek Dam8.2119.3173.8119.810.12103.3
Bospoort Dam8.4619.45910.55709.6981.4
Survey 2018
Olifantsnek Dam8.2024.32101475.562.1
Bospoort Dam7.6528.311608192.9434.3
Pollution control dam8.0025.617751244--

