Performance Evaluation of a Tidal Current Turbine with Bidirectional Symmetrical Foils


1
School of Naval Architecture and Ocean Engineering, Harbin Institute of Technology, Weihai 264209, China
2
Department of Naval Architecture, Ocean and Marine Engineering, Strathclyde University, Glasgow G1 1XQ, UK
3
School of Mechanical Engineering, Beijing Institute of Petrochemical Technology, Beijing 102617, China
*
Authors to whom correspondence should be addressed.
Water 2020, 12(1), 22; https://doi.org/10.3390/w12010022
Submission received: 29 October 2019
/
Revised: 17 December 2019
/
Accepted: 17 December 2019
/
Published: 19 December 2019
(This article belongs to the Section Hydraulics and Hydrodynamics)
Abstract
:As one might expect, tidal currents in terms of ebb and flood tides are approximately bidirectional. A Horizontal Axial Tidal Turbine (HATT) with unidirectional foils has to be able to face the current directions in order to maximize current energy harvesting. There are two regular solutions to keep a HATT always facing the direction of the flow, which are transferred from wind turbine applications. One is to yaw the turbine around the supporting structure with a yaw mechanism. The other is to reverse the blade pitch angle through 180° with a pitch-adjusting mechanism. The above solutions are not cost-effective in marine applications due to the harsh marine environment and high cost of installation and maintenance. In order to avoid the above disadvantages, a turbine with bidirectional foils is presented in this paper. A bare turbine with bidirectional foils is characterized in that it has nearly the same energy conversion capability in both tidal current directions without using the yaw or pitch mechanism. Considering the working conditions of the bidirectional turbine in which the turbine is installed on a mono-pile, the effect of the mono-pile on the turbine’s performance is evaluated in this paper, especially when the turbine is downstream of the mono-pile. The paper was focused on the evaluation of the hydrodynamic performance of the bidirectional turbine. The hydrodynamic performance of the bare bidirectional turbine without any supporting structure was evaluated based on a steady-state computational fluid dynamics (CFD) model and model tests. Performance comparison has been made between the turbine with bidirectional foils and the turbine with NACA foils. The effect of the mono-pile on the performance of the bidirectional turbine was studied by using the steady-state and the transient CFD model. The steady-state CFD model was used to evaluate the effect of the mono-pile clearance, which is the distance between the mono-pile and the turbine on the performance of the turbine. The transient CFD model was used to determine the time-dependent characteristics of the turbine, such as time-dependent power and drag coefficients. The results show that the bare bidirectional turbine has nearly the same energy conversion capability in both tidal current directions. The performance of the bidirectional turbine is inferior to the turbine with NACA foils. At the designed tip speed ratio, the power coefficient of the turbine with NACA foils is 0.4498, which increases by 1.6% compared to the 0.4338 of the bidirectional turbine. The turbine’s performance decreases due to the introduction of the mono-pile, and the closer the turbine is to the mono-pile, the greater effect on the turbine’s performance the mono-pile has. At the designed clearance of 1.5 DS, the presence of a mono-pile decreases the peak Cp value by 1.82% and 3.17% to a value of 0.4156 and 0.4004 for the turbine located in the mono-pile upstream and downstream, respectively. The mono-pile can result in the fluctuation of the turbine’s performance. This fluctuation will detrimentally harm the life of the turbine as it will lead to increased wear and fatigue issues.
1. Introduction
With the exhaustion of traditional fossil energy sources and their harmful effect on the environment, more and more efforts have been made to search for renewable and environmentally friendly energy resources. Massive investment has been made in the renewable energy field to exploit sustainable energy resources. The conversion of kinetic energy from tidal currents has drawn a lot of attention as it can provide a regular and predictable energy resource. What is more, the seawater is more than 800 times denser than air and that makes marine current turbines more manageable in size than the wind ones [1,2].
The tidal current turbine operates in bidirectional flows. It is a problem to keep the turbine with normal (unidirectional) foils always facing the direction of flow. There are two regular solutions which are adopted from the wind turbines. One is to yaw a turbine around the supporting pile to meet the flow direction when it changes direction [3]; the other is to reverse the blade pitch angle through 180° with a pitch mechanism [4]. These solutions are workable in the field of wind turbines where the yaw or pitch mechanism is easier to install and maintain. But they are not cost-effective in marine applications due to the high costs involved in their installation and maintenance. Furthermore, the gears in both the tidal current direction matching and blade pitch changing mechanisms are vulnerable parts and easily broken, which will be very expensive to maintain.
An alternative approach to bidirectional flow instead of using yaw or pitch mechanisms is to design a turbine with bidirectional foils. A series of bidirectional horizontal axial turbine rotors was designed and optimized through a procedure similar to a propeller series, by varying the rotor’s parameters such as solidity, pitch ratio, blade number, etc., and a 43% power coefficient was achieved in the experimental test [5]. A “class” of bidirectional hydrofoil shape was designed and studied numerically [6]. The bidirectional foils were typically applied in a ducted turbine with a gravity base, such as the Lunar Energy tidal turbine [7] and HydroHelix turbine [8], and there are few publications found in the open literature of a bidirectional turbine with a mono-pile supporting structure. Henry Shiu [9] explored a bidirectional turbine with a mono-pile supporting structure. The maximum power coefficient of his bidirectional turbine is 0.416. But he did not study the effect of the mono-pile on the turbine’s performance.
Except for the above-mentioned ducted turbine with a gravity base, a horizontal axis turbine is typically installed on a mono-pile supporting structure. Therefore, it is important not only to investigate the performance of the bare turbine with bidirectional foils, but also to study the effect of the mono-pile on the flow characteristics, especially when the mono-pile is upstream of the turbine. Some researchers have studied the effect of a mono-pile on a turbine’s performance when the turbine is upstream of the mono-pile. Walker [10] explored the impact of hydrodynamic interactions between a turbine and its supporting structure on the turbine performance, as well as the hydrodynamic interactions of multiple turbines. Mason-Jones [11] tested a turbine with a diameter of 10 m to study the effect of supporting structures on the performance of a turbine, and compared it with computational fluid dynamics (CFD) results. Hua [12] suggested that a clearance, a horizontal distance between a turbine and a supporting pile, should be a minimum of one diameter of a pile when a turbine is upstream of a pile.
However, few papers have been published about the effect of the mono-pile on the turbine’s performance when the turbine is of downstream of the mono-pile. Since the bidirectional turbine has no yaw mechanism or pitching mechanism, it will be worthwhile to evaluate the effect of the mono-pile on the turbine’s performance when the turbine is downstream of the mono-pile.
When the turbine is downstream of the mono-pile, the turbine blades will pass through a shadowed area of the mono-pile, which may have significant impacts on the performance of the turbine. One possible method to reduce these impacts is to increase the clearance so as to reduce the blockage impact on the turbine. There will be an economic and physical limit to the amount of the clearance. However, this benefit can only be determined when the effect of this clearance on the performance of the turbine is known. Therefore, it is necessary to study the effect of mono-pile clearance on a turbine’s performance.
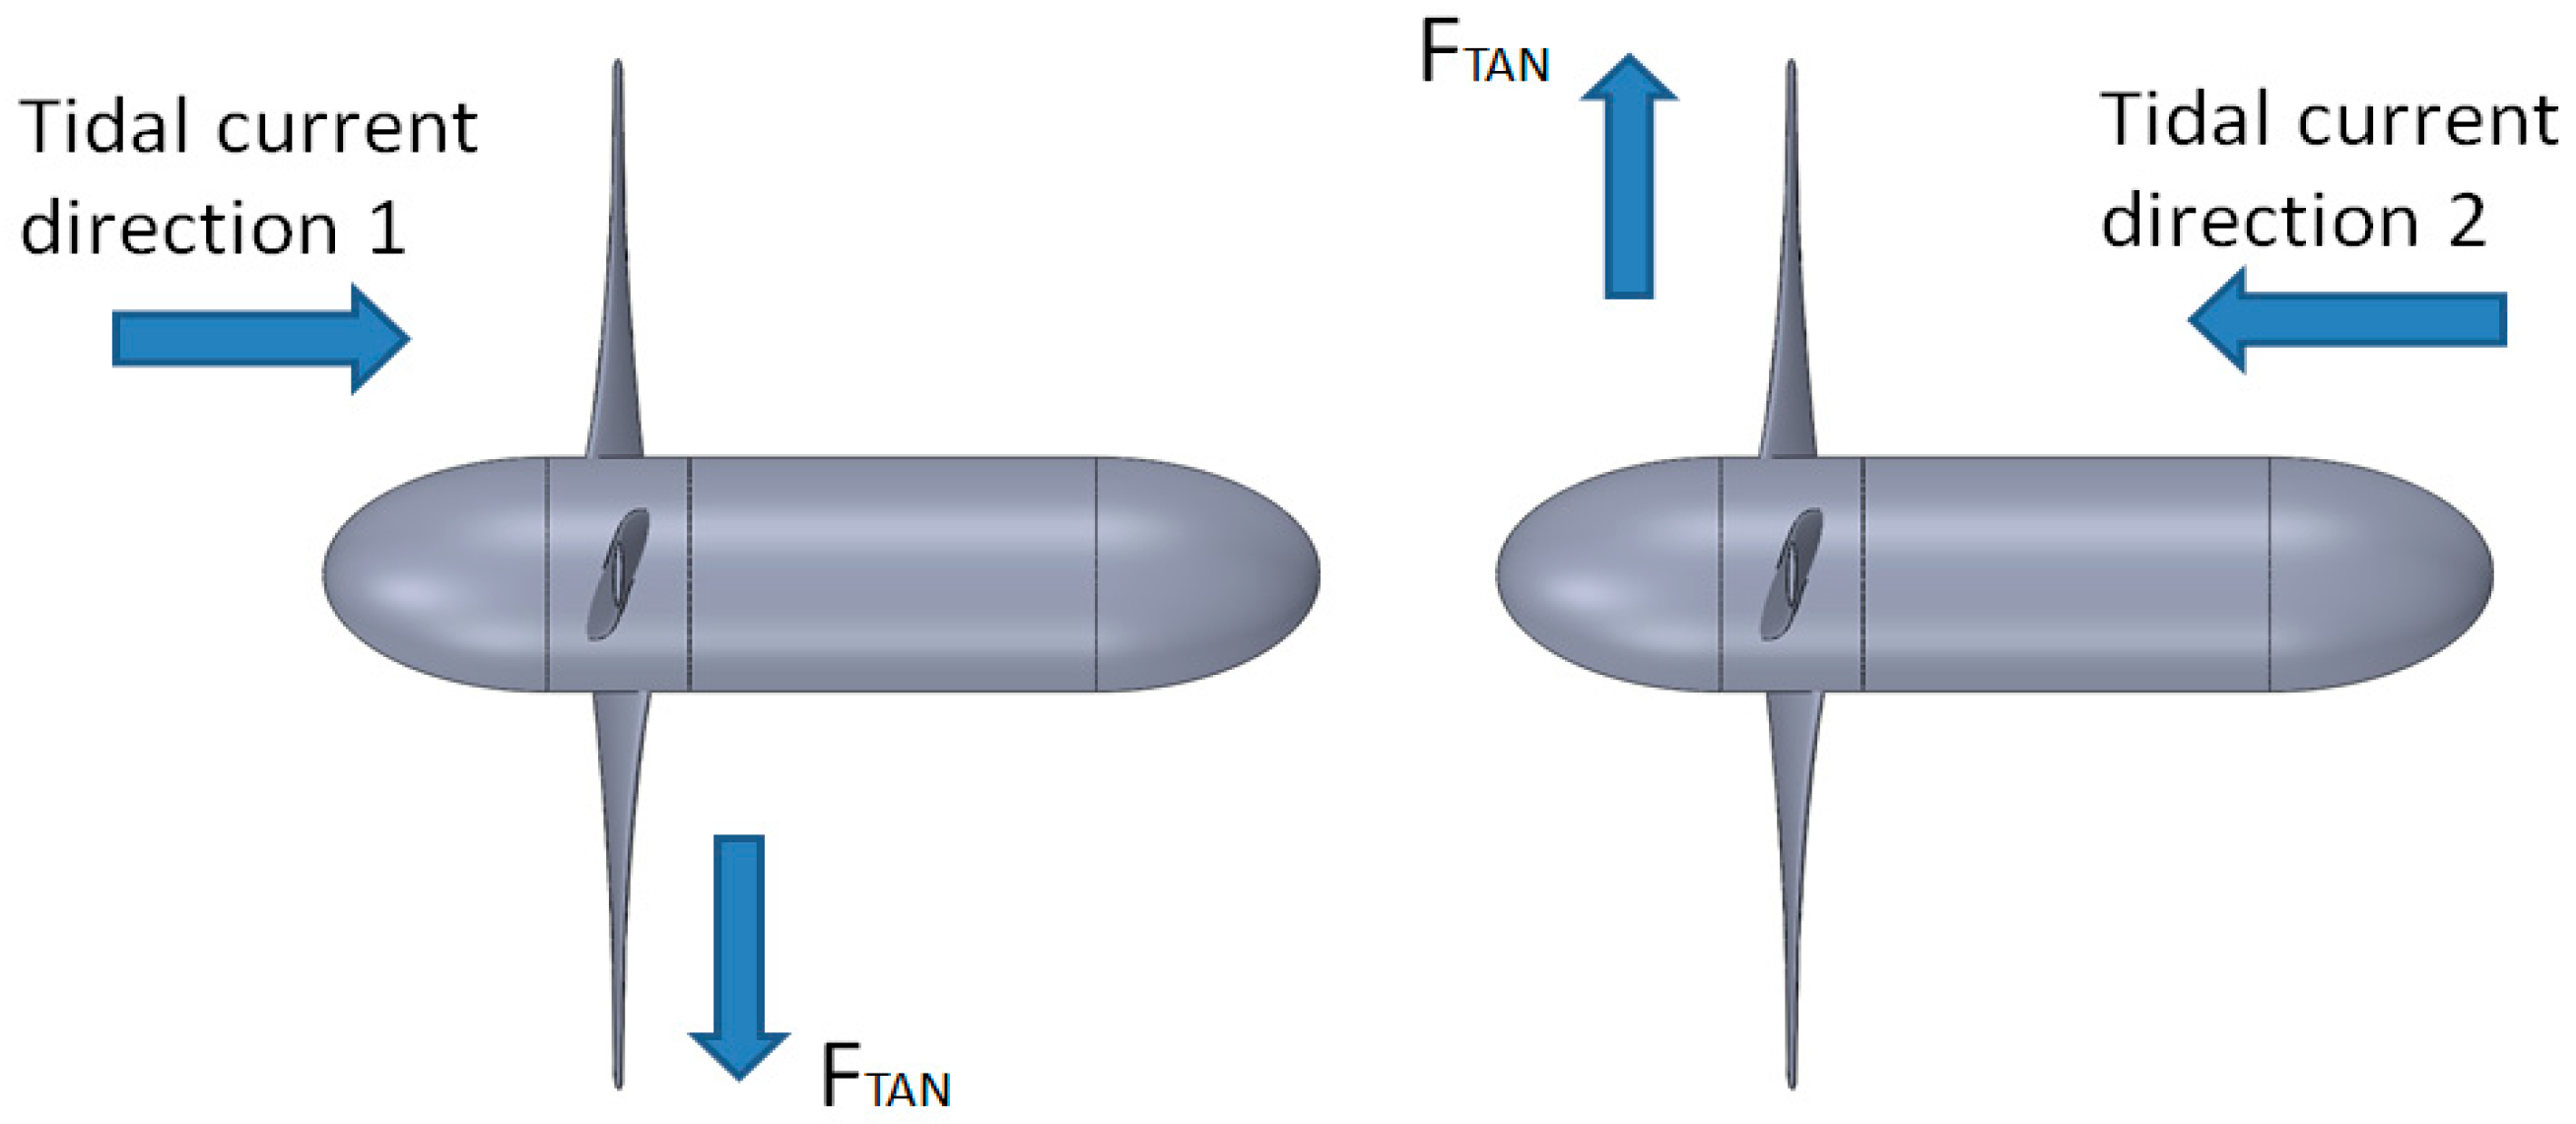
In the present paper, a bidirectional turbine was designed and validated by both numerical and experimental methods. This turbine can achieve both forward and reverse rotation, depending on whether the current comes from its front or back, as shown in Figure 1. The purpose of this paper is to evaluate the hydrodynamic performance of the bidirectional turbine in both tidal current directions, as well as the effects of the mono-pile on turbine performance. The framework is as follows: Firstly, bidirectional foils BDA 65-021 and BDA 65-012 were designed based on unidirectional foils NACA 65-021 and NACA 65-012. Then the turbine with bidirectional foils and the turbine with NACA foils were designed based on the Blade Element Momentum (BEM) theory. By using a commercial CFD code STAR-CCM+, the hydrodynamic performance of bidirectional foils, the bare bidirectional turbine and the turbine with NACA foils were evaluated. Secondly, a 300 mm diameter turbine model was manufactured and tested in the Emerson Cavitation Tunnel of Newcastle University to verify the CFD results. On this basis, finally the effect of the mono-pile on turbine’s performance was studied by using the steady-state and the transient CFD model. The steady-state CFD model was used to determine the effect of the mono-pile clearance on the turbine’s performance. The transient CFD model was used to determine the time-dependent variables for the turbine, such as time-dependent power and drag coefficients.
2. Hydrodynamic Performance of Bidirectional Foils
2.1. The Procedures to Design Bidirectional Foils
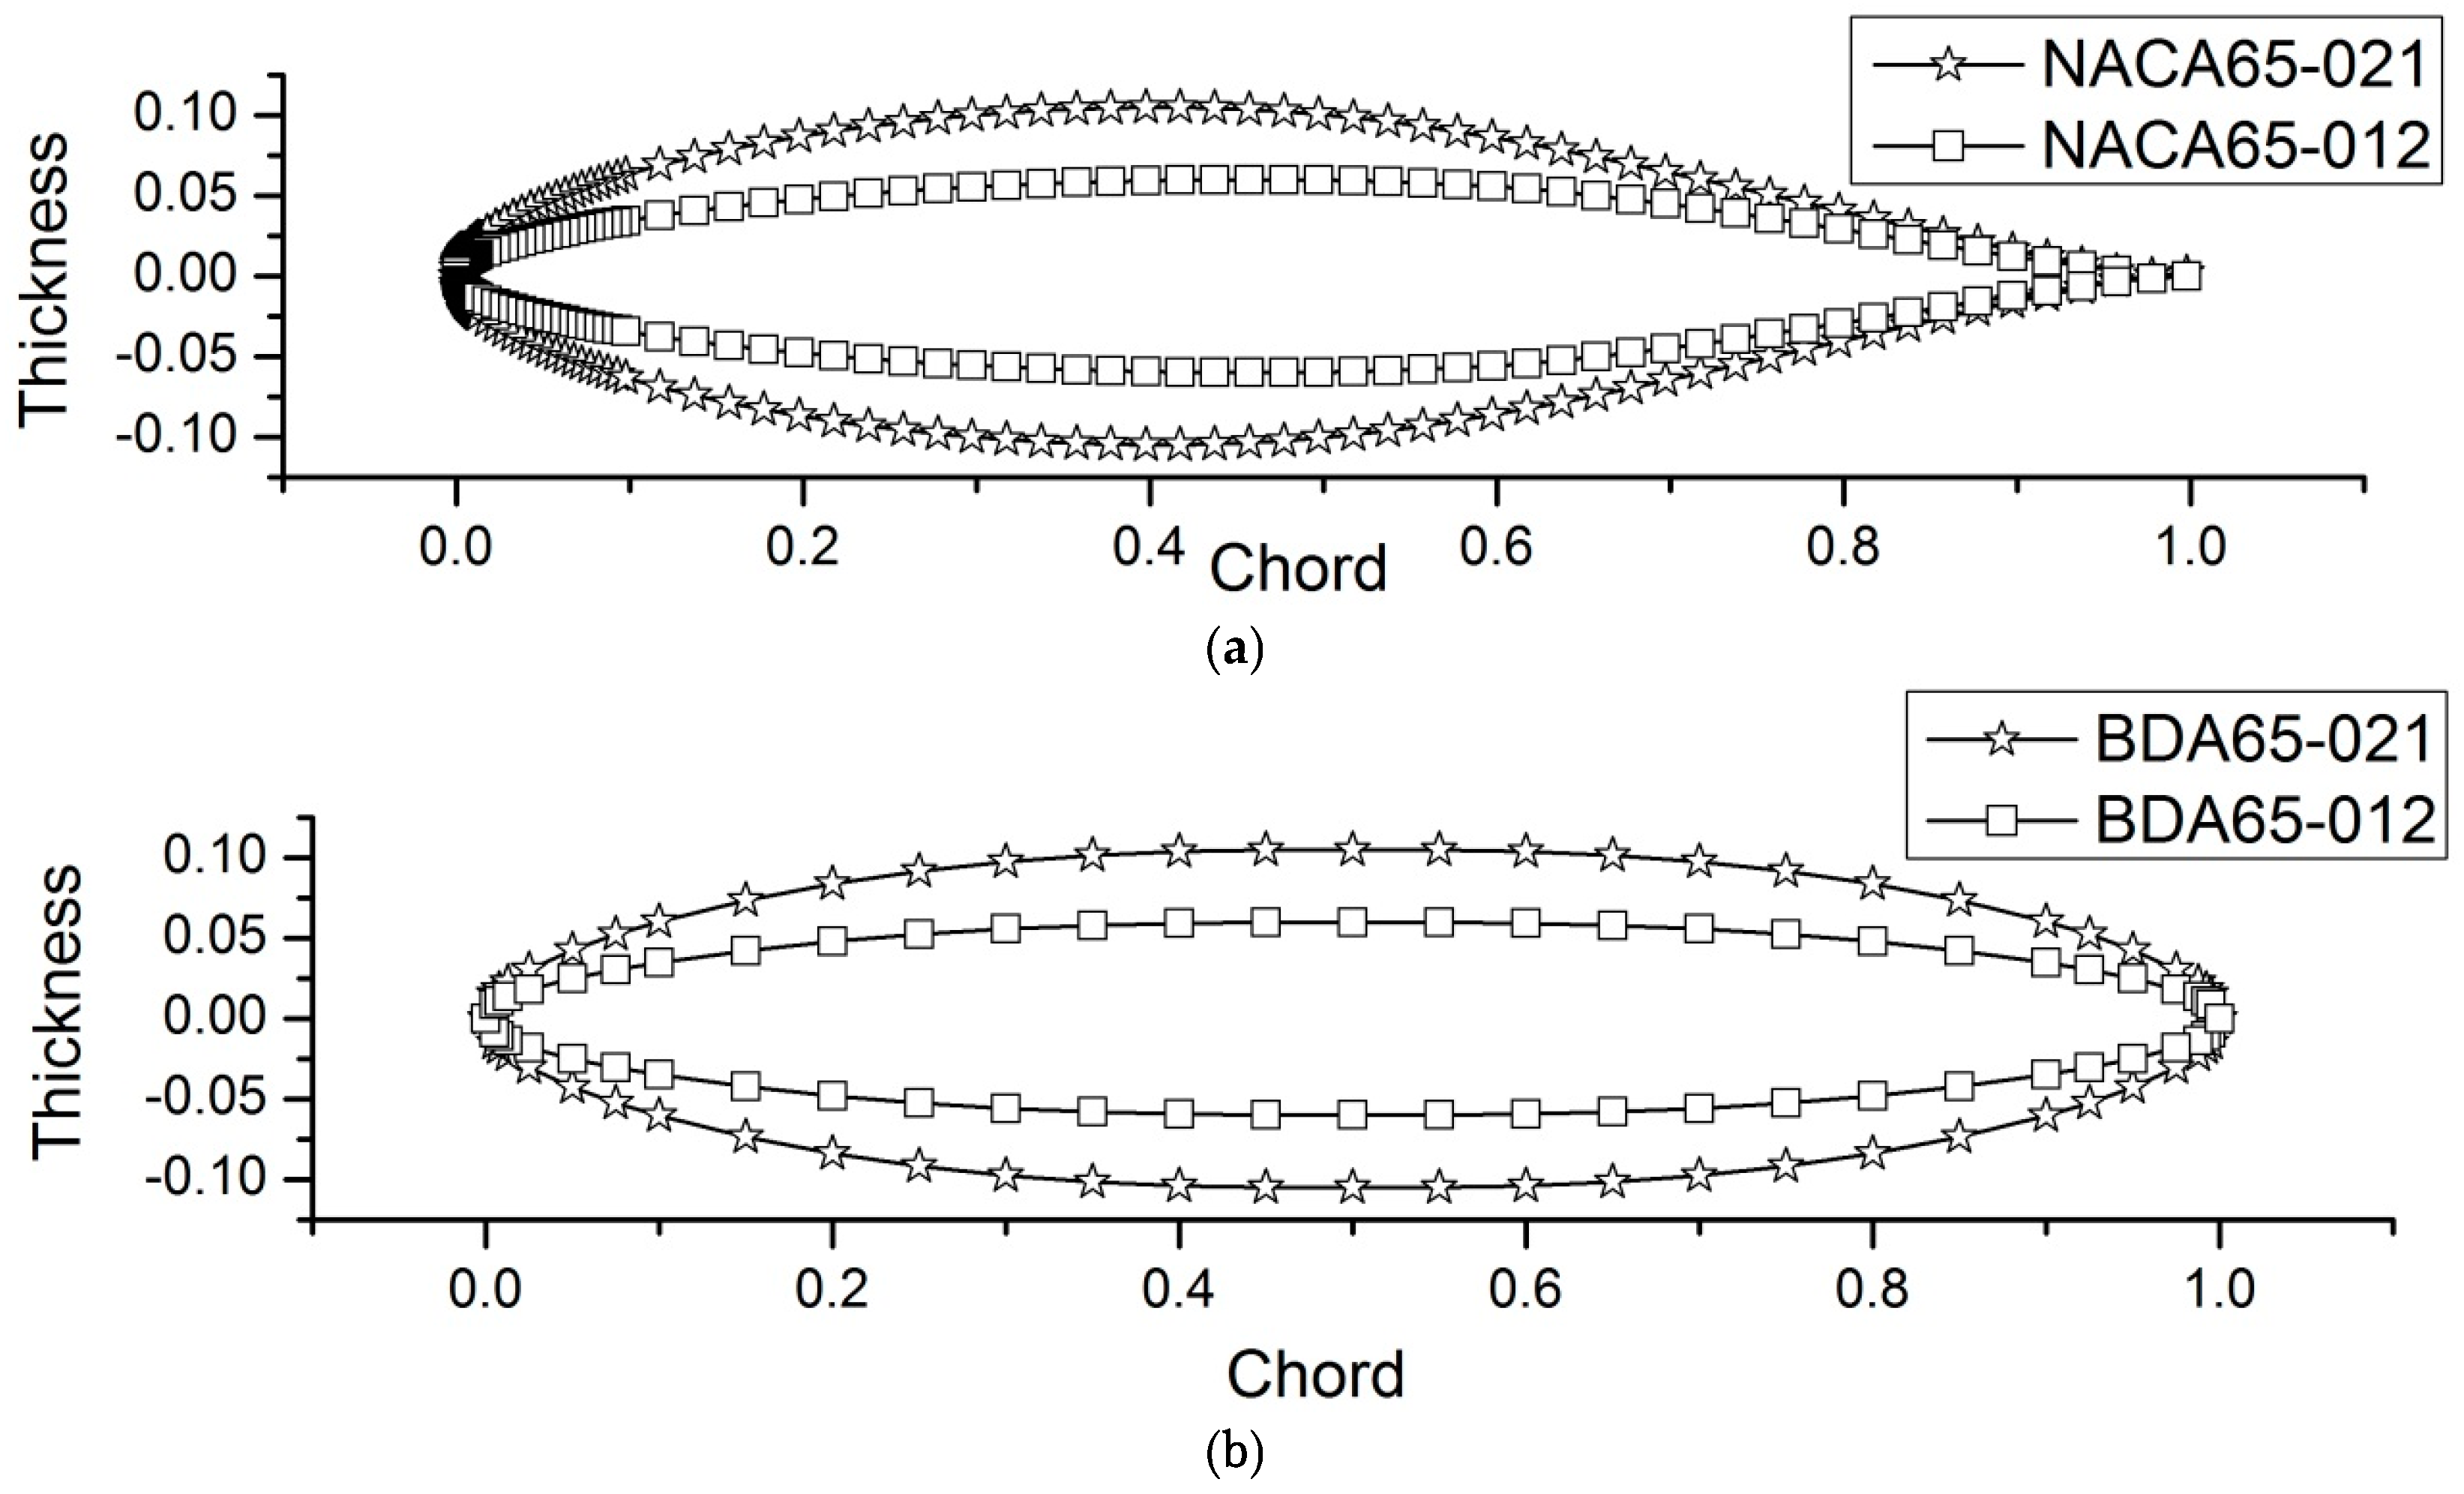
As foils near to the turbine hub require being thicker than that of foils near the tip, and given thinner foils will have a higher lift–drag ratio, foils NACA 65-021 and NACA 65-012 were chosen as the basic foils to form the bidirectional foils used for the hub region to meet a higher stress requirement and the tip region to have a higher lift–drag ratio, respectively. No-dimensional geometries of NACA 65-021 and NACA 65-012 are shown in Figure 2a.
2.1.1. Bidirectional Foil, BDA 65-021
As NACA 65-021 is a foil symmetric to the nose–tail line of the foil, in order to form a bidirectional foil, the foil also has to be symmetric to the axis perpendicular to the nose–tail line of the foil at the mid-chord. As the maximum thickness of the NACA 65-021 foil is at 40% of the chord length from the leading edge, for this region, the section geometry of BDA 65-021 is identical to that of NACA 65-021, and from 40% chord to mid-chord, the section geometry has equal thickness, like a parallel middle body of a ship. Thus, half of the BDA 65-021 foil is formed. The other half of BDA 65-021 is obtained by mirroring the first half of the axis perpendicular to the nose–tail line at the middle of the chord, as shown in Figure 2b.
2.1.2. Bidirectional Foil, BDA 65-012
Following a similar procedure to that of the BDA 65-021 foil, the bidirectional foil BDA 65-012 can be formed as shown in Figure 2b.
2.2. Method of the Numerical Simulation
The hydrodynamic performance of the bidirectional foil BDA 65-021 and BDA 65-012 were evaluated using the CFD software STAR-CCM+. The material property was water–liquid, using the incompressible freshwater property with a density of 997.56 kg/m3 and a dynamic viscosity of 0.889 × 10⁻³ Pa·s. The turbulence model was taken as the SST k-ω model.
During the numerical simulation, the lift and drag of the foil can be obtained, and from these data the non-dimensional lift coefficient () and drag coefficient () can be derived by using the following equations:
where is the lift force of the foil in N; is the drag force of the foil in N; is the fluid density in kg/m3; is the incoming flow velocity in m/s; and is the chord length in m.
2.2.1. Boundary Conditions
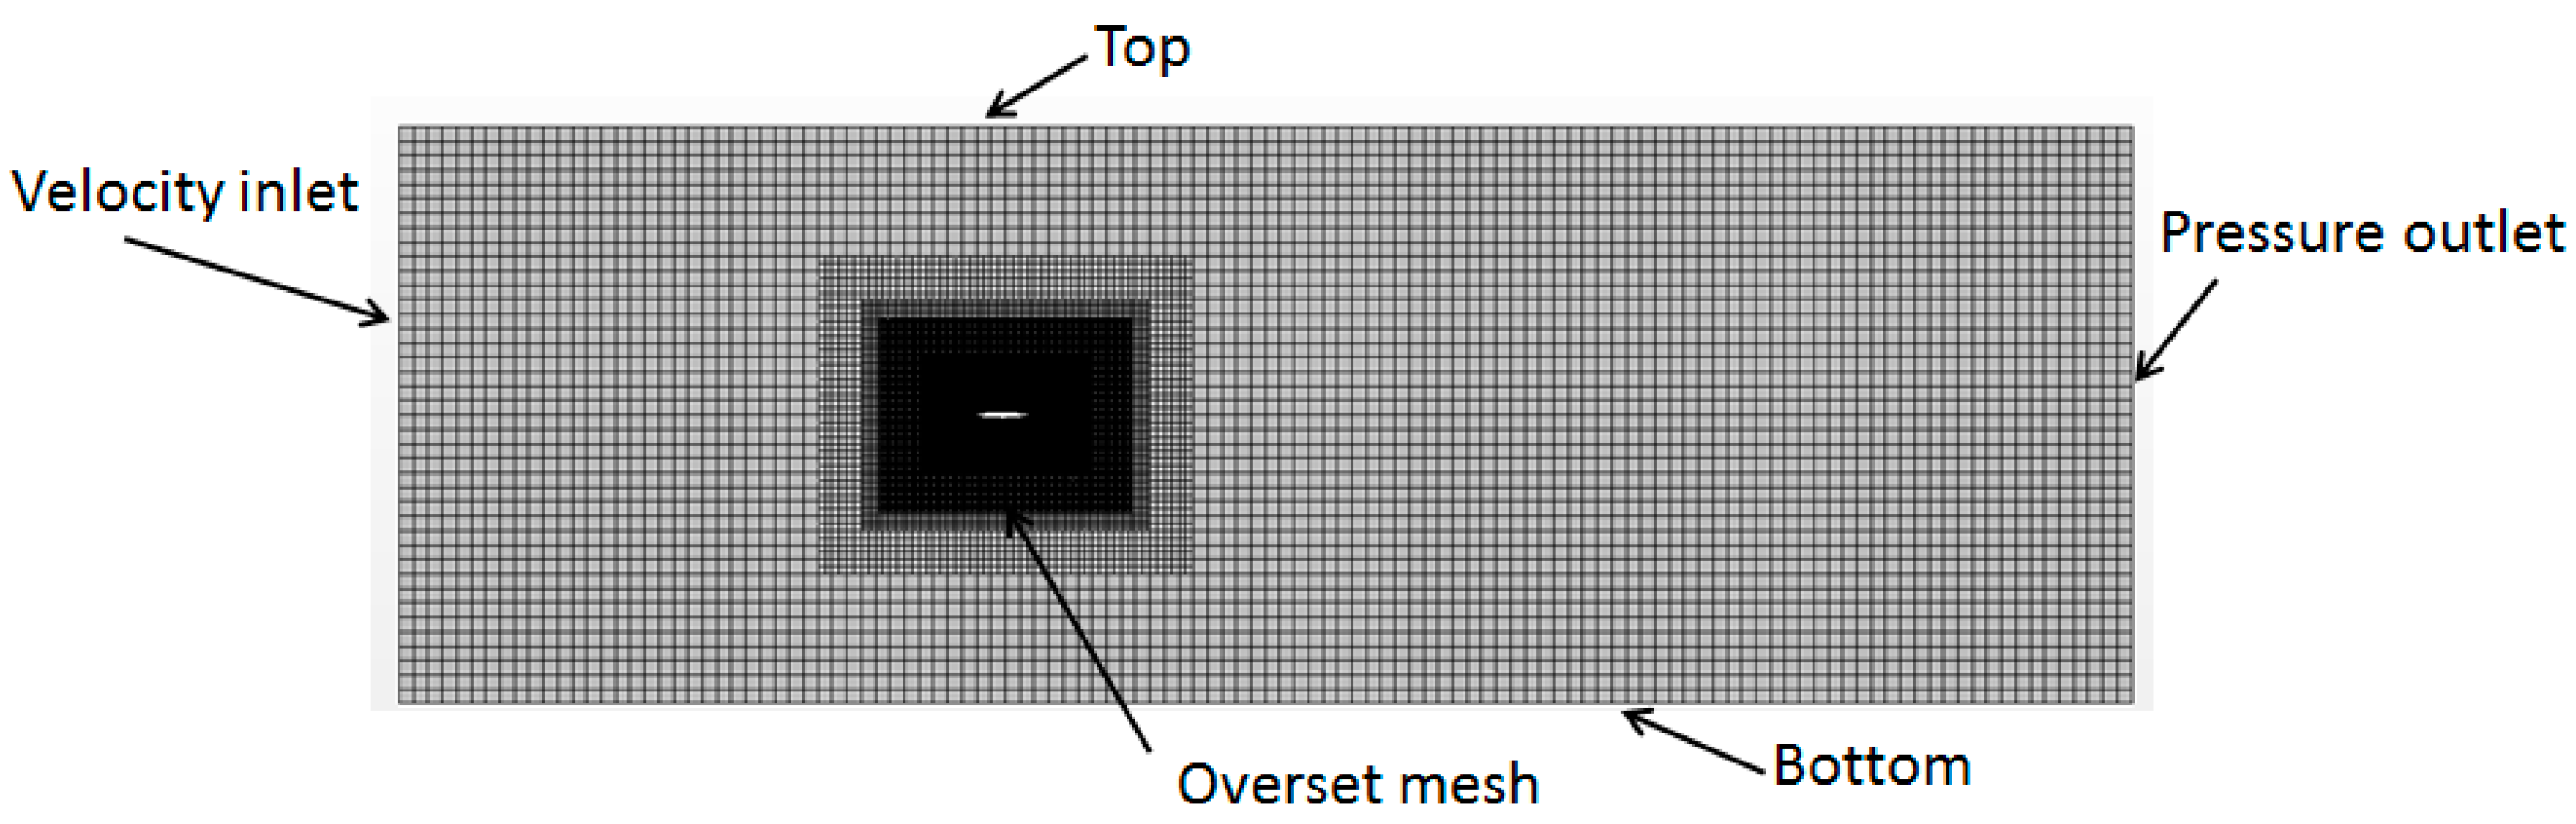
The chord length of the foil ( = 1 m) was defined as the reference length to describe the domain size. The velocity-inlet boundary is set upstream at 5 m from the middle chord of the foil, with a pressure-outlet boundary defined downstream at 10 m from the middle chord of the foil. The velocity-inlet boundary is also applied to the top and the bottom, which have an equal distance to the chord of the foil, and the distance between the top and the bottom is 10 m. A no-slip boundary condition is applied to the foil. Figure 3 shows the boundary conditions of the numerical simulation.
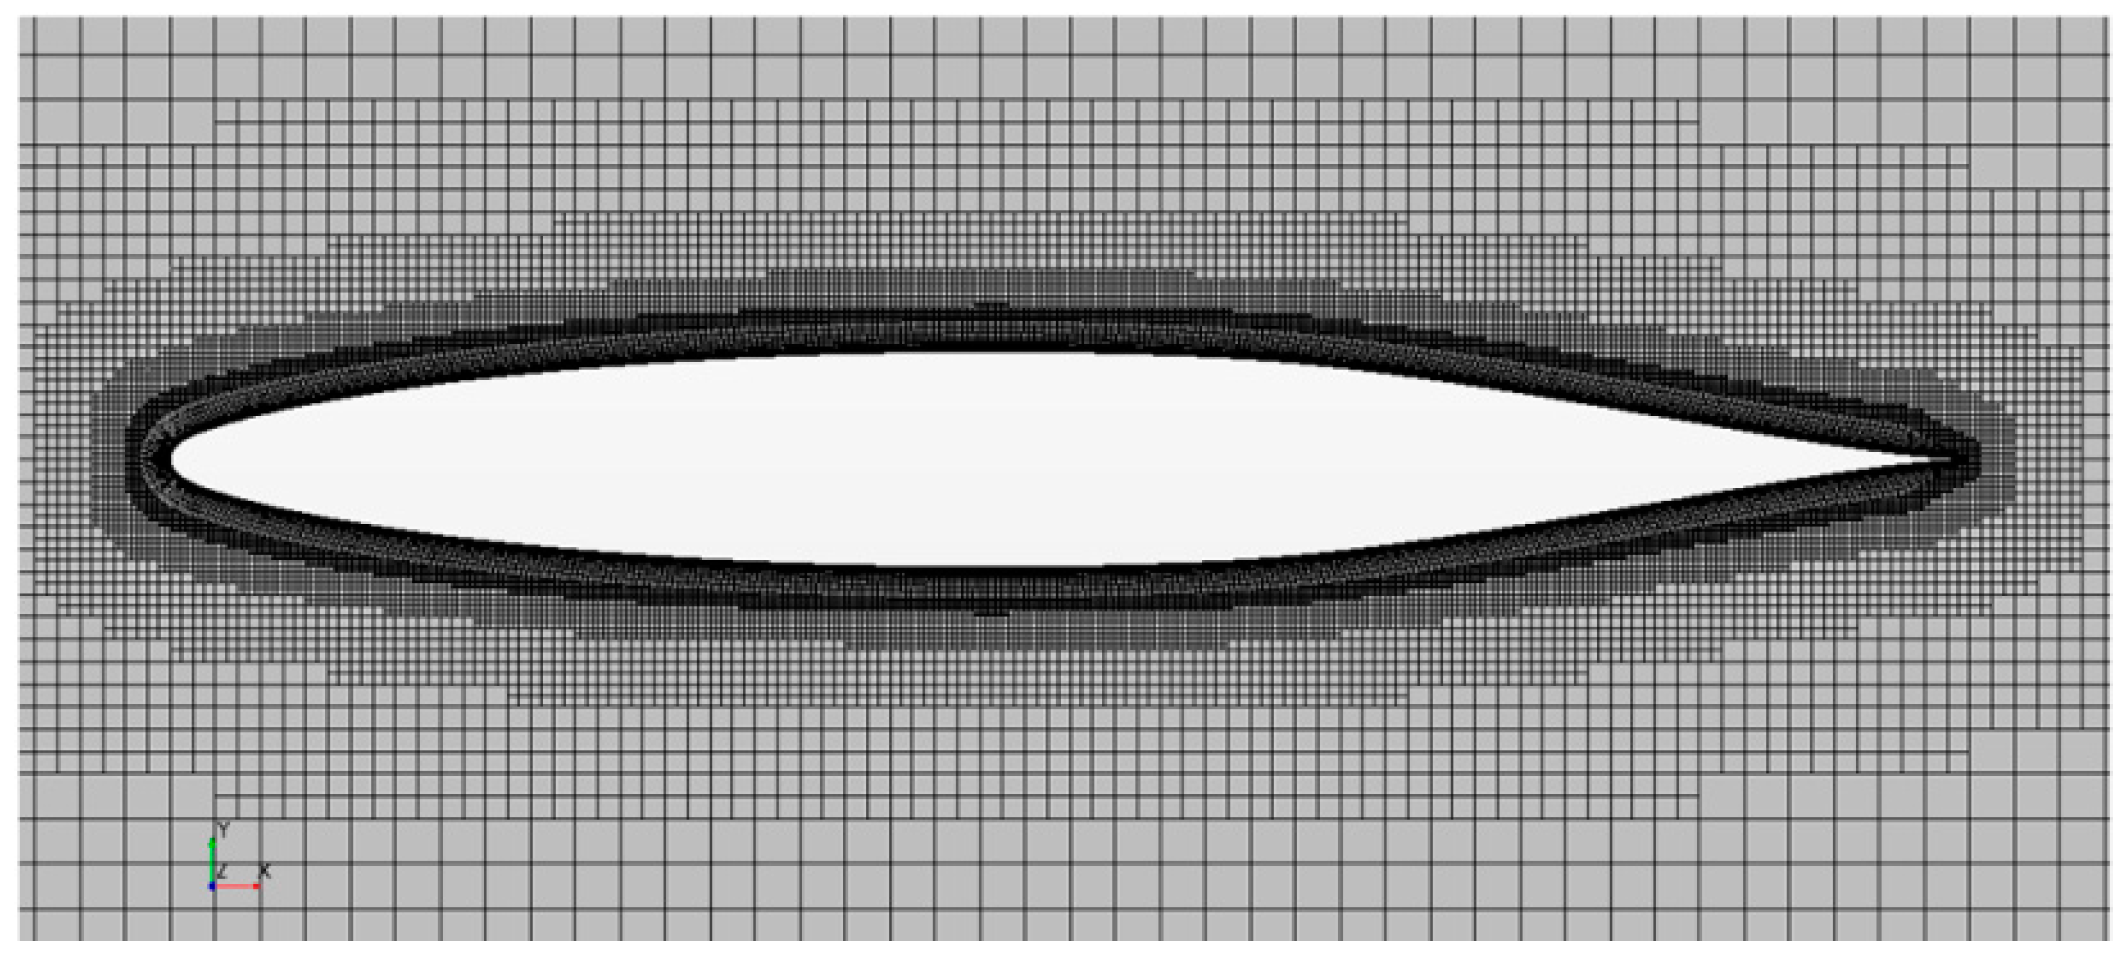
2.2.2. Mesh Generation
2.3. Validation of the Numerical Simulation
In the numerical simulation, the Reynolds number (Re) of the full-scaled turbine can be derived by using Equation (3). Taking the design parameters of the turbine into the formula, the Reynolds number of the turbine is approximately 3 × 10⁶. The design parameters of the turbine will be described in Section 3.1. In order to meet the Reynolds number of the turbine, the flow speed in numerical simulation of the foil is 2.58 m/s, and the chord length is 1 m.
where is the chord length of full-scaled turbine at 0.7 radius in m; is the kinematic viscosity of the water in m2/s; is the incoming flow speed in m/s; is the radius of the turbine rotor in m; and is the angular velocity of the turbine in rad/s.
The method of Richardson’s extrapolation was used to check the grid independence of the CFD results [14]. Three grids named Grid 1, Grid 2 and Grid 3 were defined in this study. Grid 1 is the fine mesh grid, Grid 2 is the medium mesh gird and Grid 3 is the coarse mesh grid. The results of the grid independence study are listed in Table 1. It can be seen that the biggest differences for the drag coefficient between Grid 1 and Grid 2 () and between Grid 2 and Grid 3 () are 0.00119 and 0.00178 in the case of AOA = 12°, respectively. For the lift coefficient, the biggest differences between Grid 1 and Grid 2 () and between Grid 2 and Grid 3 () are −0.00828 and −0.02536 in the case of AOA = 12°, respectively. The differences in Cd and CL between the medium and fine grid compared with the coarse and medium grid are decreasing. It seems that the results of the numerical simulation tend to converge with the increased number of cells. The maximum Grid Convergence Index (GCI) occurs on the drag coefficient in the case of AOA = 12°, which is 0.19292. To maintain a grid-resolution consistency for different cases and also to balance the accuracy and the computational cost, the moderate grid of Grid 2 is adopted for the following computation for the foil’s performance.
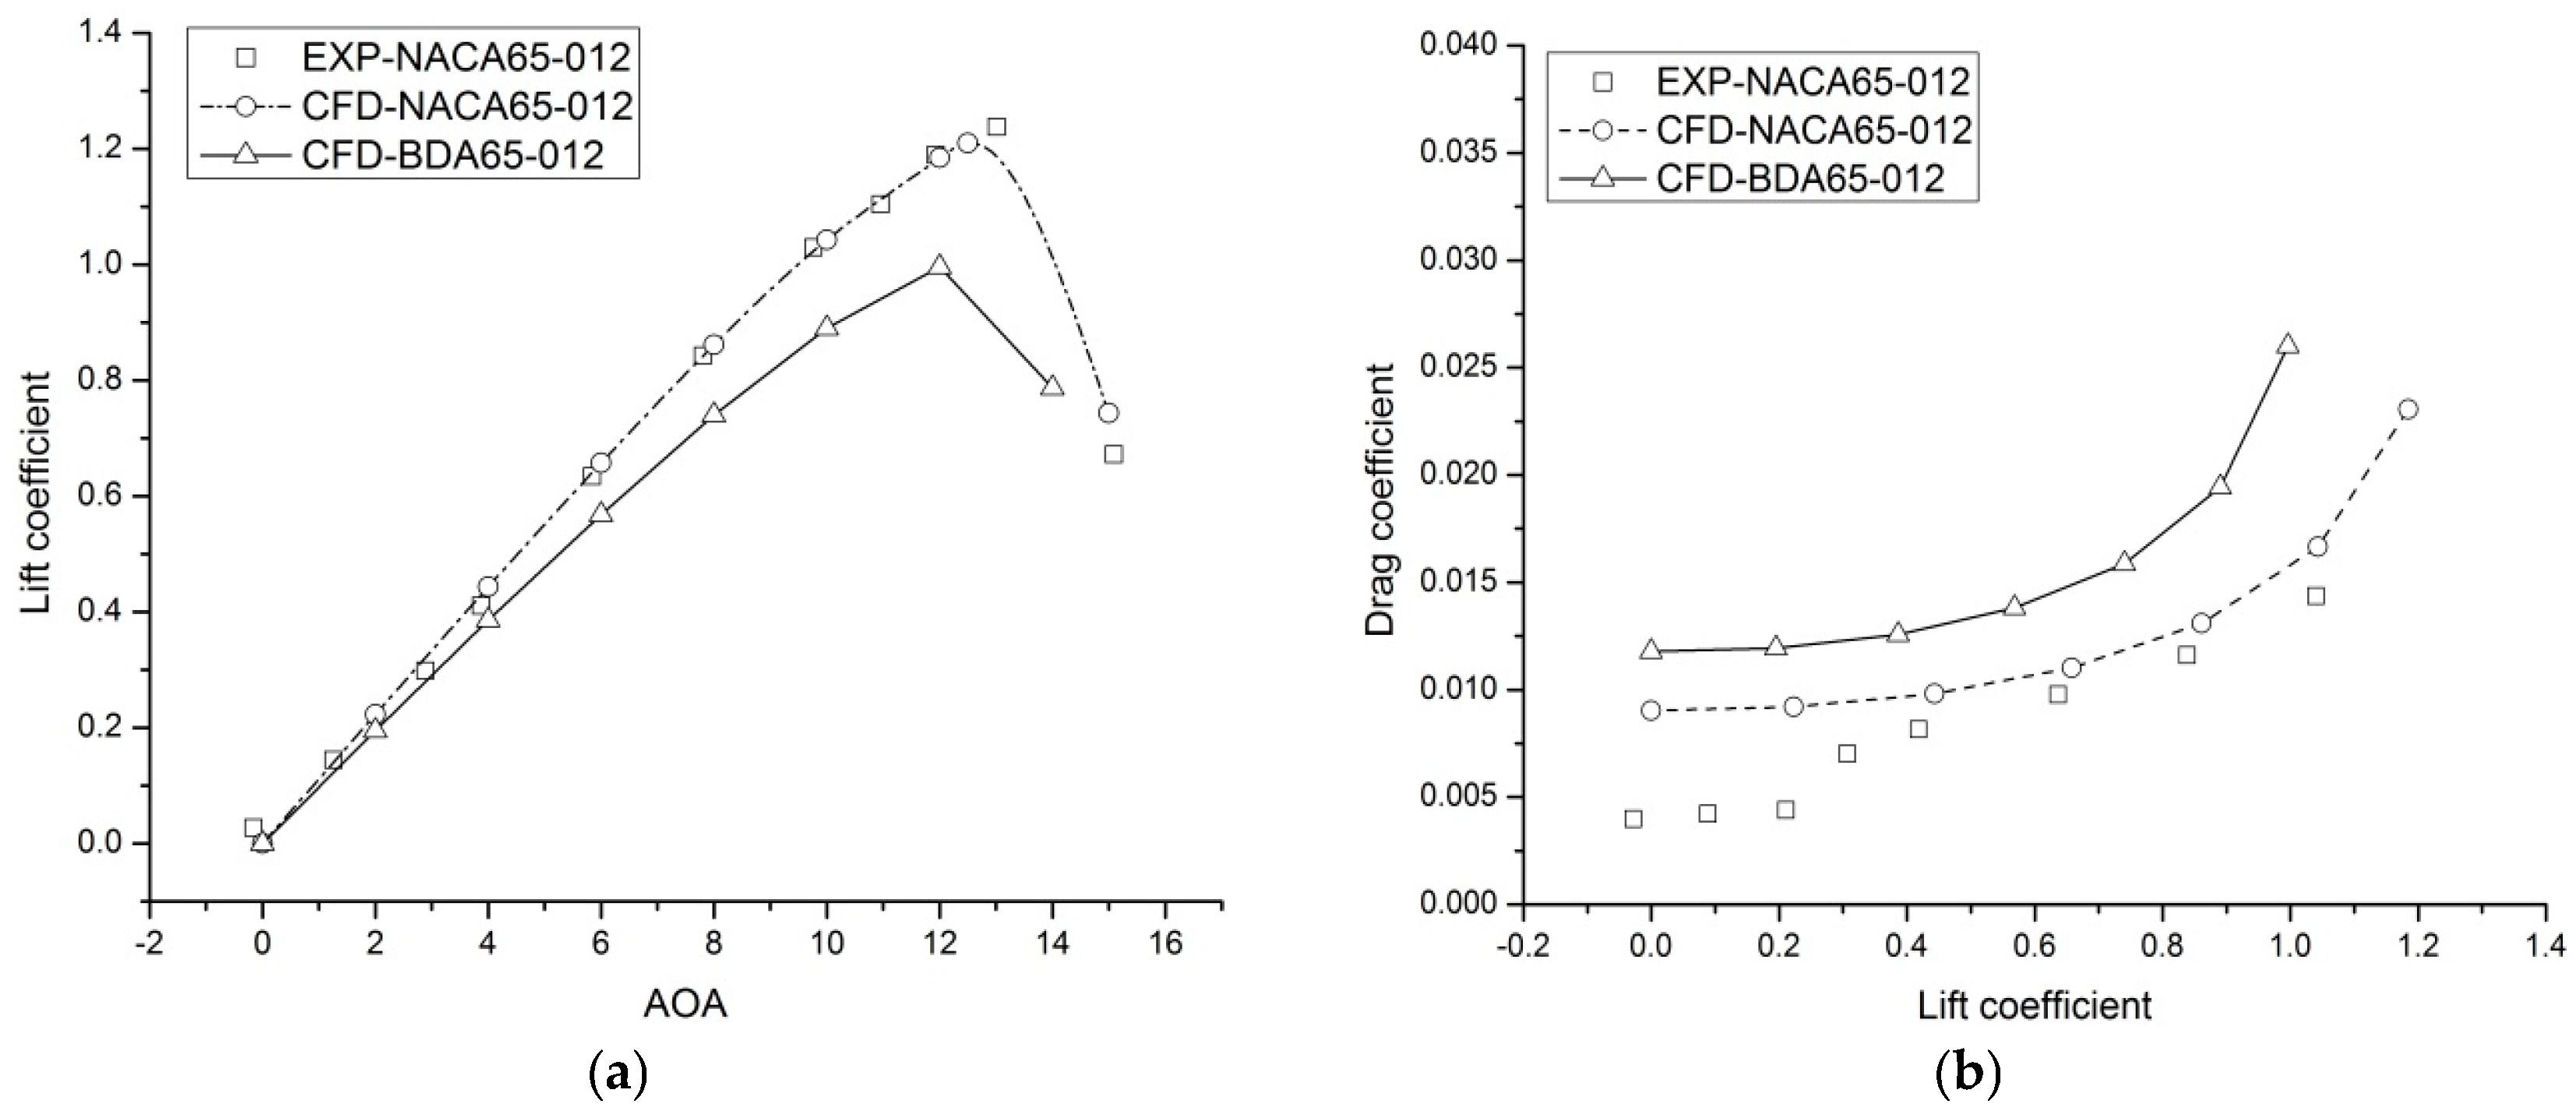
In order to build confidence in the simulation methodology used in this paper, a validation study has been conducted for comparison with some published results of NACA 65-012 and NACA 65-021 at Re = 3 × 10⁶ from Abbott [15], as shown in Figure 5 and Figure 6. It can be seen that the CFD results agree well with the experimental data, especially the lift coefficient. But the drag coefficients are larger than the experimental results. There are certain possible reasons for errors in the drag performance of the numerical evaluation. One is due to the unknown wind tunnel environment and the foil surface roughness [15]. The other is due to laminar turbulent transition. The model used in this paper is a fully turbulent model, therefore transition was not considered. This is because the natural tidal current is fully turbulent in the real ocean environment. Therefore, the fully turbulent model is closer to the real turbine’s working environment. However, the experimental data of the foil is from a wind tunnel. A transition process will be triggered at some point on foil in the air. Therefore, fully turbulent models would have deviated from the real flow phenomenon, and so the precision of the results attained from these methods are compromised. However, due to the negligible influence of the foil’s drag on turbine design [16], the turbulence model adopted in this paper is widely used and accepted in tidal current turbine applications.
2.4. Performance of Bidirectional Foils
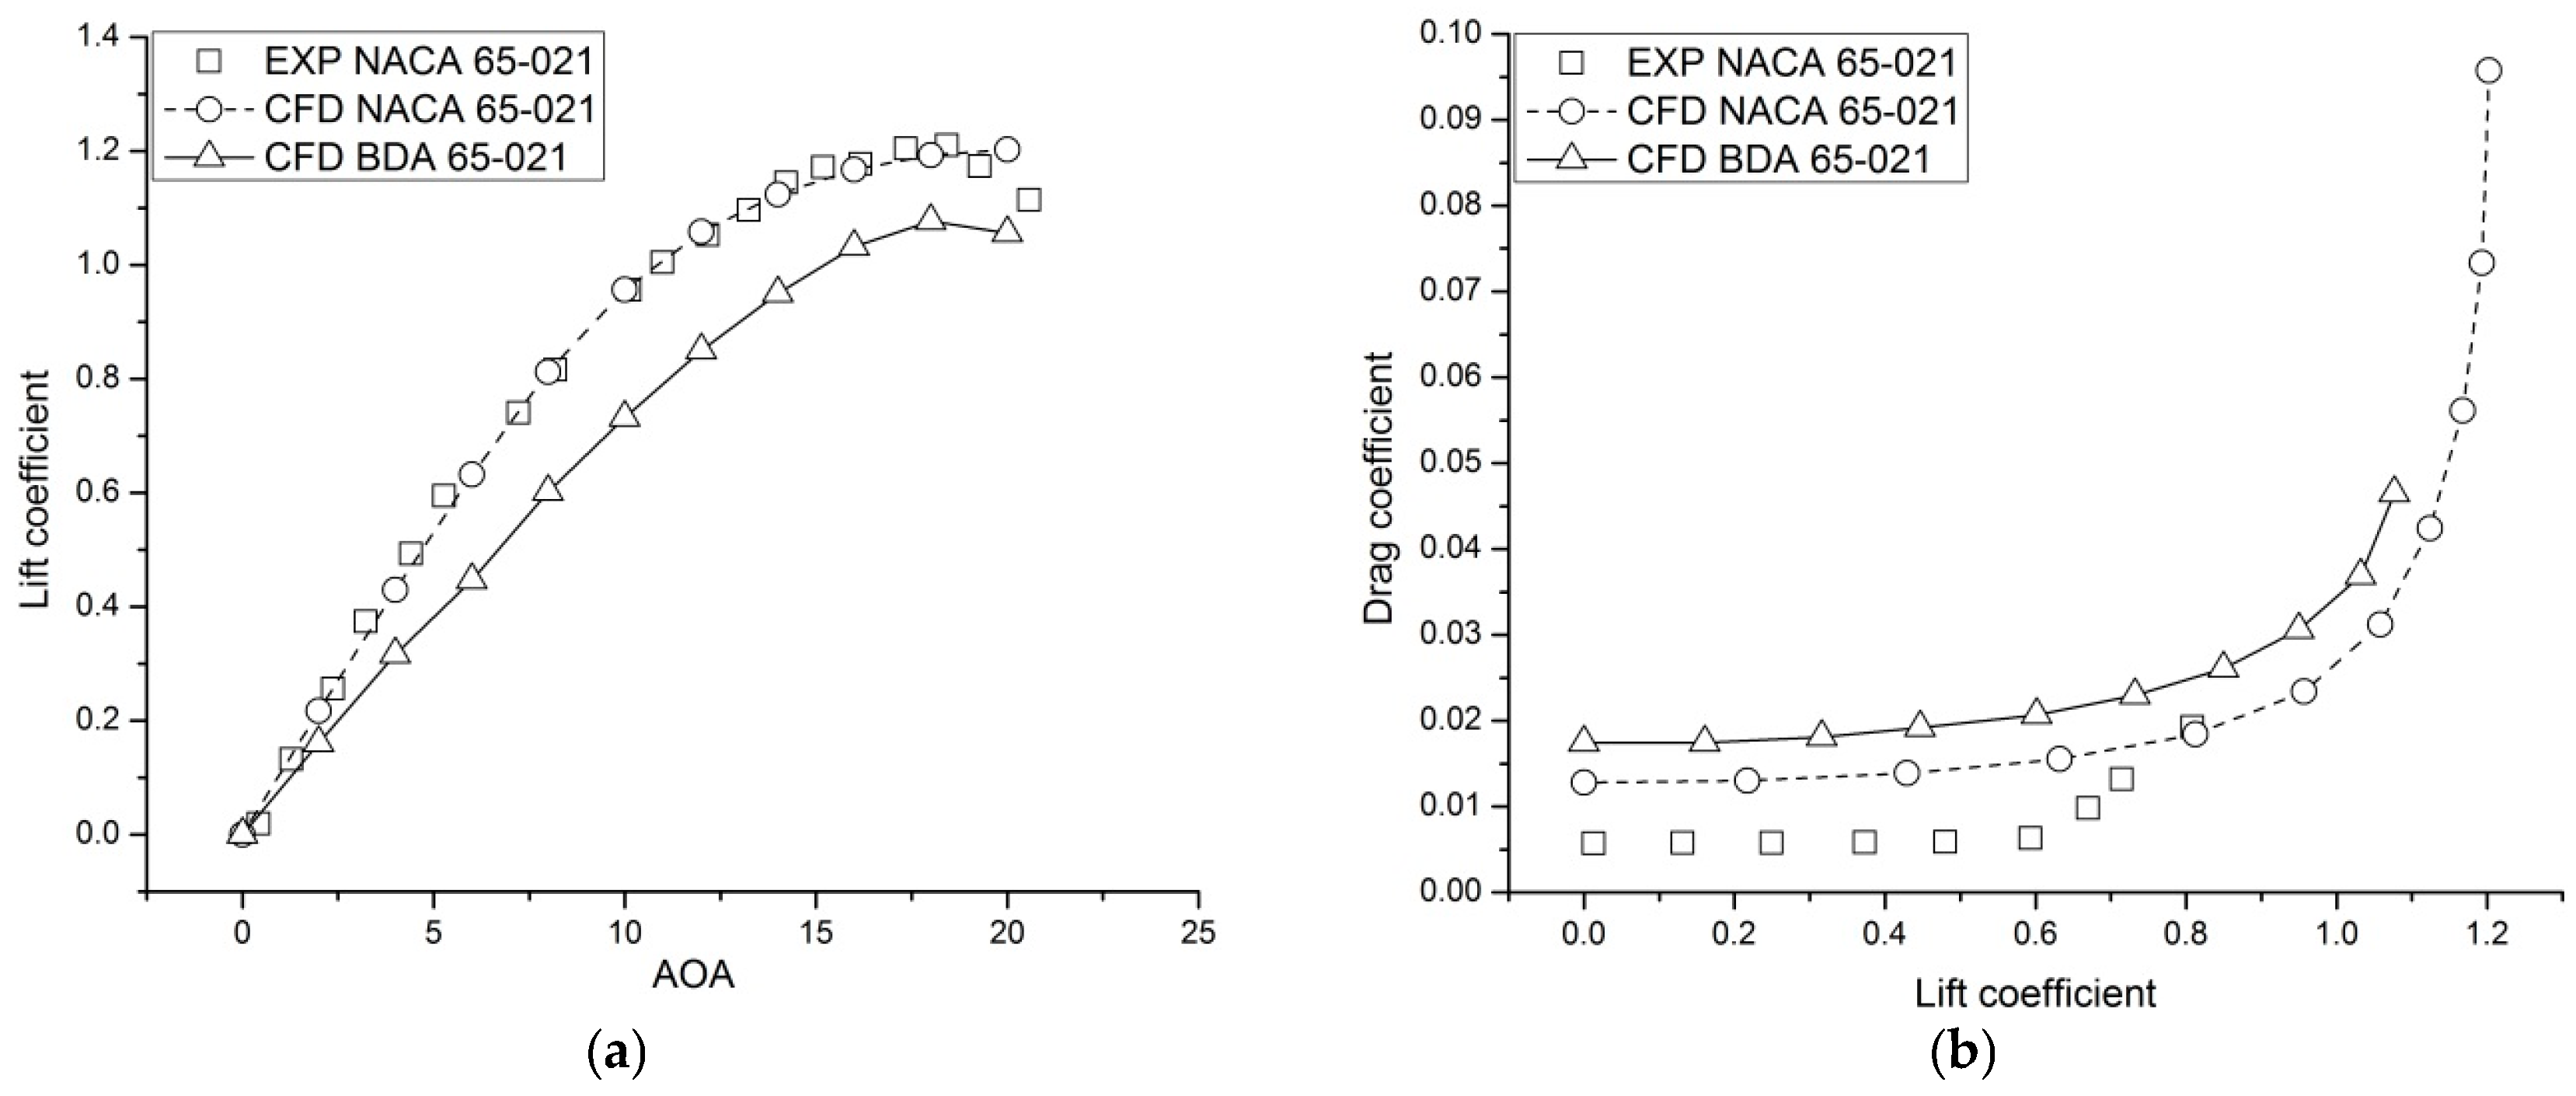
The lift and drag coefficients of BDA 65-012 and BDA 65-021 are given in Figure 5 and Figure 6. It can be seen that the lift coefficients of the two bidirectional foils are lower than the NACA foils, and the drag coefficients are larger than the NACA foils. The maximum lift-to-drag ratio of BDA 65-012 is approximately 46.67 at AOA = 8°, and for BDA 65-021 is approximately 32.92 at AOA = 12°. The lift and drag coefficients of BDA foils and NACA foils at AOA = 8° are given in Table 2. The lift coefficient of BDA 65-012 decreases 14.01% compared with that of the NACA 65-012 at AOA = 8°, and the drag coefficient increases 21.23%. The lift coefficient of BDA 65-021 decreases 25.33% compared with that of the NACA 65-021 at AOA = 8°, and the drag coefficient increases 14.66%.
3. Hydrodynamic Performance of the Bare Bidirectional Turbine
3.1. Bidirectional Turbine Design
The bidirectional turbine was designed on the basis of Blade Element Momentum (BEM) theory [16]. The main design parameters of this turbine are given in Table 3. In the designing process, the bidirectional foils BDA 65-021 and BDA 65-012 designed in Section 2.1 were used for the hub (from r/R = 0.2 to 0.45) and tip (from r/R = 0.65 to 1.0) regions, respectively. While for the middle part of the turbine blade (from r/R = 0.45 to 0.65), quadratic polynomials were used to interpolate the bidirectional foils from the bidirectional foils of the hub and tip regions. The main particulars of this bidirectional turbine are shown in Table 4. Following similar procedures as for the bidirectional turbine, the turbine with NACA foils can be formed as shown in Table 5.
3.2. Method of the Turbine Numerical Simulation
3.2.1. Governing Equations
In this paper, the commercial CFD code STAR-CCM+ has been used to predict the performance of the 10 m diameter bidirectional turbine. The governing equations in the numerical simulation are the Navier–Stokes equations for incompressible viscous flow, and a statistically steady solution is found. The Navier–Stokes equations including the continuity equation and the momentum equation are given below:
where is the time averaged velocity components in Cartesian coordinates (i = 1, 2, 3), in m/s; is the turbine forces, in N; is the fluid density, in kg/m3; is the time averaged pressure, in Pa; is the viscous coefficient; is the fluctuating velocity components in Cartesian coordinates, in m/s; and is the Reynolds stress tensor, in N.
The finite volume method (FVM) was employed to discretize the governing equations with the second-order upwind scheme. The Semi-Implicit Method for the Pressure-Linked Equations (SIMPLE) was used for the pressure–velocity coupling. In order to allow closure of the time-averaged Navier–Stokes equations, the industrially acknowledged and recommended K-ω Shear Stress Transport (SST K-ω) turbulence model was adopted in this paper.
To evaluate the hydrodynamic performance of the turbine, the corresponding equations are given as follows:
where is the tip speed ratio of the turbine; is the angular velocity of the turbine, in rad/s; R is the radius of the turbine, in m; is the flow speed, in m/s; is the density of water, in kg/m3; is the swept area of the turbine rotor, in m2; is the torque of the turbine, in Nm; and T is the drag force of the turbine, in N.
3.2.2. Boundary Conditions
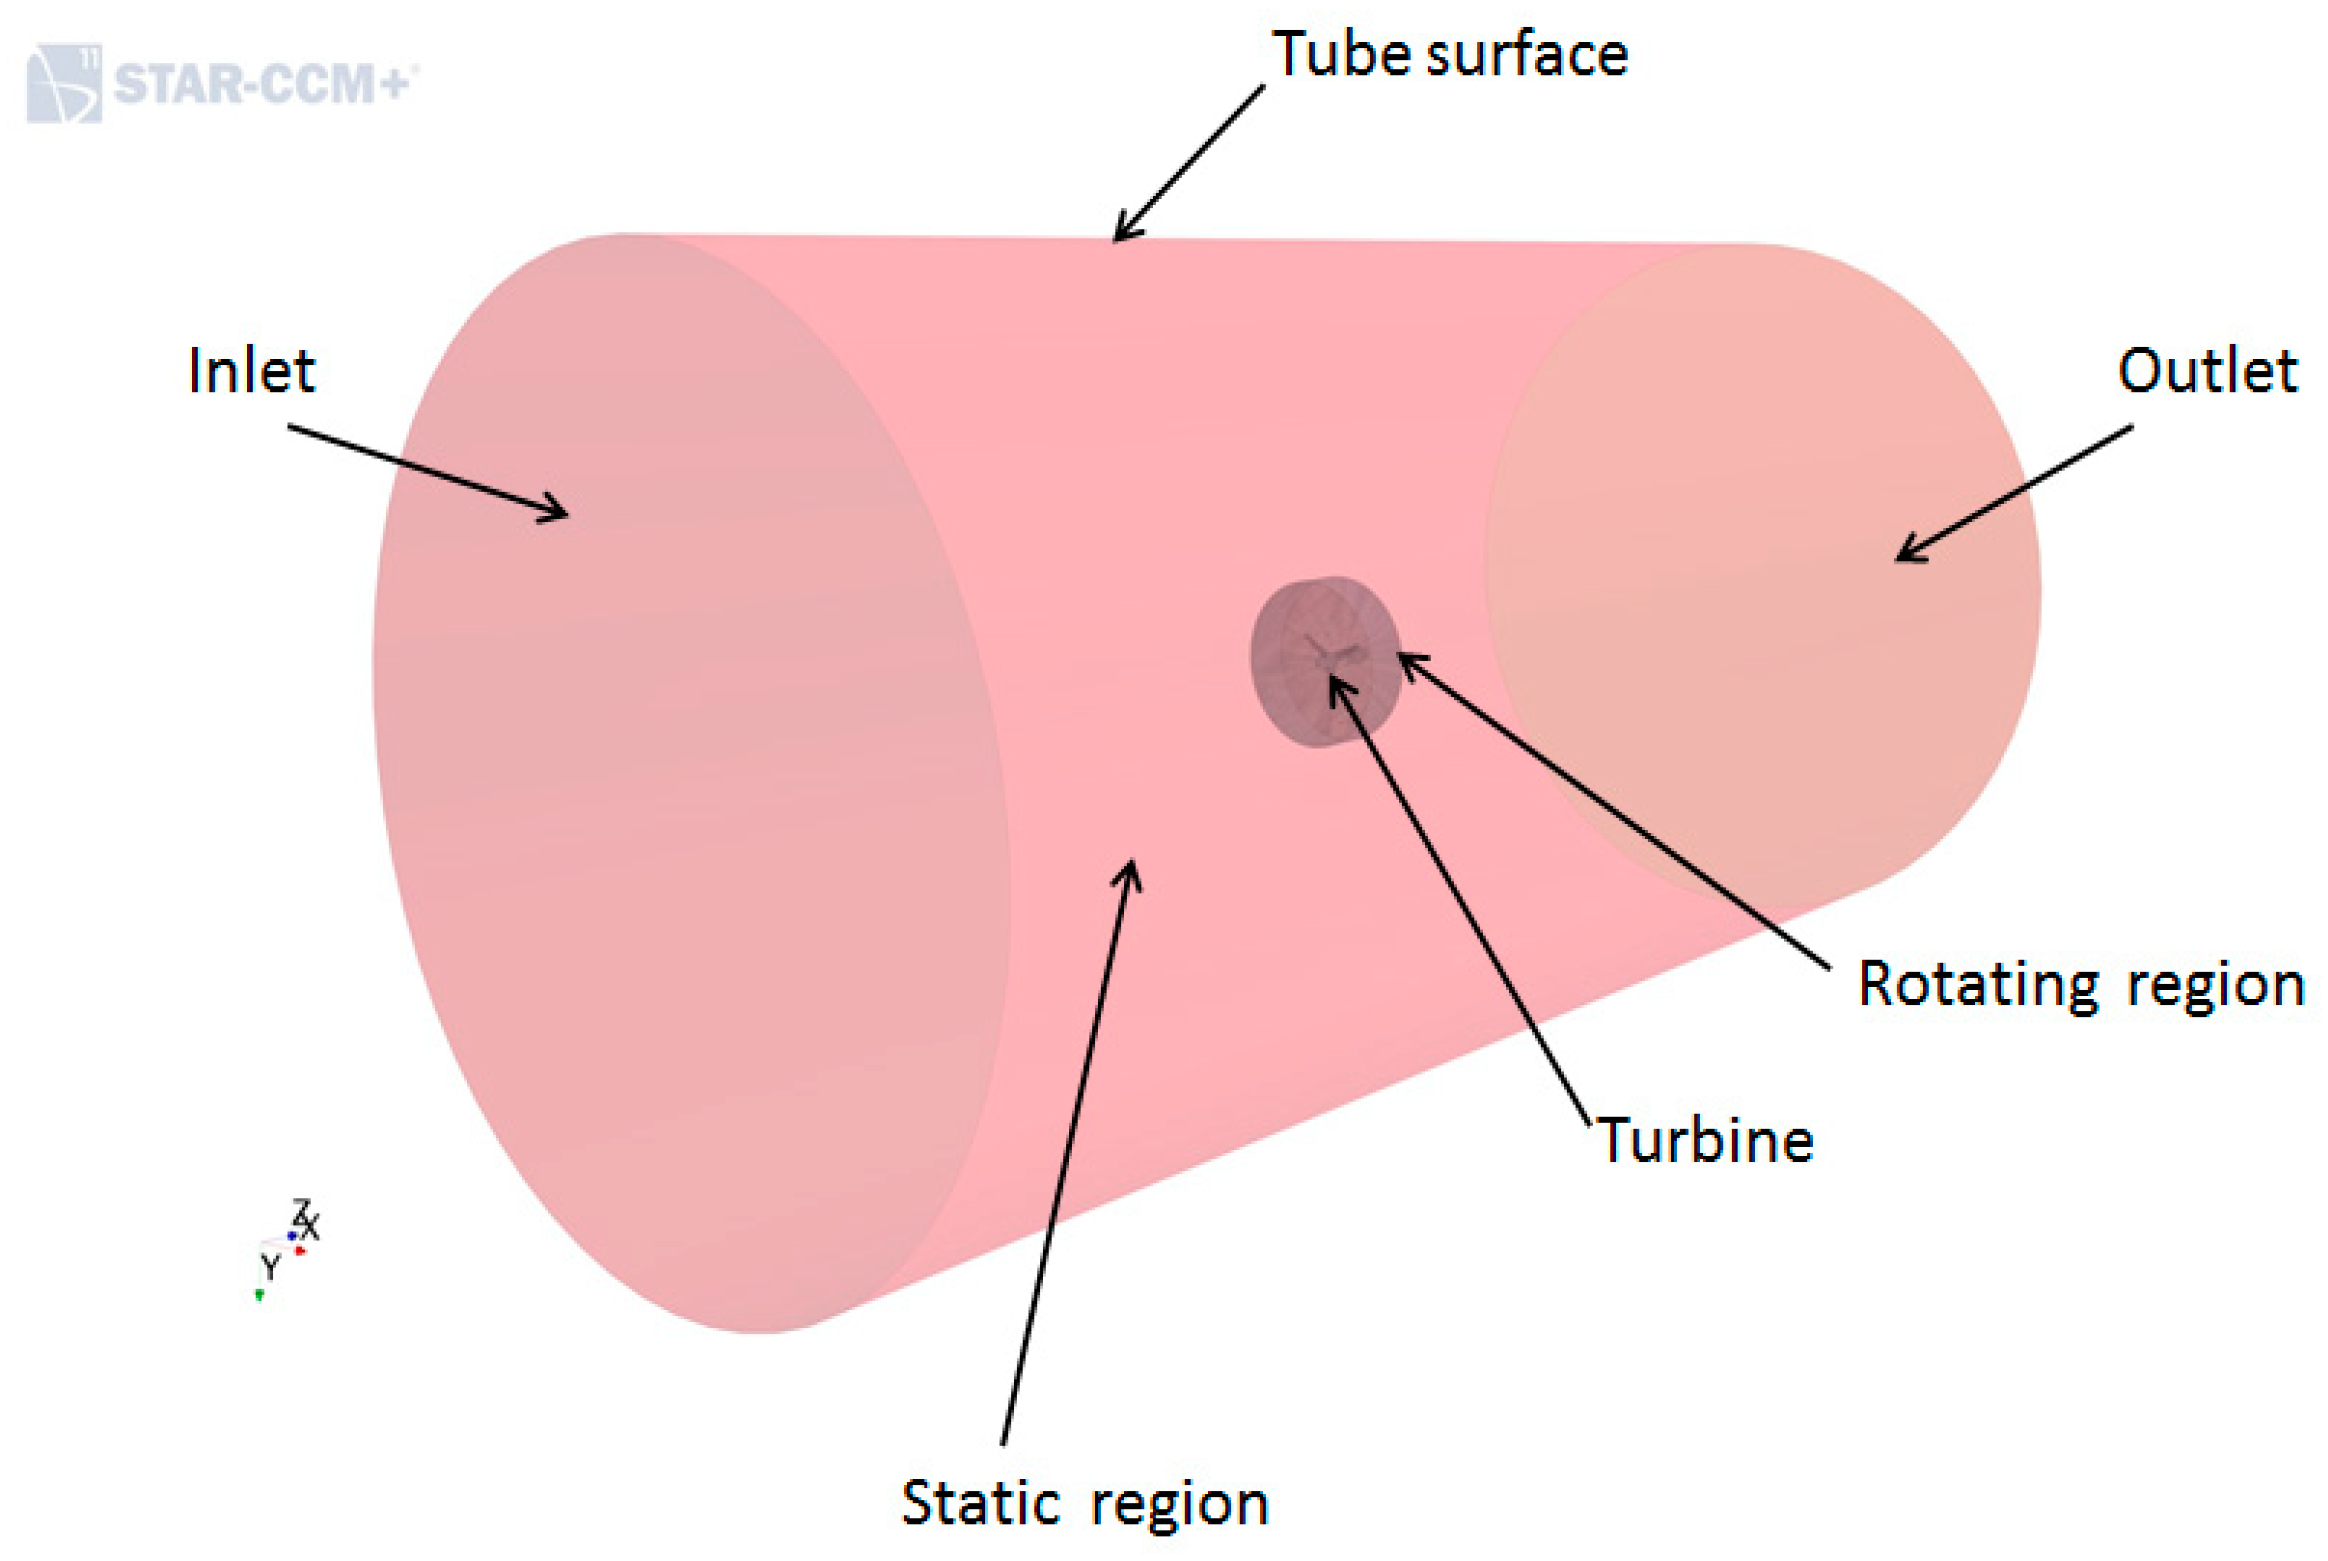
The computational domain of the turbine was a cylinder-shaped domain. Two regions existed in the computational domain: the rotating region and the static region. The diameter of the turbine rotor (D = 10 m) was defined as the reference length to describe the domain size. The turbine rotor was located in the rotating region. The diameter of the rotating region was 2D. The diameter of the static region was 10D. The velocity-inlet boundary was set at 10D in front of turbine, and the pressure-outlet boundary was set at 10D behind of the turbine. Thus, the computational domain was that of a cylindrical volume with diameter of 10D and length of 20D in the turbine axial direction. The velocity-inlet boundary was also applied to the tube shape surface of the cylinder. A no-slip boundary condition was applied to the turbine blade surface. A sketch of the domain is shown in Figure 7.
3.2.3. Mesh Generation
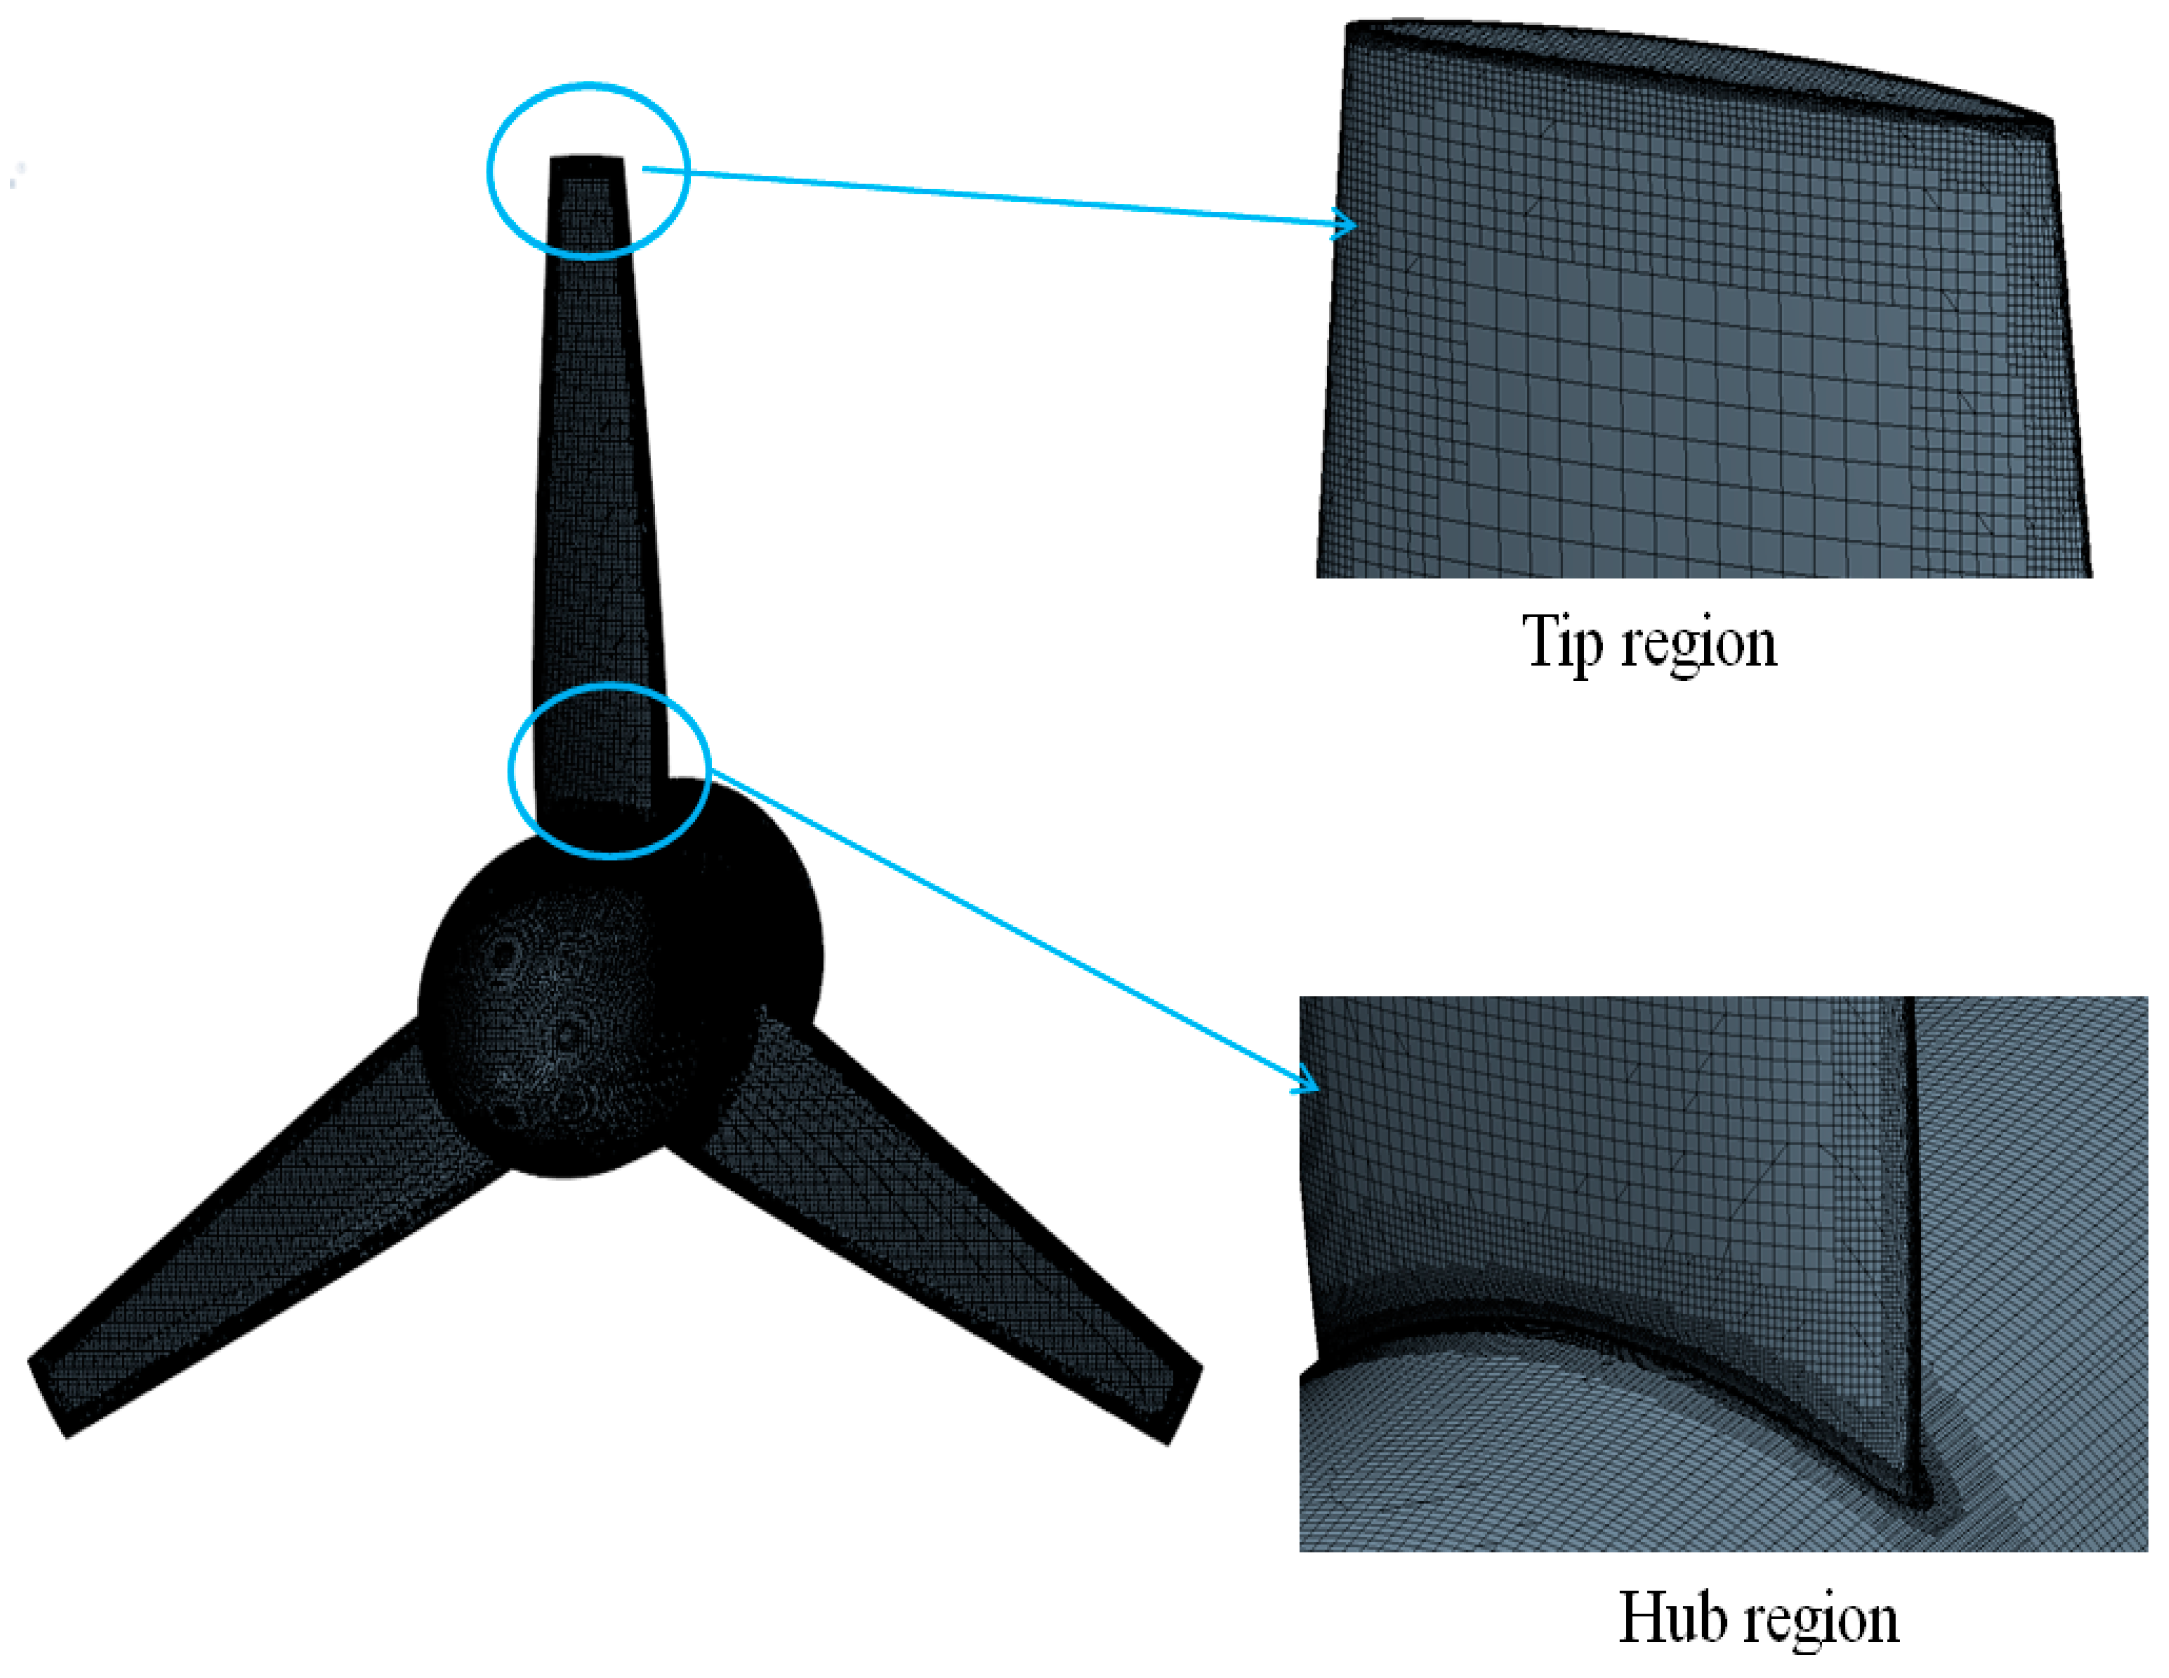
The turbine motion was modeled by using the Moving Reference Frames (MRF) method. An automatic meshing tool was used to generate mesh for the turbine. Some feature curves, such as the turbine blade leading and tailing edge, and some feature surfaces, such as the turbine surfaces, were marked to capture the shape of the turbine. The curve control and the surface control were created to make sure that the flow characteristics around the turbine were adequately captured. The surface mesh of the turbine is shown in Figure 8.
3.2.4. Mesh Independence Study
Three different sets of grids named Grid 1, Grid 2 and Grid 3 in STAR-CCM+ were used to check the mesh independence of the results. The CFD results at the tip speed ratios λ = 3 and 5 are listed in Table 6. In Table 6, it can be seen that there are smaller differences in the power coefficient and drag coefficient between the medium and fine grid compared with the coarse and medium grid. For the drag coefficient, the biggest differences between Grid 1 and Grid 2 () and between Grid 2 and Grid 3 () are −0.047% and −0.072% in the case of λ = 3, respectively. For the power coefficient, the biggest differences between Grid 1 and Grid 2 () and between Grid 2 and Grid 3 () are −0.599% and −0.763% in the case of λ = 3, respectively. It seems that the results of the numerical simulation tend to converge with the increased number of cells. The maximum Grid Convergence Index (GCI) occurs on the power coefficient in the case of λ = 3°, which is 0.029518. To maintain the grid-resolution consistency for different cases and also to balance the accuracy and the computational cost, the moderate grid of Grid 2 was adopted for the following computation for the turbine’s performance.
3.3. Experiment Validation
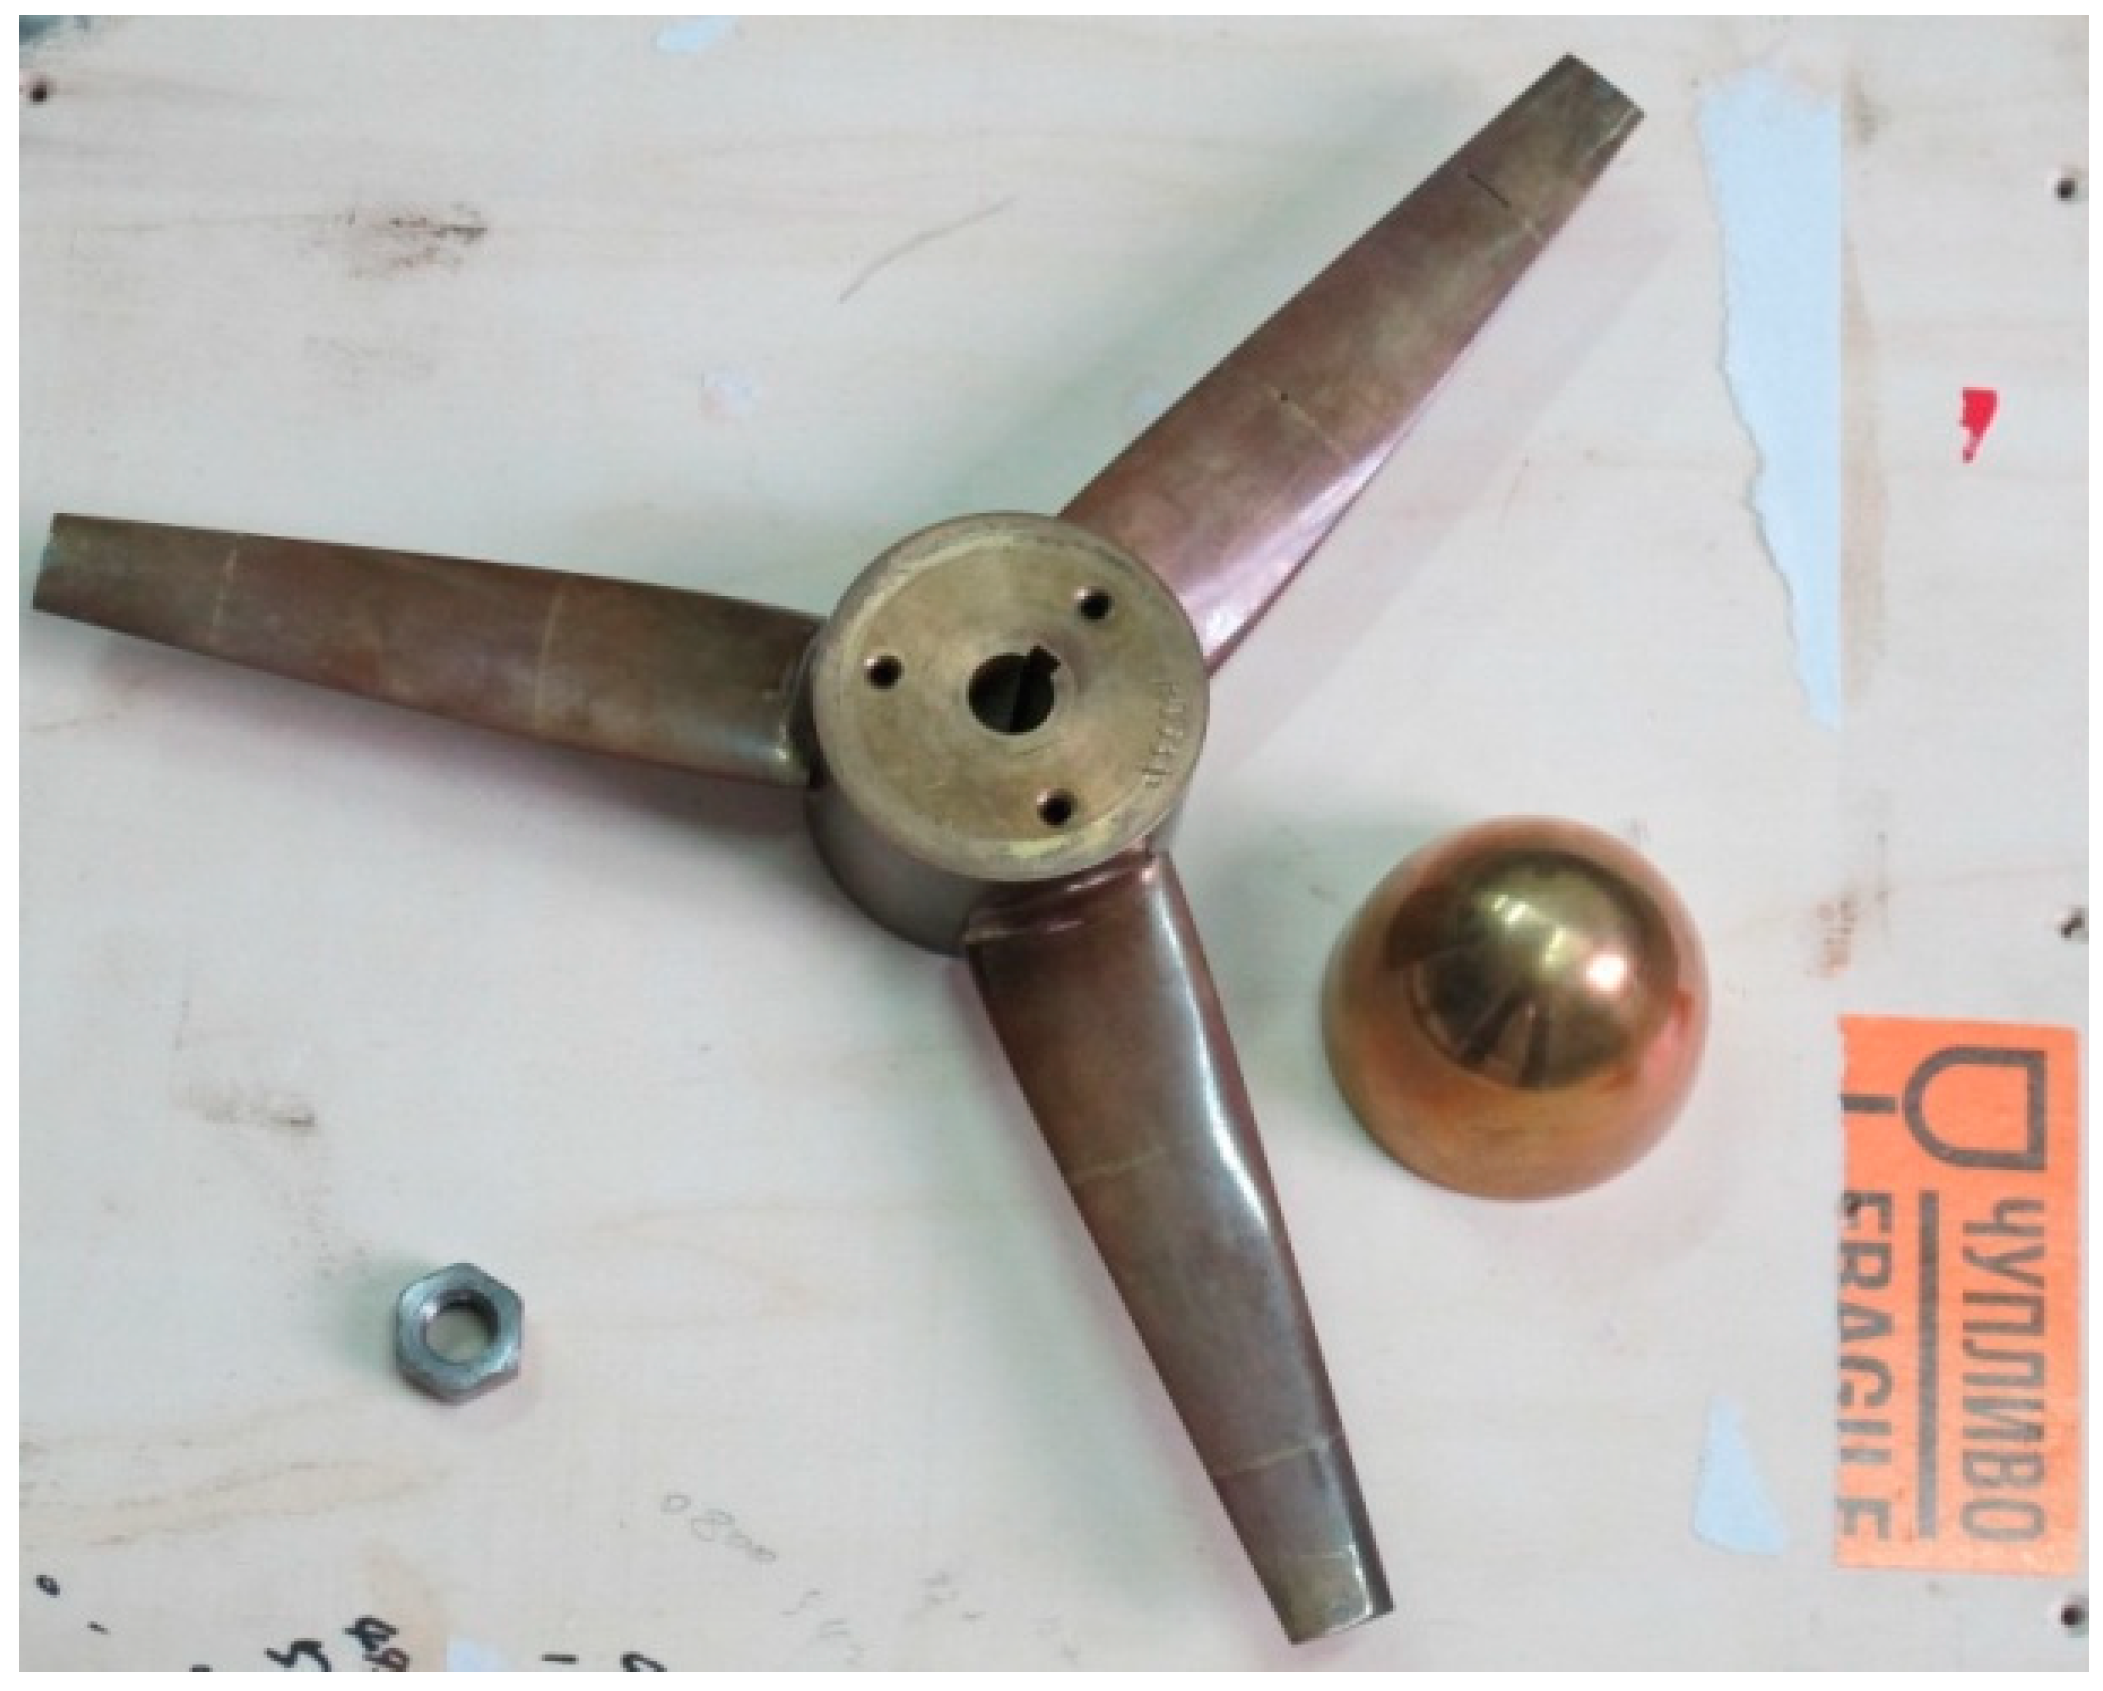
In order to validate the numerical method used in the paper, a turbine model with a diameter of 300 mm (scale factor: 33.33) was manufactured as shown in Figure 9, and tested in the Emerson Cavitation Tunnel (ECT) of Newcastle University.
3.3.1. Model Test Set-Up
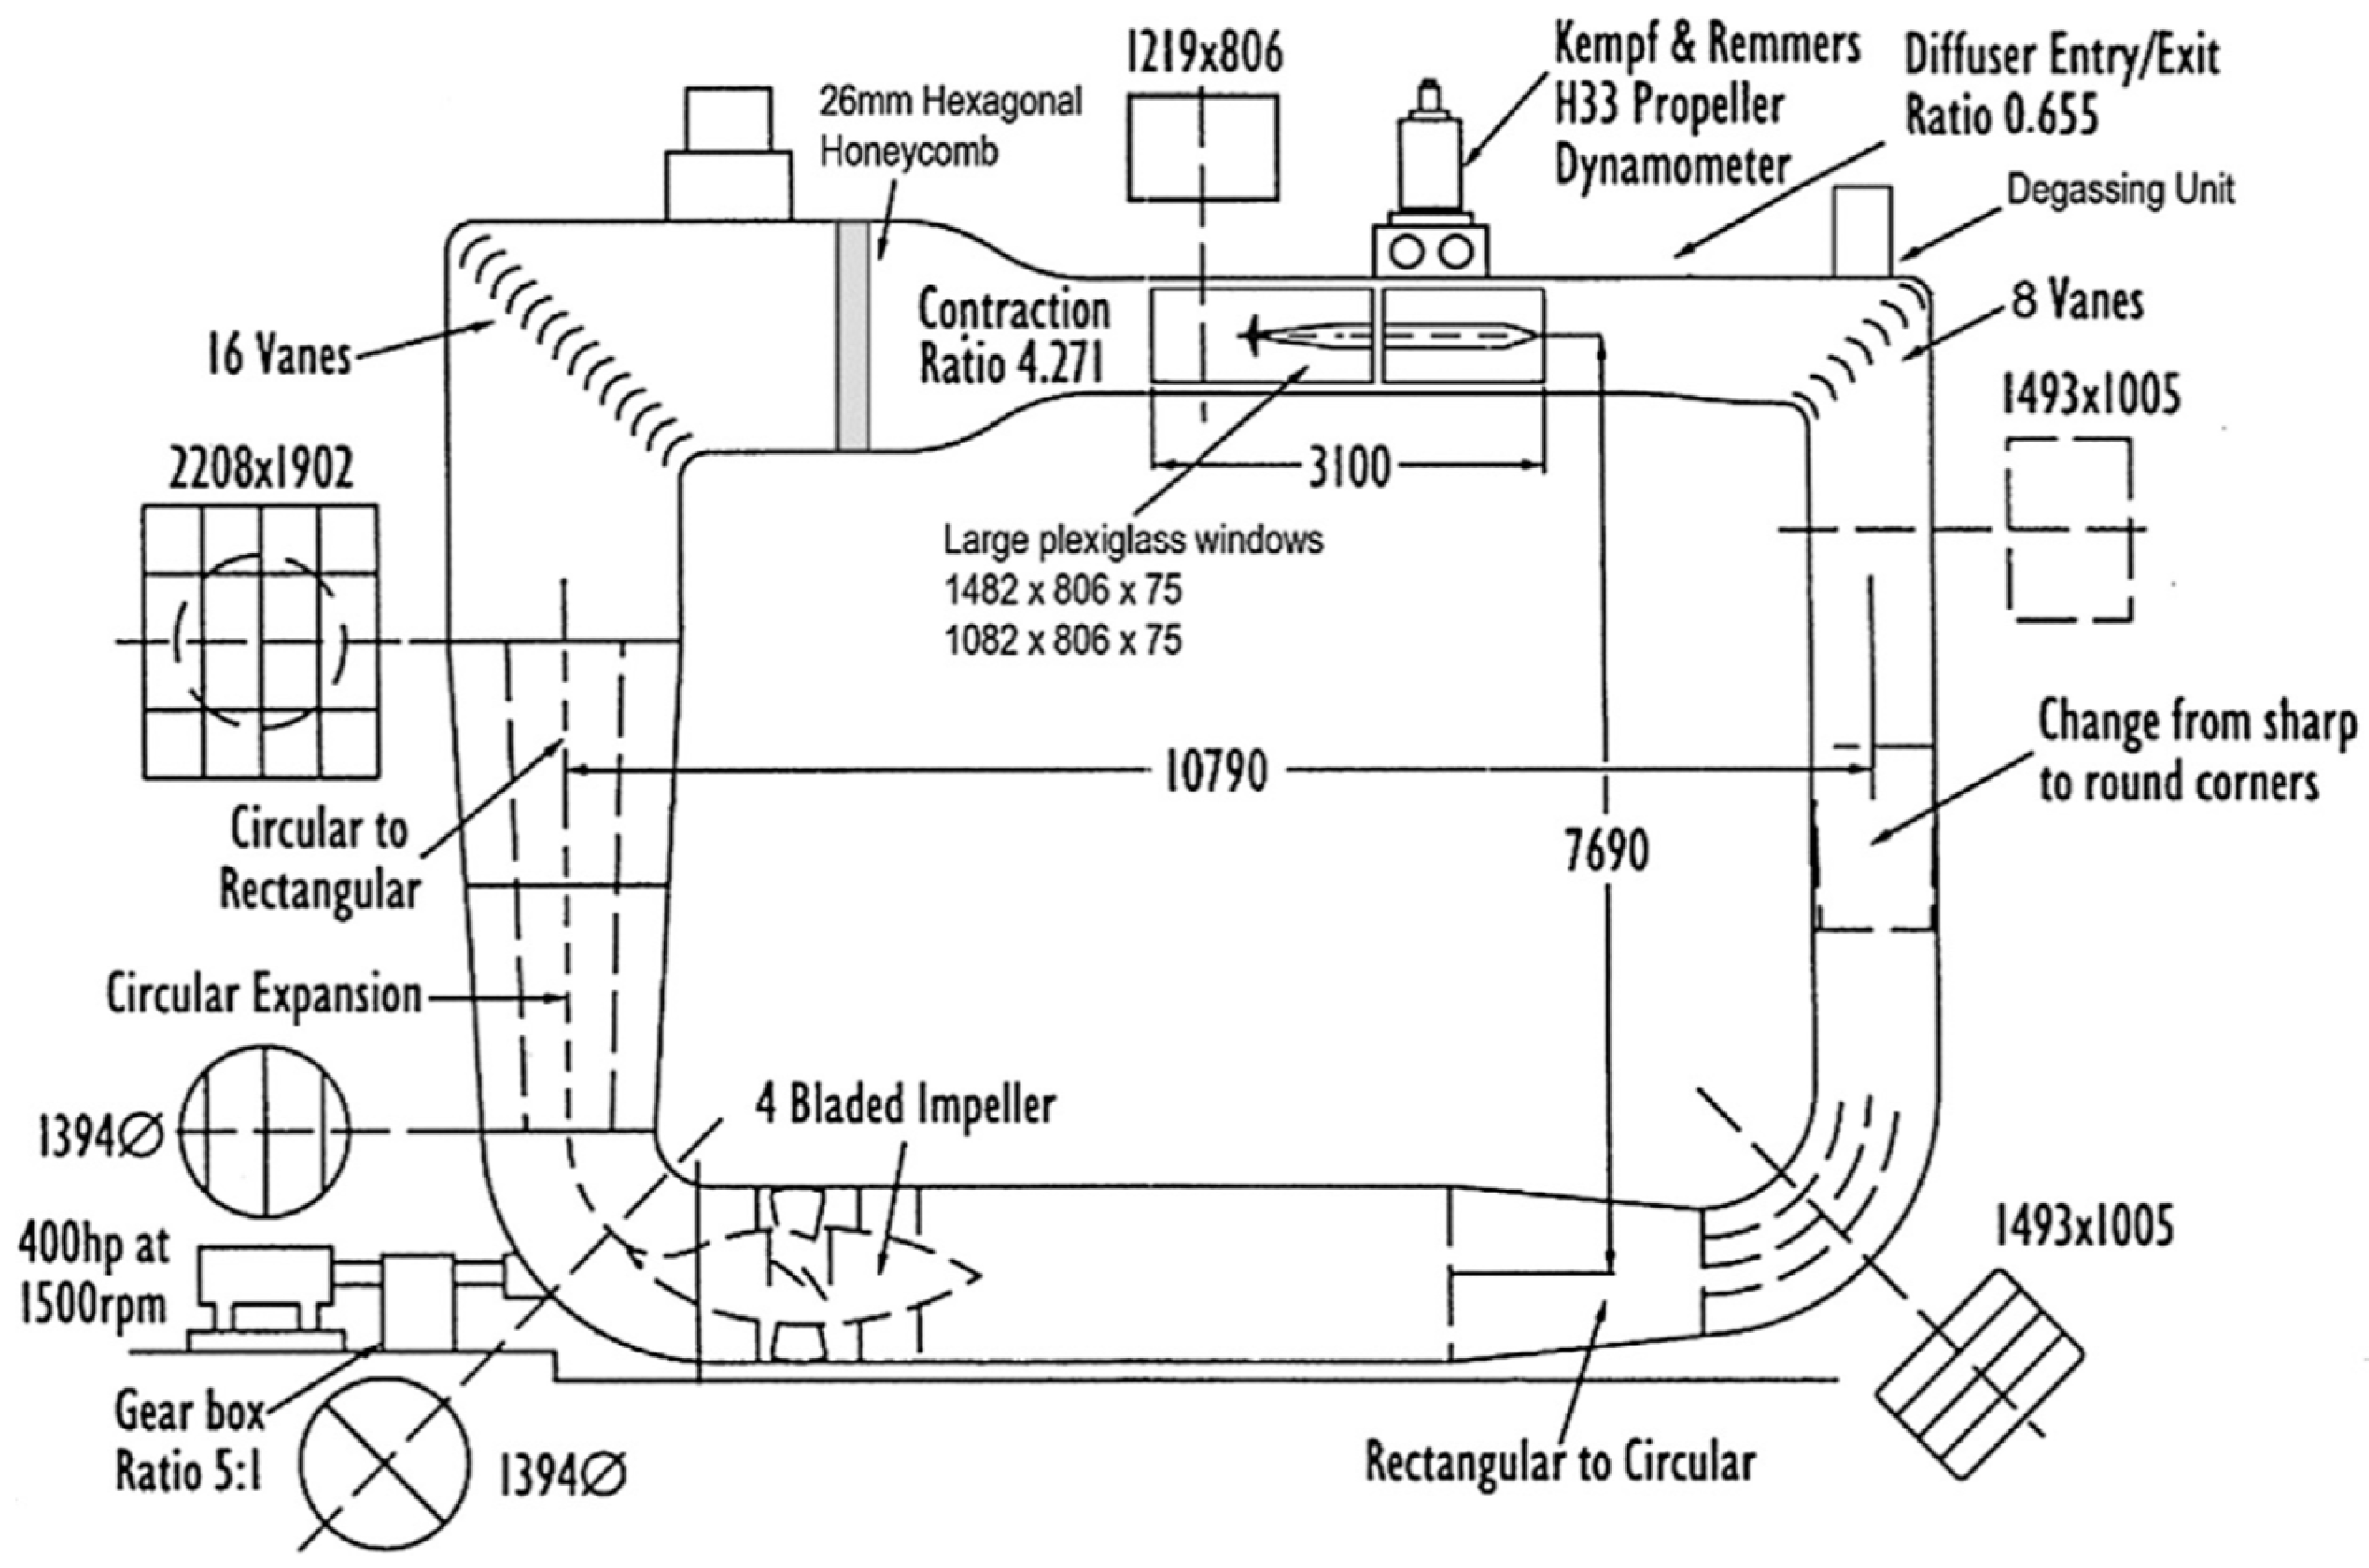
The ECT is a medium size propeller cavitation tunnel as shown in Figure 10, and the main particulars of the test section are presented in Table 7. The more detailed information of the ECT can be found in [17]. The turbine model was mounted on a dynamometer K&R H33 to measure the torque and drag, and the main technical data of the H33 are given in Table 8.
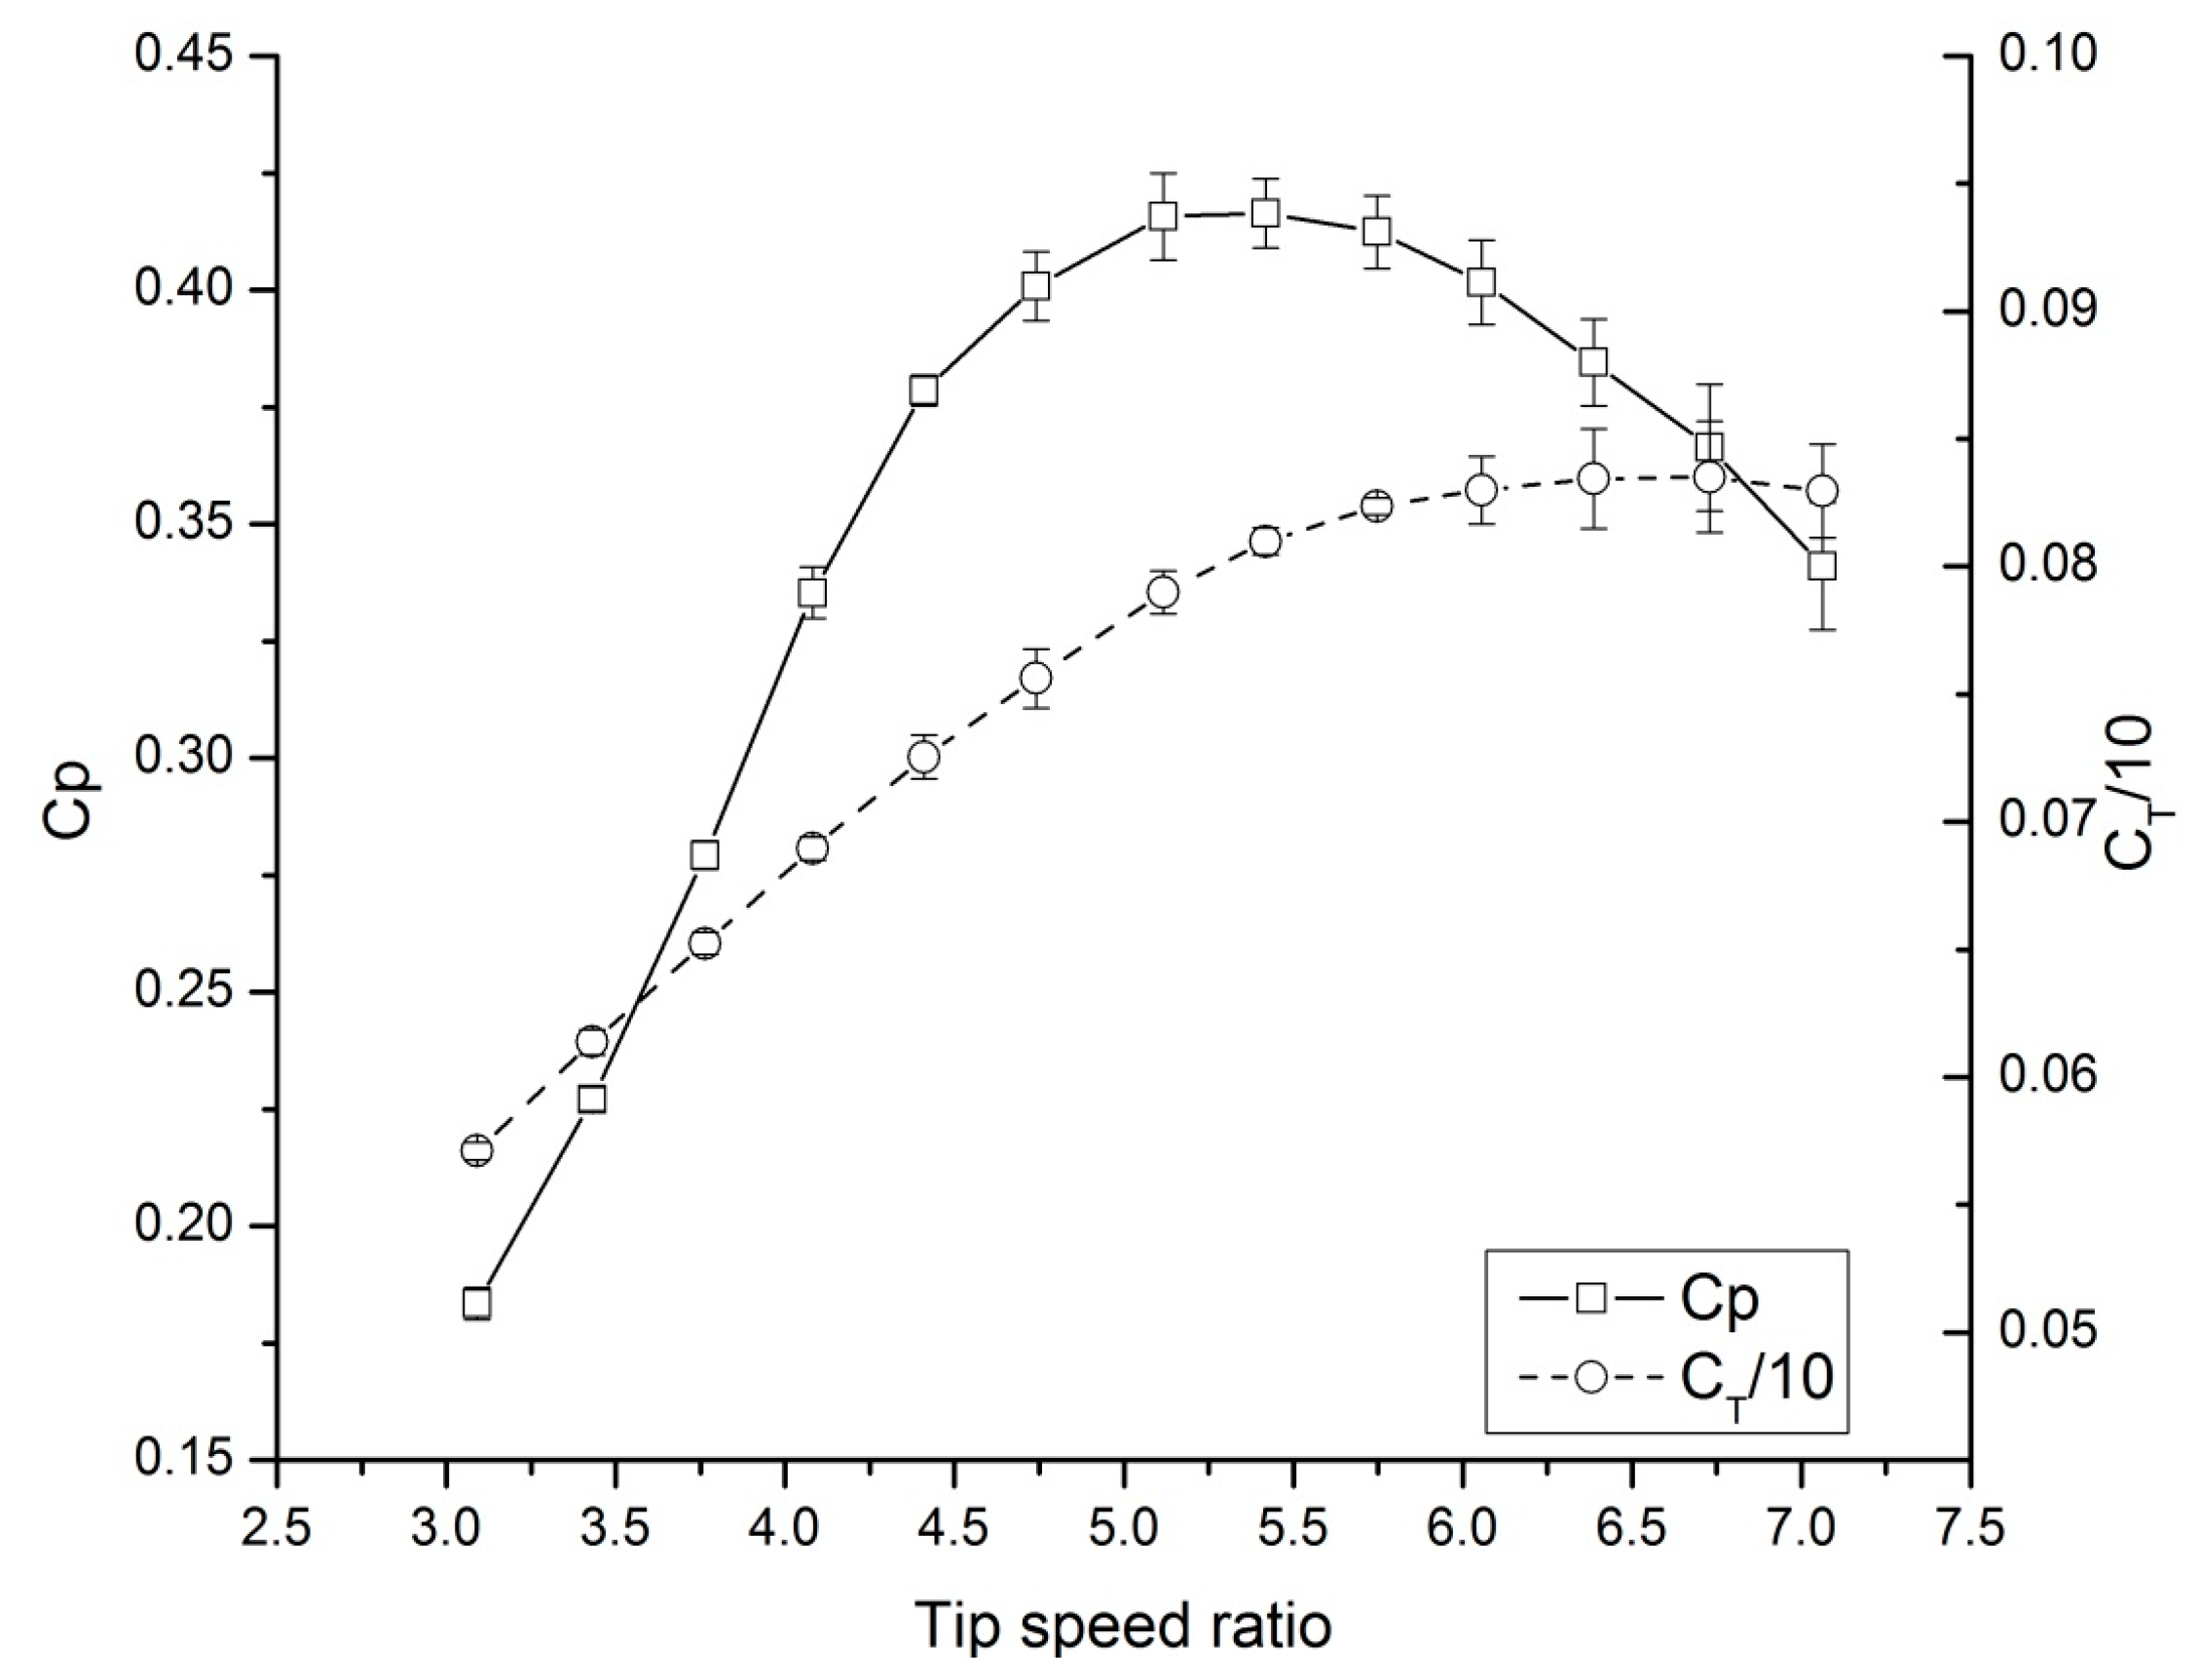
During the model tests, the flow velocity of the tunnel was fixed and the turbine rotational speed was changed to achieve the required tip speed ratio. The test was repeated three times at each tip speed ratio (TSR), and the average results were plotted and compared. The average standard deviation was around 0.7% for Cp and 1.1% for CT. A sample of the uncertainty analysis for Cp and CT/10 at 3 m/s flow speed was shown in Figure 11. As shown in this figure, the test results were quite repeatable.
3.3.2. Results of the Model Test and CFD
First of all, because of the practical limitations of the testing facility, the Re for the full-scale turbine, which is approximately 3 × 10⁶ based on the chord length at 0.7R, cannot easily be met within the model scale test. Thus, the model test could not observe the Reynolds law, which would result in a scale effect in the test results. In order to reduce the scale effect, the Re has to reach a certain level. Based on past experience of ECT, in the present model test the flow speed was set at 3 m/s to obtain about a 3 × 10⁵ Reynolds number.
In order to eliminate the influence of the scale effect, the performance of a turbine model with a diameter of 300 mm was evaluated on the basis of STAR-CCM+ to validate the method of numerical simulation. The same numerical simulation method was adopted, as described in Section 3.2.
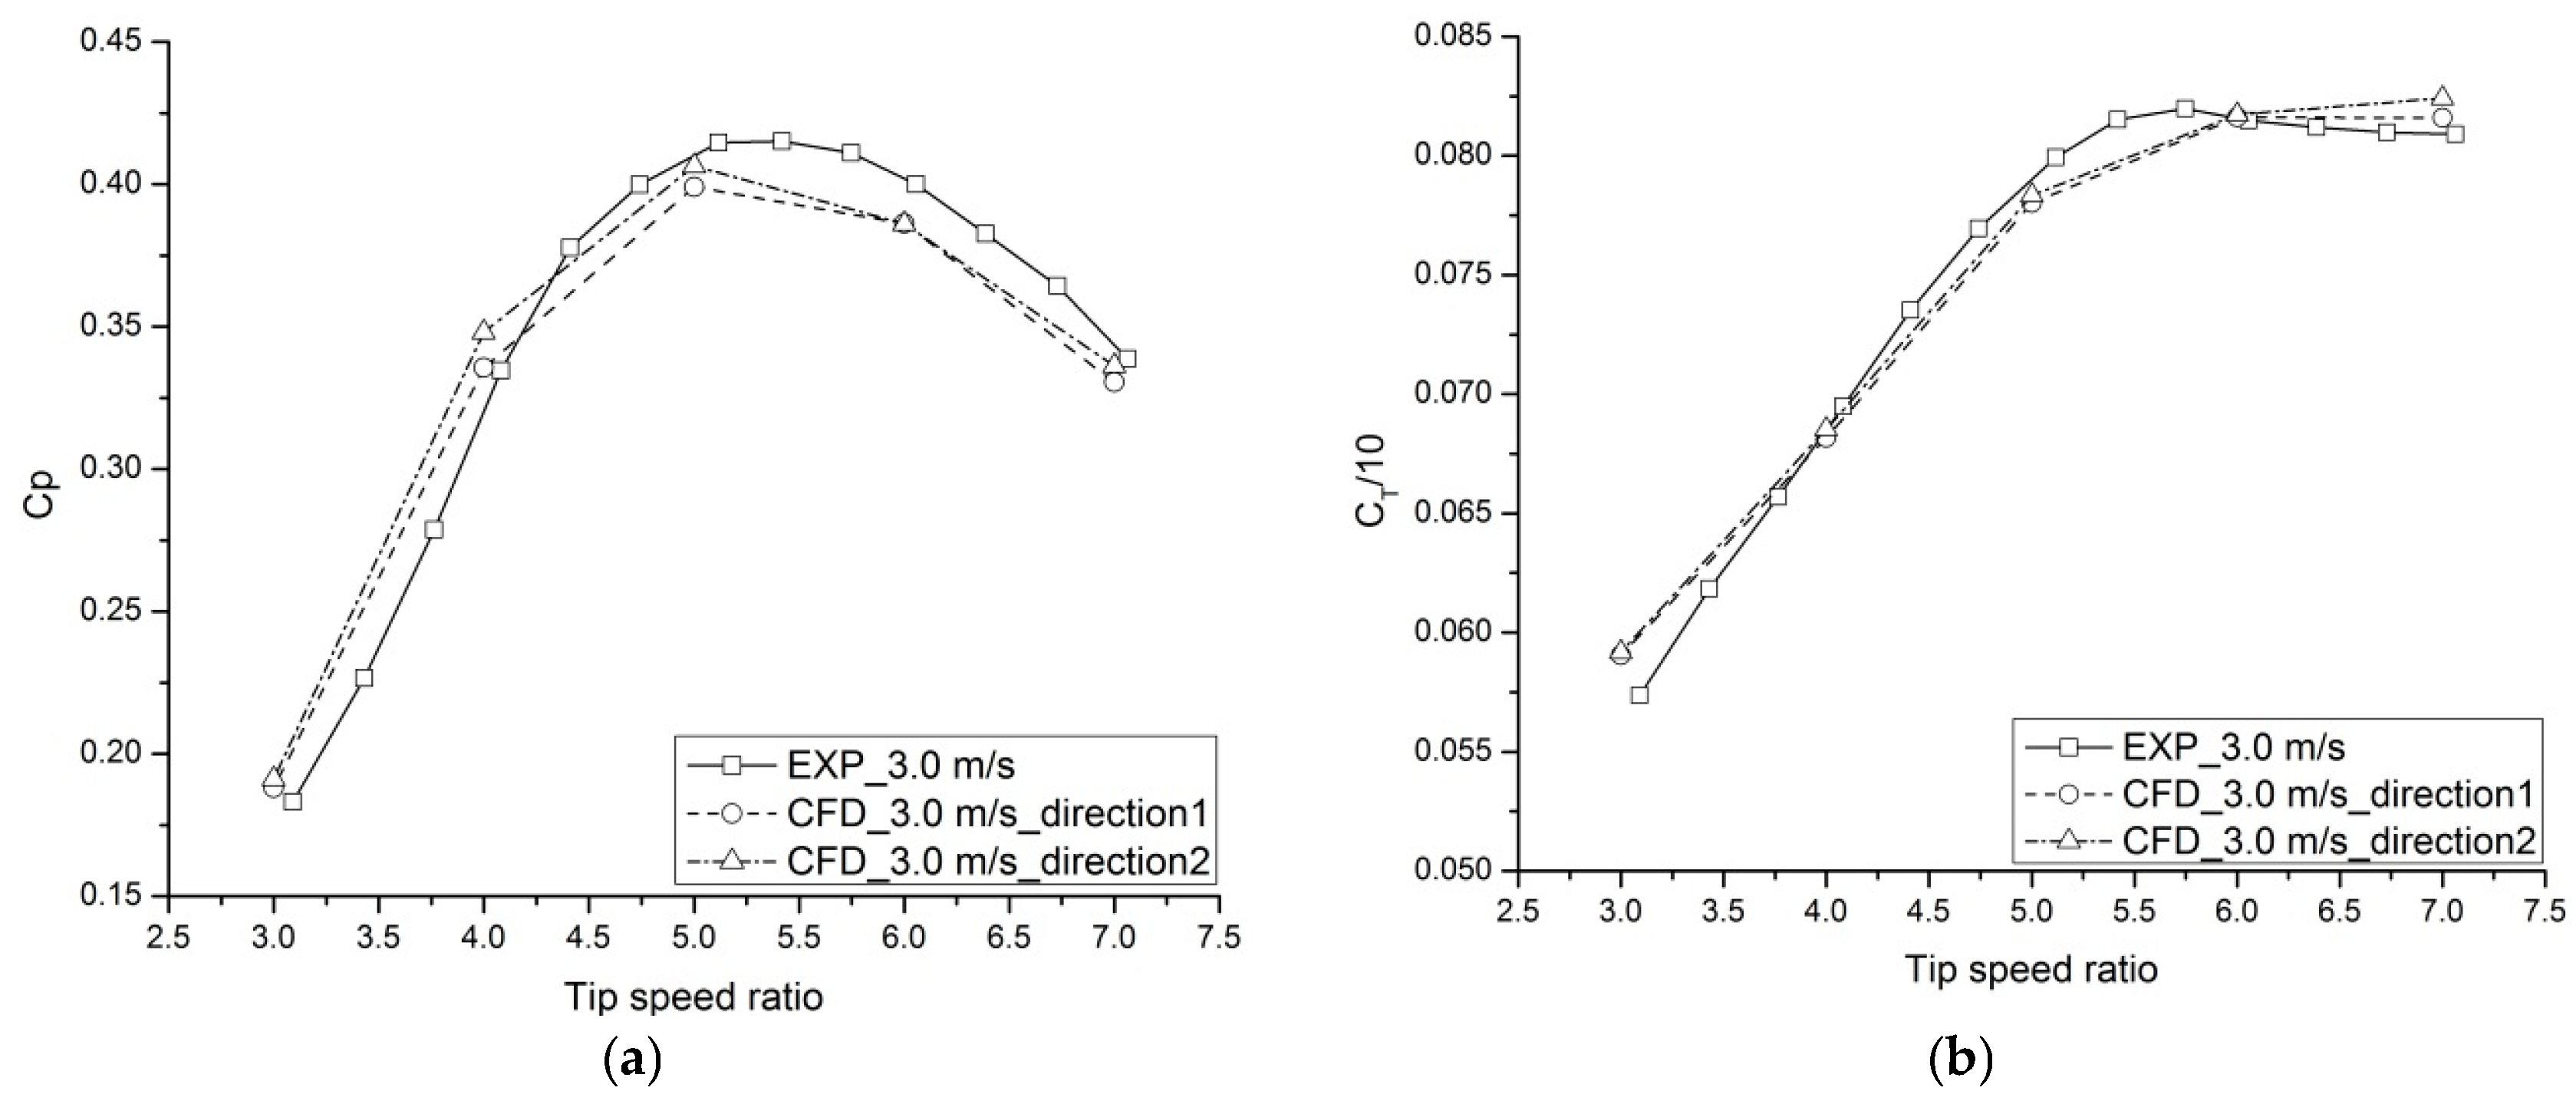
The results of the numerical simulations and model tests are given in Figure 12a,b. In this figure, it can be seen that the curve trend of the numerical simulation results is consistent with that of the experimental results. The power coefficients (Cp) at the designed TSR are 0.4089 and 0.4065 in both tidal current directions, respectively, compared to the experimental result 0.4190. The drag coefficients (CT/10) at the designed TSR are 0.0780 and 0.0783 in both tidal current directions, respectively, compared to the experimental result of 0.0790. The result of the numerical simulation agreed well with that of the model tests; thus, it seems that the numerical simulation method can be adopted for the analysis of the performance of the bidirectional turbine.
3.4. Performance of the Full-Scaled Bare Turbine
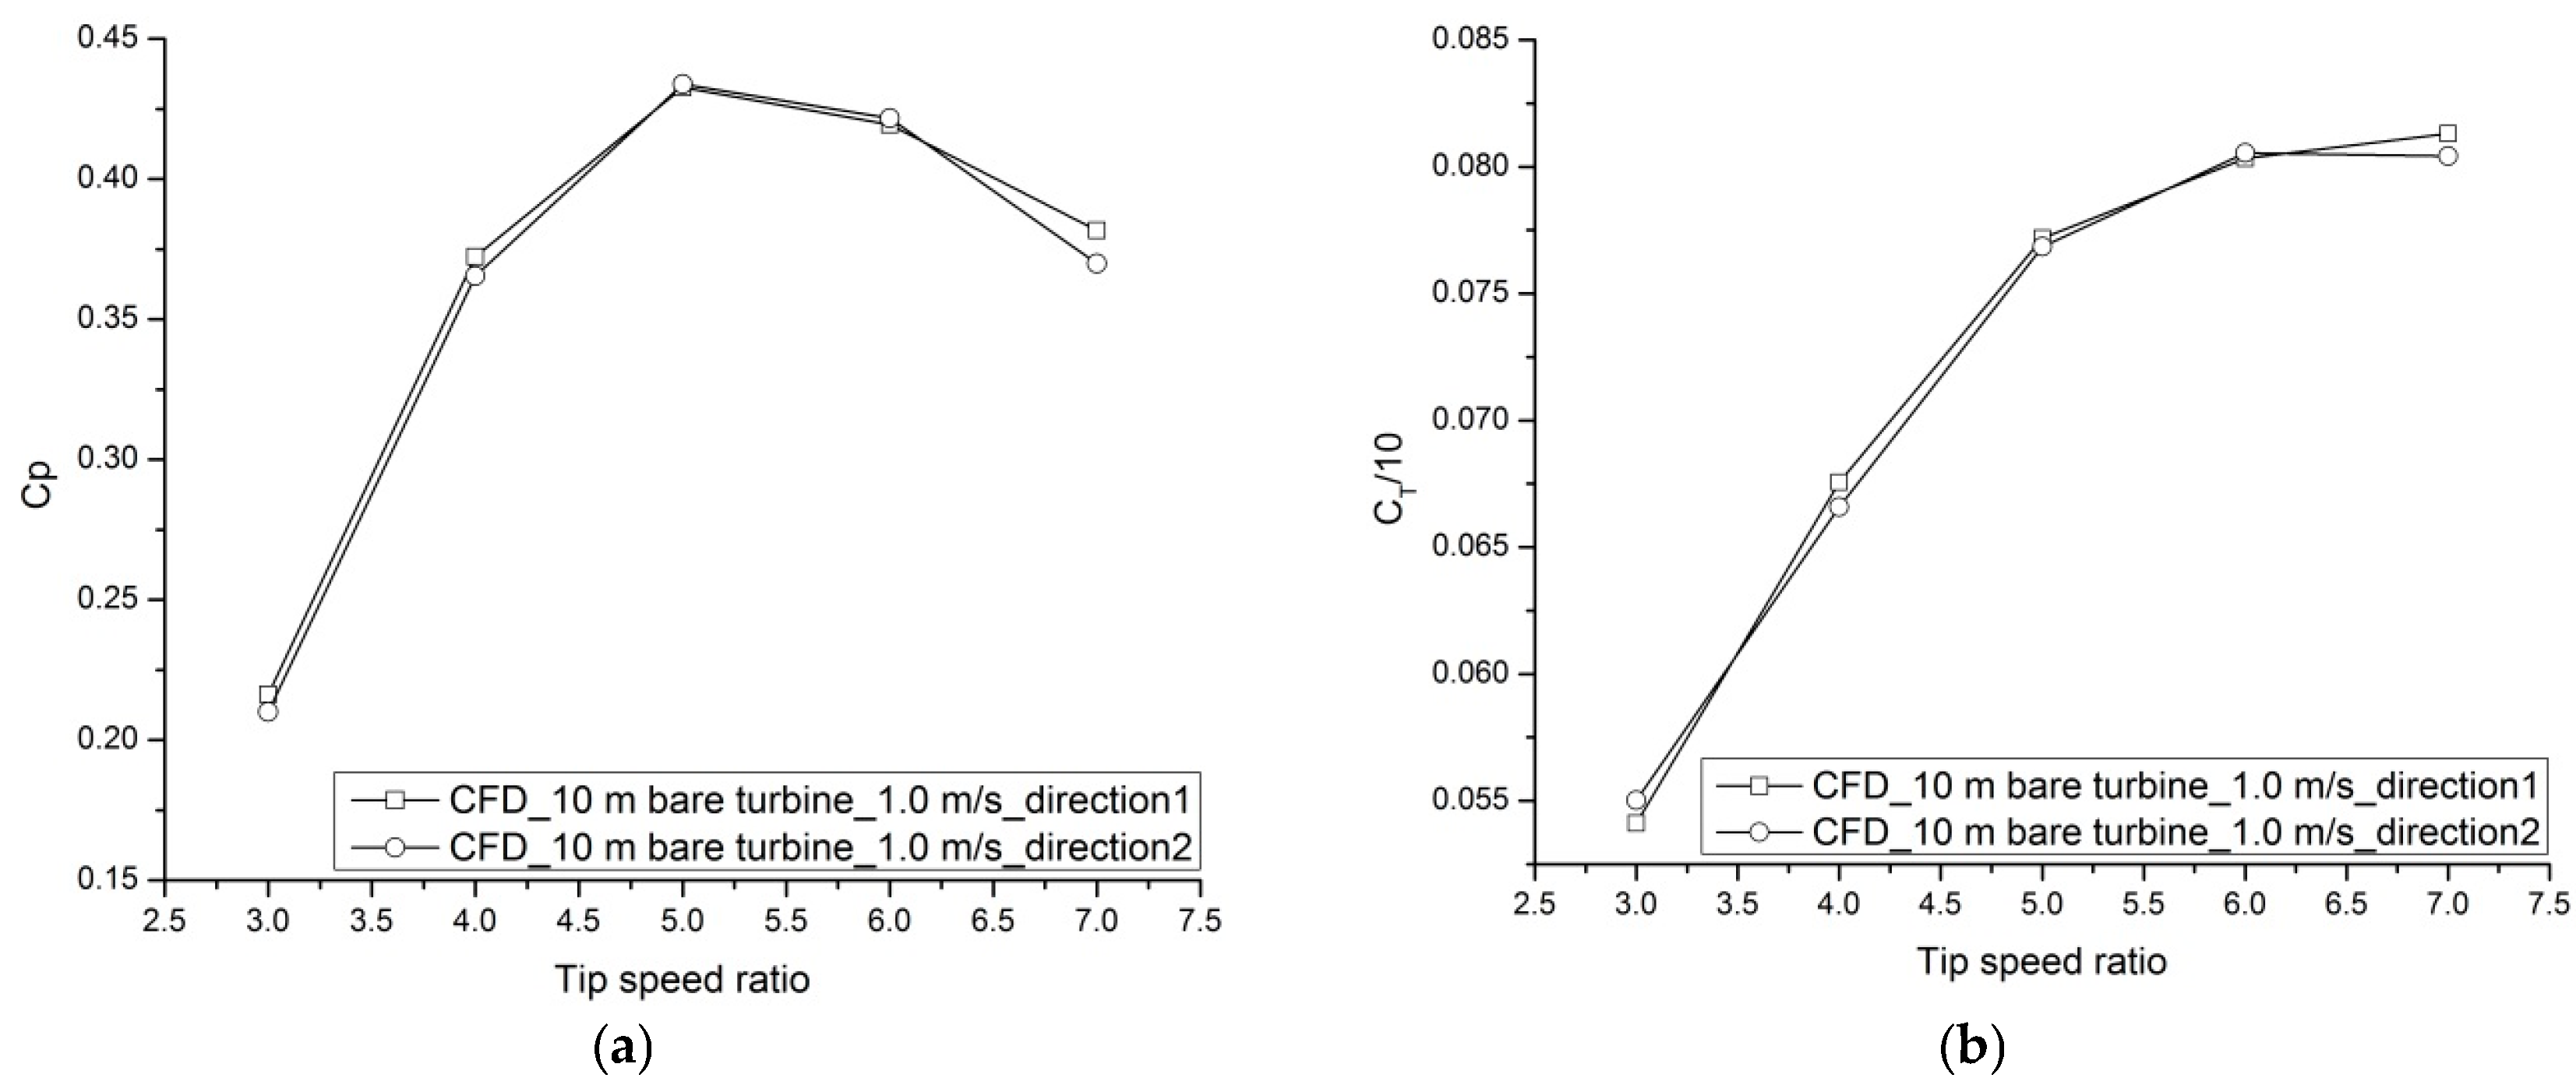
The numerical simulation results of the full-scaled bare bidirectional turbine in both tidal current directions are shown in Figure 13a,b, from which it can be seen that the power coefficients and drag coefficients are well in agreement in both tidal current directions. The maximum power coefficients (Cp) of the bidirectional turbine are approximately 0.4338 and 0.4321 at the designed TSR in both tidal current directions, respectively. The drag coefficients (CT/10) at the designed TSR are approximately 0.0772 and 0.0769, respectively. It seems that the bare turbine has nearly the same energy conversion capability in both tidal current directions.
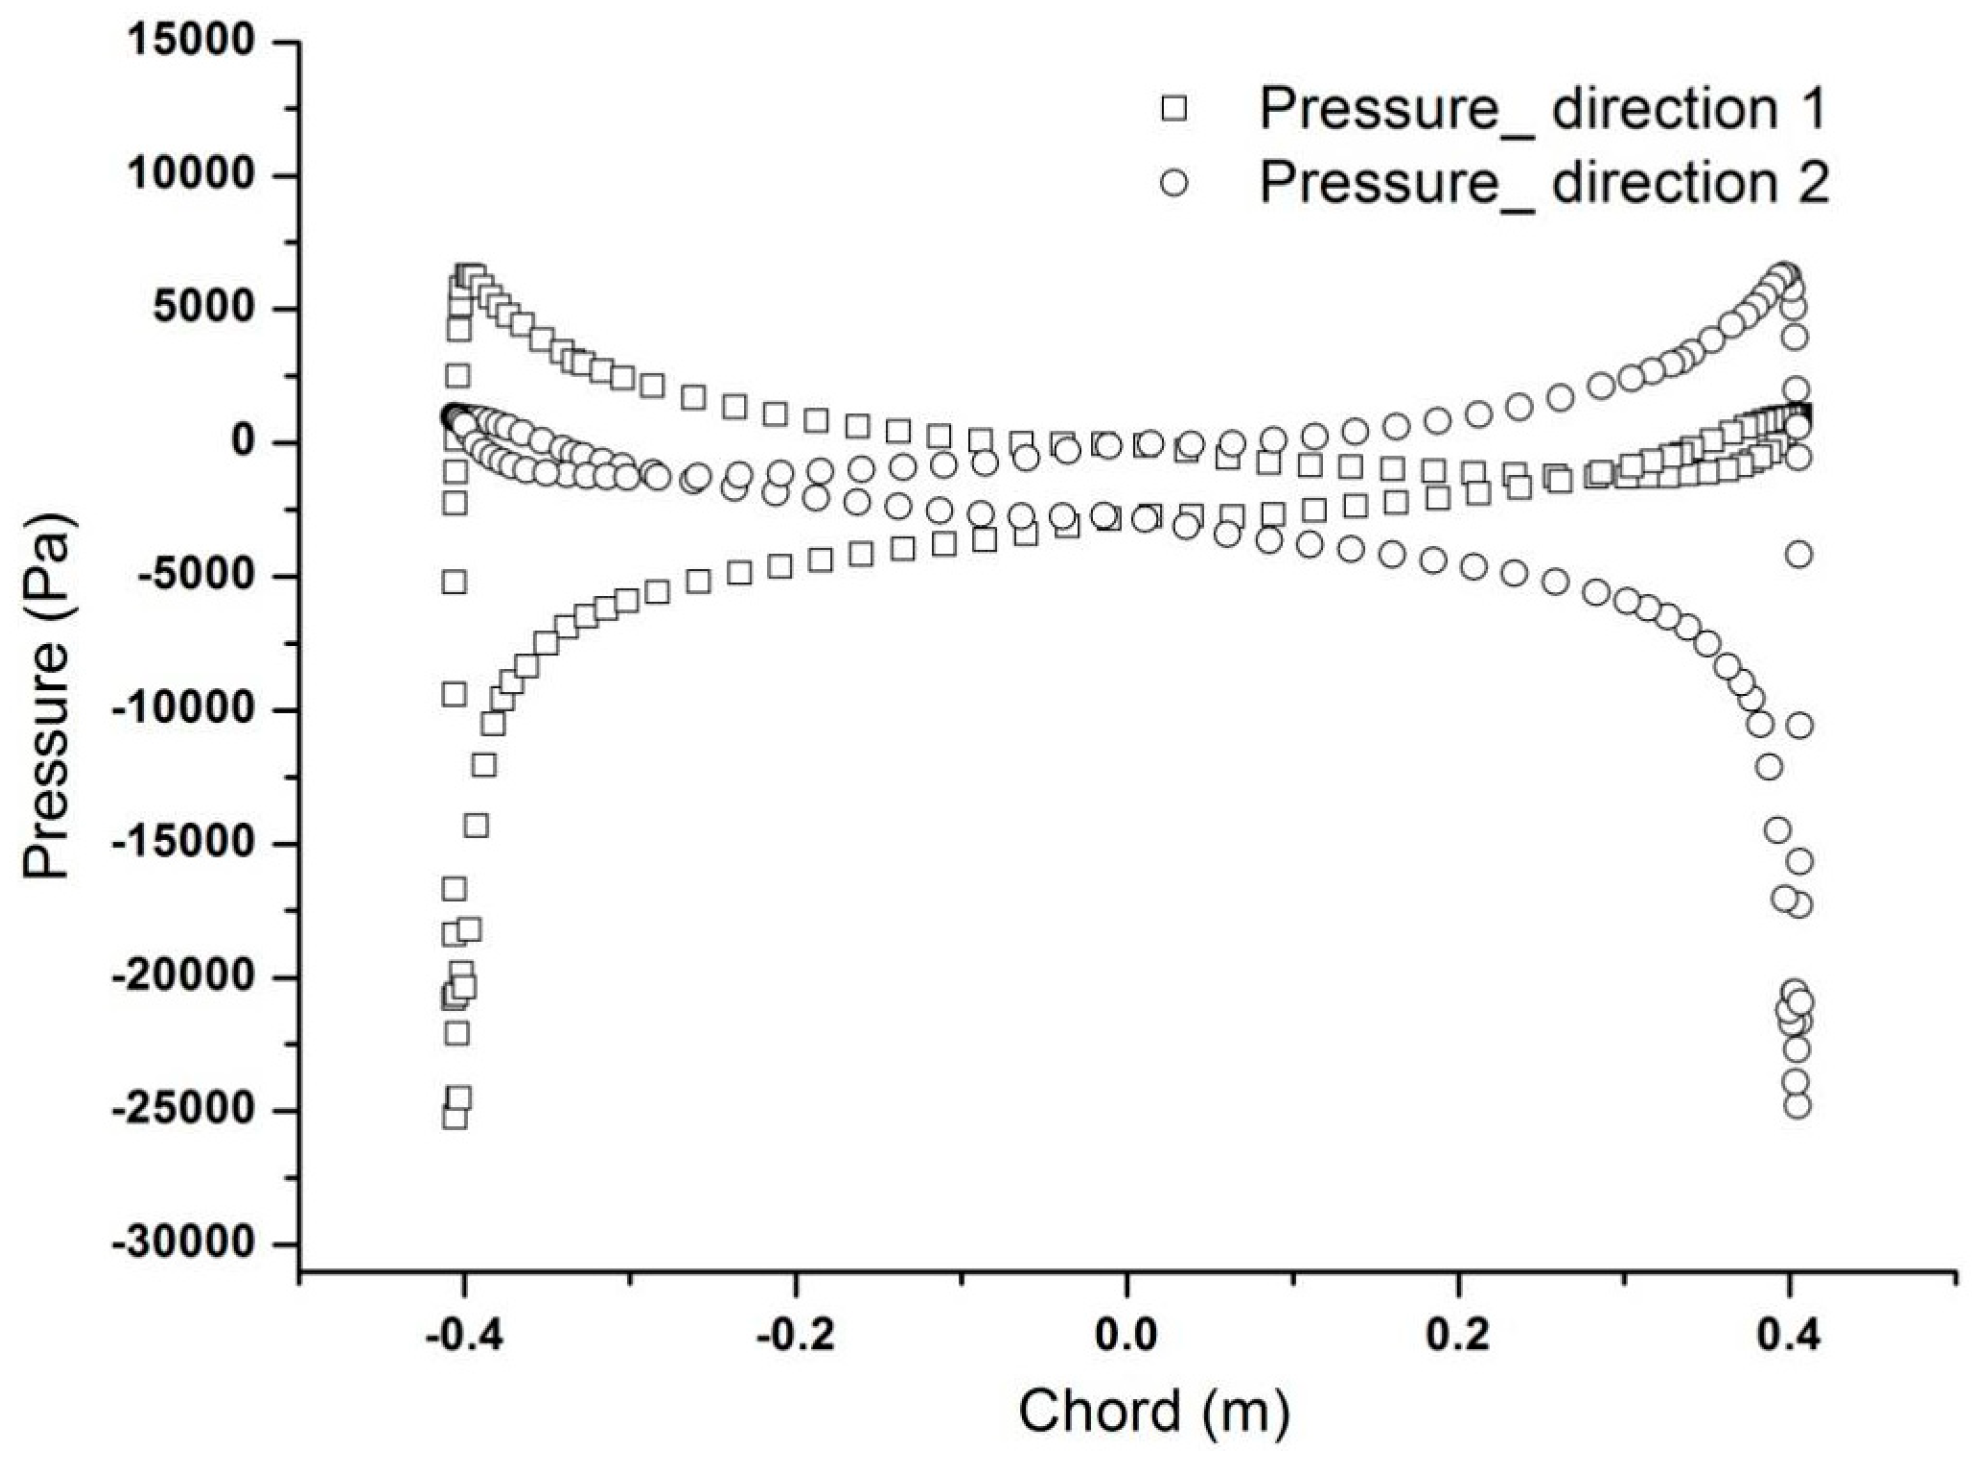
The pressure distribution of the turbine at 0.7R in both tidal current directions is given in Figure 14, from which it can be seen that the pressure distribution is almost symmetric to the axis perpendicular to the nose–tail line at the mid-chord, which further illustrates that the bidirectional turbine has nearly the same hydrodynamic performance in both tidal current directions.
By comparing the power coefficients of the full-scaled turbine and the turbine model, it can be seen that the power coefficient of the full-scaled turbine is slightly larger than that of the turbine model. This may be caused by the effect of the Reynolds number. The Reynolds number of the full-scaled turbine is approximately 3 × 10⁶ based on the chord length at 0.7R, which is larger than that of the turbine model (3 × 10⁵).
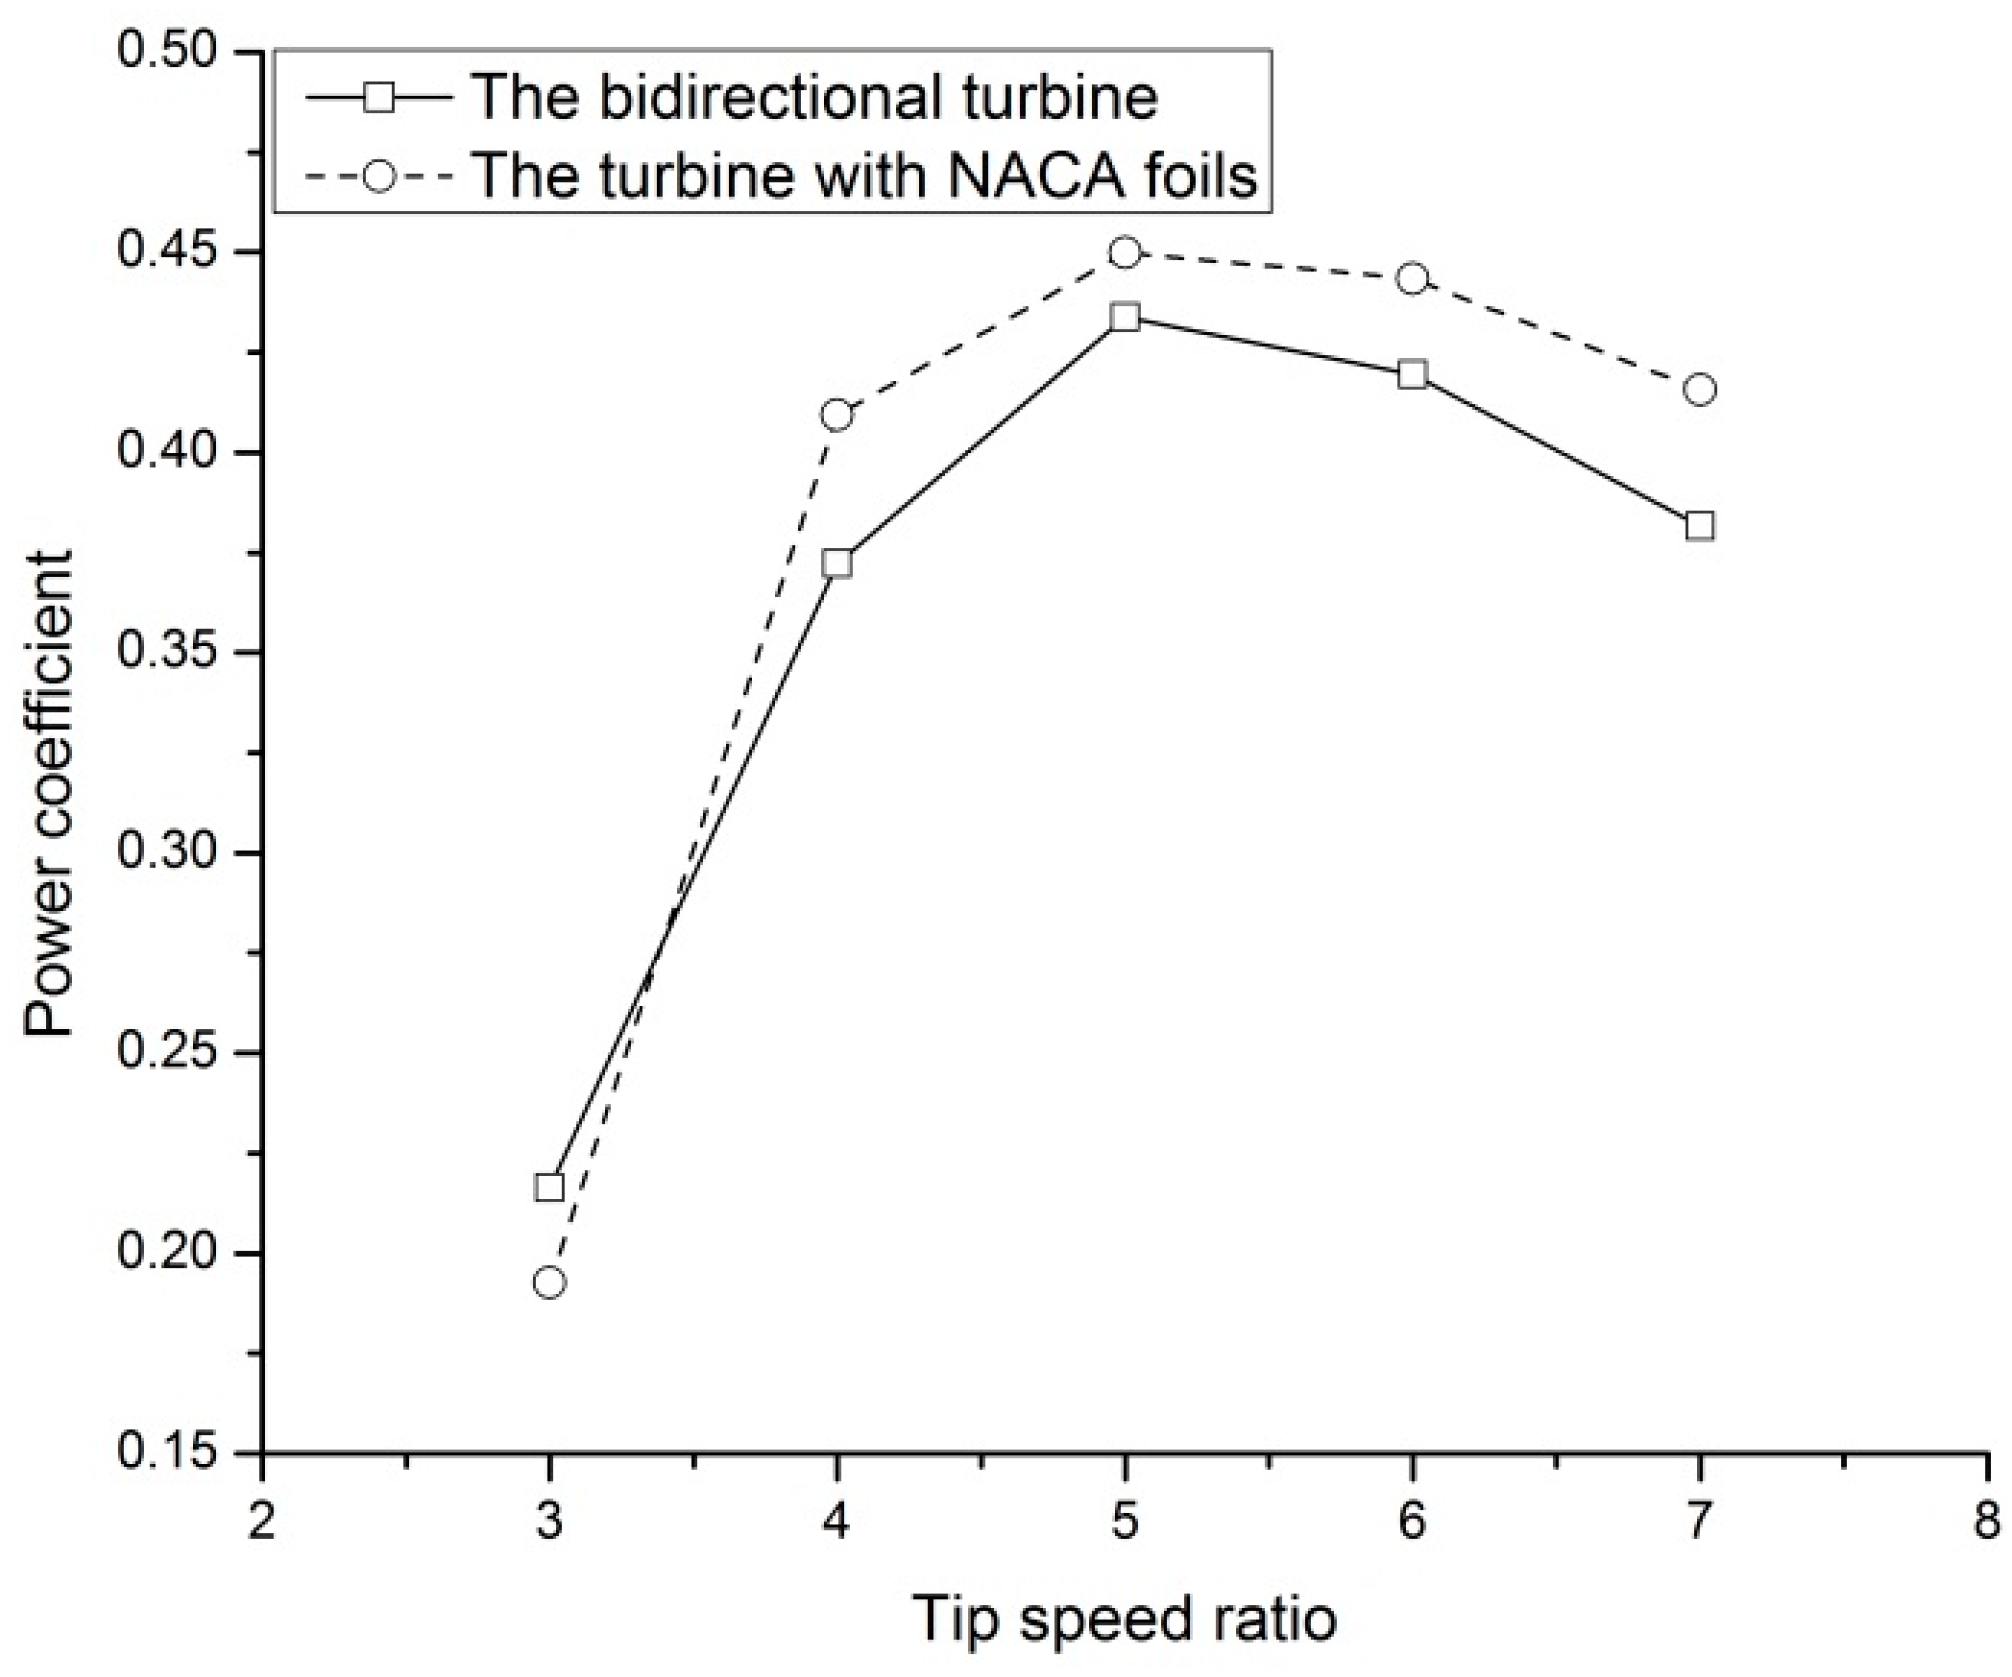
The numerical simulation results of the full-scaled turbine with NACA foils are shown in Figure 15, from which it can be seen that the power coefficients of the turbine with NACA foils are larger than that of the bidirectional turbine. At the designed tip speed ratio, the power coefficient of the turbine with NACA foils is 0.4498, which increases by 1.6% compared to the 0.4338 of the bidirectional turbine. Although the performance of the turbine with NACA foils is better than the bidirectional turbine, the bidirectional turbine has relatively higher reliability. The bidirectional turbine is characterized by low-cost installation and maintenance and can be used as an attempt for the tidal current.
4. The Mono-Pile Effect on the Performance of the Bidirectional Turbine
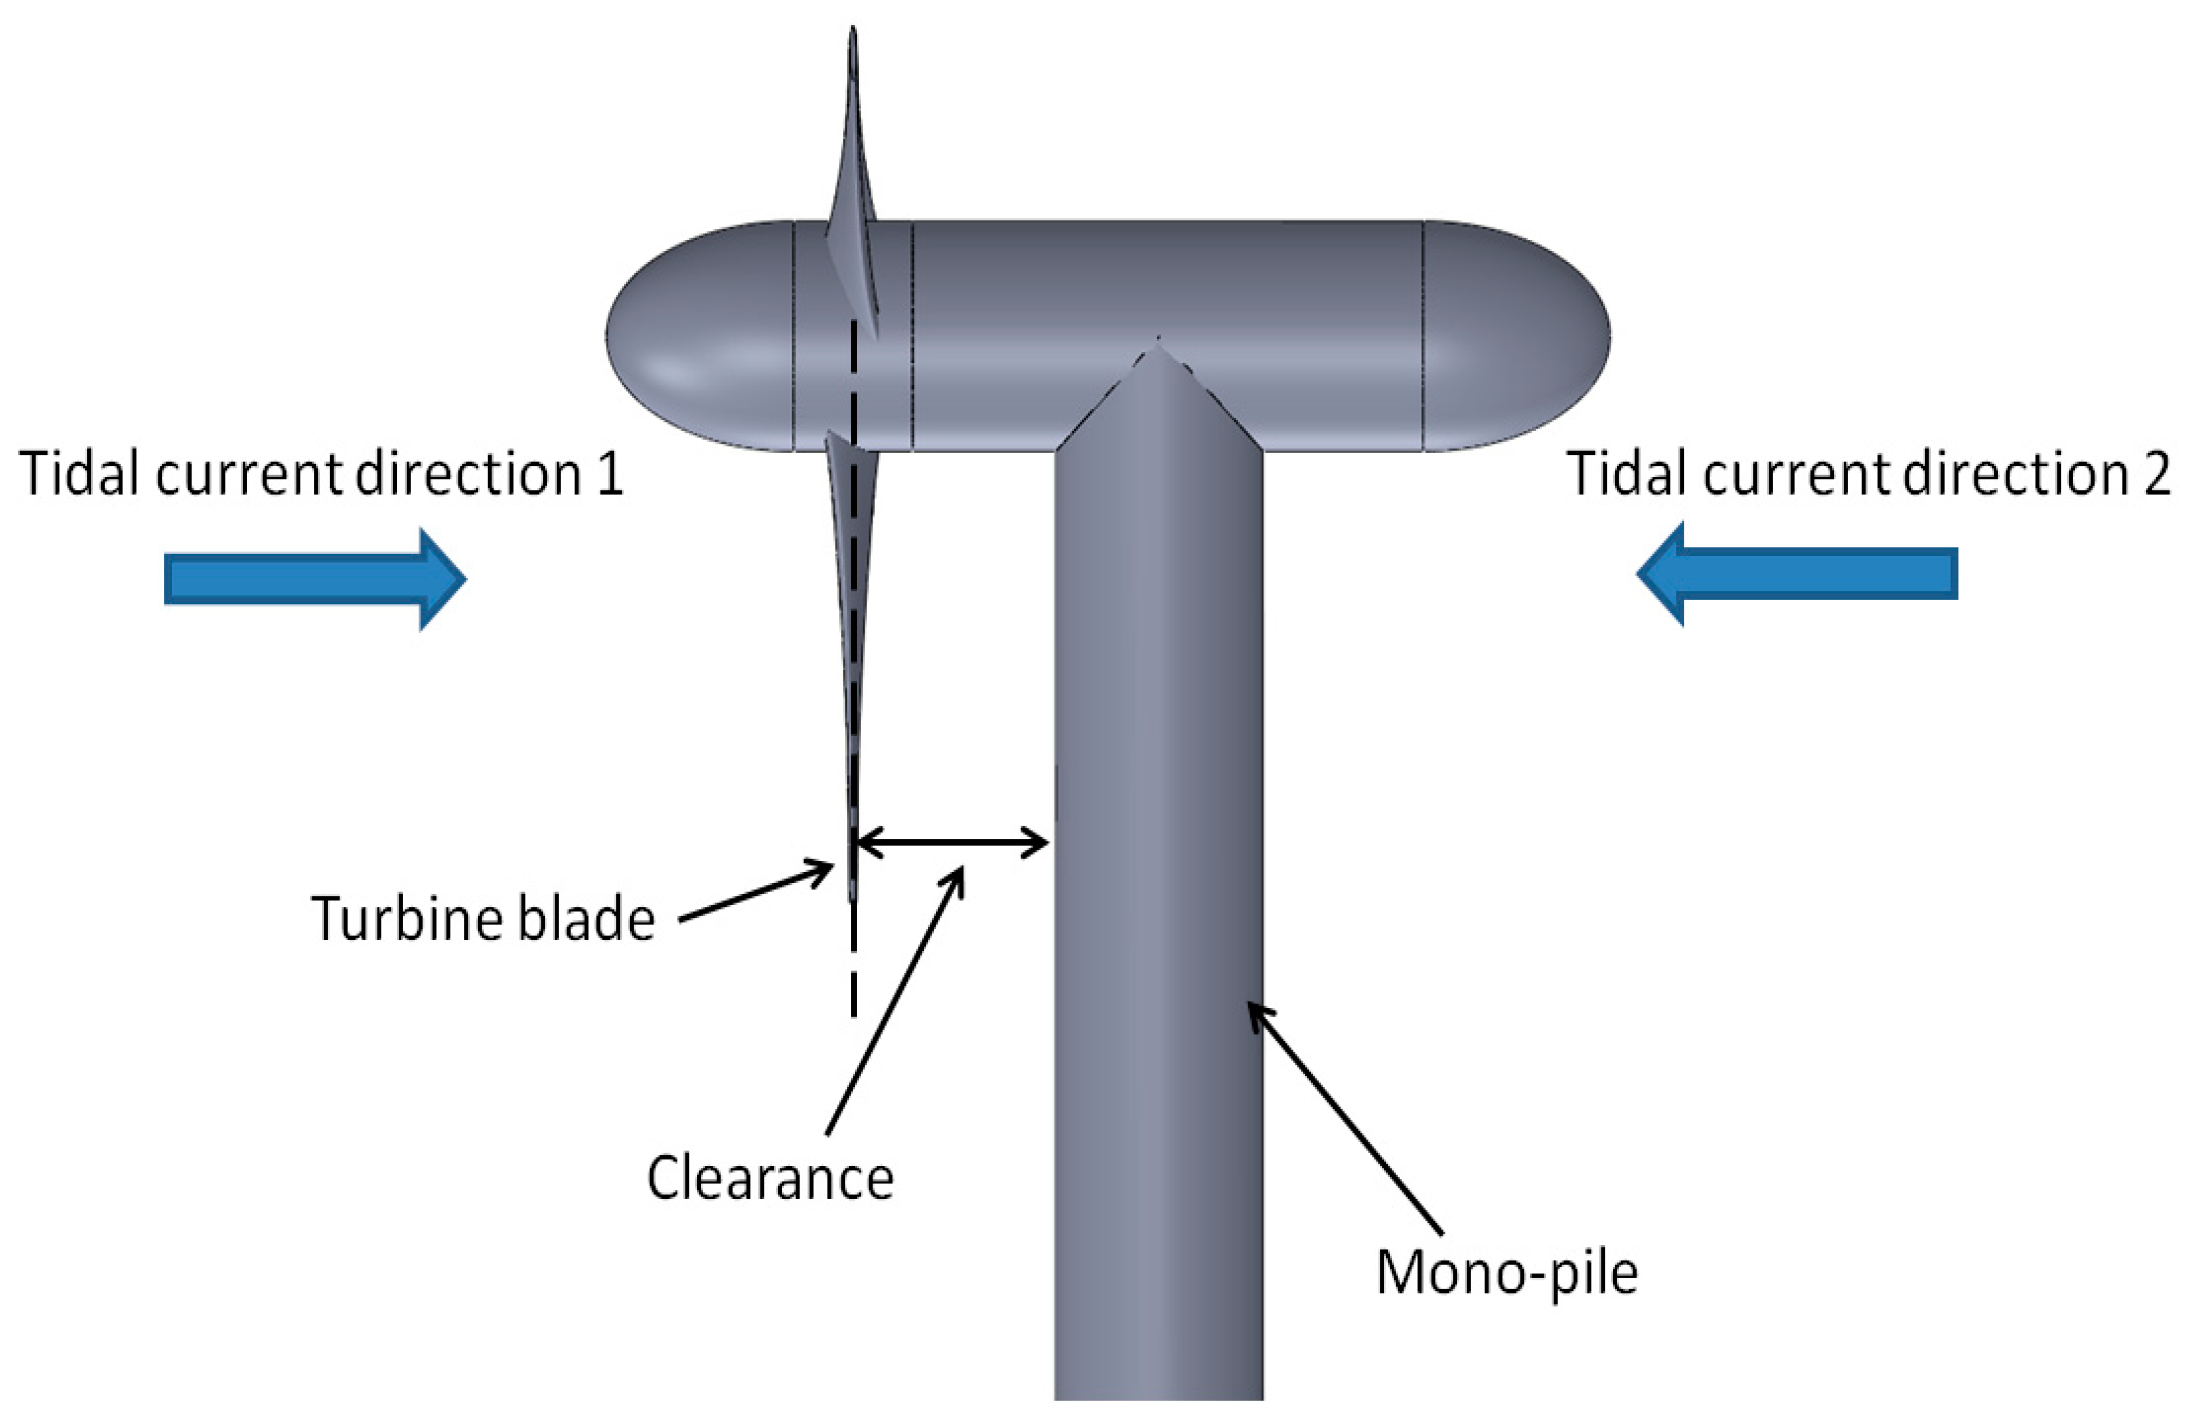
The effect of the mono-pile on the full-scaled turbine’s performance is presented in this section. A sketch presenting the turbine, mono-pile, clearance and flow direction is shown in Figure 16. Although a mono-pile with an elliptical or hydrofoil cross-section could be argued to provide the optimal mono-pile design, a circular mono-pile would be easier to manufacture, so that the circular mono-pile is proposed as the mono-pile design in this paper.
The diameter of the mono-pile (DS) is 2.0 m, which is defined as the reference length to describe the clearance. In Figure 16, it can be seen that the mono-pile is downstream of the turbine in tidal current direction 1, and it is upstream of the turbine in tidal current direction 2. The clearances were set to 0.75 DS (1.5 m), 1 DS (2.0 m), 1.25 DS (2.5 m), 1.5 DS (3.0 m), 1.75 DS (3.5 m), 2.25 DS (4.5 m), 2.75 DS (5.5 m), 3.25 DS (6.5 m) and 3.75 DS (7.5 m).
In this paper, the effect of the mono-pile on the turbine’s performance was studied based on the steady-state and the transient CFD model. First, the steady-state CFD model was used to determine the effect of mono-pile clearance on the turbine’s performance. Then, the transient CFD model was used to determine the time-dependent variables for the turbine.
The validation described in Section 3.3 provides confidence in the numerical simulation results. Whilst those validations are performed for the bare turbine, the turbine geometry has been maintained. The same domain specifications as well as similar analysis parameters were also utilized, giving confidence in the validity of these CFD results for the turbine with a mono-pile.
4.1. The Steady-State Study and Analysis
The steady-state CFD model is used to determine the effect of mono-pile clearance on the turbine’s performance. The use of a steady-state model is made as it is relatively inexpensive computationally and achieves a sufficient accuracy to provide generic performance criteria. The limitations of the steady-state model are due to their removal of higher order “time-dependent” terms in the solver.
As described in Section 3.3, the bare bidirectional turbine has the largest energy conversion efficiency when the tip speed ratio is around 5. Therefore, the effect of the mono-pile on the turbine’s performance is studied first at varied clearances when the tip speed ratio is fixed at 5.
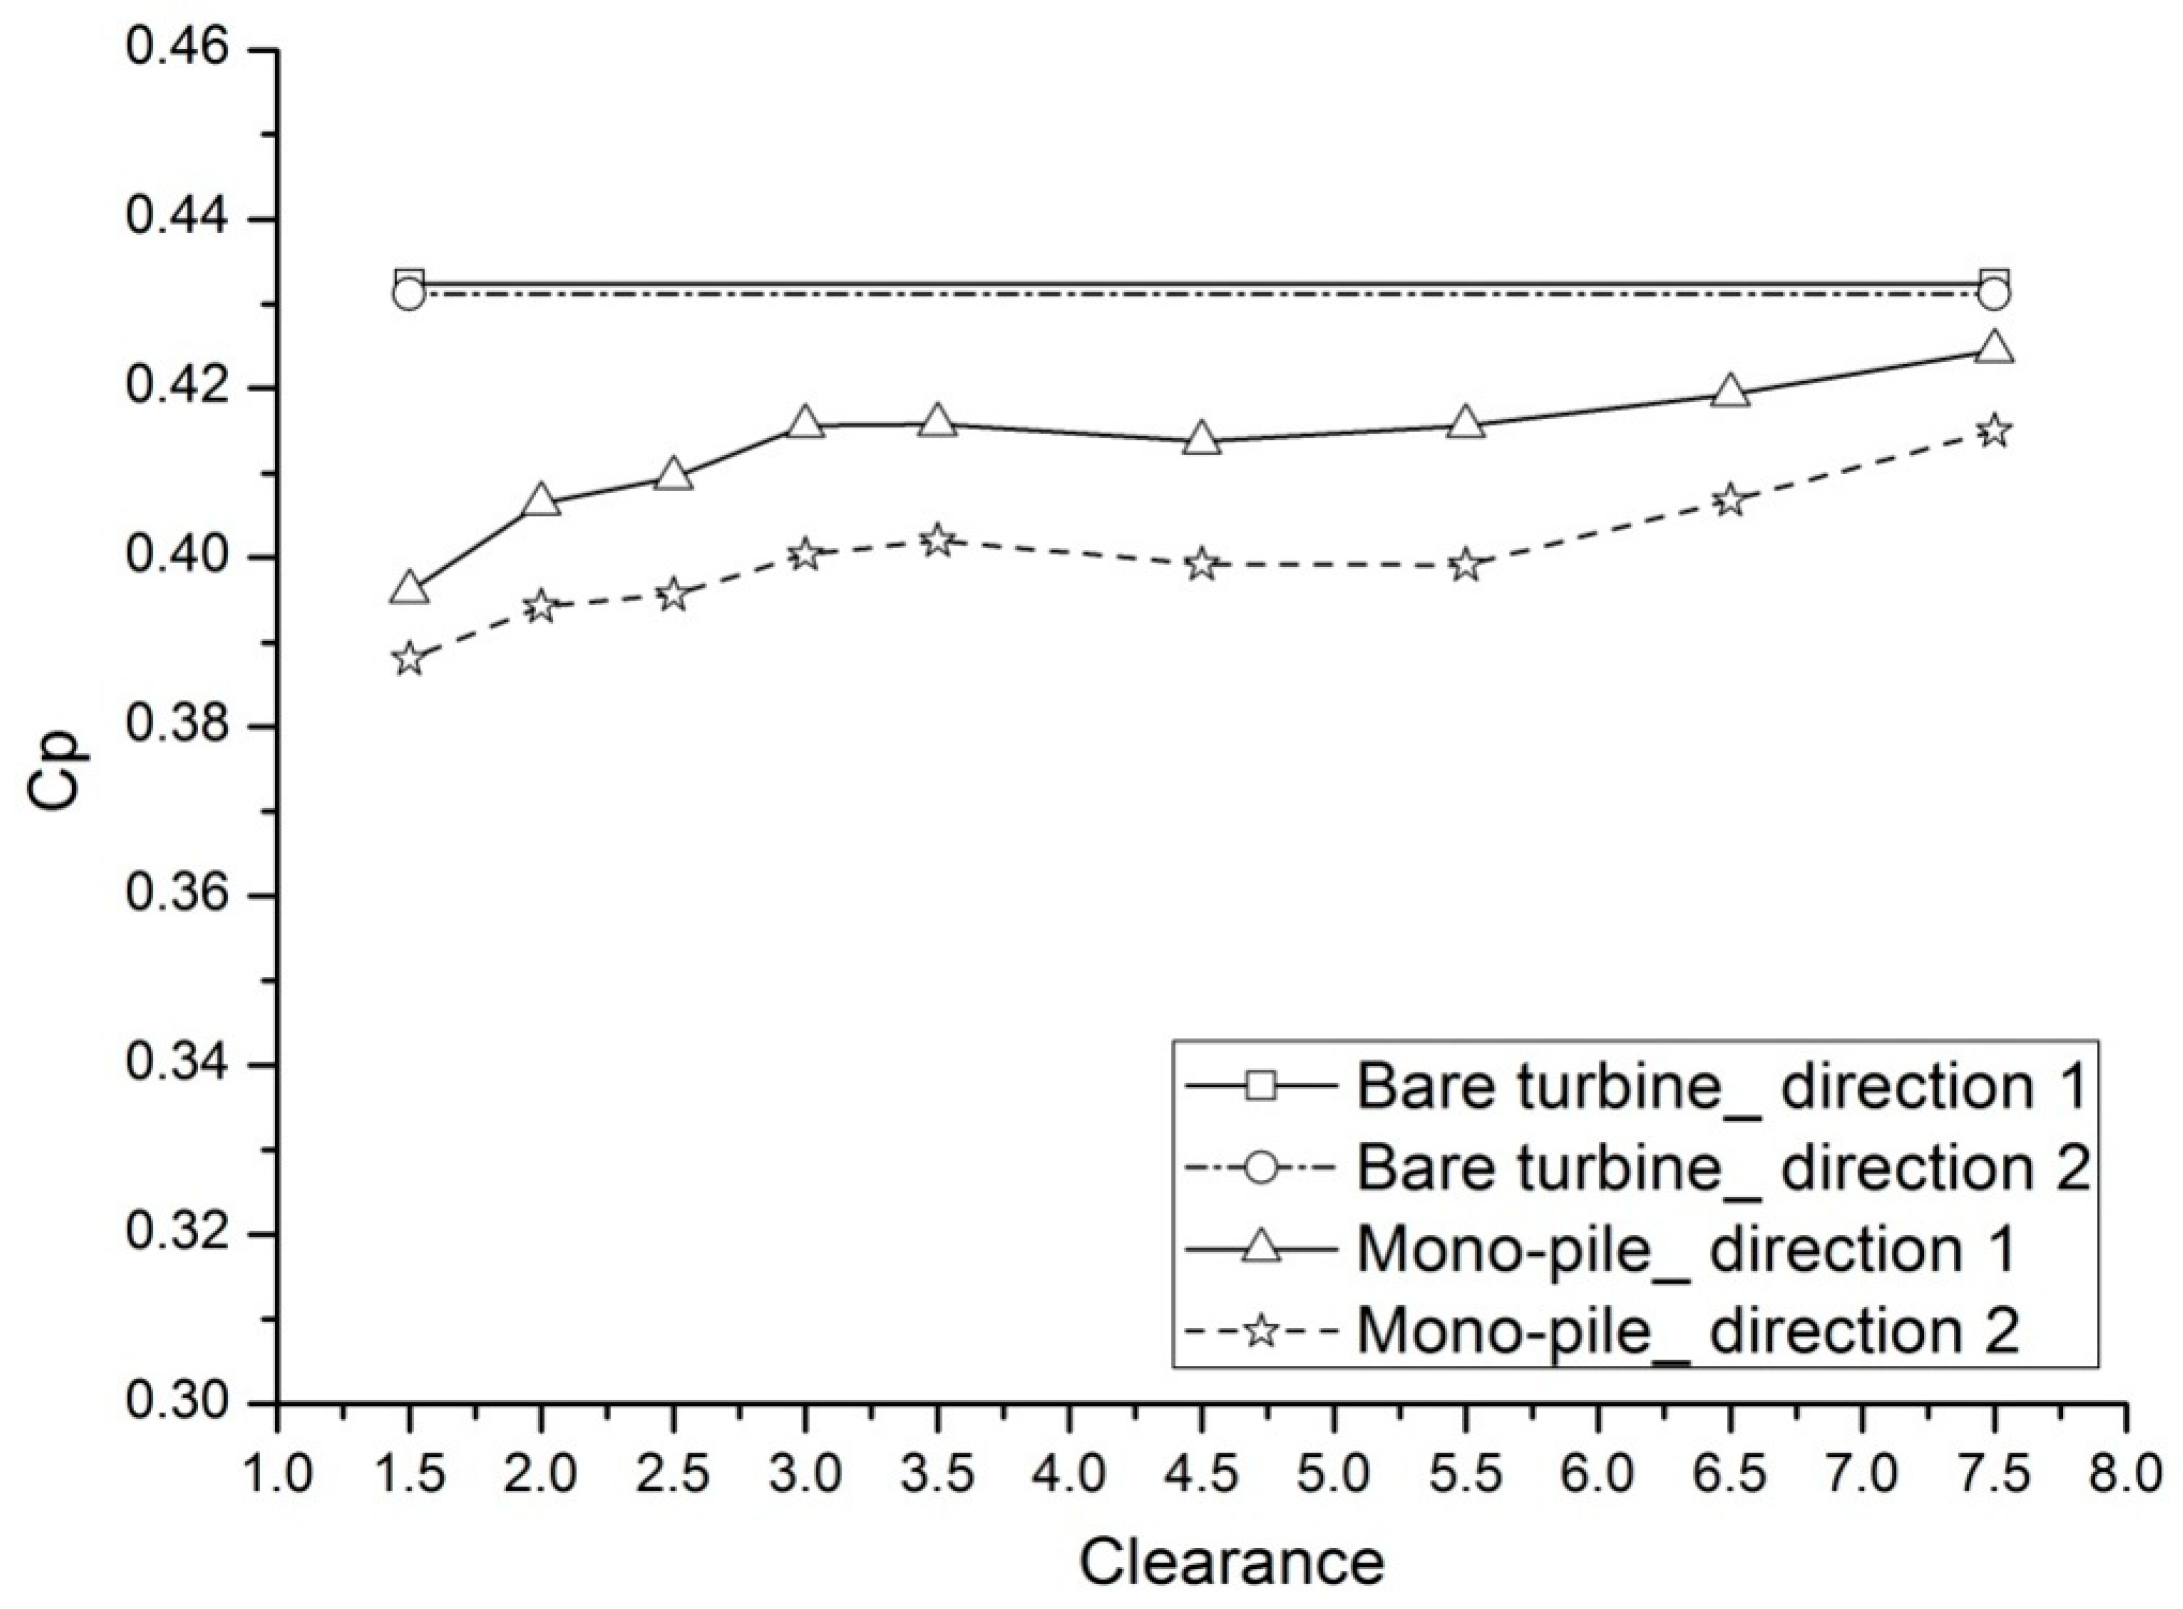
Figure 17 shows power coefficients at varied clearances when the TSR is 5. In this figure, the last character with an underscore bar in the legend refers to the tidal current direction (e.g., mono-pile direction 1 indicates the turbine is upstream of the mono-pile, as shown in Figure 16). It can be seen that the power coefficient decreases due to the introduction of the mono-pile, and the power coefficient increases with increasing mono-pile clearance. In other words, the effect of the mono-pile on the turbine’s performance decreases with an increase in clearance. In tidal current direction 1, the power coefficient is 0.3960 when the clearance is 0.75 DS (1.5 m). As the clearance increasing, the power coefficient is 0.4245 when the clearance is 3.75 DS (7.5 m), compared with the bare turbine result of 0.4338. The similar phenomenon can be observed in tidal current direction 2.
By comparing the performance of the turbine between tidal current directions 1 and 2 in Figure 17, it can be seen that the power coefficients in tidal current direction 1 are better than those in the corresponding tidal current direction 2. In other words, the effect of mono-pile on the turbine’s performance is greater when the turbine is of downstream of the mono-pile. Take the clearance of 1.5 DS as an example, the power coefficient is 0.4156 in tidal current direction 1, compared to 0.4004 in tidal current direction 2.
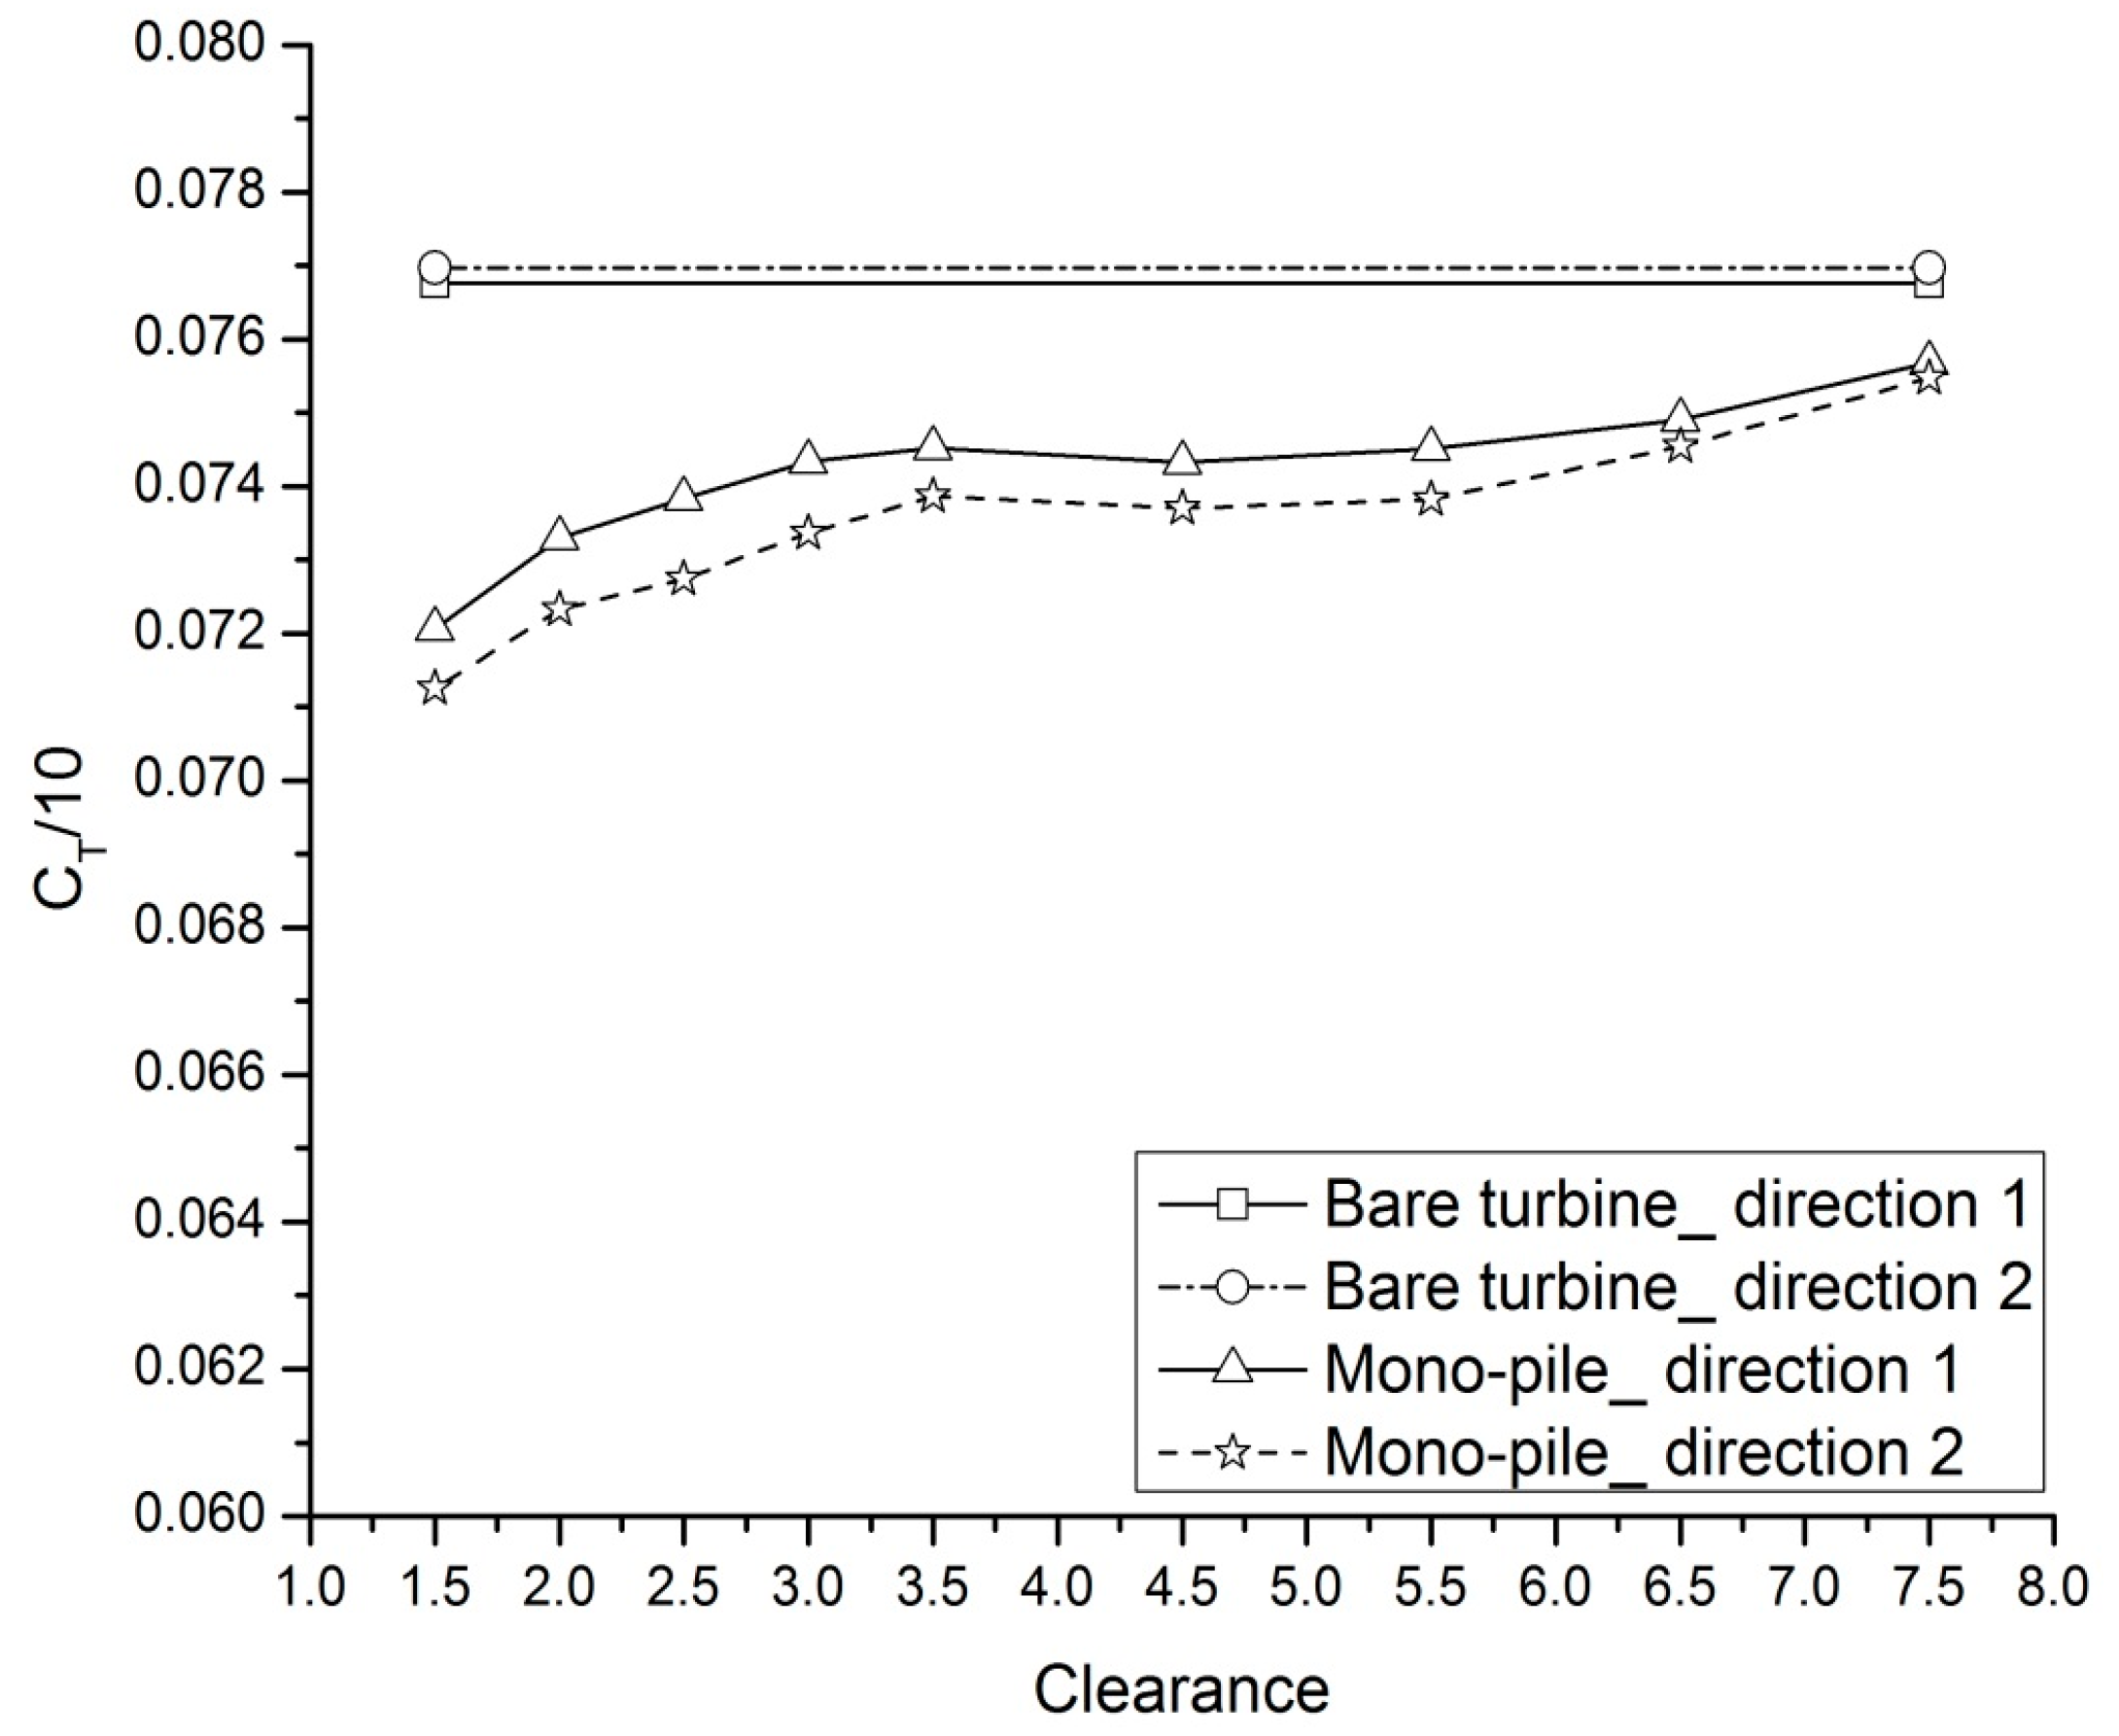
Figure 18 shows the drag coefficients at varied clearances when the tip speed ratio is 5. It should be noticed that all plots in this figure only contain results of the axial loading on the turbine, not including the mono-pile. It can be seen from Figure 18 that drag coefficients decrease due to the presence of the mono-pile. The drag coefficients increase with the increasing mono-pile clearance. The reduction of drag seems to be a good thing, but the energy capture capability decreases as well, which means the reduction of drag is meaningless.
Although the effect of mono-pile on the turbine’s performance decreases as the clearance increases, there is an economic and physical limit to the size of the clearance. In this paper, the clearance was chosen to be 1.5 DS (3.0 m). The performance comparison between the bare turbine and the turbine with a mono-pile of 1.5 DS clearance is shown in Table 9.
Based on the above steady-state CFD results, it can be noticed that the introduction of the mono-pile reduces the power coefficients and the drag coefficients of the turbine, and the smaller clearance, the larger the effect on the performance of the turbine. The effect of the mono-pile on the turbine’s performance is greater when the turbine is downstream of the mono-pile. When the turbine is upstream of the mono-pile, the mono-pile also has effect on the turbine’s performance, which is due to the blockage effect of the mono-pile.
The limitations of these results must be recognized as they are a time-averaged solution, the effect of the mono-pile during a single rotation and over a period of blades passing cannot be established from these results.
4.2. The Transient Study and Analysis
To progress the understanding of the effect of the mono-pile on the turbine’s performance during rotation, a transient CFD model with the same parameters and geometry as the steady-state study was utilized. The transient models were analyzed at a constant angular velocity of 1 rad/s (TSR = 5), which is close to the maximum power coefficient of the turbine as determined from the above study. The clearances were set to 1.25 DS (2.5 m), 1.5 DS (3.0 m) and 1.75 DS (3.5 m).
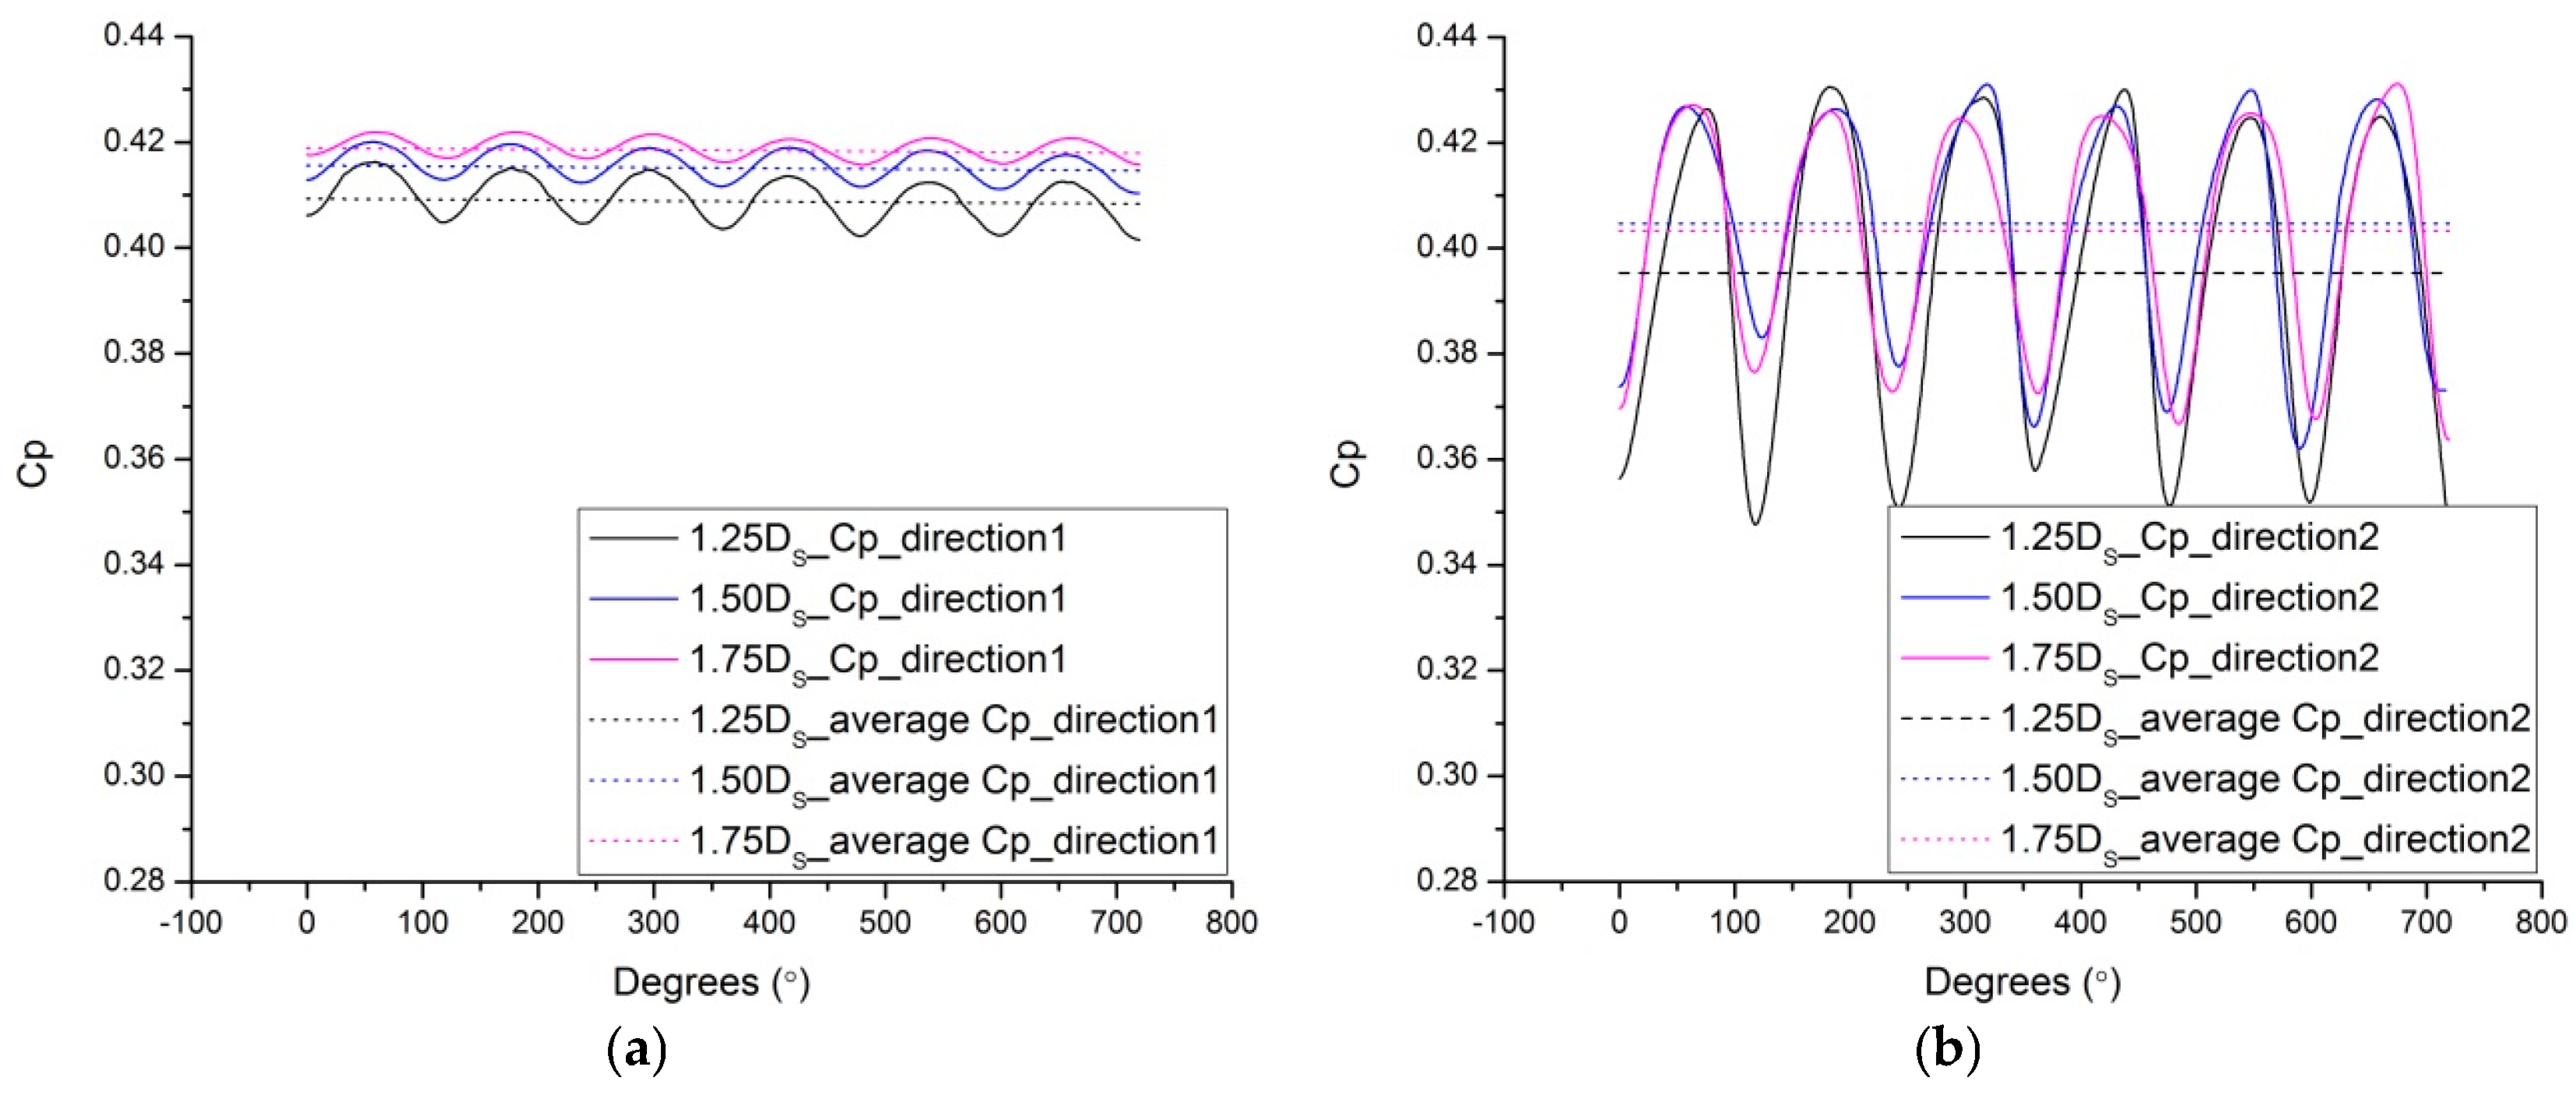
Figure 19 shows the power coefficient for two complete rotational cycles; it can be seen that the power coefficient fluctuates during the turbine rotation, where each trough represents one turbine blade being in line with the mono-pile, while each peak represents the position in the rotational cycle where no blade is directly in line with the mono-pile. In one complete turbine rotational cycle, each blade passes through the mono-pile once. Hence there are three troughs in one complete turbine rotational cycle.
The minimum, maximum and average values of Cp are shown in Table 10. As shown in Figure 19 and Table 10, the amplitudes of fluctuations in tidal current direction 2 are much larger than those in tidal current direction 1. For example, at clearance of 1.25 DS, the maximum variation of Cp in direction 2 are about 0.0757, which is about 7.21 times those in direction 1 while the difference of averaged Cp in two directions is only about 0.014. It is also can be seen that there is no prominent different in the average Cp when the clearance is larger than 1.5 DS.
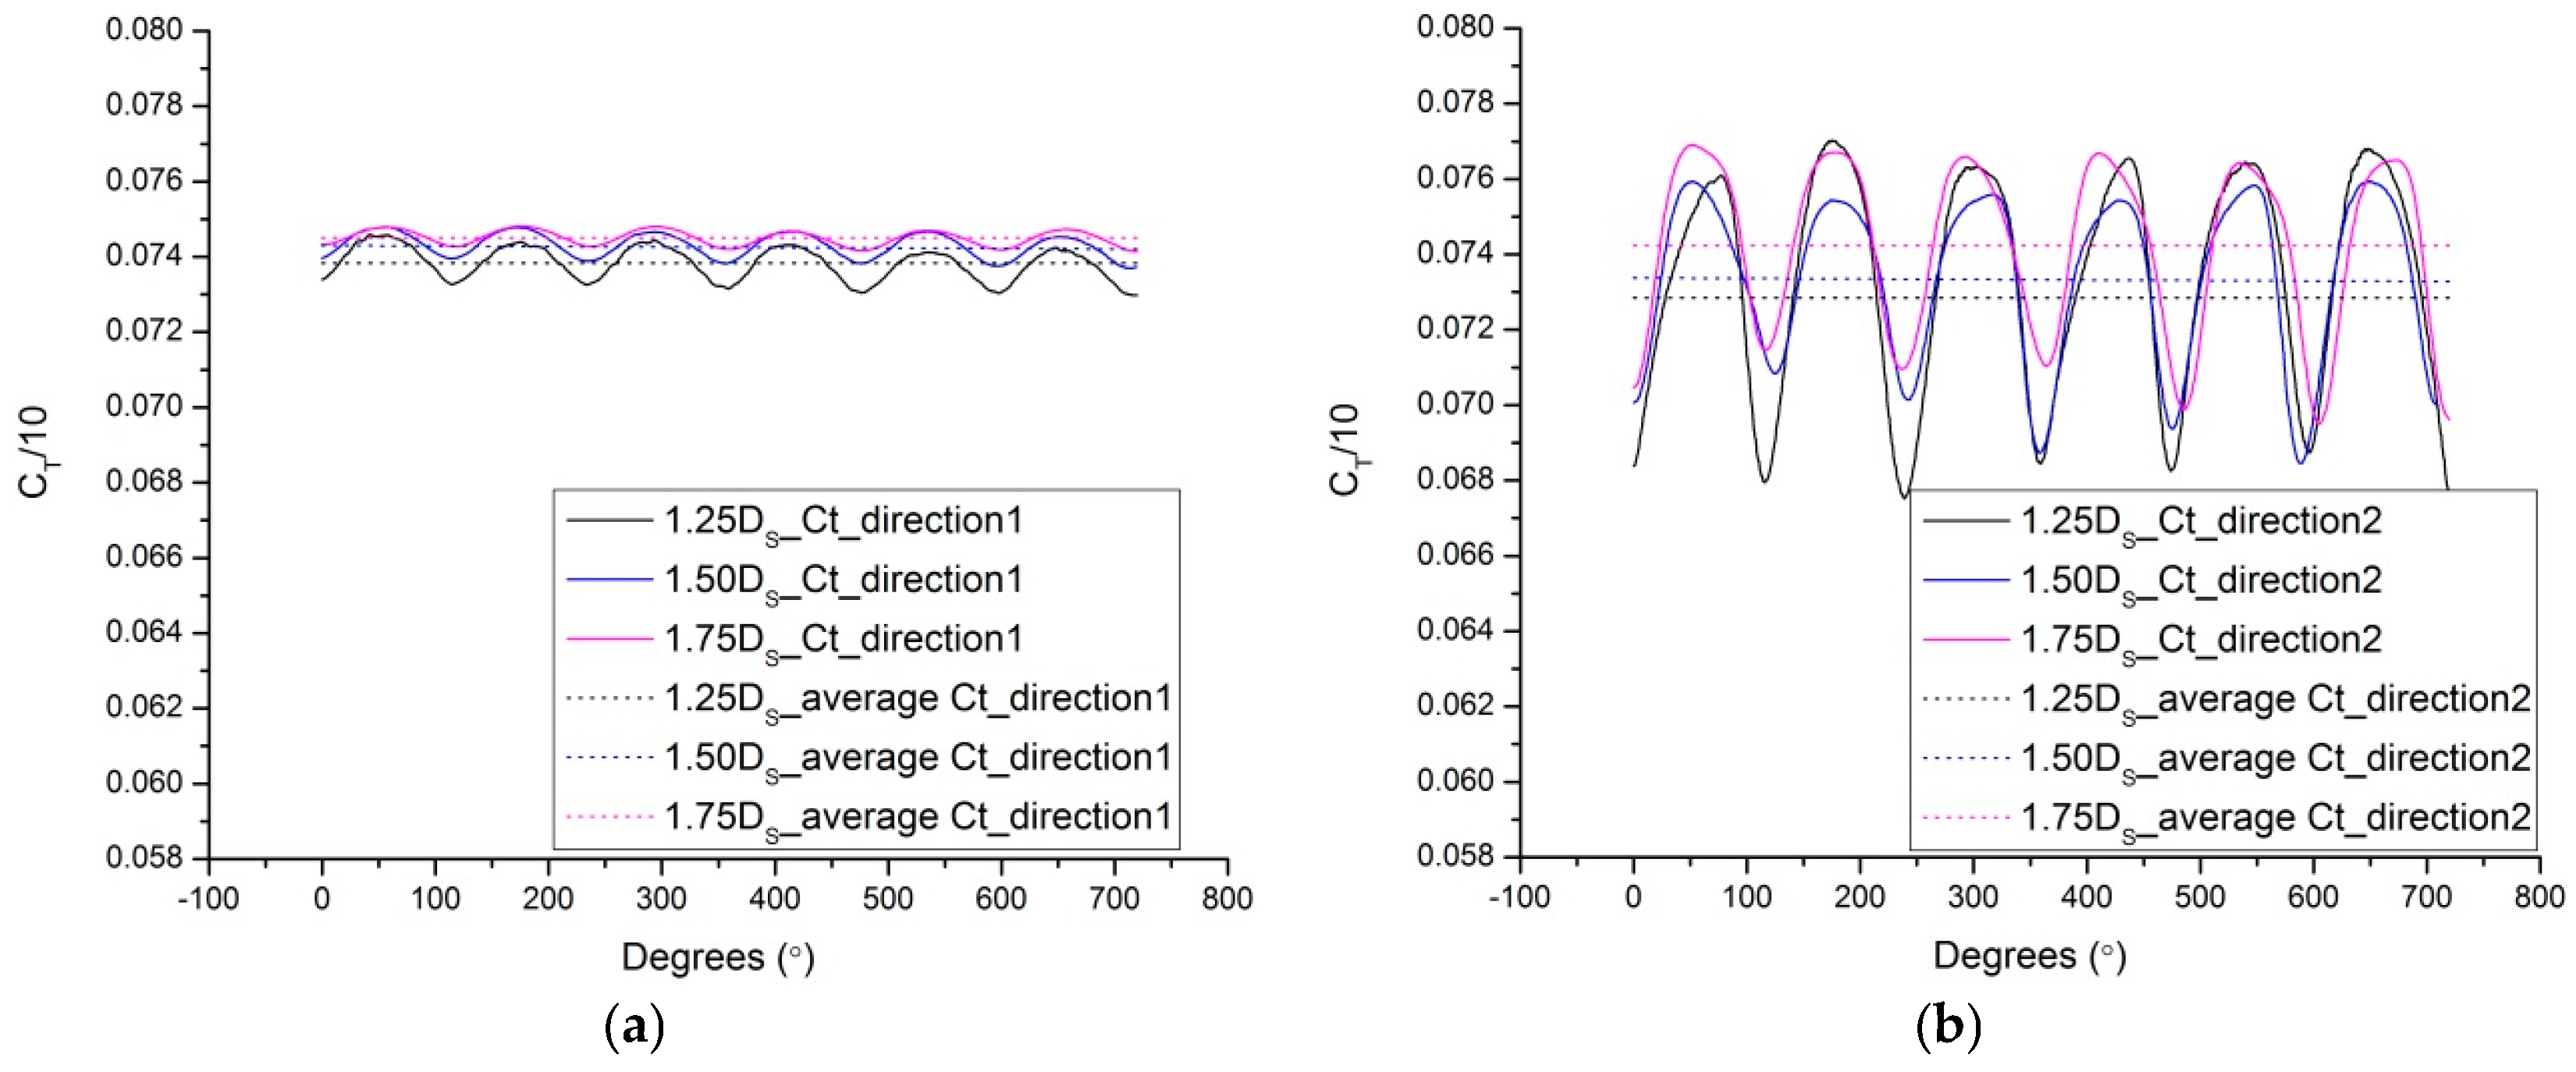
The similar phenomenon can be observed on the drag coefficient CT/10 as shown in Figure 20 and Table 11. It can be seen that fluctuations of the drag coefficient curves are smaller when the turbine is upstream of the mono-pile, even at the relatively small clearance 1.25 DS (2.5 m). The fluctuation will result in the turbine blades pulsing over a rotational cycle. This will detrimentally harm the life of the turbine as it will lead to increased wear and fatigue issues.
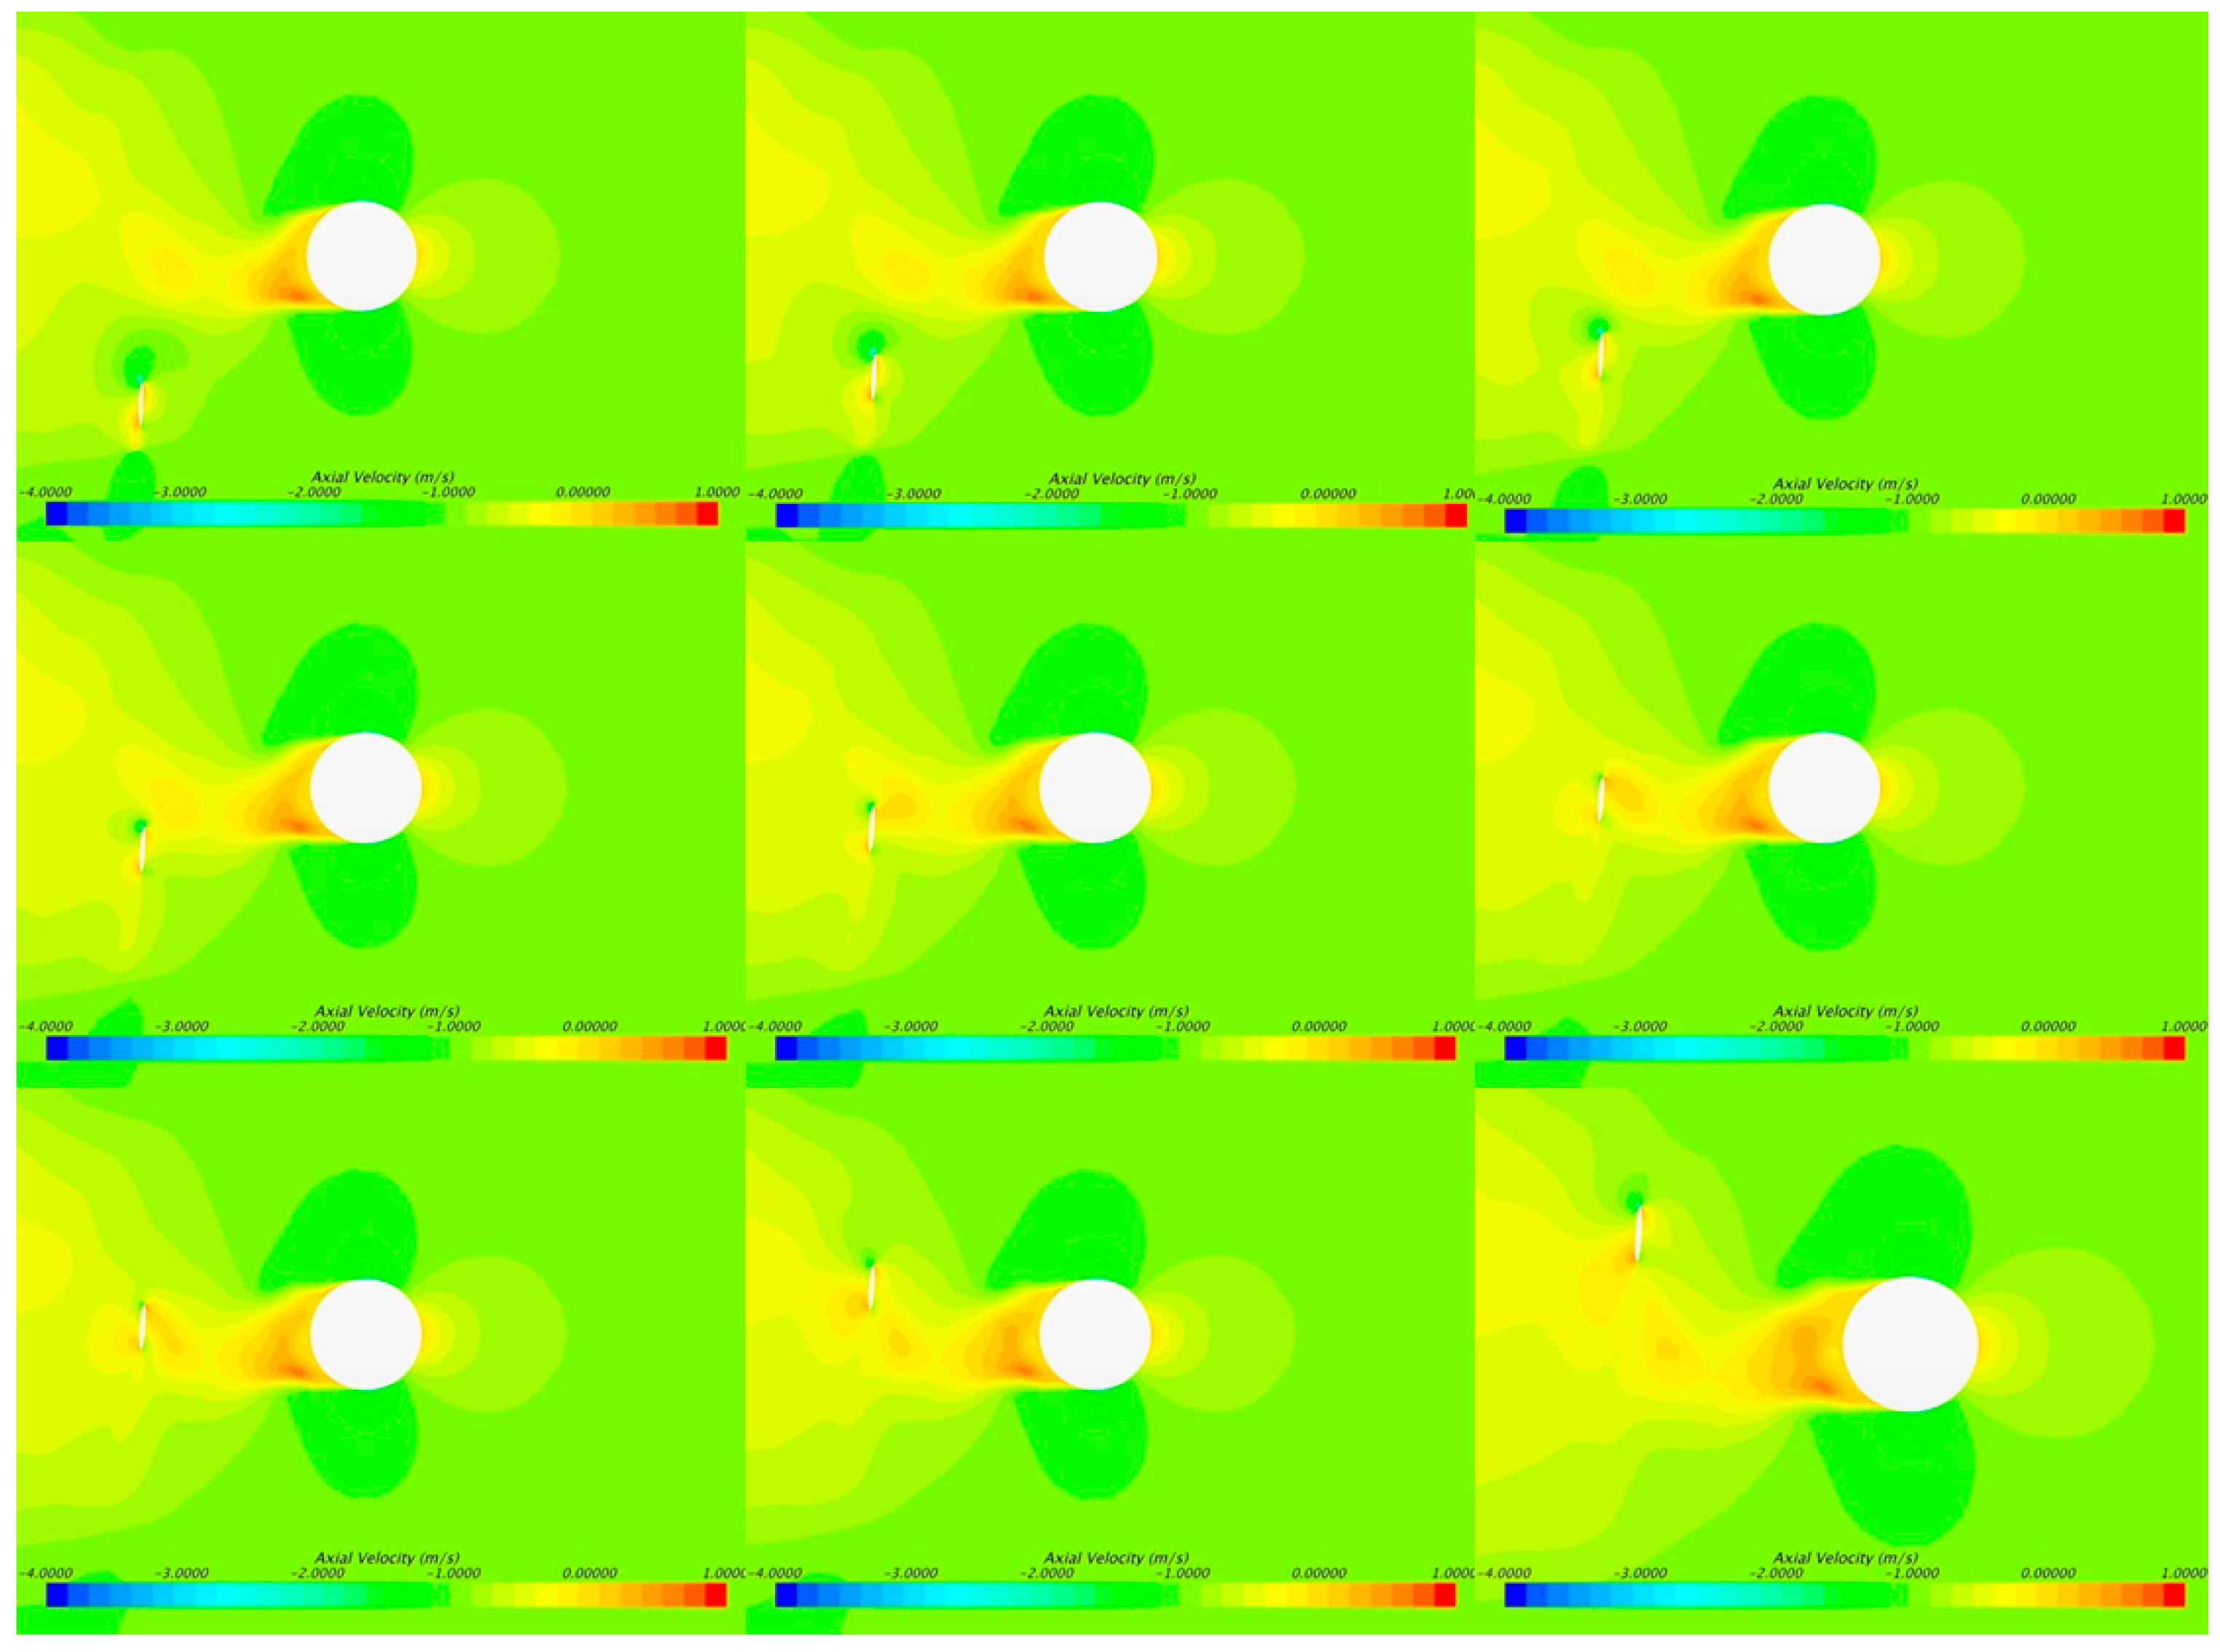
The above phenomena of much larger variation of Cp and CT in direction 2 than direction 1 can be identified through a velocity contour on the horizontal plane, which is located at 3.5 m (0.7R) above the axis of the turbine, as shown in Figure 21. In tidal current direction 2, i.e., downstream of the mono-pile, there is a low velocity region formed behind the mono-pile. When turbine blades pass through the low velocity region, the torque and drag of the turbine will be affected. The closer the turbine blade is to the mono-pile, the stronger the effects on Cp and CT the mono-pile has. This is the reason why the closer the turbine blade is to the mono-pile, the larger the fluctuations of Cp and CT are. From Figure 21 it also can be seen that the mono-pile not only affects the velocity downstream but also form a low velocity region on the upstream. This is the reason why the mono-pile affects the performance of the turbine on both current directions that can be observed from Figure 17 and Figure 18 and Table 9. The only difference is that the mono-pile will have a stronger effect on the turbine in its downstream than in its upstream.
5. Conclusions
This paper presents the study of a tidal current turbine with bidirectional foils aiming to provide a new approach to meet requirement of harvesting energy from bidirectional tidal currents. The research focuses on the evaluation of the hydrodynamic performance of the bidirectional turbine. The performance of the bare turbine was evaluated based on a steady-state CFD model and model tests. The effect of the mono-pile on the turbine’s performance in both tidal current directions was simulated and discussed based on the steady-state and the transient CFD model. According to the research so far, the following conclusions can be drawn:
(1) The hydrodynamic performance of bidirectional foils is worse than that of optimized, cambered foils. The lift coefficient of BDA 65-012 decreases 14.01% compared with that of the NACA 65-012 at AOA = 8°, and the drag coefficient increases 21.23%. The lift coefficient of BDA 65-021 decreases 25.33% compared with that of the NACA 65-021 at AOA = 8°, and the drag coefficient increases 14.66%.
(2) According to the numerical simulations and model tests, the bare bidirectional turbine has nearly the same energy conversion capability in both tidal current directions. The power coefficient at designed TSR is approximately 43.38% and 43.21%, respectively. The performances of the bidirectional turbine are slightly lower than the turbine with NACA foils, but with only 1.6%. At the design tip speed ratio, the power coefficient of the turbine with NACA foils is 44.98%, whereas 43.38% for the bidirectional turbine. But this small penalty will bring a significant simplification in a HATT design.
(3) Based on the steady-state CFD study, the turbine performance decreases due to the introduction of the mono-pile. The performance of the turbine improves as the clearance increases. At the same clearance, the mono-pile has a larger effect on the performance of the turbine located in its downstream than in its upstream although the mono-pile will affect the performance of the turbine located in both its downstream and upstream. At the clearance of 1.5 DS, these effects will be less prominent.
(4) Based on the transient CFD study, the introduction of the mono-pile can result in the fluctuations of the turbine’s performance. The variation in Cp of the turbine located downstream of the mono-pile is about 7–8 times that of the turbine located upstream. A similar trend can be observed in the drag coefficient of the turbine. The fluctuation will detrimentally harm the life of the turbine as it will lead to increased wear and fatigue issues. Therefore, a bidirectional turbine may be a good choice for tidal currents, but structural considerations should be strengthened in the process of turbine design.
Author Contributions
Conceptualization, B.G. and D.W.; methodology, B.G. and D.W; simulation, B.G. and W.S.; validation, B.G., D.W. and X.Z.; writing—original draft preparation, B.G.; writing—review and editing, B.G., D.W. and F.J. All authors have read and agree to the published version of the manuscript. All authors have read and agreed to the published version of the manuscript.
Funding
Funding for this research was partially supported by the State Oceanic Administration People’s Republic of China, grant NO. GHME2011GD01 and the National Natural Science Foundation of China, grant NO. U1706227.
Conflicts of Interest
The authors declare no conflict of interest.
Nomenclature
| AT | is the swept area of the turbine rotor |
| CL | is the lift coefficient of foil |
| Cd | is the drag coefficient of foil |
| CP | is the power coefficient of the turbine |
| CT | is the drag coefficient of the turbine |
| D | is the drag force of the foil |
| DS | is the diameter of the mono-pile |
| is the chord length of the turbine at 0.7 radius | |
| is the lift force of the foil | |
| N | is the number of turbine blades |
| is the fluid density | |
| is the angular velocity of the turbine | |
| is the radius of the turbine rotor | |
| is the tip speed ratio of the turbine | |
| is the torque of the turbine | |
| T | is the drag force of the turbine |
| is the kinematic viscosity of the water | |
| V | is the incoming flow velocity |
| is the time averaged velocity components in Cartesian coordinates | |
| is the turbine forces | |
| is the time averaged pressure | |
| is the viscous coefficient | |
| is the fluctuating velocity components in Cartesian coordinates | |
| is the Reynolds stress tensor |
References
- BenElghali, S.; Benbouzid, M.; Charpentier, J.F. Marine tidal current electric power generation technology: State of the art and current status. In Proceedings of the Electric Machines & Drives Conference, IEMDC’07, Antalya, Turkey, 3–5 May 2007; IEEE International: Piscataway, NJ, USA, 2007; pp. 1407–1412. [Google Scholar]
- Charlier, R.H. A “sleeper” awakes: Tidal current power. Renew. Sustain. Energy Rev. 2003, 7, 515–529. [Google Scholar] [CrossRef]
- Verdant Power. Pilot License Application Roosevelt Island Tidal Energy Project, Report FERC No.12611; Verdant Power: New York, NY, USA, 2010. [Google Scholar]
- Fraenkel, P.L. Power from marine currents. Proc. Inst. Mech. Eng. Part A J. Power Energy 2002, 216, 1–14. [Google Scholar] [CrossRef]
- Liu, P.; Bose, N. Prototyping a series of bi-directional horizontal axis tidal turbine for optimizing energy conversion. Appl. Energy 2012, 99, 50–56. [Google Scholar] [CrossRef]
- Nedyalkov, I.; Wosnik, M. Performance of bi-directional blades for tidal current turbines. In Proceedings of the ASME 4th Joint US-European Fluids Engineering Division Summer Meeting FEDSM, Chicago, IL, USA, 3–7 August 2014. [Google Scholar]
- Lunar Energy Project. Available online: http://www.lunarenergy.co.uk (accessed on 15 December 2017).
- HydroHelix Energy Project. Available online: http://www.hydrohelix.fr (accessed on 15 December 2017).
- Henry, S.; Van Dam, C.P. Active Flow Control on Bidirectional Rotors for Tidal MHK Applications; Office of Scientific & Technical Information Technical Reports: San Francisco, CA, USA, 2013.
- Stuart, R.J.W. Hydrodynamic Interactions of a Tidal Stream Turbine and Support Structure. Ph.D. Thesis, University of Sheffield, Sheffield, UK, 2014. [Google Scholar]
- Mason-Jones, A. Performance Assessment of a Horizontal Axis Tidal Turbine in a High Velocity Shear Environment. Ph.D. Thesis, Cardiff University, Cardiff, UK, 2010. [Google Scholar]
- Hau, E. Wind Turbines: Fundamentals, Technologies, Application, Economics, 2nd ed.; Springer: Berlin, Germany, 2006. [Google Scholar]
- STAR-CCM+ User Guide, Version 10.02, CD-ADAPCO. Available online: http://www.cd-adapco.com/products/star-ccm/documentation (accessed on 20 May 2018).
- Ismail, B.C. Procedure for Estimation and Reporting of Uncertainty Due to Discretization in CFD Applications. J. Fluids Eng. 2008, 130, 078001. [Google Scholar]
- Abbott, I.H. Theory of Wing Sections, Including a Summary of Airfoil Data; Courier Dover Publications: New York, NY, USA, 1959. [Google Scholar]
- Burton, T.; Jenkins, N.; Sharpe, D.; Bossanyi, E. Wind Energy Handbook; Wiley: Chichester, UK, 2011. [Google Scholar]
- Atlar, M. Recent upgrading of marine testing facilities at Newcastle University. In Proceedings of the 2nd Intl’ Conference on Advanced Model Measurement Technology for the EU Maritime Industry, Newcastle upon Tyne, UK, 4–5 April 2011; pp. 1–32. [Google Scholar]
Figure 1.
The rotational direction of the bidirectional turbine at both tidal current directions.

Figure 2.
The section geometry of the foils, (a) NACA 65-021 and NACA 65-012 and (b) BDA 65-021 and BDA 65-012.
Figure 2.
The section geometry of the foils, (a) NACA 65-021 and NACA 65-012 and (b) BDA 65-021 and BDA 65-012.

Figure 3.
Sketch of the boundary conditions for numerical simulations of NACA 66-012.

Figure 4.
The zoom-in view of mesh around the foil.

Figure 5.
Results comparison among the computational fluid dynamics (CFD) experiments of NACA 65-012 and of BDA 65-012 at Re = 3 × 10⁶. (a) Lift coefficient and (b) drag coefficient.
Figure 5.
Results comparison among the computational fluid dynamics (CFD) experiments of NACA 65-012 and of BDA 65-012 at Re = 3 × 10⁶. (a) Lift coefficient and (b) drag coefficient.

Figure 6.
Results comparison among CFD experiments of NACA 65-021 and of BDA 65-021 at Re = 3 × 10⁶. (a) Lift coefficient and (b) drag coefficient.
Figure 6.
Results comparison among CFD experiments of NACA 65-021 and of BDA 65-021 at Re = 3 × 10⁶. (a) Lift coefficient and (b) drag coefficient.

Figure 7.
Sketch of boundary conditions for numerical simulations of the turbine.

Figure 8.
Surface mesh of the bidirectional turbine.

Figure 9.
Photograph of the turbine model.

Figure 10.
Dimensional sketch of the Emerson Cavitation Tunnel.

Figure 11.
Sample of uncertainty analysis at 3 m/s inflow speed.

Figure 12.
Performance comparison of the turbine model between the CFD and model tests at 3 m/s. (a) Power coefficients and (b) drag coefficients.
Figure 12.
Performance comparison of the turbine model between the CFD and model tests at 3 m/s. (a) Power coefficients and (b) drag coefficients.

Figure 13.
Performance of the full-scaled bare bidirectional turbine at 1 m/s. (a) Power coefficients and (b) drag coefficients.
Figure 13.
Performance of the full-scaled bare bidirectional turbine at 1 m/s. (a) Power coefficients and (b) drag coefficients.

Figure 14.
Pressure distribution of the turbine at 0.7R at TSR = 5.

Figure 15.
Power coefficient comparison between the bidirectional turbine and the turbine with NACA foils.
Figure 15.
Power coefficient comparison between the bidirectional turbine and the turbine with NACA foils.

Figure 16.
The axial clearance between the turbine and the front of mono-pile.

Figure 17.
Power coefficients with varied clearances at TSR = 5.

Figure 18.
Drag coefficients with varied clearances at TSR = 5.

Figure 19.
The power coefficient for two complete rotational cycles; (a) direction 1 and (b) direction 2.
Figure 19.
The power coefficient for two complete rotational cycles; (a) direction 1 and (b) direction 2.

Figure 20.
The drag coefficient for two complete rotational cycles; (a) direction 1 and (b) direction 2.
Figure 20.
The drag coefficient for two complete rotational cycles; (a) direction 1 and (b) direction 2.

Figure 21.
Velocity contours for a 1.5 DS (3 m) clearance when the turbine is downstream of the mono-pile at increasing time steps.
Figure 21.
Velocity contours for a 1.5 DS (3 m) clearance when the turbine is downstream of the mono-pile at increasing time steps.


Table 1.
Grid independence study for NACA 65-012 at Reynold’s number (Re) = 3 × 10⁶ and angle of attack (AOA) = 6°, 8° and 12°.
Table 1.
Grid independence study for NACA 65-012 at Reynold’s number (Re) = 3 × 10⁶ and angle of attack (AOA) = 6°, 8° and 12°.
| AOA = 6° | AOA = 8° | AOA = 12° | ||||
|---|---|---|---|---|---|---|
| CL | Cd | CL | Cd | CL | Cd | |
| Grid 1, 267187 (fine) | 0.65769 | 0.01089 | 0.86185 | 0.01283 | 1.19281 | 0.02186 |
| Grid 2, 155571 (medium) | 0.65761 | 0.01102 | 0.86124 | 0.01309 | 1.18453 | 0.02305 |
| Grid 3, 86276 (coarse) | 0.65677 | 0.01125 | 0.85677 | 0.0138 | 1.15917 | 0.02483 |
| 0.095238 | 0.565217 | 0.136465 | 0.366197 | 0.326498 | 0.668539 | |
| 0.0000204 | 0.02542 | 0.000175 | 0.018166 | 0.005201 | 0.19292 | |
Table 2.
Lift and drag coefficient comparison between NACA foils and BDA foils.
| Lift Coefficient | Drag Coefficient | |
|---|---|---|
| NACA 66-012, AOA = 8° | 0.86124 | 0.01309 |
| BDA 66-012, AOA = 8° | 0.74057 | 0.01587 |
| NACA 65-021, AOA = 8° | 0.82691 | 0.01782 |
| BDA 65-021, AOA = 8° | 0.59262 | 0.02043 |
Table 3.
The design parameter of the bidirectional tidal current turbine.
| Design Tip Speed Ratio | Number of Blades | Turbine Diameter (m) | Rh/R | Inflow Velocity (m/s) |
|---|---|---|---|---|
| 5 | 3 | 10 | 0.2 | 1 |
Table 4.
Main particulars of the bidirectional turbine.
| r/R | 0.2 | 0.3 | 0.4 | 0.5 | 0.6 | 0.7 | 0.8 | 0.9 | 1.0 |
|---|---|---|---|---|---|---|---|---|---|
| Chord (mm) | 1272.2 | 1182.0 | 1091.8 | 1001.6 | 911.4 | 821.2 | 731.0 | 640.8 | 550.6 |
| Pitch (deg) | 22.6 | 16.1 | 11.5 | 8.3 | 6.0 | 4.3 | 3.0 | 2.0 | 1.2 |
Table 5.
Main particulars of the turbine with NACA foils.
| r/R | 0.2 | 0.3 | 0.4 | 0.5 | 0.6 | 0.7 | 0.8 | 0.9 | 1.0 |
|---|---|---|---|---|---|---|---|---|---|
| Chord (mm) | 1077.8 | 1005.3 | 932.8 | 860.3 | 787.8 | 715.3 | 642.8 | 570.3 | 498.5 |
| Pitch (deg) | 22.1 | 15.5 | 11.0 | 8.0 | 5.7 | 4.1 | 2.8 | 1.8 | 1.0 |
Table 6.
Grid independence study for the bidirectional turbine at λ = 3 and 5.
| λ = 3 | λ = 5 | |||
|---|---|---|---|---|
| CP | CT/10 | CP | CT/10 | |
| Grid 1, 12,346,478 (fine) | 0.22229 | 0.05459 | 0.43462 | 0.07721 |
| Grid 2, 9,360,415 (medium) | 0.2163 | 0.05412 | 0.43381 | 0.07719 |
| Grid 3, 7,752,830 (coarse) | 0.20867 | 0.0534 | 0.43261 | 0.0771 |
| 0.78506 | 0.65278 | 0.67500 | 0.22222 | |
| 0.0295180 | 0.006348644 | 0.001470325 | 0.0000326 | |
Table 7.
Emerson Cavitation Tunnel test section particulars.
| Length (m) | 3.1 |
| Breadth (m) | 1.22 |
| Height (m) | 0.81 |
| Flow speed range (m/s) | 0.5–8 |
| Absolute pressure range (kN/m2) | 7.6–106 |
| Cavitation number range | 0.5–23 |
Table 8.
The technical data of the dynamometer H33.
| Dynamometer Type | Kempf and Rammers H33 |
|---|---|
| Rated maximum thrust (N) | ±3000 |
| Rated maximum torque (Nm) | ±150 |
| Maximum rotation speed (RPM) | 4000 |
Table 9.
The performance comparison between the bare turbine and the turbine with a mono-pile with 1.5 DS clearance.
Table 9.
The performance comparison between the bare turbine and the turbine with a mono-pile with 1.5 DS clearance.
| Bare Turbine | 1.5 DS Clearance | |||
|---|---|---|---|---|
| Cp | CT/10 | Cp | CT/10 | |
| Direction 1 | 0.4338 | 0.0772 | 0.4156 | 0.0743 |
| Direction 2 | 0.4321 | 0.0769 | 0.4004 | 0.0734 |
Table 10.
The minimum, maximum and average values of Cp at varying mono-pile clearances in both tidal current directions.
Table 10.
The minimum, maximum and average values of Cp at varying mono-pile clearances in both tidal current directions.
| Direction 1 | Direction 2 | ||||||
|---|---|---|---|---|---|---|---|
| Clearance | Minimum | Maximum | Average | Minimum | Maximum | Average | |
| Cp | 1.25 DS | 0.4036 | 0.4141 | 0.4093 | 0.3518 | 0.4275 | 0.3953 |
| 1.50 DS | 0.4118 | 0.4189 | 0.4156 | 0.3721 | 0.4282 | 0.4047 | |
| 1.75 DS | 0.4164 | 0.4212 | 0.4190 | 0.3699 | 0.4266 | 0.4033 | |
Table 11.
The minimum, maximum and average values of CT/10 at varying mono-pile clearances in both of tidal current directions.
Table 11.
The minimum, maximum and average values of CT/10 at varying mono-pile clearances in both of tidal current directions.
| Direction 1 | Direction 2 | ||||||
|---|---|---|---|---|---|---|---|
| Clearance | Minimum | Maximum | Average | Minimum | Maximum | Average | |
| CT/10 | 1.25 DS | 0.07316 | 0.07435 | 0.07383 | 0.06809 | 0.07649 | 0.07335 |
| 1.50 DS | 0.07385 | 0.07468 | 0.0743 | 0.06966 | 0.0757 | 0.07338 | |
| 1.75 DS | 0.07422 | 0.07475 | 0.0745 | 0.07042 | 0.07664 | 0.07423 | |
© 2019 by the authors. Licensee MDPI, Basel, Switzerland. This article is an open access article distributed under the terms and conditions of the Creative Commons Attribution (CC BY) license (http://creativecommons.org/licenses/by/4.0/).
Share and Cite
MDPI and ACS Style
Guo, B.; Wang, D.; Zhou, X.; Shi, W.; Jing, F. Performance Evaluation of a Tidal Current Turbine with Bidirectional Symmetrical Foils. Water 2020, 12, 22. https://doi.org/10.3390/w12010022
AMA Style
Guo B, Wang D, Zhou X, Shi W, Jing F. Performance Evaluation of a Tidal Current Turbine with Bidirectional Symmetrical Foils. Water. 2020; 12(1):22. https://doi.org/10.3390/w12010022
Chicago/Turabian StyleGuo, Bin, Dazheng Wang, Xu Zhou, Weichao Shi, and Fengmei Jing. 2020. "Performance Evaluation of a Tidal Current Turbine with Bidirectional Symmetrical Foils" Water 12, no. 1: 22. https://doi.org/10.3390/w12010022
Note that from the first issue of 2016, this journal uses article numbers instead of page numbers. See further details here.