Column Experiments on Sorption Coefficients and Biodegradation Rates of Selected Pharmaceuticals in Three Aquifer Sediments


1
Institute for Groundwater Ecology, German Research Centre for Environmental Health, Helmholtz Zentrum München, Ingolstädter Landstraße 1, 85764 Neuherberg, Germany
2
Chair of Hydrogeology, Technical University of Munich, Arcisstraße 21, 80333 Munich, Germany
3
Institute for Soil Physics and Rural Water Management, University of Natural Resources and Life Sciences, Muthgasse 18, 1190 Vienna, Austria
*
Author to whom correspondence should be addressed.
Water 2020, 12(1), 14; https://doi.org/10.3390/w12010014
Submission received: 24 October 2019
/
Revised: 10 December 2019
/
Accepted: 17 December 2019
/
Published: 19 December 2019
(This article belongs to the Special Issue Pharmaceutic Compounds, as Emerging Organic Contaminants, and Their Occurrence and Transport in Groundwater: Sources, Reactions and Fate)
Abstract
:The presence of pharmaceuticals in the environment, and in groundwater, has been recognized as a great environmental concern. Biodegradation and sorption are the main processes leading to the removal of contamination from the water phase. The aim of this study was to determine the transport processes of selected pharmaceuticals (antipyrine, atenolol, carbamazepine, caffeine, diclofenac, ketoprofen, sulfamethoxazole) in selected sediments (coarse sand, medium sand, sandy loam) in laboratory experiments. Moreover, the impact of flow velocities on the sorption and degradation rates of the selected compounds was studied. Column experiments were performed at three flow velocities, under abiotic and biotic conditions, applying conservative (bromide) and reactive tracers (pharmaceuticals). From the breakthrough curves, retardation factors and degradation rates were determined and the influence of variable flow conditions on transport parameters was evaluated. Low observed concentrations and recoveries of atenolol indicated a strong influence of sorption on its transport. Diclofenac, caffeine, and carbamazepine were also affected by sorption but to a lesser extent. Sulfamethoxazole, ketoprofen, and antipyrine were recovered nearly completely, indicating an almost conservative transport behavior. Biodegradation was small for all the compounds, as the results from biotic and abiotic column experiments were similar. Transport of the tested pharmaceuticals was not influenced by different flow velocities, as similar modelled degradation rates and retardation factors were found for all tested flow velocities.
1. Introduction
Pharmaceuticals belong to emerging organic contaminants and have recently been the focus of research due to their high frequency of detection in the environment [1]. The behavior of pharmaceuticals in water systems is ruled by complex processes, which remain poorly understood, particularly in groundwater [2,3,4,5]. The fate and transport of pharmaceuticals in groundwater as well as risks of possible groundwater contamination are therefore difficult to predict.
Improving the understanding of pharmaceuticals’ transport in heterogeneous and dynamic hydrogeological settings requires the knowledge of crucial processes and transport parameters, which are, however, difficult to determine at complex field sites. For instance, as noticed by Meckenstock et al. (2015) [6], the true drivers controlling the degradation of low level contaminants are not yet understood well. Concerning mass transfer processes, the heterogeneity of the sediment is often overlooked, which corresponds to ignoring the effect of different flow velocities on the fate of contaminants. Reducing the complexity at field sites, laboratory experiments in column studies can help to identify the specific sorption and biodegradation rates of pharmaceuticals.
Column experiments are frequently used to study the transport of contaminants like micropollutants, such as pharmaceuticals [7]. Numerous studies have proven the usefulness of column experiments, as they are relatively fast, uncomplicated to manage, and their boundary conditions can be easily controlled. Moreover, different scenarios may be simulated, for example, managed aquifer recharge [8], seepage through the vadose zone [9], transport through an aquifer [10,11], and bank filtration [12,13,14].
Column studies have been utilized to study the influence of physico-chemical conditions within an aquifer on pharmaceutical transport, with an emphasis on changes in pH [11], redox conditions [13,15], or temperature [16]. Also, the influence of the sediment type on transport behavior was studied and the following properties were found particularly crucial: Sediment grain size [17], available mineral surfaces [18], or total organic carbon content [19]. However, little is known on the impact of flow velocity on pharmaceutical transport in groundwater [20].
The effect of pore-water velocity on contaminant transport has been presented in the literature, especially in the context of sorption/desorption studies [21,22,23], but also in degradation studies [24]. Increased flow velocity may increase biodegradation, if transport and not microbial degradation is limiting the scale of pore-water velocity. On the contrary, if diffusion becomes the dominant mode of substrate transport, as most microorganisms are attached to sediment particles, increased flow velocity may lead to decreased biodegradation [6]. For example, Mendoza-Sanchez et al. (2010) [25] found that at higher flow velocity, the degradation of cis-DCE was more efficient than at lower velocity. They explained this fact by the lower flux of the electron donor (yeast extract) enabling sustained dechlorination. Thus, at the field scale, the heterogeneity of the flow velocity may be a controlling factor of for the biodegradation of contaminants. According to Langner et al. (1998) [26], degradation of 2,4-dichlorophenoxyacetic acid is independent of the retention time but increases with decreasing flow velocity. This can be explained by several processes, which may occur individually or simultaneously, as the resulting effect of pore-water velocity on: (i) Distribution of biomass, (ii) nutrient concentration, (iii) residence time, and (iv) solute mass transfer. Syngouna and Chrysikopoulos (2012) [27] found that the flow velocity did not influence the transport of biocolloids (waterborne fecal indicator organisms). Similarly, Hendry et al. (1999) [28] stated that the transport of bacteria was not affected by flow velocities, and similar retardation factors were found for a range of different flow velocities. In the study of Pang et al. (2002) [23], in which nonequilibrium transport of Cd, Zn, and Pb in gravel columns was examined, the pore-water velocity was found to be positively correlated with the partitioning coefficient, β, forward rate, and backward rate, and negatively correlated with the retardation factor, R, and mass transfer coefficient, ω. Grösbacher et al. (2018) [24] studied toluene biodegradation in a flow-through system and observed a decrease in the maximum specific growth rate of microorganisms with increasing flow velocity. Teijón et al. (2014) [20] investigated naproxen transport in columns filled with sandy aquifer material and found no significant influence of the flow velocity on sorption. The obtained residence times were insufficient to see any possible effect with higher pore water velocities.
Besides the properties of the compound itself, transport mechanisms are dependent on the properties of the sorbate and also the properties of the groundwater [7]. Concerning the sorbate grain size, the area of the surfaces was also found to play an important role. Greenhagen et al. (2014) [17] compared the sorption and biodegradation of methamphetamine, acetaminophen, and caffeine in columns filled with sand and fine-grained sediment. The removal of the compounds due to degradation and sorption was lower in the sandy column. Further, the total organic carbon content and pH were found to influence the transport of pharmaceuticals in groundwater [19].
The physico-chemical conditions in the aquifers strongly influence the sorption of pharmaceuticals. Many environmentally relevant pharmaceuticals contain dissociable functional groups and are in dissociation equilibrium, which depends on pH. Therefore, significant pH dependence on sorption was observed for those compounds [11]. Also, redox conditions are reported to be crucial for contaminant removal from groundwater and soil [13,15]. For instance, sulfamethoxazole transformation depends strongly on nitrate-reducing redox conditions [29]. Moreover, the temperature may influence the biodegradation of pharmaceuticals [16,30].
The aim of this study was to investigate the transport behavior of selected pharmaceuticals under different flow velocities and in different sediments. The analyzed substances included: Antipyrine (other name: phenazone), atenolol, carbamazepine, caffeine, diclofenac, ketoprofen, and sulfamethoxazole. The results of this work, especially the transport parameters quantified using an analytical transport model, advance the understanding of pharmaceuticals’ transport in groundwater.
2. Materials and Methods
2.1. Chemicals, Sediment, and Groundwater
The sediment and groundwater, as well as the chemicals used in the experiment, were analogous to those described in Kiecak et al. (2019) [31] (please note, sediment E from this study was described in the previous paper as E3). The sediment was either purchased (sediment G—coarse technical sand) or collected in two distinct field sites: Sediment V (sandy loam) in the Vistrenque alluvial aquifer in France [32,33] and sediment E (medium sand) in the Baix Fluvià fluvio-deltaic aquifer in Spain [34,35]. Table 1 gives an overview of the sediment and water properties. Prior to use in the experiments, the sediments were air-dried, homogenized, and sieved to remove individual larger parts (>2 mm).
2.2. Experimental Set-Up
The experiments were carried out using stainless steel columns equipped with steel and silicon tubes to minimize the sorption of chemicals to the used material. The columns were packed stepwise with sediment and saturated from the bottom.
Column experiments were performed in saturated conditions using a peristaltic pump (Minipuls 3, Gilson, Inc., Middleton, WI, USA) to provide a constant water flow from the bottom to the top. Water samples were collected at the outflow using fraction collector (Model LF10 5M, Ma Ron GmbH, Germany) while sampling intervals were adjusted depending on the flow rate. The columns used for the G- and E-experiments had a length of L = 50 cm, and an inner diameter of φ = 9 cm. the columns for the V-experiments had the same length and a diameter of φ = 5 cm. A schematic figure showing the experimental set-up can be found in the Supplementary Material (Figure S1).
The columns were flushed with “natural” groundwater (brought from the respective field sites) for a few weeks until hydrochemical equilibrium between water and sediment was assumed to be reached. Each experiment was performed in a biotic column (B) and an abiotic control column (A) to distinguish between biological and chemical degradation. Both columns were prepared in the same manner. However, to ensure abiotic conditions, sodium azide (NaN3) was added to the supplying water tank for the abiotic column experiments (final concentration of ca. 0.05 g/L).
Experiments were conducted as flow-through experiments under saturated conditions, with the inlet at the bottom and the outlet at the top of the column. Different flow rates, adapted to the sediment type and mimicking the possible real-world-conditions, were tested for each column, starting with the fastest flow rate (Table 2). By changing the flow rates, different pore water velocities and transit times were established, and the influence of different residence times in the biotic and abiotic column on the transport behavior of the pharmaceuticals was analyzed. Due to the small difference in the porosity of the two columns (A and B), the achieved velocities were slightly different.
The compounds were first dissolved in methanol (except of caffeine, well soluble in water), a concentrated mix solution was made, and an aliquot of it was then mixed with respective water. At the start of every experiment, a pulse (1.5–2 pore volumes) of tracer solution containing pharmaceuticals (ca. 100 µg/L) and the conservative tracer bromide was applied. The length of the injection was variable and adjusted to the flow rate. The outflowing water was collected into glass tubes using a fraction collector placed in a specially made container (dark, low temperature, e.g., to prevent concentration loss due to photolysis). Sample volumes were about 15 mL. Only selected samples were analyzed because of the high temporal resolution of the sampling. The experiments were operated at room temperature (21 °C).
After each experiment, the columns were flushed again with clean water prior to starting the next experiment with a lower flow velocity. To ensure that none of the studied compounds were still present in the outflowing water, samples were taken and analyzed with LC-MS/MS (results not shown).
2.3. Quantification
Concentrations of pharmaceuticals were measured with an LC-MS/MS system consisting of an Agilent 1200 binary pump (Agilent Technologies, Böblingen, Germany) and a mass spectrometer AB Sciex API 2000 Q-TRAP (Applied Biosystems, Framingham, MA, USA). A Kinetex C18 column (2.6 µm 100 Å, 150 × 3 mm; Phenomenex, Aschaffenburg, Germany) was used. The details on the method were the same as those presented in [31].
Major ions were measured with ionic chromatography (bromide in the G-experiment in Dionex 500, Dionex, Sunnvale, CA, USA; major ions in the remaining experiments in Dionex ICS-1100, Dionex, Sunnvale, CA, USA). Among the major ions, nitrate was analyzed and served as an indicator of the redox conditions in the columns.
Dissolved oxygen concentrations were measured using flow-through cells (FTC-SUPST3-US PreSens, Regensburg, Germany) at the outlet of each column. Dissolved oxygen was monitored continuously in the biotic columns and occasionally in the abiotic columns. In the abiotic columns, the oxygen concentration remained stable during all experiments, therefore more frequent monitoring was unnecessary.
2.4. Transport Modelling
The results were modelled using the STANMOD software in the CXTFIT 2.1 code [36]. CXTFIT 2.1 is based on the one-dimensional convection-dispersion equation (CDE). The program provides options for direct and inverse modelling. The inverse modelling can be done for different types of models, including the deterministic equilibrium CDE and the deterministic non-equilibrium CDE. Therefore, the objective function, which is a build-up of the squared differences of observed and fitted concentrations, is minimized by a nonlinear least-squares inversion procedure [37]. First, the observed concentrations of bromide were analyzed; the fitting parameters included the pore-water velocity, vp, and dispersion coefficient, D. For bromide, the retardation factors, R, and degradation rates, μ, were assumed to equal 1 and 0, respectively. In the next step, vp and D were assumed to stay constant, but R and μ were modelled for each of the reactive tracers.
Other parameters were calculated using the following formulae:
where α—dispersivity [L], L—column length [L], neff—effective porosity [-], Q—discharge [L3T−1], A—cross section area of the column [L2], and t0—mean transit time [T].
2.5. Interpretation
Observed concentrations, C, were normalized to the initial concentration, C0, thereby enabling a comparison of the breakthrough curves. Time was also normalized to the mean transit time, t0, which can be a simplification related to the pore volume.
A comparison of degradation rates for biotic and abiotic conditions allows a rough estimation of the biodegradation rates. It was assumed that the degradation in abiotic columns is related to chemical processes, whereas in the biotic column, it is a sum of chemical and biological processes. If, in the biotic column, the degradation rate is higher than in the abiotic column, it is an indicator of ongoing biological processes.
The sorption coefficient, Kd, can be approximately calculated based on the retardation factor, R, using the formula:
where neff—effective porosity [-], and ρ—bulk density [ML−3].
3. Results
3.1. Solute Transport Parameters
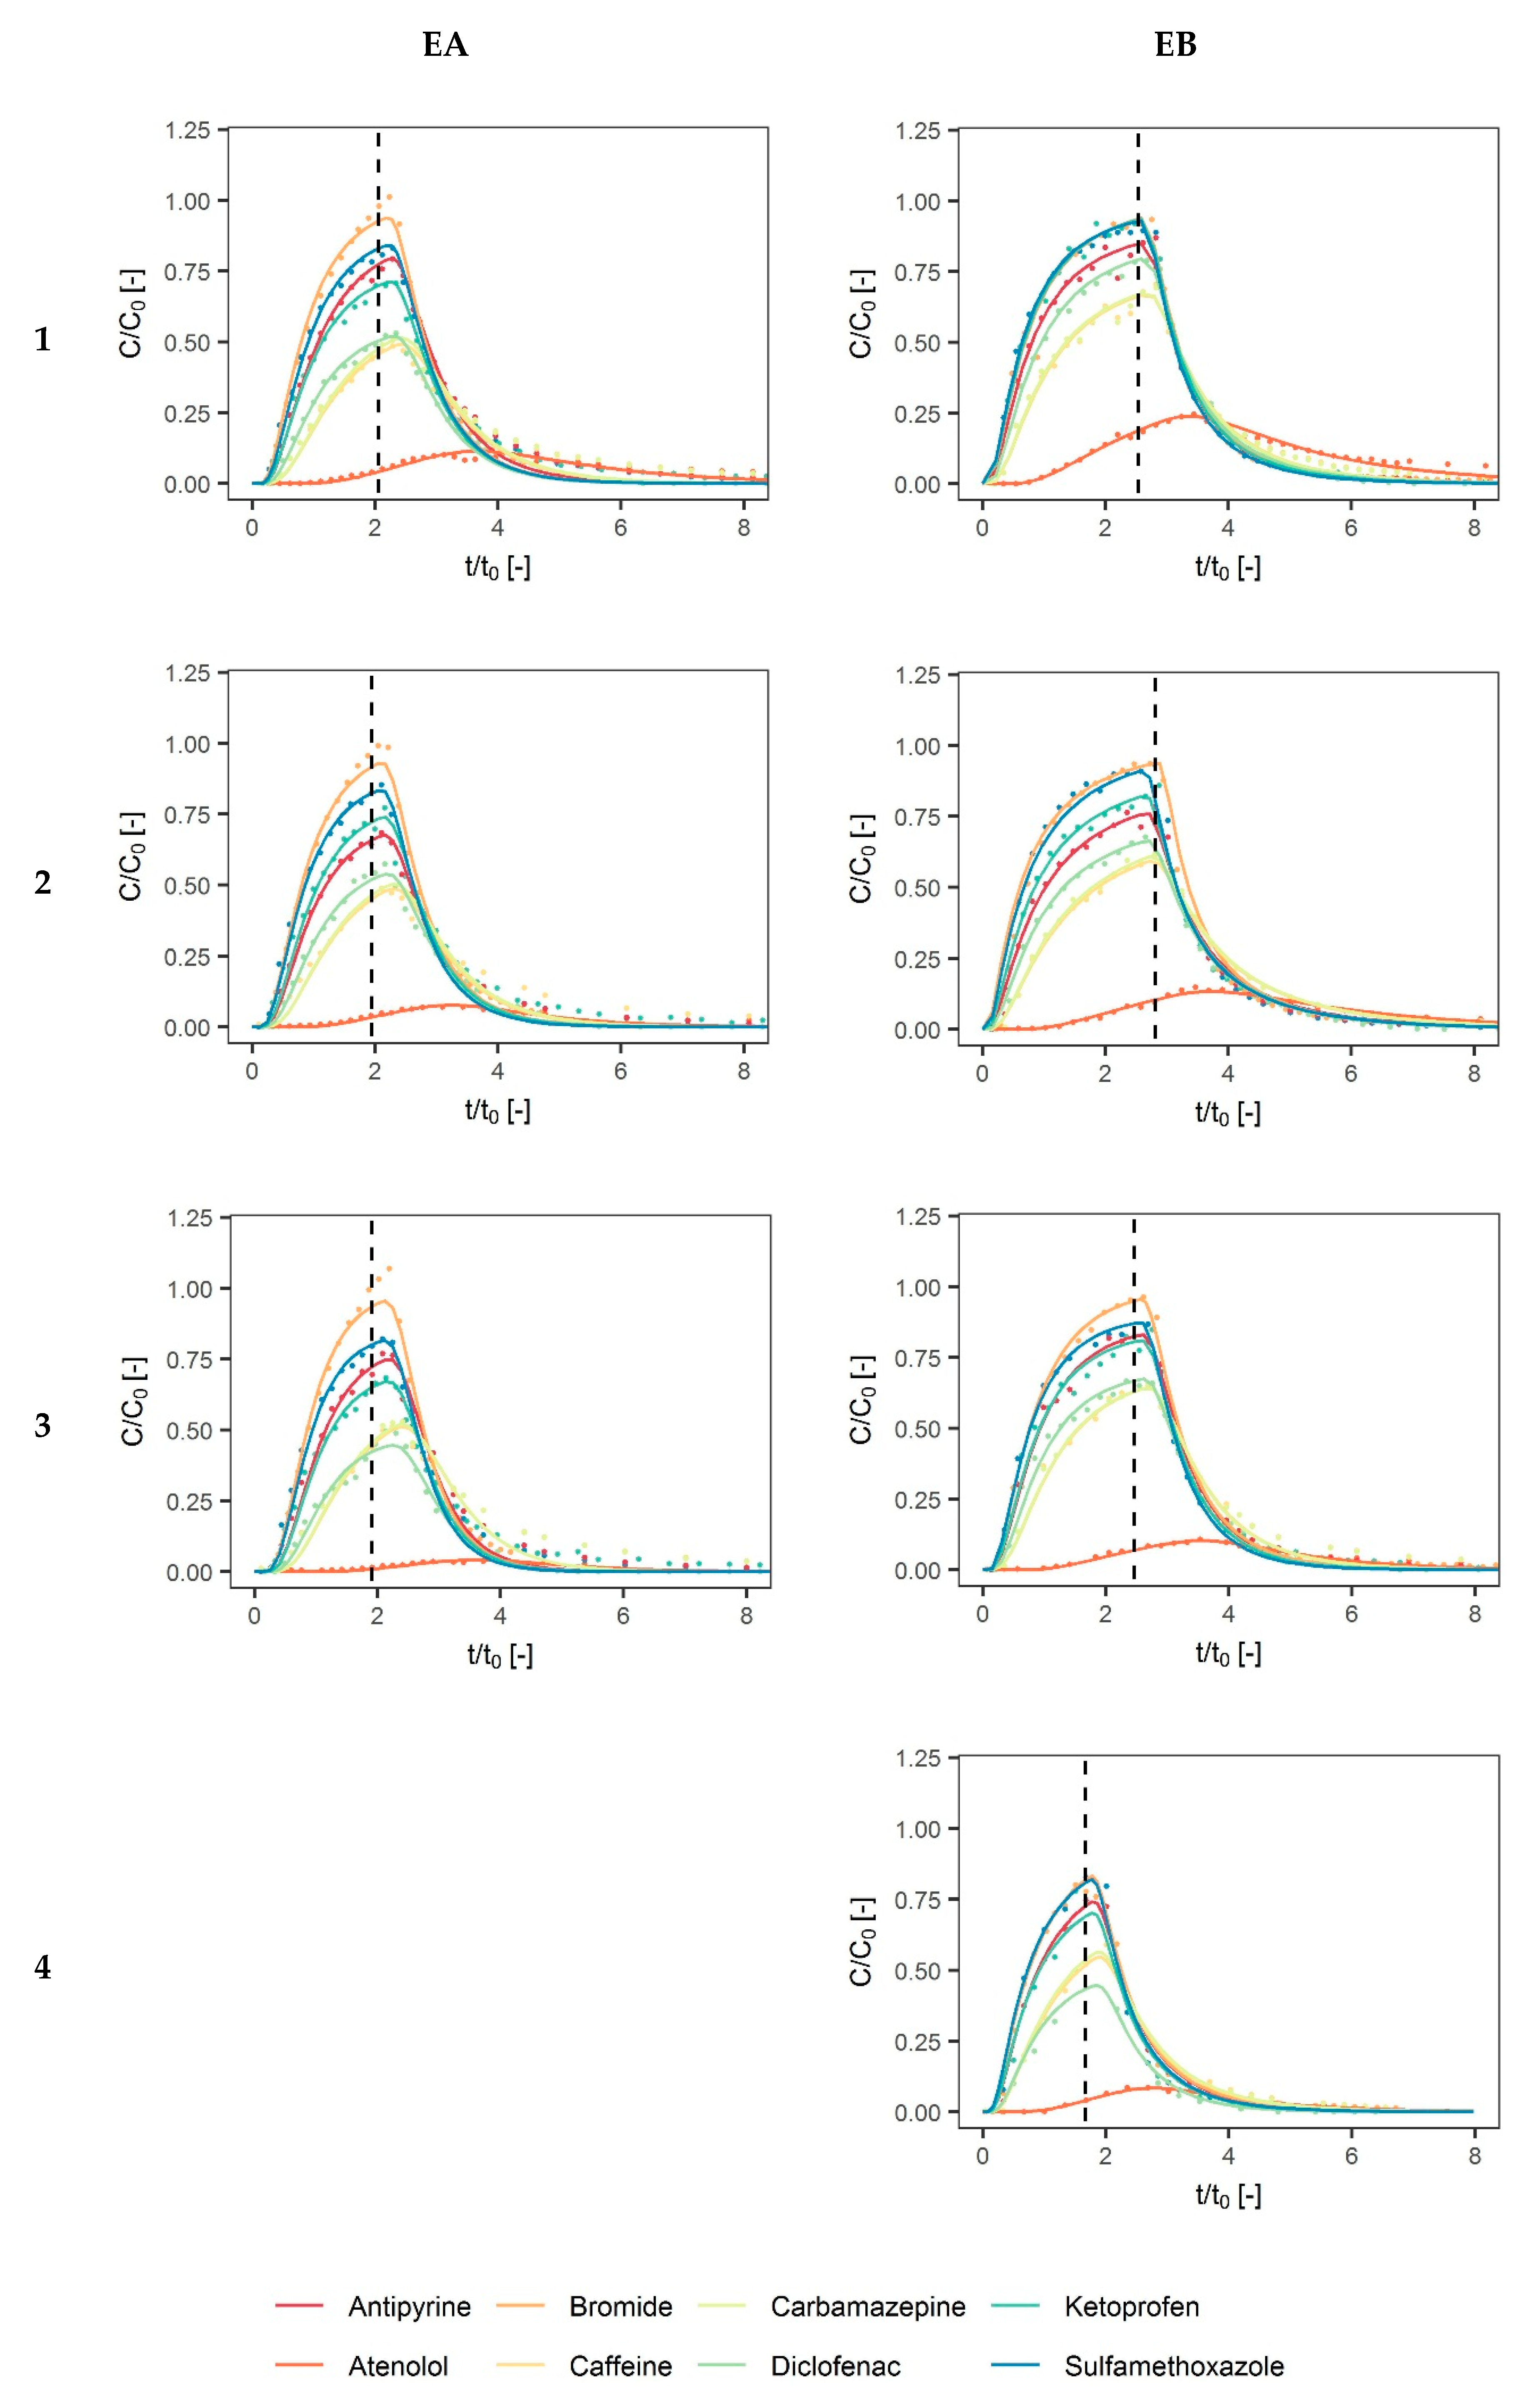
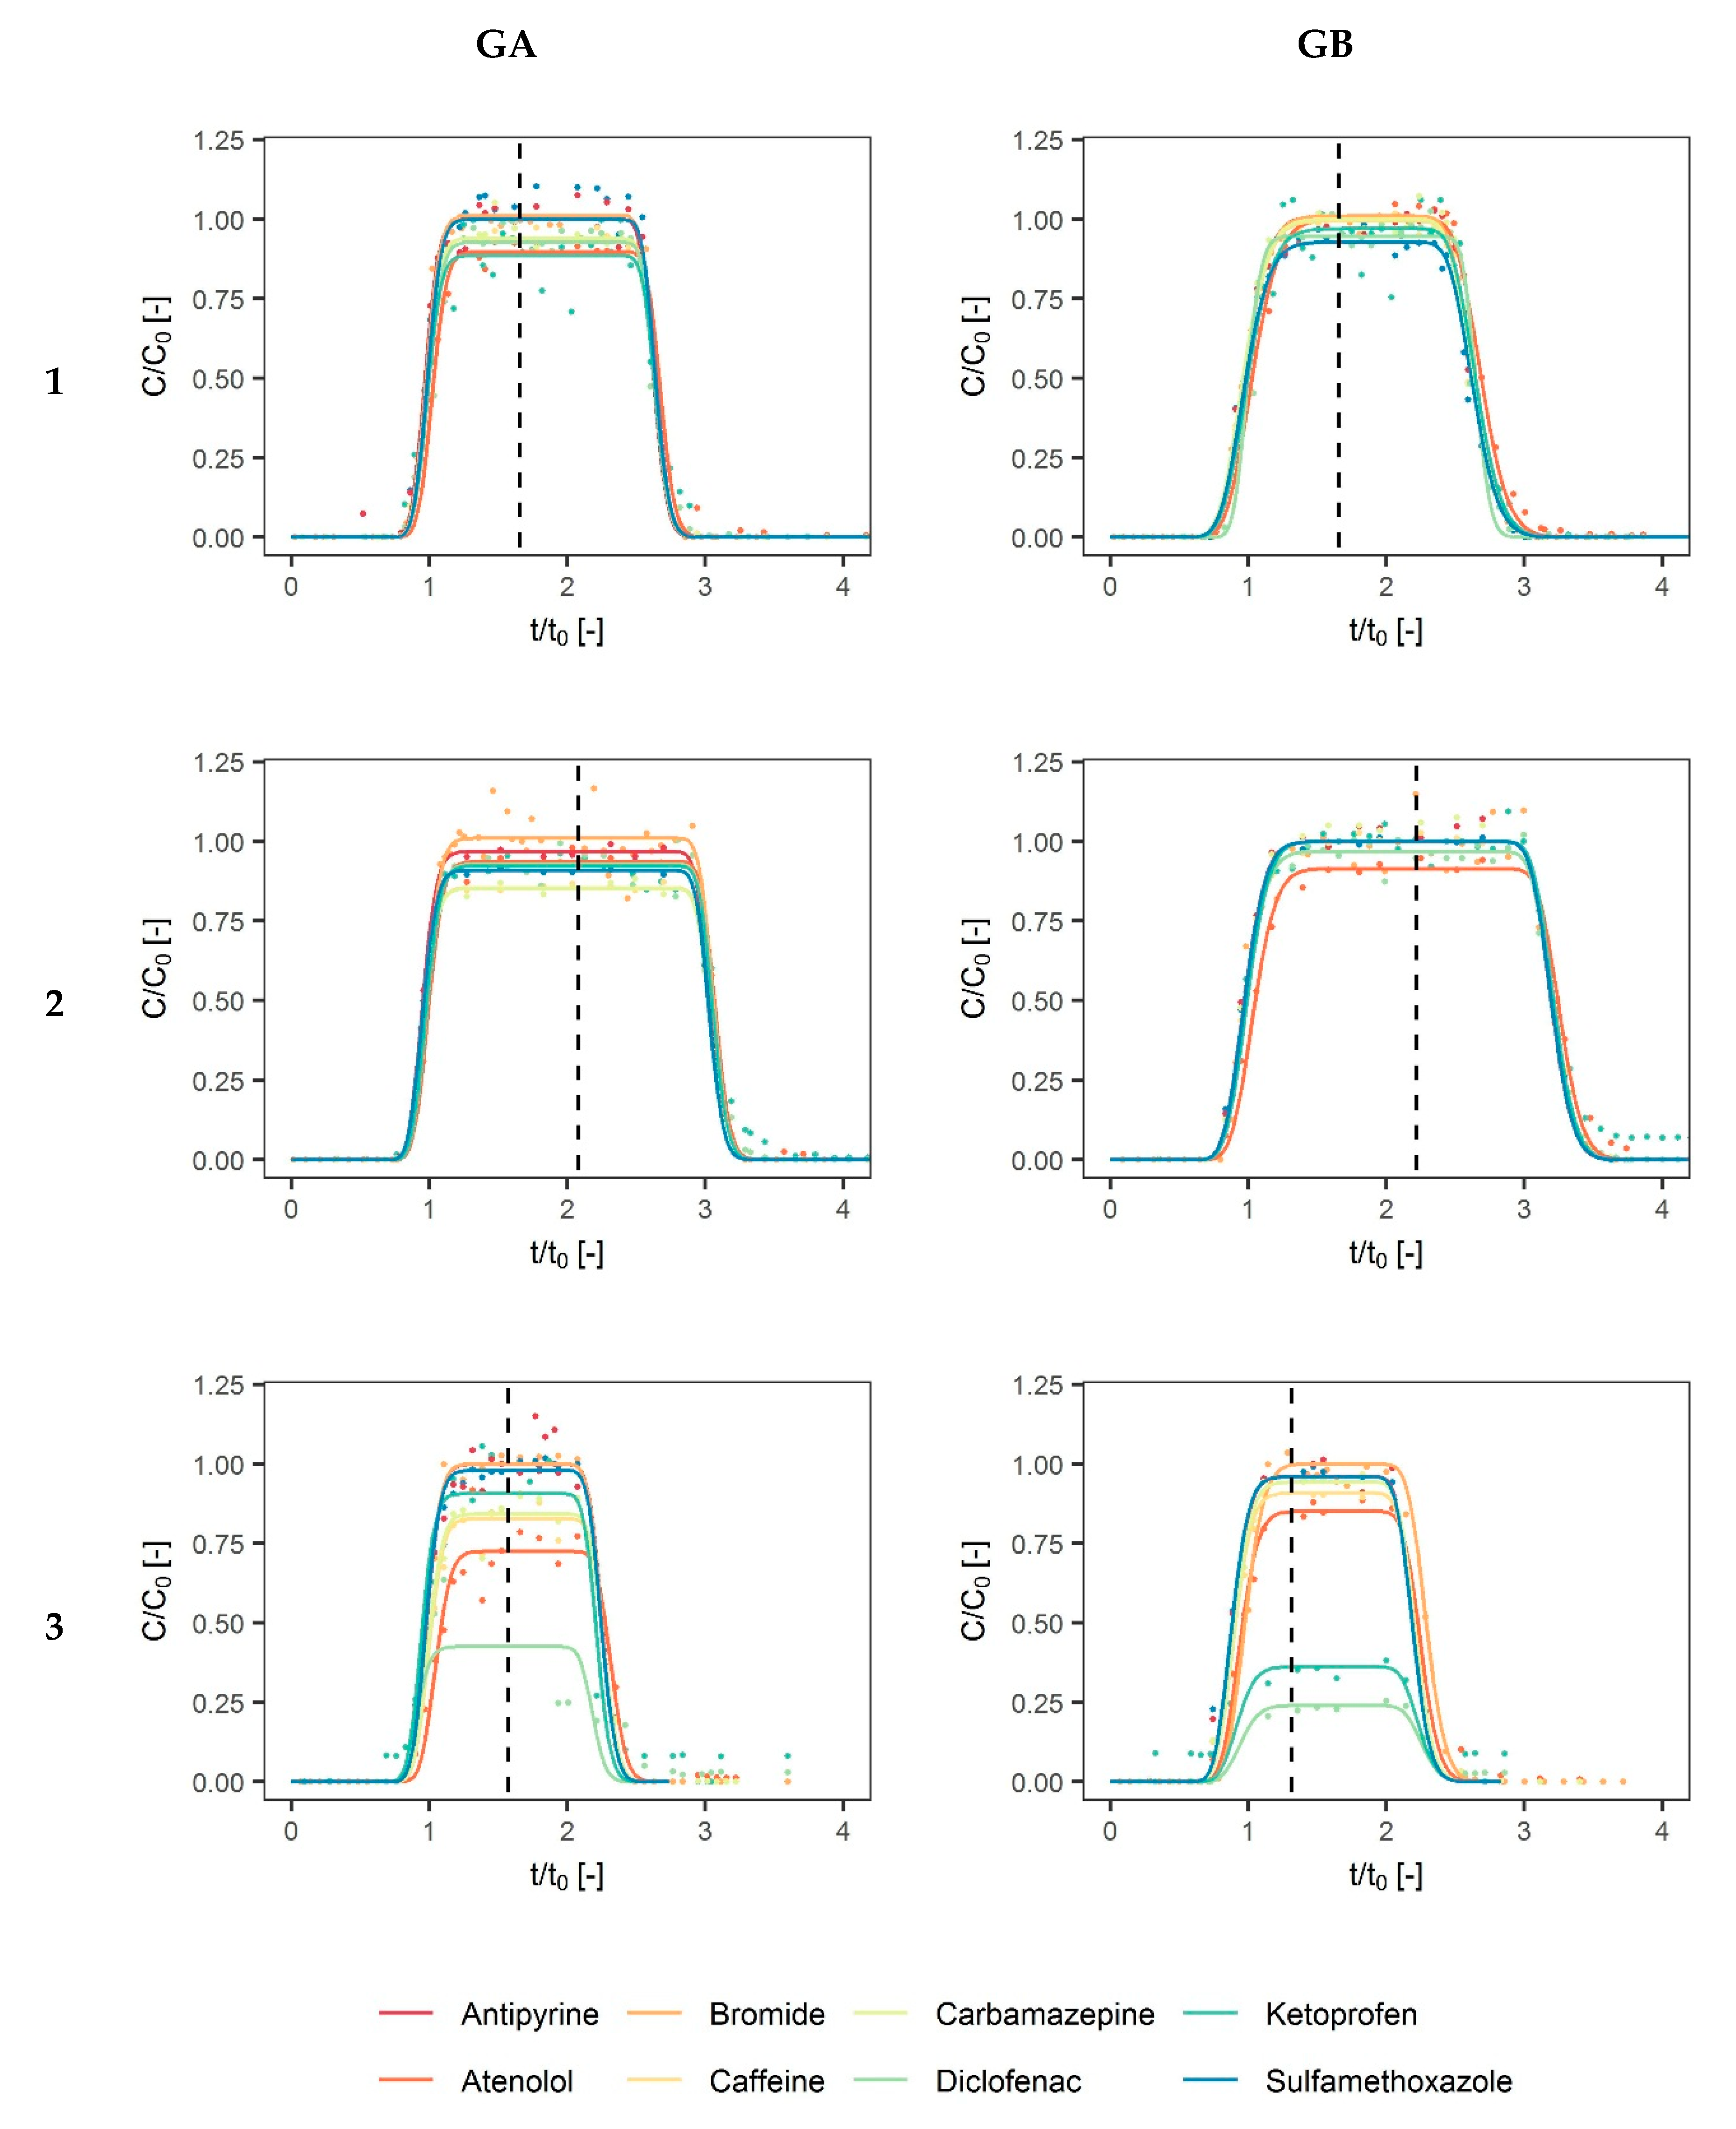
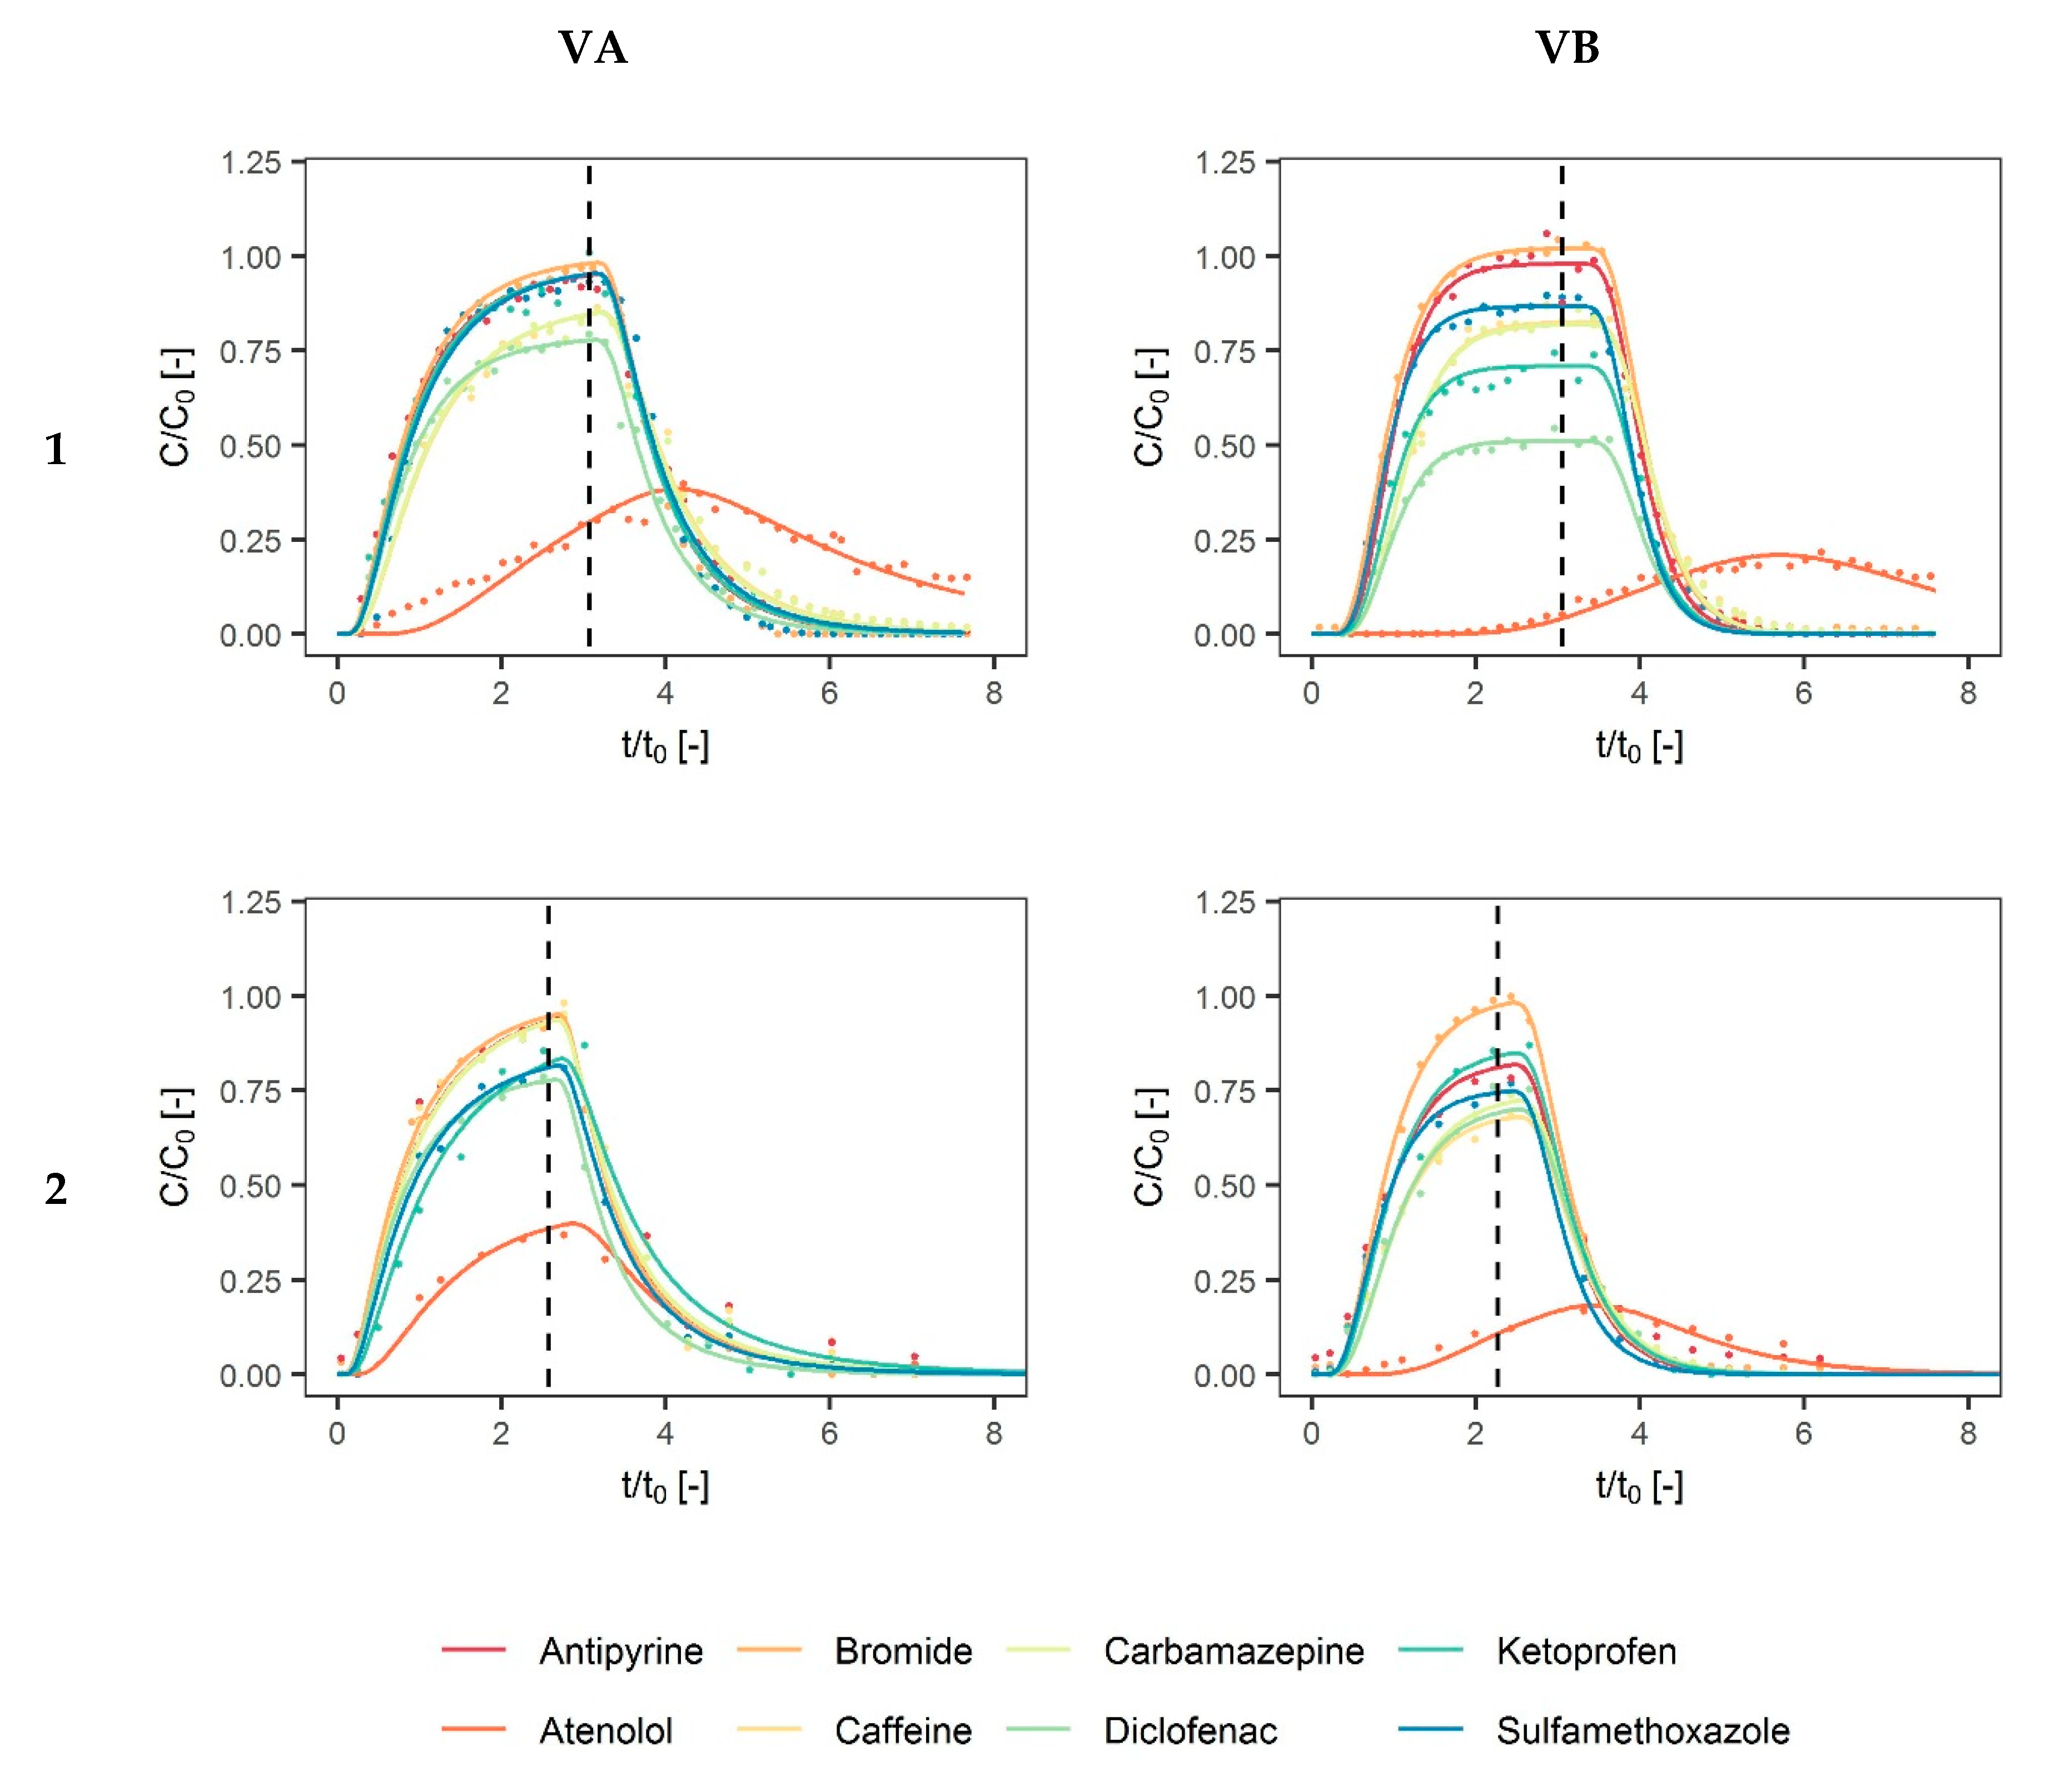
The breakthrough curves obtained for bromide enabled calculation of the conservative transport parameters for all the conducted column experiments, which are presented in Table 3. The different shapes of these curves (Figure 1, Figure 2 and Figure 3) indicate diverse transport mechanisms (mainly dispersion) in the tested sediments. The breakthrough curves of sediment E and V showed a pronounced tailing. Dispersivities varied between sediments (0.2–19 cm) and point to homogeneous (coarse sand G) or more heterogeneous transport (sandy loam V and medium sand E). Effective porosity, neff, was low in sediment E, indicating a large part of the water is immobile.
In addition the collective graphs in Figure 1, Figure 2 and Figure 3, separate breakthrough curves for each compound and experiment are presented in Supplementary Material (Figure S2).
3.2. Transport of Pharmaceuticals
3.2.1. E-Sediment (Medium Sand)
The retardation factors obtained for the E-sediment were the highest for atenolol and the lowest for sulfamethoxazole (Table 4, Figure 1). Compared to bromide, atenolol showed the highest retardation factors (5.6–7.1). The observed normalized concentrations of atenolol were low, indicating that sorption influenced its transport. Caffeine, carbamazepine, and diclofenac were also affected by sorption but to a lesser extent than atenolol, with R-values between 1 and 2. For sulfamethoxazole, an almost conservative behavior with R = 1 was observed. There were no noticeable differences in the R-values between the biotic and abiotic columns.
Biodegradation seemed not to be relevant for most of the compounds, because degradation rates were generally low and in the same range for abiotic as for biotic experiments. For sulfamethoxazole, for example, little degradation rates (0.1–0.6 d−1) were observed. Degradation was only relevant for atenolol (µ = 7.3–10.8 d−1).
The sorption and degradation of the compounds were not influenced by different flow velocities. Only the peak concentrations and recoveries of atenolol decreased from the highest to the lowest flow rate. This impact of the flow velocities was not obvious for the modelled degradation rates and retardation factors.
3.2.2. G-Sediment (Coarse Sand)
Retardation factors and degradation rates were low for all the compounds, independent of the flow velocity or biotic/abiotic conditions (Table 5). Therefore, almost all concentration curves were similar (Figure 2). The highest retardation factors (however, still very little) were observed for atenolol (1.00–1.07). The highest degradation was obtained for diclofenac and ketoprofen.
3.2.3. V-Sediment (Sandy Loam)
The retardation factors of most of the compounds were low in the V-sediment column, indicating no impact of sorption on the transport (Table 6, Figure 3). Atenolol had the highest retardation factors (2.6–5.3) and degradation rates (1.3–5.3 d−1). A higher degradation rate (6.02 d−1) for biotic conditions in contrast to the rate for abiotic conditions (2.83 d−1) suggested that biodegradation is important for the fastest pore-water velocities. Some biodegradation was also observed for diclofenac and ketoprofen. Little degradation was noticed for caffeine and carbamazepine but not for antipyrine and sulfamethoxazole.
The sorption and degradation of the compounds were not influenced by different flow velocities. Only the peak concentrations and recoveries of atenolol decreased from the highest to the lowest flow rate. The impact of the flow velocities was not obvious for the modelled degradation rates and degradation factors. Only for atenolol were the degradation rates higher with increasing velocity.
3.3. Sorption Coefficients Calculation
The identified retardation factors enabled approximation of the distribution coefficient between the solid and liquid phase, the sorption coefficient, Kd. The calculated parameters are listed in Table 7.
3.4. Nitrate, Oxygen
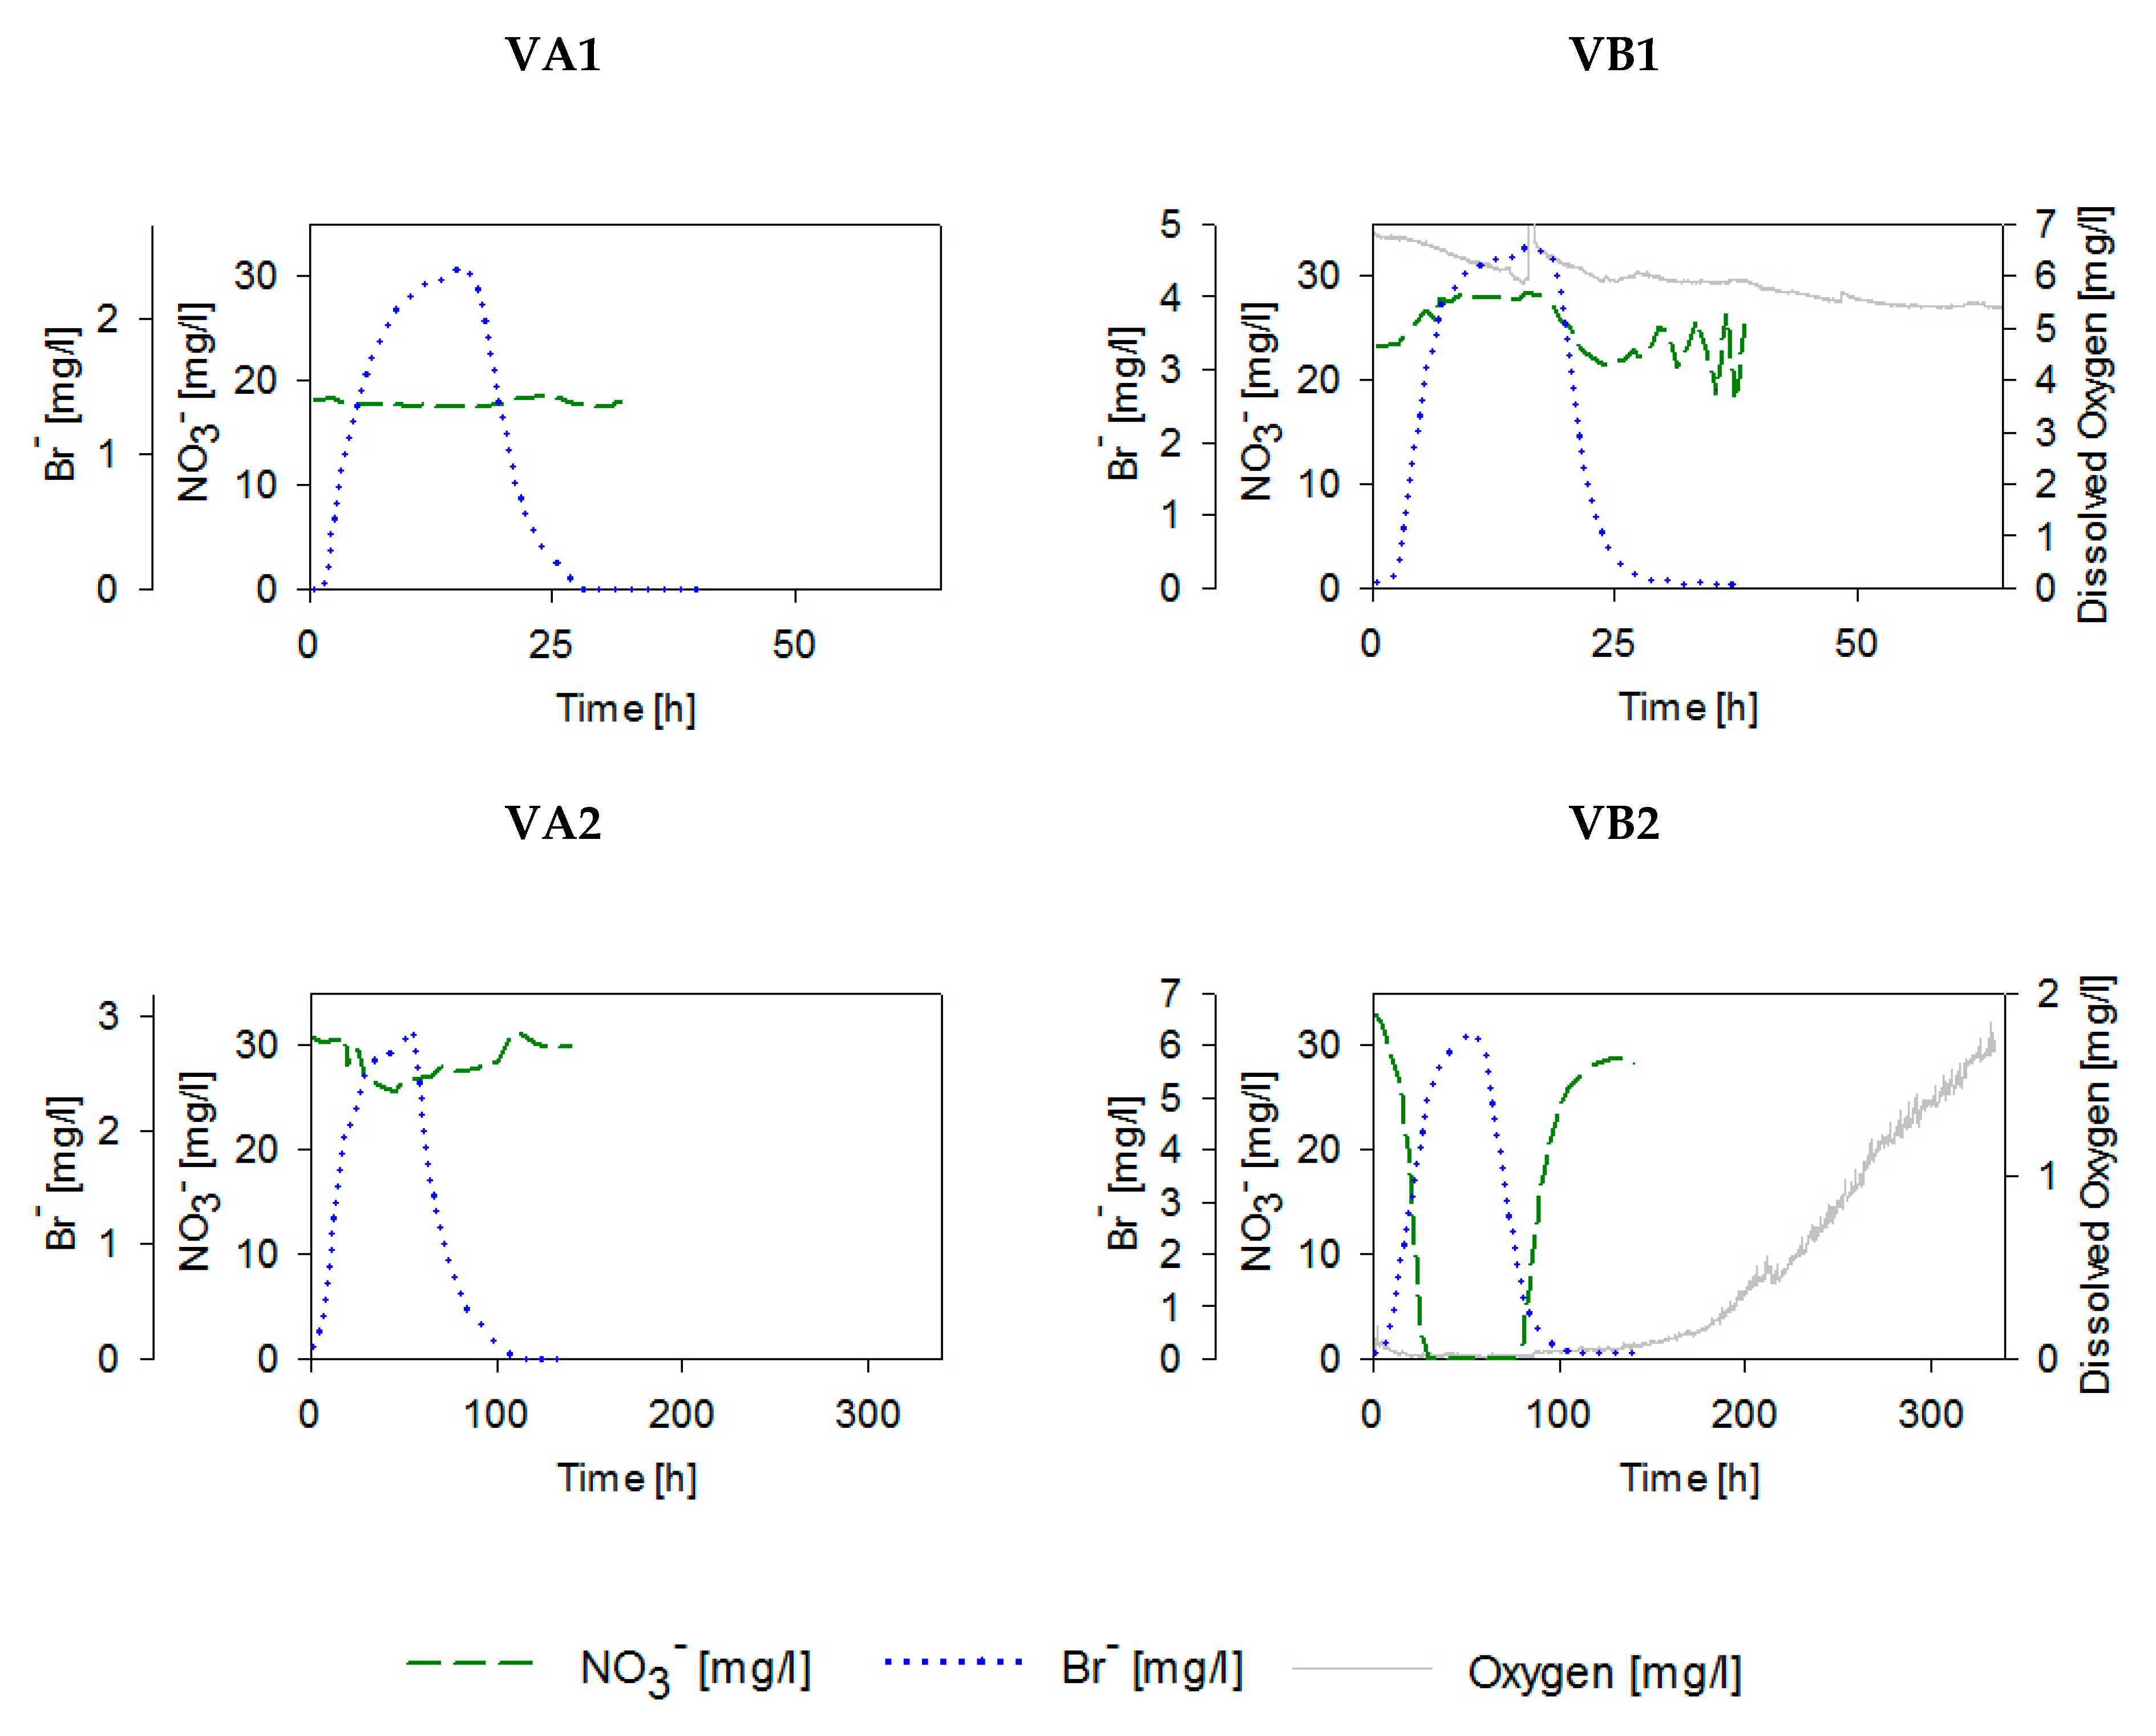
3.4.1. V-Sediment
The input concentrations of nitrate amounted to 20 to 30 mg/L (Figure 4). The nitrate concentration stayed relatively constant in the abiotic columns during all experiments. In the biotic column, nitrate remained unchanged during the first experiment, with the highest flow velocity. In the second experiment, nitrate decreased to 0 mg/L and started to increase as soon as the injected compounds passed the column, finally reaching the input concentration at the end experiment. Similar dynamics were observed for oxygen, with modest changes in VB1 and a distinct drop of dissolved oxygen in VB2. However, it lasted longer until oxygen reached the initial concentration. The observed reduction in nitrate concentrations indicates nitrate-reducing conditions in the presence of the pharmaceuticals at lower flow velocities. As mentioned above, dissolved oxygen was also monitored occasionally in the abiotic columns, but no fluctuations were observed (results not shown).
3.4.2. E-Sediment
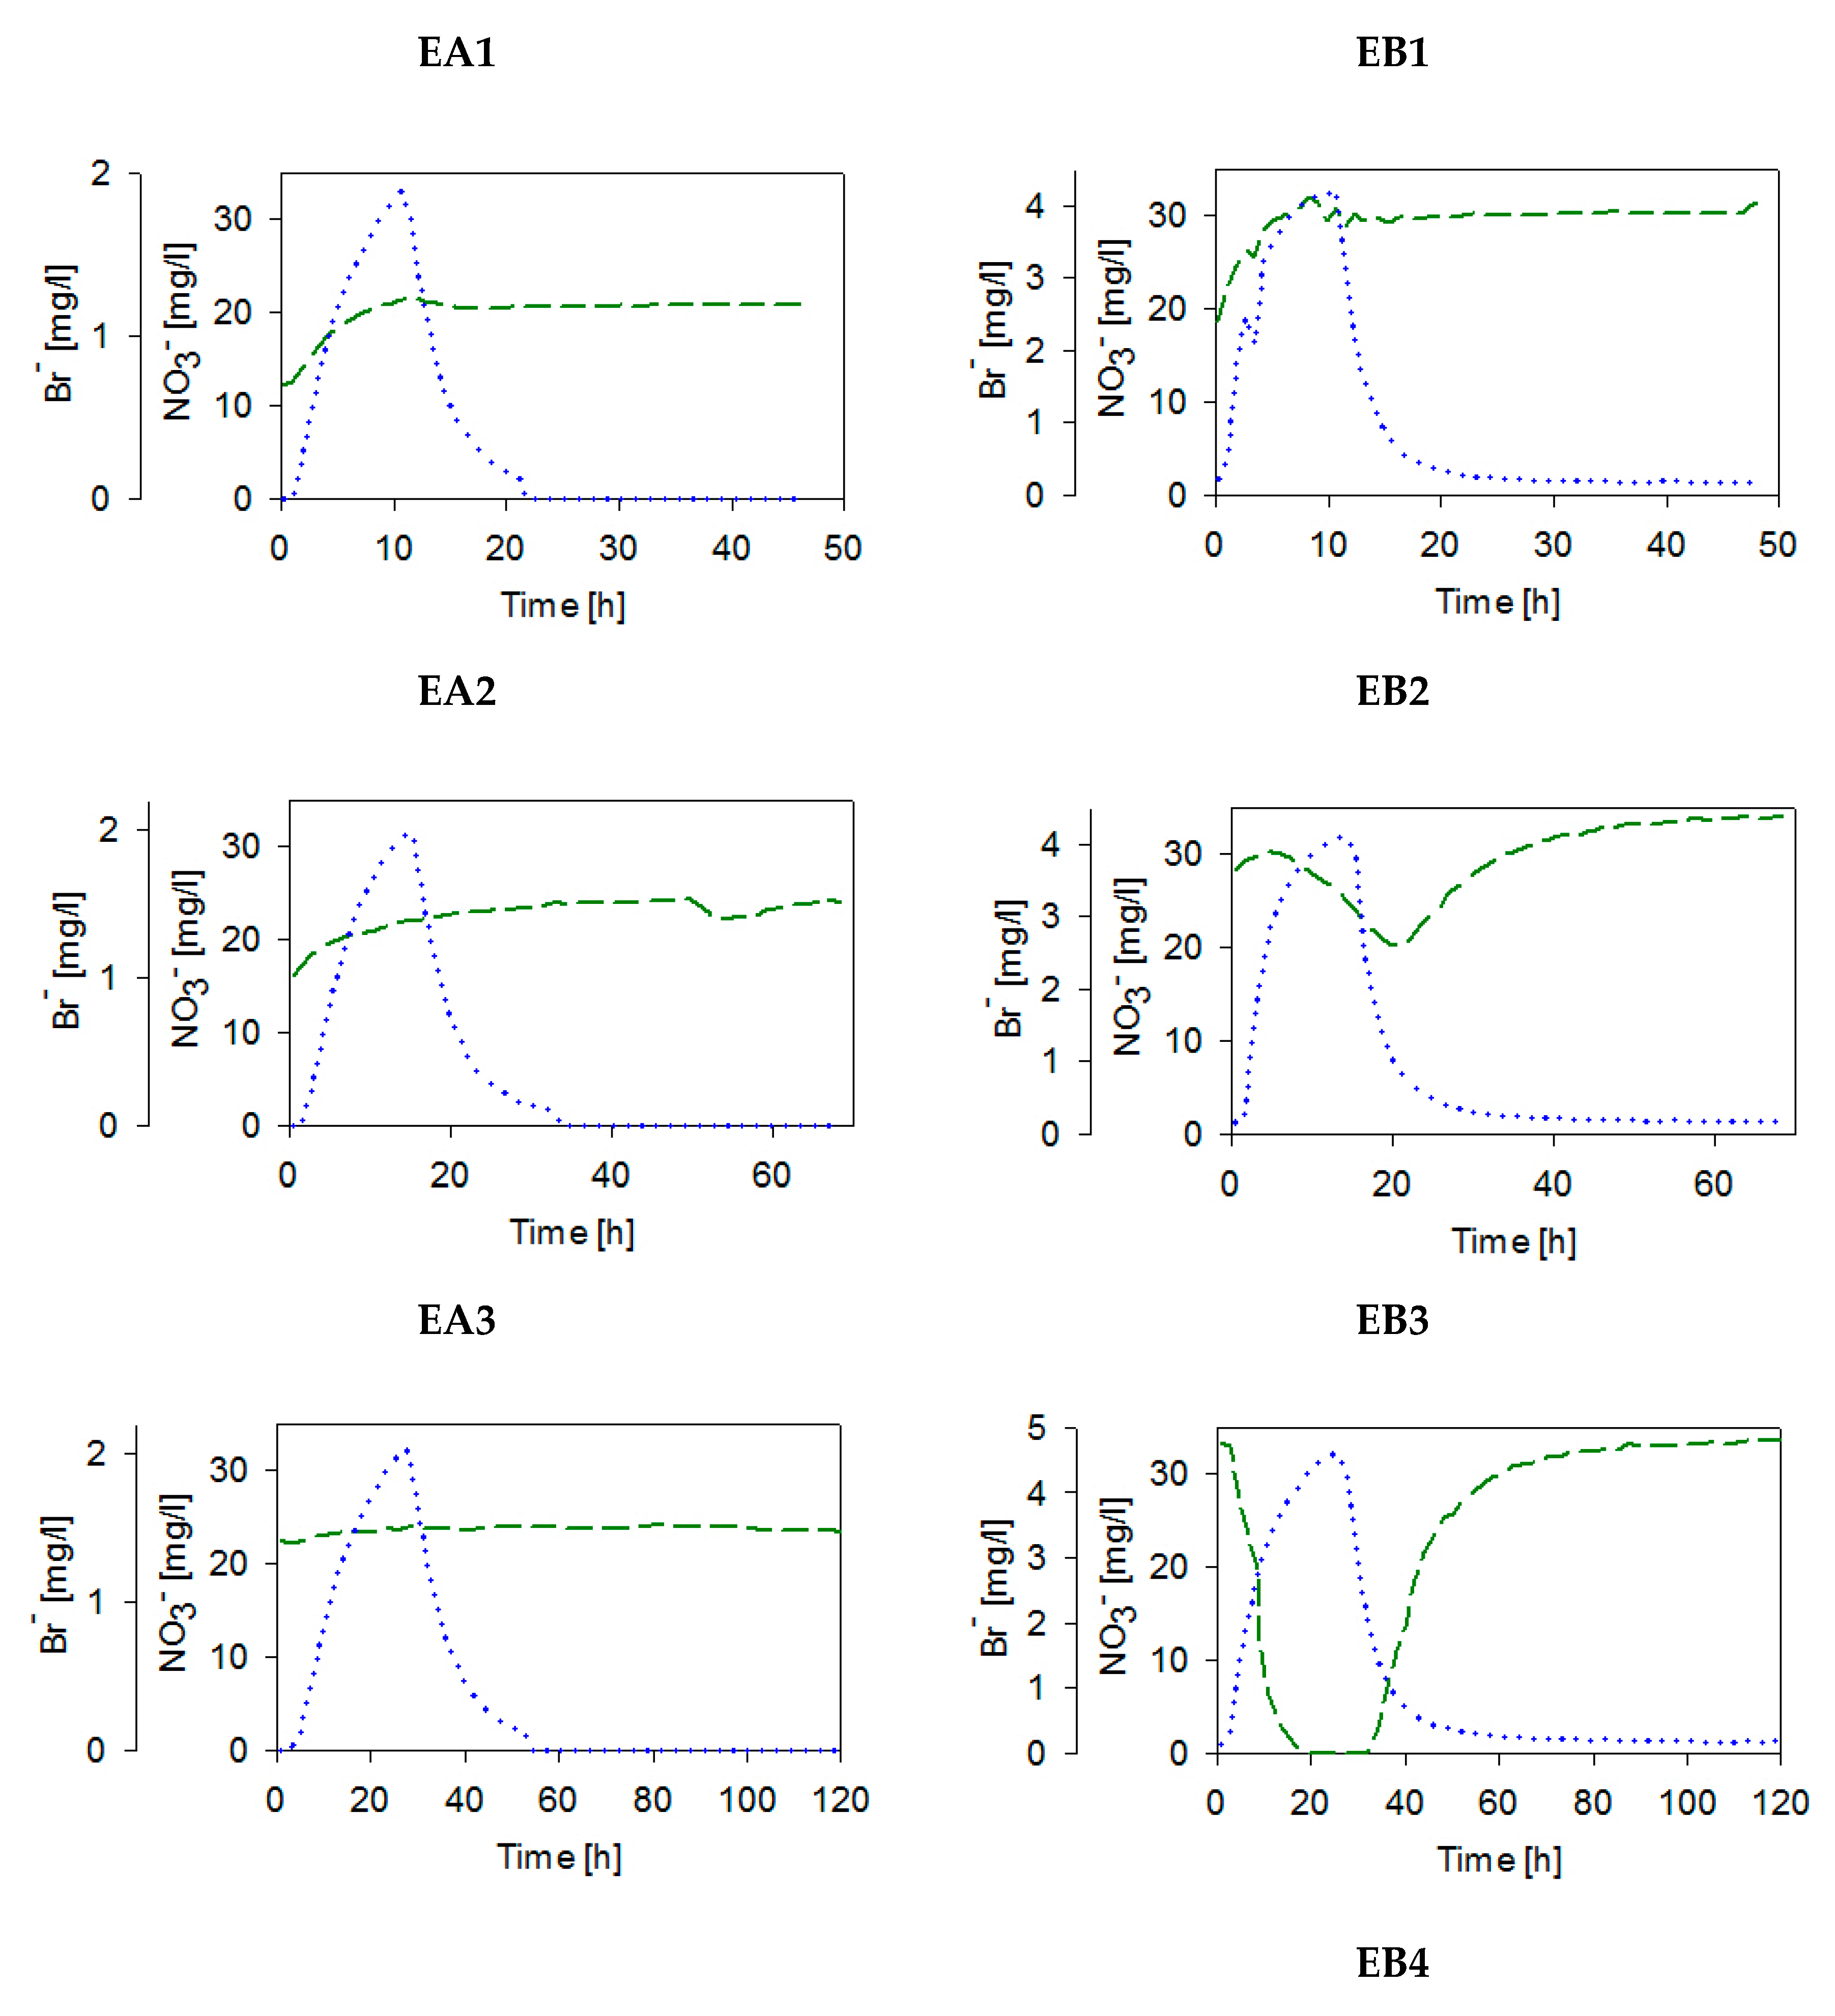
The input concentrations of nitrate were about 35 mg/L in the E-columns. The concentrations measured in the abiotic column were lower, which is also the consequence of analytical issues as the presence of azide interfered with nitrate in the interpretation of the results from ionic chromatography. The nitrate concentration stayed stable in the abiotic columns during all the experiments. In the biotic columns, nitrate was stable during the first experiment, with the fastest flow. In the second experiment, nitrate decreased for the first 20 h, reaching concentrations of 20 mg/L; afterwards, the concentrations increased, reaching the input concentration. In the third experiment of column EB, nitrate disappeared completely after 20 h. It appeared again 34 h after the start of the tracer injection while the tracer injection was stopped after 24 h (Figure 5).
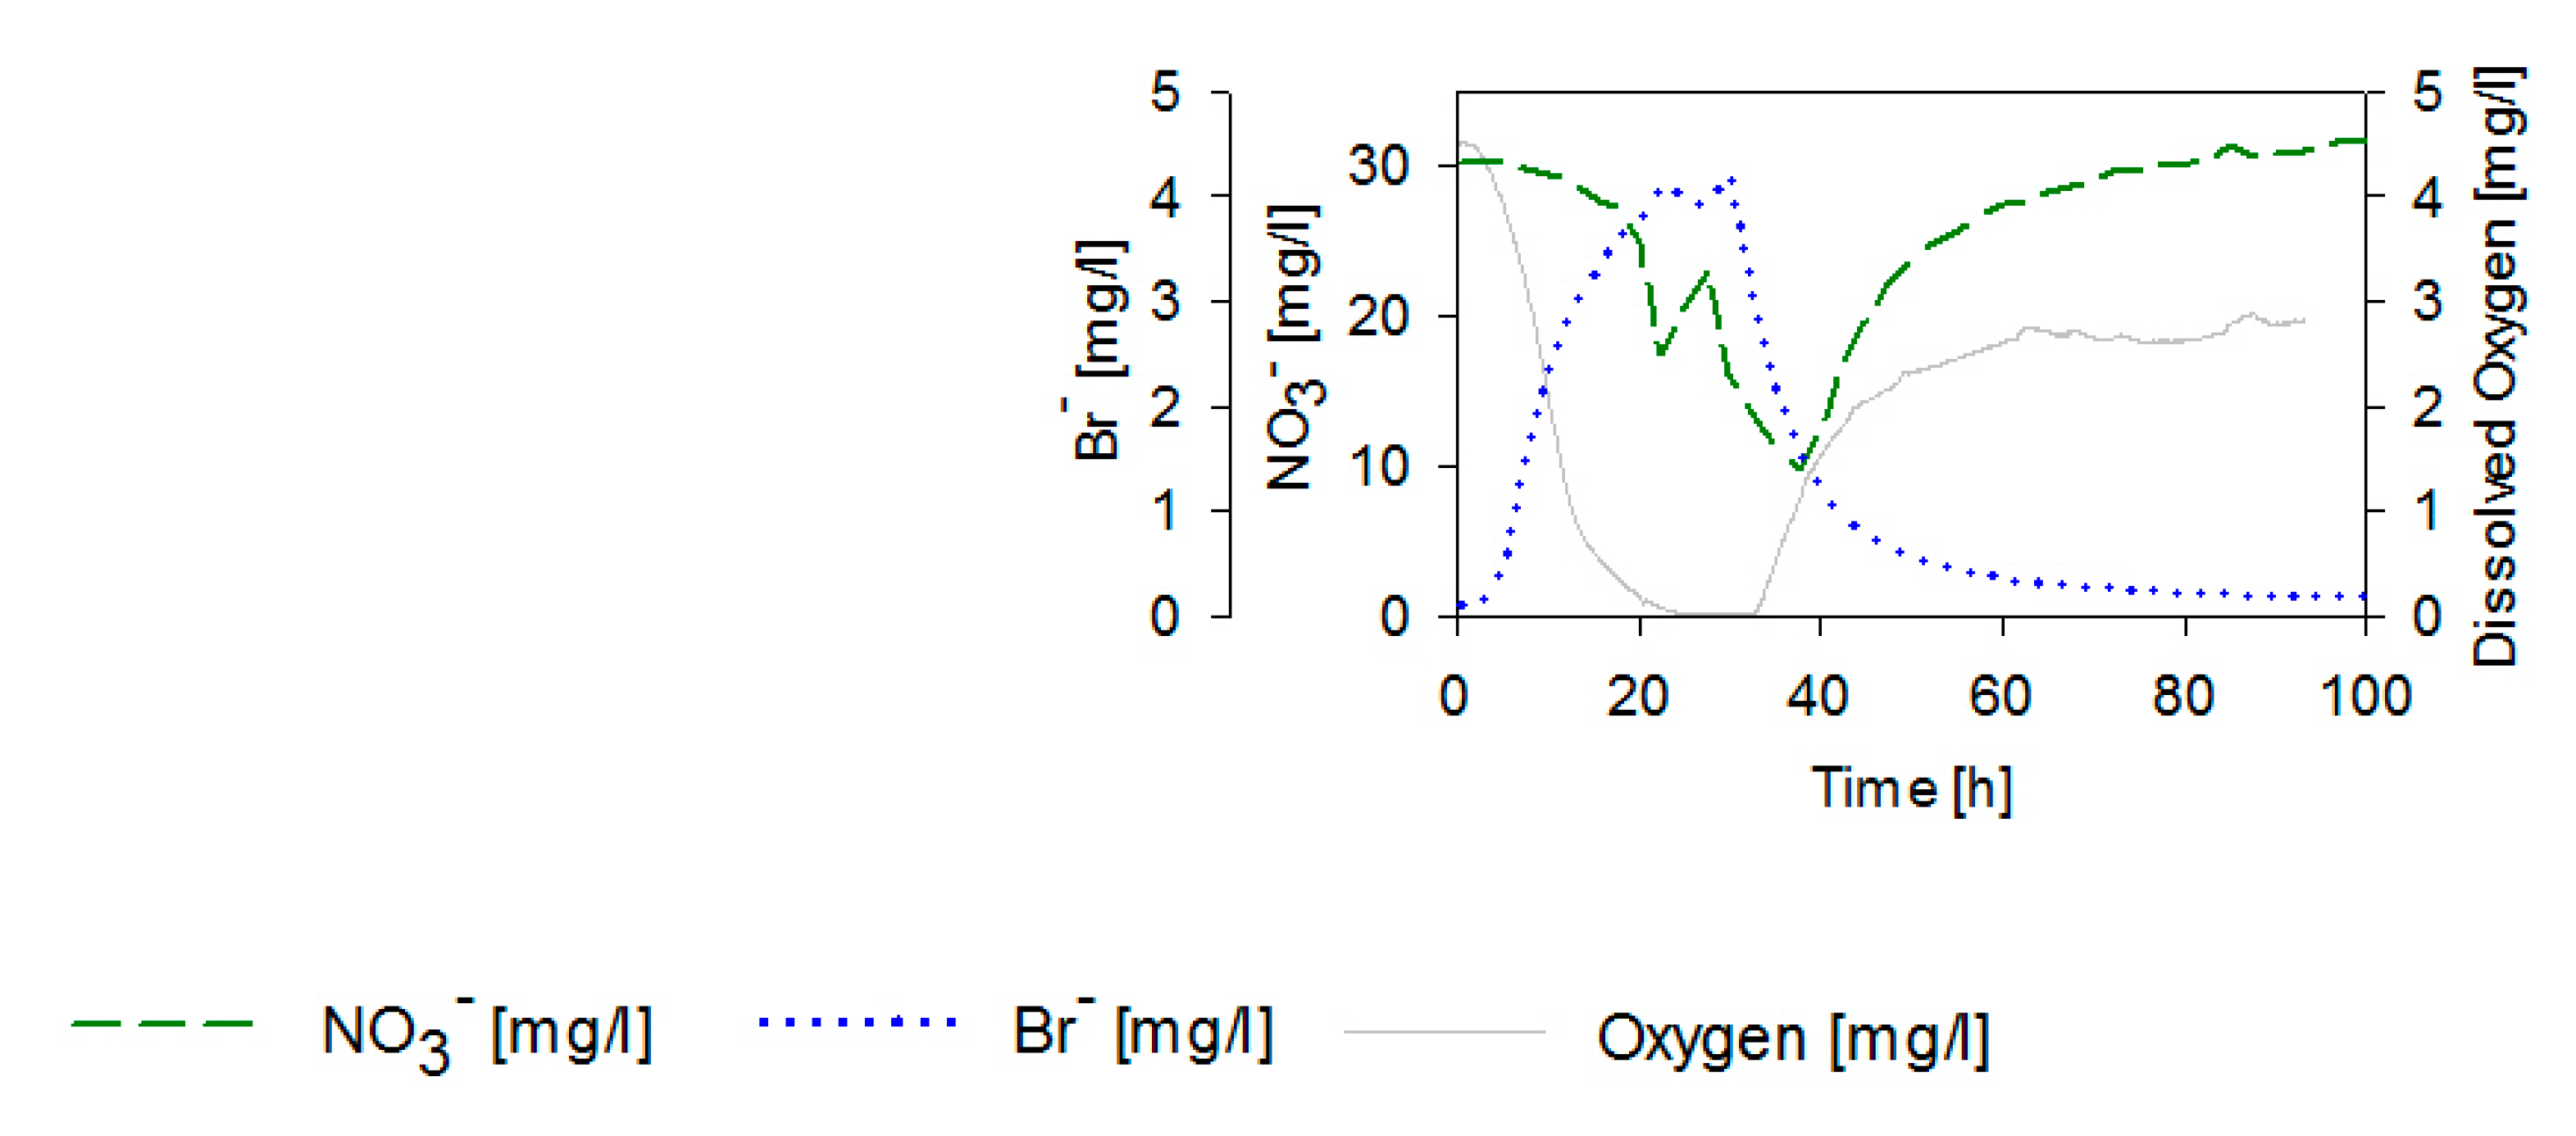
Oxygen was monitored only in the latter experiment (EB-4) and its concentration dropped down to zero within 20 h. Simultaneously, the nitrate concentration decreased, reaching the minimum after 30 h and returning to initial conditions after 60 h. In this case, the tracer injection was stopped after 21 h.
4. Discussion
4.1. Conservative Transport
Modelling of the breakthrough curves with a conventional deterministic equilibrium convection dispersion equation resulted in a good fit of the calculated curves when compared to the observations. The breakthrough curves of the conservative tracer (bromide) indicated different transport in the tested sediments. The dispersivities varied strongly and showed homogeneous (coarse sand, G) or more heterogeneous transport (medium sand, E). In the medium sand (sediment E), a low effective porosity, neff, of 0.16 and 0.14 in comparison to total porosity, n (0.32 and 0.33), was observed, indicating a large fraction of immobile water in this system. Moreover, the breakthrough curves obtained for the E-sediment showed a pronounced tailing. Differences between the observed and modelled values were mainly found for the tailing part of the breakthrough curve. It can be explained by possible small-scale heterogeneities [38] or the presence of immobile regions. Anomalous transport resulting in tailed breakthrough curves is related to non-Fickian diffusion [39]. In this study, the breakthrough curves were modeled with standard convection-dispersion equation assuming equilibrium sorption. Lu et al. (2018) [39] pointed out that the CDE model captures the first part of the breakthrough curve and its peak but underestimated the later tail. The results could be improved by additionally accounting for exchange of the solutes between mobile and immobile water [40].
4.2. Retardation and Biodegradation
The results of the presented column experiments allowed calculation of the key transport parameters and conclusions about the behavior of particular pharmaceutical compounds when transported in groundwater. As commonly known, retardation depends on the sediment type and its properties, e.g., TOC or clay content. Retardation factors were the lowest in coarse sand (sediment G) and the highest in medium sand (sediment E), suggesting the dependency of sorption on the amount of organic carbon. The clay content seemed less important compared to TOC when explaining sorption in the three studied sediments.
In general, the differences in transport parameters among the experiments with the tested different flow velocities were small. The retardation rates were independent of the applied flow rates, indicating that sorption is not affected by changes of the flow velocity. An increase of the retardation factor, R, with faster flow velocity was observed only for atenolol in sediment E, indicating higher sorption for faster flow velocities. Degradation rates were higher with increasing velocity for caffeine, carbamazepine, and atenolol in sediment E, as well as atenolol in sediment V. This change was usually observed in both biotic and abiotic conditions. Only for atenolol in sediment V was the increase of degradation slightly higher in the biotic than in the abiotic column. In conclusion, the flow velocity does not influence sorption, but eventually the degradation rates. The dependency of the flow velocity and retardation factor, R, or degradation rate, µ, are additionally graphically presented in Supplementary Material (Figure S3 and Figure S4).
Almost identical retardation factors were generally found for abiotic and biotic systems. The change of the degradation rate was usually observed in both biotic and abiotic conditions. Therefore, a decrease of the concentrations cannot be explained by biodegradation. Only for atenolol in sediment V was the increase of degradation slightly higher in the biotic than in the abiotic column. Because the degradation rates were in the same range for the abiotic and the biotic experiments, whether the changes in nitrate and oxygen concentrations were attributed to the biodegradation of the pharmaceutical or the methanol used as solvent cannot be answered.
The obtained results are discussed in detail for each compound separately below, except the G-sediment, because almost no retardation was noticed for any of the tested compounds.
Antipyrine neither underwent degradation nor was it significantly retarded. In the E-sediment, retardation rates were the highest (REA,antipyrine = 1.22–1.27, REB,antipyrine = 1.16–1.24), whereas retardation were close to 1 in all V-experiments. These findings are consistent with the earlier reported conservative transport behavior of antipyrine [41,42,43].
The highest retardation was found within this study for atenolol, with REA,atenolol = 5.63–6.39, REB,atenolol = 6.27–7.06, RVA,atenolol = 2.57–4.74, RVB,atenolol = 3.70–5.33. Burke et al. (2013) [41] found similar retardation factors in a sand column experiment (R > 6). Atenolol was also the compound with the most pronounced differences in degradation between the tested flow velocities in experiment series E and V.
In contrast to previous findings [17] showing retardation of caffeine of 2.7 and 3.5 for sand and till, respectively, in this study, small retardation was observed. Caffeine was averagely retarded in the E-sedment (REA,caffeine = 1.83–1.97, REB,caffeine = 1.67–1.87), and only small retardation was found in the V-sediment (RVA,caffeine = 1.09–1.53, RVB,caffeine = 1.20).
The retardation factors obtained for carbamazepine were low (REA,carbamazepine = 1.81–1.95, REB,carbamazepine = 1.66–1.84, RVA, carbamazepine = 1.10–1.32, RVB, carbamazepine = 1.20–1.21). Exemplary R-values found in other studies are: 1.90 [44], 2.5 [45], and 2.8–3.3 [46]. This compound is often proposed as a good tracer of anthropogenic impact on water bodies due to its conservative character [7,47]. However, in this study, little removal was observed, mostly in sediment E, as well as an increase of the degradation rate, µ, with rising flow velocity.
Also, little retardation was found for diclofenac (REA,diclofenac = 1.48–1.54, REB, diclofenac = 1.35–1.57, RVA,diclofenac = 1.05–1.09, RVB, diclofenac = 1.13–1.18), which is in agreement with previous studies, where R varied between 1 [45] and 2.6 [46]. For ketoprofen, similar results to diclofenac were found (REA,ketoprofen = 1.19–1.54, REB,ketoprofen = 1.05–1.13, RVA,ketoprofen = 1.05–1.45, RVB,ketoprofen = 1.06–1.07). Sulfamethoxazole indicated no retardation due to sorption in any sediment, as R-values were close to 1. Previous studies support these observations [14,45,48].
4.3. Comparison of Batch and Column Studies
As mentioned above, we previously analyzed sorption processes in a batch study [31]. The sorption coefficients obtained in the column experiments were much lower than those obtained in the static batch experiments (from 2 times lower for atenolol in sediment V up to some thousands of times lower as for diclofenac in sediment V). Still, the general observations (relative importance of sorption between the tested sediments and compounds) were in agreement with results from batch experiments for V- and E-sediments. For instance, in the present study, the highest retardation factors were observed for atenolol in contrast to (almost) conservative compounds, such as antipyrine or sulfamethoxazole, and the same was found for the sorption coefficients, Kd, in batch studies for E and V sediment. The relatively high Kd values previously obtained for diclofenac (24 in sediment E and 240 in sediment V) in batch experiments appeared to be overestimated when compared to flow-through experiments, with results of 0.08 and 0.02 to 0.05, respectively. Differences were also observed for sediment G. Here, sorption was found in the batch experiments [31]; however, no retardation was observed in the column experiments.
In the flow-through experiments, sorption is determined in non-equilibrium conditions, whereas in batch experiments, sorption is determined in equilibrium conditions [7]. Moreover, in batch experiments, sediment: water ratios differ, usually meaningfully, from realistic aquifer conditions. Also, the disaggregation of clusters during shaking can result in an increase in the surface area and, consequently, increase in sorption [49]. Therefore, sorption coefficients from the static test should only be transferred to dynamic flow conditions with caution.
4.4. Experimental Setup
Column experiments are commonly used to investigate transport behavior and are well-documented in the literature. The physical dimensions of columns, however, have not been standardized yet [7]. In the present study, column experiments were designed according to current “state-of-art”, i.e., diameter-to-length ratio should be reasonable to avoid scaling effects, and to make the analysis less complex by excluding transversal dispersivity from the transport model [7]. The diameter-to-length ratio was ca. 1:5 (sediments G and E) and 1:10 (sediment V). Moreover, since homogenized sediments were used, anisotropy in hydraulic conductivity can be neglected but might be of relevance at the field sites. Due to technical issues, the experiments with the sediment V were performed in columns with a smaller diameter (5 cm). Normally, the obtained transport parameters should be system parameters and independent on the dimensions of the column setup. Still, any differences due to different column dimensions cannot be assessed here.
Using the same time of tracer injection for all sediments was a challenge at the conceptual stage of the experiment as a priori effective porosities and/or mean transit times were unknown. Longer pulses are preferred over Dirac-type pulse injections when investigating low-level concentrations, because the tracer concentrations must still be detectable in the outflow.
Still the difference in injection time should have no impact on the results as they were considered in the modelling. Breakthrough curves obtained from step inputs are less sensitive to appropriate modeling of physico-chemical processes occurring within the column when compared to the results of experiments applying a short tracer injection (approximated by Dirac pulse) [50]. Additionally, the application of compounds less soluble in water requires the use of methanol or another organic solvent, which should be minimized to avoid the risk of density-driven flow [51].
5. Conclusions
The transport of selected pharmaceutical compounds in natural aquifer sediments was studied in laboratory column experiments under saturated conditions. Most of the tested pharmaceuticals were mobile and, therefore, are a potential threat to groundwater quality deterioration, once they enter the subsurface. The transport of pharmaceuticals in groundwater was mostly independent of the tested flow velocities. The main differences in sorption and degradation were observed between the different sediments. Consequently, it is crucial to specify site-specific transport parameters, which can be derived from laboratory column experiments and which improve the understanding of transport processes in aquifers contaminated with pharmaceuticals. The obtained transport parameters may be further used to study site-specific vulnerability, for example, with hydrogeochemical modelling approaches.
Supplementary Materials
The following are available online at https://www.mdpi.com/2073-4441/12/1/14/s1, Figure S1: Experimental setup of the column experiments, Figure S2: Breakthrough curves, Figure S3: Influence of flow velocity on retardation factor R, Figure S4: Influence of flow velocity on degradation rate µ.
Author Contributions
Conceptualization, A.K., F.B. and C.S.; methodology, A.K., F.B. and C.S.; formal analysis, A.K. and F.B..; investigation, A.K. and F.B.; data curation, A.K.; writing—original draft preparation, A.K.; writing—review and editing, A.K. and C.S.; visualization, A.K.; supervision, C.S.; project administration, C.S.; funding acquisition, C.S. All authors have read and agreed to the published version of the manuscript.
Funding
This work was funded by the BMBF project ‘PERSIST’ (02WU1349, JPI Water).
Conflicts of Interest
The authors declare no conflict of interest.
References
- Tang, Y.; Yin, M.; Yang, W.; Li, H.; Zhong, Y.; Mo, L.; Liang, Y.; Ma, X.; Sun, X. Emerging pollutants in water environment: Occurrence, monitoring, fate, and risk assessment. Water Environ. Res. 2019, 91, 984–991. [Google Scholar] [CrossRef] [PubMed] [Green Version]
- Lapworth, D.J.; Baran, N.; Stuart, M.E.; Ward, R.S. Emerging organic contaminants in groundwater: A review of sources, fate and occurrence. Environ. Pollut. 2012, 163, 287–303. [Google Scholar] [CrossRef] [PubMed] [Green Version]
- Boxall, A.B.A.; Rudd, M.A.; Brooks, B.W.; Caldwell, D.J.; Choi, K.; Hickmann, S.; Innes, E.; Ostapyk, K.; Staveley, J.P.; Verslycke, T.; et al. Review Pharmaceuticals and Personal Care Products in the Environment: What Are the Big Questions? Environ. Health Perspect. 2012, 120, 1221–1229. [Google Scholar] [CrossRef] [PubMed]
- Sarmah, A.K.; Meyer, M.T.; Boxall, A.B.A. A global perspective on the use, sales, exposure pathways, occurrence, fate and effects of veterinary antibiotics (VAs) in the environment. Chemosphere 2006, 65, 725–759. [Google Scholar] [CrossRef]
- Kümmerer, K. The presence of pharmaceuticals in the environment due to human use—Present knowledge and future challenges. J. Environ. Manag. 2009, 90, 2354–2366. [Google Scholar] [CrossRef]
- Meckenstock, R.U.; Elsner, M.; Griebler, C.; Lueders, T.; Stumpp, C.; Dejonghe, W.; Bastiaens, L.L.; Springael, D.; Smolders, E.; Boon, N.; et al. Biodegradation: Updating the concepts of control for microbial clean-up in contaminated aquifers. Environ. Sci. Technol. 2015, 49, 7073–7081. [Google Scholar] [CrossRef] [Green Version]
- Banzhaf, S.; Hebig, K.H. Use of column experiments to investigate the fate of organic micropollutants—A review. Hydrol. Earth Syst. Sci. Discuss. 2016, 20, 3719–3737. [Google Scholar] [CrossRef] [Green Version]
- Schaffer, M.; Kröger, K.F.; Nödler, K.; Ayora, C.; Carrera, J.; Hernández, M.; Licha, T. Influence of a compost layer on the attenuation of 28 selected organic micropollutants under realistic soil aquifer treatment conditions: Insights from a large scale column experiment. Water Res. 2015, 74, 110–121. [Google Scholar] [CrossRef]
- Zemann, M.; Majewsky, M.; Wolf, L. Accumulation of pharmaceuticals in groundwater under arid climate conditions—Results from unsaturated column experiments. Chemosphere 2016, 154, 463–471. [Google Scholar] [CrossRef]
- Zakari, S.; Liu, H.; Tong, L.; Wang, Y.; Liu, J. Transport of bisphenol-A in sandy aquifer sediment: Column experiment. Chemosphere 2016, 144, 1807–1814. [Google Scholar] [CrossRef]
- Schaffer, M.; Boxberger, N.; Börnick, H.; Licha, T.; Worch, E. Sorption influenced transport of ionizable pharmaceuticals onto a natural sandy aquifer sediment at different pH. Chemosphere 2012, 87, 513–520. [Google Scholar] [CrossRef] [PubMed]
- Baumgarten, B.; Jährig, J.; Reemtsma, T.; Jekel, M. Long term laboratory column experiments to simulate bank filtration: Factors controlling removal of sulfamethoxazole. Water Res. 2011, 45, 211–220. [Google Scholar] [CrossRef] [PubMed]
- Burke, V.; Greskowiak, J.; Asmuß, T.; Bremermann, R.; Taute, T.; Massmann, G. Temperature dependent redox zonation and attenuation of wastewater-derived organic micropollutants in the hyporheic zone. Sci. Total Environ. 2014, 482–483, 53–61. [Google Scholar] [CrossRef] [PubMed]
- Bertelkamp, C.; Reungoat, J.; Cornelissen, E.R.; Singhal, N. Sorption and biodegradation of organic micropollutants during river bank filtration: A laboratory column study. Water Res. 2014, 52, 231–241. [Google Scholar] [CrossRef] [PubMed]
- Burke, V.; Richter, D.; Hass, U. Redox-dependent removal of 27 organic trace pollutants: Compilation of results from tank aeration experiments. Environ. Earth Sci. 2014, 71, 3685–3695. [Google Scholar] [CrossRef]
- Alidina, M.; Shewchuk, J.; Drewes, J.E. Effect of temperature on removal of trace organic chemicals in managed aquifer recharge systems. Chemosphere 2015, 122, 23–31. [Google Scholar] [CrossRef]
- Greenhagen, A.M.; Lenczewski, M.E.; Carroll, M. Natural attenuation of pharmaceuticals and an illicit drug in a laboratory column experiment. Chemosphere 2014, 115, 13–19. [Google Scholar] [CrossRef]
- Martínez-Hernández, V.; Meffe, R.; Herrera, S.; Arranz, E.; Bustamante, I. De Sorption/desorption of non-hydrophobic and ionisable pharmaceutical and personal care products from reclaimed water onto/from a natural sediment. Sci. Total Environ. 2014, 472, 273–281. [Google Scholar] [CrossRef]
- Kodešová, R.; Grabic, R.; Kočárek, M.; Klement, A.; Golovko, O.; Fér, M.; Nikodem, A.; Jakšík, O. Pharmaceuticals’ sorptions relative to properties of thirteen different soils. Sci. Total Environ. 2015, 511, 435–443. [Google Scholar] [CrossRef]
- Teijón, G.; Candela, L.; Šimůnek, J.; Tamoh, K.; Valdes-Abellán, J. Fate and Transport of Naproxen in a Sandy Aquifer Material: Saturated Column Studies and Model Evaluation. Soil Sediment Contam. 2014, 23, 736–750. [Google Scholar] [CrossRef] [Green Version]
- Akratanakul, S.; Boersma, L.; Klock, G.O. Sorption processes in soils as influenced by pore water velocity: 1. Theory. Soil Sci. 1983, 135, 267–274. [Google Scholar] [CrossRef]
- Akratanakul, S.; Boersma, L.; Klock, G.O. Sorption processes in soils as influenced by pore water velocity: 2. Experimental results. Soil Sci. 1983, 135, 331–341. [Google Scholar] [CrossRef]
- Pang, L.; Close, M.; Schneider, D.; Stanton, G. Effect of pore-water velocity on chemical nonequilibrium transport of Cd, Zn, and Pb in alluvial gravel columns. J. Contam. Hydrol. 2002, 57, 241–258. [Google Scholar] [CrossRef]
- Grösbacher, M.; Eckert, D.; Cirpka, O.A.; Griebler, C. Contaminant concentration versus flow velocity: Drivers of biodegradation and microbial growth in groundwater model systems. Biodegradation 2018, 1–22. [Google Scholar] [CrossRef] [PubMed] [Green Version]
- Mendoza-Sanchez, I.; Autenrieth, R.L.; McDonald, T.J.; Cunningham, J.A. Effect of pore velocity on biodegradation of cis-dichloroethene (DCE) in column experiments. Biodegradation 2010, 21, 365–377. [Google Scholar] [CrossRef] [PubMed]
- Langner, H.W.; Inskeep, W.P.; Gaber, H.M.; Jones, W.L.; Das, B.S.; Wraith, J.M. Pore water velocity and residence time effects on the degradation 2,4-D during transport. Environ. Sci. Technol. 1998, 32, 1308–1315. [Google Scholar] [CrossRef]
- Syngouna, V.I.; Chrysikopoulos, C.V. Transport of biocolloids in water saturated columns packed with sand: Effect of grain size and pore water velocity. J. Contam. Hydrol. 2012, 129–130, 11–24. [Google Scholar] [CrossRef]
- Hendry, M.J.; Lawrence, J.R.; Maloszewski, P. Effects of velocity on the transport of two bacteria through saturated sand. Ground Water 1999, 37, 103–112. [Google Scholar] [CrossRef]
- Banzhaf, S.; Nödler, K.; Licha, T.; Krein, A.; Scheytt, T. Redox-sensitivity and mobility of selected pharmaceutical compounds in a low flow column experiment. Sci. Total Environ. 2012, 438, 113–121. [Google Scholar] [CrossRef]
- Gruenheid, S.; Huebner, U.; Jekel, M. Impact of temperature on biodegradation of bulk and trace organics during soil passage in an indirect reuse system. Water Sci. Technol. 2008, 57, 987–994. [Google Scholar] [CrossRef] [Green Version]
- Kiecak, A.; Sassine, L.; Boy-Roura, M.; Elsner, M.; Mas-Pla, J.; Le Gal La Salle, C.; Stumpp, C. Sorption properties and behaviour at laboratory scale of selected pharmaceuticals using batch experiments. J. Contam. Hydrol. 2019, 225, 103500. [Google Scholar] [CrossRef] [PubMed]
- Sassine, L.; Le, C.; La, G.; Lancelot, J.; Verdoux, P. The use of O, H and Sr isotopes and carbamazepine to identify the origin of water bodies supplying a shallow alluvial aquifer. In Proceedings of the EGU General Assembly Geophysical Research Abstracts, Vienna, Austria, 27 April–2 May 2014; European Geoscience Union: Munich, Germany, 2014; Volume 16, p. 12024. [Google Scholar]
- Sassine, L.; Le Gal La Salle, C.; Khaska, M.; Verdoux, P.; Meffre, P.; Benfodda, Z.; Roig, B. Spatial distribution of triazine residues in a shallow alluvial aquifer linked to groundwater residence time. Environ. Sci. Pollut. Res. 2017, 24, 6878–6888. [Google Scholar] [CrossRef] [PubMed]
- Boy-Roura, M.; Mas-Pla, J.; Petrovic, M.; Gros, M.; Soler, D.; Brusi, D.; Menció, A. Towards the understanding of antibiotic occurrence and transport in groundwater: Findings from the Baix Fluvià alluvial aquifer (NE Catalonia, Spain). Sci. Total Environ. 2018, 612, 1387–1406. [Google Scholar] [CrossRef] [PubMed]
- Menció, A.; Mas-Pla, J. Assessing the Influence of Environmental Factors on Groundwater Antibiotic Occurrence by Means of Variation Partitioning. Water 2019, 11, 1495. [Google Scholar] [CrossRef] [Green Version]
- Simunek, J.; van Genuchten, M.T.; Sejna, M.; Toride, N.; Leij, F.J. The STANMOD Computer Software for Evaluating Solute Transport in Porous Media Using Analytical Solutions of Convection-Dispersion Equation; U.S. Salinity Laboratory, Agricultural Research Service, U.S. Department of Agriculture: Riverside, CA, USA, 1999.
- Toride, N.; Leij, F.J.; van Genuchten, M.T. The CXTFIT Code for Estimating Transport Parameters from Laboratory or Field Tracer Experiments, Version 2.0; U.S. Salinity Laboratory, Agricultural Research Service, U.S. Department of Agriculture: Riverside, CA, USA, 1995.
- Pedretti, D.; Fern, D.; Bolster, D. On the formation of breakthrough curves tailing during convergent flow tracer tests in three-dimensional heterogeneous aquifers. Water Resour. Res. 2013, 49, 4157–4173. [Google Scholar] [CrossRef]
- Lu, B.; Zhang, Y.; Zheng, C.; Green, C.T.; O’Neill, C.; Sun, H.-G.; Qian, J. Comparison of Time Nonlocal Transport Models for Characterizing Non-Fickian Transport: From Mathematical Interpretation to Laboratory Application. Water 2018, 10, 778. [Google Scholar] [CrossRef] [Green Version]
- Knorr, B.; Maloszewski, P.; Krämer, F.; Stumpp, C. Diffusive mass exchange of non-reactive substances in dual-porosity porous systems—Column experiments under saturated conditions. Hydrol. Process. 2016, 30, 914–926. [Google Scholar] [CrossRef]
- Burke, V.; Treumann, S.; Duennbier, U.; Greskowiak, J.; Massmann, G. Sorption behavior of 20 wastewater originated micropollutants in groundwater—Column experiments with pharmaceutical residues and industrial agents. J. Contam. Hydrol. 2013, 154, 29–41. [Google Scholar] [CrossRef]
- D’Alessio, M.; Yoneyama, B.; Ray, C. Fate of selected pharmaceutically active compounds during simulated riverbank filtration. Sci. Total Environ. 2015, 505, 615–622. [Google Scholar] [CrossRef]
- Henzler, A.F.; Greskowiak, J.; Massmann, G. Modeling the fate of organic micropollutants during river bank filtration (Berlin, Germany). J. Contam. Hydrol. 2014, 156, 78–92. [Google Scholar] [CrossRef]
- Rauch-Williams, T.; Hoppe-Jones, C.; Drewes, J.E. The role of organic matter in the removal of emerging trace organic chemicals during managed aquifer recharge. Water Res. 2010, 44, 449–460. [Google Scholar] [CrossRef] [PubMed]
- Hamann, E.; Stuyfzand, P.J.; Greskowiak, J.; Timmer, H.; Massmann, G. The fate of organic micropollutants during long-term/long-distance river bank filtration. Sci. Total Environ. 2016, 545–546, 629–640. [Google Scholar] [CrossRef] [PubMed]
- Scheytt, T.J.; Mersmann, P.; Heberer, T. Mobility of pharmaceuticals carbamazepine, diclofenac, ibuprofen, and propyphenazone in miscible-displacement experiments. J. Contam. Hydrol. 2006, 83, 53–69. [Google Scholar] [CrossRef] [PubMed]
- Hai, F.I.; Yang, S.; Id, M.B.A.; Id, V.S.; Shawkat, S.; Sanderson-smith, M.; Gorman, J.; Xu, Z.; Yamamoto, K. Carbamazepine as a Possible Anthropogenic Marker in Water: Occurrences, Toxicological Effects, Treatment Technologies. Water 2018, 10, 107. [Google Scholar] [CrossRef] [Green Version]
- Bertelkamp, C.; Schoutteten, K.; Vanhaecke, L.; Vanden Bussche, J.; Callewaert, C.; Boon, N.; Singhal, N.; van der Hoek, J.P.; Verliefde, A.R.D. A laboratory-scale column study comparing organic micropollutant removal and microbial diversity for two soil types. Sci. Total Environ. 2015, 536, 632–638. [Google Scholar] [CrossRef]
- De Wilde, T.; Mertens, J.; Šimunek, J.; Sniegowski, K.; Ryckboer, J.; Jaeken, P.; Springael, D.; Spanoghe, P. Characterizing pesticide sorption and degradation in micro scale biopurification systems using column displacement experiments. Environ. Pollut. 2009, 157, 463–473. [Google Scholar] [CrossRef]
- Young, D.F.; Ball, W.P. Injection Mode Effects on Tracer Experiments in Columns. J. Hydrol. Eng. 1997, 2, 113–119. [Google Scholar] [CrossRef]
- Knorr, B.; Maloszewski, P.; Stumpp, C. Quantifying the impact of immobile water regions on the fate of nitroaromatic compounds in dual-porosity media. J. Contam. Hydrol. 2016, 191, 44–53. [Google Scholar] [CrossRef]
Figure 1.
Breakthrough curves of the experiments with sediment E (dashed line—end of injection).

Figure 2.
Breakthrough curves of the experiments with sediment G (dashed line—end of injection).

Figure 3.
Breakthrough curves of the experiments with sediment G (dashed line—end of injection).

Figure 4.
Concentration changes of nitrate (dashed green) and dissolved oxygen (grey) versus bromide concentration (dotted blue) in the experiments with V-sediment.
Figure 4.
Concentration changes of nitrate (dashed green) and dissolved oxygen (grey) versus bromide concentration (dotted blue) in the experiments with V-sediment.

Figure 5.
Concentration changes of nitrate (dashed green) and dissolved oxygen (grey) versus bromide concentration (dotted blue) in the experiments with E-sediment.
Figure 5.
Concentration changes of nitrate (dashed green) and dissolved oxygen (grey) versus bromide concentration (dotted blue) in the experiments with E-sediment.


Table 1.
Properties of the sediments and groundwater used in the experiments.
| Parameter | Unit | G | V | E |
|---|---|---|---|---|
| Sediment | ||||
| Sediment type | Coarse sand | Sandy loam | Medium sand | |
| Origin | Dorosilt No. 5F * | Vistrinque Aquifer | Empordà Basin | |
| Fraction of grain size < 0.063 mm | % | 0.1 | 29 | 0.5 |
| Total carbon | % | 0.07 | 0.27 | 4.03 |
| Total organic carbon | % | 0.00 | 0.01 | 3.69 |
| Cation exchange capacity | [µmol IE/g] | 0.7 | 24.8 | 26.4 |
| Specific surface area | [m2/g] | 0.25 | 2.97 | 3.57 |
| Water | ||||
| Origin | Neuherberg | Caissargues | Montiró | |
| Water facies | HCO3-Ca-Mg | Ca-HCO3-SO4 | Ca-SO4-HCO3-Ca | |
| Mineralization | [mg/L] | 507 | 596 | 1089 |
*—commercial product purchased by Quarzsande GmbH.
Table 2.
Flow rate conditions in all column experiments.
| Parameter | Experiment | Column | |||||
|---|---|---|---|---|---|---|---|
| EA | EB | GA | GB | VA | VB | ||
| L [cm] | 50 | 50 | 50 | 50 | 50 | 50 | |
| φ [cm] | 9 | 9 | 9 | 9 | 5 | 5 | |
| Q [mL/h] | 1 | 112 | 121 | 202 | 199 | 58.8 | 57.6 |
| 2 | 76.8 | 82.2 | 130 | 130 | 15.6 | 13.2 | |
| 3 | 42.6 | 45.6 | 65.4 | 65.4 | - | - | |
| 4 | - | 45.0 | - | - | - | - | |
| Monitored parameters | Major ions (including bromide), pharmaceuticals, oxygen (only EB-4) | Bromide, pharmaceuticals | Major ions (including bromide), pharmaceuticals, oxygen | ||||
E, G, V—sediment type (Table 1), A—abiotic conditions, B—biotic conditions.
Table 3.
Transport parameters found from experiments in the abiotic (A) and biotic (B) column setups (Notation: vp—pore-water velocity, α—longitudinal dispersivity, neff—effective porosity, t0—mean transit time, T—duration of injection).
Table 3.
Transport parameters found from experiments in the abiotic (A) and biotic (B) column setups (Notation: vp—pore-water velocity, α—longitudinal dispersivity, neff—effective porosity, t0—mean transit time, T—duration of injection).
| Experiment | vp [m/h] | α [cm] | neff [-] | t0 [h] | T [h] | ||
|---|---|---|---|---|---|---|---|
| Sediment | A/B | No. | |||||
| E | A | 1 | 0.108 | 11.4 | 0.16 | 4.7 | 9.8 |
| 2 | 0.072 | 11.3 | 0.16 | 6.7 | 13.4 | ||
| 3 | 0.042 | 7.5 | 0.16 | 12.3 | 24 | ||
| B | 1 | 0.138 | 19.4 | 0.13 | 3.5 | 9.8 | |
| 2 | 0.096 | 17.2 | 0.13 | 5.13 | 13.4 | ||
| 3 | 0.054 | 14.1 | 0.13 | 9.32 | 24 | ||
| 4 | 0.041 | 19.14 | 0.17 | 6.3 | 20.7 | ||
| G | A | 1 | 0.087 | 0.16 | 0.36 | 5.9 | 9.7 |
| 2 | 0.053 | 0.18 | 0.37 | 9.6 | 19.9 | ||
| 3 | 0.028 | 0.17 | 0.36 | 18.1 | 23 | ||
| B | 1 | 0.087 | 0.53 | 0.35 | 5.8 | 9.7 | |
| 2 | 0.057 | 0.39 | 0.35 | 9 | 19.9 | ||
| 3 | 0.029 | 0.31 | 0.34 | 17.5 | 23 | ||
| V | A | 1 | 0.098 | 12.99 | 0.31 | 5.2 | 16 |
| 2 | 0.026 | 19.05 | 0.31 | 19.9 | 51.3 | ||
| B | 1 | 0.094 | 3.46 | 0.31 | 5.4 | 16 | |
| 2 | 0.023 | 6.72 | 0.3 | 22.6 | 51.3 | ||
Table 4.
Modelled transport parameters for conservative and active tracers for the E-sediment (Notation: R—retardation factor [-]; μ—degradation rate [d−1]).
Table 4.
Modelled transport parameters for conservative and active tracers for the E-sediment (Notation: R—retardation factor [-]; μ—degradation rate [d−1]).
| Compound | Experiment 1 | Experiment 2 | Experiment 3 | Exp. 4 | ||||||||||
|---|---|---|---|---|---|---|---|---|---|---|---|---|---|---|
| EA | EB | EA | EB | EA | EB | EB | ||||||||
| R | µ | R | µ | R | µ | R | µ | R | µ | R | µ | R | µ | |
| Bromide | 1 | 0 | 1 | 0 | 1 | 0 | 1 | 0 | 1 | 0 | 1 | 0 | 1 | 0 |
| Antipyrine | 1.27 | 0.75 | 1.19 | 0.81 | 1.25 | 1.17 | 1.24 | 1.09 | 1.22 | 0.45 | 1.16 | 0.37 | 1.16 | 0.31 |
| Atenolol | 6.39 | 10.78 | 6.16 | 9.55 | 5.63 | 10.74 | 7.06 | 10.68 | 5.85 | 7.30 | 6.27 | 7.56 | 6.68 | 6.29 |
| Caffeine | 1.97 | 3.21 | 1.80 | 2.38 | 1.84 | 2.21 | 1.87 | 2.17 | 1.83 | 1.08 | 1.67 | 1.00 | 1.69 | 0.87 |
| Carbamazepine | 1.95 | 2.89 | 1.76 | 2.33 | 1.84 | 2.04 | 1.84 | 2.01 | 1.81 | 1.04 | 1.65 | 1.01 | 1.66 | 0.78 |
| Diclofenac | 1.54 | 3.36 | 1.38 | 1.20 | 1.48 | 2.04 | 1.41 | 1.84 | 1.51 | 1.58 | 1.35 | 0.98 | 1.57 | 1.68 |
| Ketoprofen | 1.24 | 1.49 | 1.05 | 0.15 | 1.19 | 0.82 | 1.09 | 0.75 | 1.22 | 0.70 | 1.13 | 0.47 | 1.12 | 0.47 |
| Sulfamethoxazole | 1.10 | 0.59 | 1.00 | 0.26 | 1.01 | 0.44 | 0.94 | 0.09 | 1.02 | 0.33 | 0.98 | 0.29 | 0.97 | 0.17 |
Table 5.
Modelled transport parameters for conservative and active tracers for the G-sediment (Notation: R—retardation factor [-]; µ—degradation rate [d−1]).
Table 5.
Modelled transport parameters for conservative and active tracers for the G-sediment (Notation: R—retardation factor [-]; µ—degradation rate [d−1]).
| Compound | Experiment 1 | Experiment 2 | Experiment 3 | |||||||||
|---|---|---|---|---|---|---|---|---|---|---|---|---|
| GA | GB | GA | GB | GA | GB | |||||||
| R | µ | R | µ | R | µ | R | µ | R | µ | R | µ | |
| Bromide | 1.00 | 0 | 1.00 | 0 | 1 | 0 | 1 | 0 | 1 | 0 | 1 | 0 |
| Antipyrine | 0.99 | 0.00 | 1.00 | 0.00 | 0.97 | 0.08 | 1.00 | 0.00 | 1.00 | 0.00 | 0.91 | 0.06 |
| Atenolol | 1.04 | 0.61 | 1.01 | 0.00 | 1.02 | 0.17 | 1.07 | 0.24 | 1.07 | 0.43 | 0.96 | 0.22 |
| Caffeine | 1.00 | 0.26 | 1.00 | 0.02 | 0.98 | 0.94 | 1.01 | 0.00 | 1.02 | 0.25 | 0.92 | 0.13 |
| Carbamazepine | 1.00 | 0.26 | 1.06 | 0.00 | 0.98 | 0.41 | 1.00 | 0.00 | 1.01 | 0.23 | 0.92 | 0.08 |
| Diclofenac | 1.01 | 0.31 | 0.99 | 0.25 | 1.00 | 0.19 | 1.01 | 0.09 | 0.94 | 1.15 | 0.98 | 2.00 |
| Ketoprofen | 1.01 | 0.50 | 0.99 | 0.39 | 1.00 | 0.20 | 1.02 | 0.00 | 0.96 | 0.13 | 0.95 | 1.42 |
| Sulfamethoxazole | 1.01 | 0.00 | 1.00 | 0.31 | 0.97 | 0.24 | 1.00 | 0.00 | 1.00 | 0.03 | 0.90 | 0.06 |
Table 6.
Modelled transport parameters for conservative and active tracers for the V-sediment (Notation: R—retardation factor [-]; μ—degradation rate [d−1]).
Table 6.
Modelled transport parameters for conservative and active tracers for the V-sediment (Notation: R—retardation factor [-]; μ—degradation rate [d−1]).
| Compound | Experiment 1 | Experiment 2 | ||||||
|---|---|---|---|---|---|---|---|---|
| VA | VB | VA | VB | |||||
| R | µ | R | µ | R | µ | R | µ | |
| Bromide | 1 | 0 | 1 | 0 | 1 | 0 | 1 | 0 |
| Antipyrine | 1.02 | 0.16 | 1.02 | 0.09 | 1.07 | 0.00 | 1.05 | 0.20 |
| Atenolol | 4.74 | 2.83 | 5.33 | 6.02 | 2.57 | 1.28 | 3.70 | 1.81 |
| Caffeine | 1.35 | 0.58 | 1.20 | 0.87 | 1.09 | 0.00 | 1.20 | 0.41 |
| Carbamazepine | 1.32 | 0.61 | 1.20 | 0.90 | 1.10 | 0.00 | 1.21 | 0.29 |
| Diclofenac | 1.09 | 1.18 | 1.13 | 3.15 | 1.05 | 0.29 | 1.18 | 0.31 |
| Ketoprofen | 1.05 | 0.13 | 1.06 | 1.58 | 1.45 | 0.09 | 1.07 | 0.16 |
| Sulfamethoxazole | 1.10 | 0.10 | 0.95 | 0.65 | 1.19 | 0.19 | 0.98 | 0.31 |
Table 7.
Average retardation factors, R, and corresponding calculated sorption coefficients, Kd.
| Parameter | Compound | Column | |||||
|---|---|---|---|---|---|---|---|
| EA | EB | GA | GB | VA | VB | ||
| ρd [g/cm3] | 1.89 | 1.85 | 1.53 | 1.45 | 1.51 | 1.50 | |
| neff [-] | 0.16 | 0.14 | 0.30 | 0.35 | 0.33 | 0.31 | |
| n [-] | 0.32 | 0.33 | 0.42 | 0.45 | 0.43 | 0.44 | |
| R [-] | Bromide | 1.00 | 1.00 | 1.00 | 1.00 | 1.00 | 1.00 |
| Antipyrine | 1.25 | 1.19 | 1.00 | 1.00 | 1.05 | 1.04 | |
| Atenolol | 5.96 | 6.54 | 1.04 | 1.01 | 3.66 | 4.52 | |
| Caffeine | 1.88 | 1.76 | 1.00 | 1.00 | 1.22 | 1.20 | |
| Carbamazepine | 1.87 | 1.73 | 1.00 | 1.00 | 1.21 | 1.21 | |
| Diclofenac | 1.51 | 1.43 | 1.00 | 1.00 | 1.07 | 1.16 | |
| Ketoprofen | 1.22 | 1.10 | 1.00 | 1.00 | 1.25 | 1.07 | |
| Sulfamethoxazole | 1.04 | 1.00 | 1.00 | 1.00 | 1.15 | 1.00 | |
| Kd [L/kg] | Bromide | 0.00 | 0.00 | 0.00 | 0.00 | 0.00 | 0.00 |
| Antipyrine | 0.04 | 0.03 | 0.00 | 0.00 | 0.01 | 0.01 | |
| Atenolol | 0.84 | 0.99 | 0.01 | 0.00 | 0.76 | 1.03 | |
| Caffeine | 0.15 | 0.14 | 0.00 | 0.00 | 0.06 | 0.06 | |
| Carbamazepine | 0.15 | 0.13 | 0.00 | 0.00 | 0.06 | 0.06 | |
| Diclofenac | 0.09 | 0.08 | 0.00 | 0.00 | 0.02 | 0.05 | |
| Ketoprofen | 0.04 | 0.02 | 0.00 | 0.00 | 0.07 | 0.02 | |
| Sulfamethoxazole | 0.01 | 0.00 | 0.00 | 0.00 | 0.04 | 0.00 | |
© 2019 by the authors. Licensee MDPI, Basel, Switzerland. This article is an open access article distributed under the terms and conditions of the Creative Commons Attribution (CC BY) license (http://creativecommons.org/licenses/by/4.0/).
Share and Cite
MDPI and ACS Style
Kiecak, A.; Breuer, F.; Stumpp, C. Column Experiments on Sorption Coefficients and Biodegradation Rates of Selected Pharmaceuticals in Three Aquifer Sediments. Water 2020, 12, 14. https://doi.org/10.3390/w12010014
AMA Style
Kiecak A, Breuer F, Stumpp C. Column Experiments on Sorption Coefficients and Biodegradation Rates of Selected Pharmaceuticals in Three Aquifer Sediments. Water. 2020; 12(1):14. https://doi.org/10.3390/w12010014
Chicago/Turabian StyleKiecak, Aleksandra, Friederike Breuer, and Christine Stumpp. 2020. "Column Experiments on Sorption Coefficients and Biodegradation Rates of Selected Pharmaceuticals in Three Aquifer Sediments" Water 12, no. 1: 14. https://doi.org/10.3390/w12010014
Note that from the first issue of 2016, this journal uses article numbers instead of page numbers. See further details here.