1. Introduction
Cyanobacteria (previously known as blue-green algae) occur in diverse environments, being highly prevalent in the aquatic environment, for example, in fresh water, brackish water, oceans, and hot springs. They are either present as biofilms or benthic mats, or dispersed in the water column as planktonic organisms. In eutrophic waters, cyanobacteria frequently reach high cell densities, forming the so-called blooms [
1]. Earlier, cyanobacterial blooms were regarded simply as an aesthetic problem due to their scum-like appearance (green, brown, or red) and strong disagreeable odour. However, cyanobacteria are known to produce different toxins. Cyanotoxin poisoning was first reported in an Australian lake in 1878 [
2], and since then the increased frequency of fish death, unknown hepatotoxic/neurotoxic diseases, and animal poisonings have led to an increased research interest and public awareness of harmful cyanobacterial blooms [
1].
Cyanotoxins are a very diverse group of toxins including microcystins, anatoxins, cylindrospermopsin, or saxitoxins, and differ in molecular structures and toxic properties. Humans can be exposed to cyanotoxins through various exposure pathways such as through consumption of drinking water (the main form of exposure), dermal contact during recreational purposes, consumption of algal supplements, consumption of fruits or vegetables irrigated with cyanotoxin-contaminated water, consumption of aquatic organisms from contaminated waters, and, in rare cases, through inhalation or contact with nasal mucous membranes while taking showers [
3,
4,
5]. Microcystins are the most relevant cyanotoxins, belonging to a family of hepatotoxins that are most frequently found in freshwater blooms worldwide. These toxins are primarily produced by
Microcystis genera, namely,
Microcystis aeruginosa [
6].
Microcystis blooms and the release of hepatotoxic microcystins (MCs) pose a serious threat to the safety of water for human and livestock consumption, crop irrigation, and aquaculture worldwide. Microcystin-LR (MC-LR) is the most common and toxic variant of MCs with acute pathogenicity that causes allergic reactions and fatal liver haemorrhage. MC-LR has been widely detected in a variety of environments such as waters, sediments, plants, and some aquatic products, and is also associated to some severe human toxicity incidents. [
3].
The scarcity of clean water resources and the need to use closer eutrophic water bodies can lead to the compulsory use in agriculture of water containing cyanobacteria and their toxins [
7]. Cyanotoxins can affect plants either by reducing their germination rates [
8,
9] and growth [
10,
11,
12] but also they can be taken up by plants and transfer the toxins to humans and other animals via food [
10,
13,
14]. This practice is more frequent in arid areas, such as the Mediterranean basin, where the demand for water for irrigation purposes is higher. In these areas, efficient mechanisms for monitoring water quality as well as its treatment should be implemented.
Conventional solutions of water treatment are costly, requiring specific infrastructures, specialized personnel, and equipment and energy to operate. In this regard, a challenge is placed concerning the treatment of surface waters contaminated with toxic cyanobacteria blooms, from lakes, ponds, and reservoirs that supply water for agriculture, where the application of conventional technologies is not economically feasible. In addition, many natural eutrophic waters (surface and ground waters) are localized in rural areas with limited access to infrastructure and electricity. In these cases, low-cost and low-technology solutions become the most appropriate for water treatment.
Natural wetlands purify water by breaking down and assimilating nutrients, bacteria, and other contaminants. Artificial wetlands, the so-called constructed wetlands (CWs), have been constructed to replicate these processes [
15]. CWs are complex systems containing water, substrate, plants (e.g.,
Phragmites australis), and native microorganisms. Physical, chemical, and biological processes, such as volatilization, sorption and sedimentation, photodegradation, plant uptake, and microbial degradation, may occur simultaneously, contributing to the elimination of several types of compounds [
16,
17]. In fact, CWs have shown a great capability in significantly reducing the concentration of several persisting and emergent water pollutants (e.g., [
15,
18,
19]). This concept can also be extended to recover environmental surface and ground waters contaminated with cyanobacteria and cyanotoxins. Such systems would suit the treatment of stored waters in the sub-systems of large reservoirs that, for instance, supply water for agriculture. Furthermore, control of toxic cyanobacteria blooms by CW can be also achieved through removal of excess nutrients in the water, a feature CWs are already known for (e.g., [
17,
20]). Studies reporting the capability of aquatic plants or microorganism sediment communities to remove/degrade different cyanotoxins from water are scarce, but results are encouraging. Experimental studies have shown the capability of aquatic plants to remove the neurotoxin anatoxin-a (ANTX-a) [
21] and MCs [
22,
23], although in some cases with toxic effects to the plants [
21]. The capability of sediment microorganisms to degrade MCs has also been described [
24], and MC biodegradation can be an option for cyanotoxin removal [
23]. It is thus quite clear that both plants and microorganisms are key players in CWs. Recently, Wang et al. [
25] reported high removal rates of MC in a microcosm’s CW, although tests were made with synthetic water doped with MCs. Thus, tests with real waters are needed to simultaneously monitor other features of CWs such as nutrient removal. Moreover, it is very important that both cells and toxins are removed from the water [
1]. Cyanobacteria can release toxins during cell senescence or cell death and lysis, rather than by continuous release during cell growth [
22], being important to remove both living cells and the dissolved toxin. To gain more insight into the potential of CWs for the treatment of eutrophic waters contaminated with toxic cyanobacteria, we outline an experiment with a microcosms system assembled with
P. australis and investigated the removal of toxic
M. aeruginosa cells and dissolved MC-LR from eutrophic lake water samples. Within the diversity of MC variants known (over 240 variants) the toxin variant MC-LR was chosen for the experiment because it is one of the most frequently reported in the environment and the most toxic [
3].
Although full-scale studies are needed to fully assess possible applications in situ, bench scale studies are generally needed as a first approach to establish test hypothesis such as in the present case. The microcosm approach has shown to suitably represent interactions among plants, microorganisms, substrates, and contaminants within a complex rhizosphere system [
26]. As so, current studies were done in microcosms, simulating vertical sub-surface flow CWs with natural lake water. In this CWs type, water flows below the surface of the planted bed substrate and percolates vertically through the entire substrate. In general, CW substrates have different layers, an approach followed in the current study—an inert drainage layer with coarse gravel, a main filter layer that can have sand, lava rock, or other porous material that promotes filtration as well as biofilm formation and microbial activity, and a plant root bed soil/sediment on top into which plants are transplanted.
2. Materials and Methods
2.1. Cyanobacteria Culture
To prepare the
M. aeruginosa culture, permission was granted by Blue Biotechnology and Ecotoxicology Culture Collection (LEGE-CC) to use the strain LEGE 91094 (
Microcystis aeruginosa) (
https://lege.ciimar.up.pt/culture/microcystis-aeruginosa-lege-91094/). A starter culture was prepared by transferring an aliquot from the LEGE-CC flask to a 50 mL culture flask under sterile conditions and allowing it to grow for two weeks in Z8 culture medium [
27]. This culture was then transferred to a 450 mL culture flask. Microscopic examination was carried out to confirm cells were in good, unicyanobacterial conditions before starting to scale up the culture. The scale up of the culture started by adding 450 mL of the dense starter culture to 4 L of culture medium in a 6 L glass culture balloon and allowing it to grow for 2 weeks. Subsequently, 4 L of this dense culture was added to 16 L of culture medium in a 20 L autoclavable flask (NALGENE) and grown for a month before being use in the experiments with the CWs.
M. aeruginosa was grown at 25 °C, with a light intensity of 22 μmol m
−2 s
−1, under a light/dark cycle of 14/10 h during all stages. The same conditions were kept to maintain the culture for the experiments with the CWs.
2.2. Sampling, Microcosm Setup, and Experimental Conditions
Lake water was collected from a lake in the city park of Porto, Portugal (41°10’3.24” N; 8°40’36.05” W) from September 2018 to November 2018, on a weekly basis. A previous study has shown the presence of microcystins, namely MC-LR, in this lake and other lakes of the city park [
28]. Collected volumes of lake surface water varied between 12 to 15 L. Plastic bottles that were previously decontaminated (washed with deionized water and local water) were used for the water collection. The water was immediately transported to the laboratory where the CW microcosms were kept.
For assembling CW microcosms, P. australis plants were collected from the banks of the river Lima, Portugal (41°46′ N; 8°34′ W) in September 2018. The plants were collected with the sediment around its roots (to preserve the plants’ rhizosphere) in a 20 × 20 × 20 cm3 size cube. The sediment in contact with the plant roots (rhizosediment) was removed on site and plants were washed with estuarine water. The rhizosediment, as well as sand from the river banks, were also collected. In the laboratory, sediment and sand were later mixed in a ratio of 1:2 (sediments/sand) and used as plant root bed substrate in the CW microcosms.
Experiments were conducted in controlled conditions in microcosms that simulated CWs with subsurface vertical flow. Three CW microcosms were set up in plastic containers (40 × 30 × 30 cm
3), each consisting of four layers: 1 cm of big gravel, 4 cm of small gravel, 2 cm of lava rock, and 8 cm of root bed substrate (sediments and sand in proportion 1:2) into which
P. australis was transplanted. Each microcosm had ca. 40 sprouts, to have a significant plant–root effect on the water treatment. The plastic containers were wrapped with aluminium foil to prevent sunlight exposure and to avoid possible photo-degradation of the compounds. For the acclimation of the microcosms, 1.5 L of Hoagland nutrient solution was added every two days for two weeks before the start of the experiments. The level of the solution was kept just above the soil surface. For the experiments, circulating tubes with pumps were placed in each container to promote water circulation in the microcosms. More details are provided in Gorito et al. [
26]. Microcosms were kept under greenhouse-like conditions (in the Chemistry Department, Faculty of Science, University of Porto), namely, natural day/night regime, with a temperature variation between 15 to 25 °C, between September and November 2018.
2.3. CW Experiments
For the CW experiments, 3500 mL of lake water was added to each CW microcosm. After the 2 weeks of acclimation with nutrient solution, fresh lake water was added to the microcosms. This process was repeated for 2 weeks for acclimation of the system. In the following weeks, as the lake water had very low levels of both MC-LR and
M. aeruginosa, the lake water was contaminated with cyanobacteria cells and toxins. For the third week, lake water was spiked with the
M. aeruginosa culture (MC-LR-producing culture grown as described above) at a cell density of half of the density of 10
6 cells/mL and MC-LR concentration of ca. 25 µg/L, for CWs adaptation. The
M. aeruginosa culture had a cell density of ca. 2 × 10
7 cell/mL and a concentration of MC-LR of ca. 1 mg/L. From the fourth week onwards, the lake water was spiked with a final cell density of ca. 10
6 cells/mL and MC-LR concentration of ca. 50 µg/L. This cell density has been found already in a natural cyanobacterial bloom of
M. aeruginosa [
22,
28]. Moreover, spiking the water with live cyanobacterial cells rather than just toxins (which are dissolved in water) adds ecological relevance to the study, as eutrophic lakes have both cyanotoxins and cyanobacteria cells and both need to be removed. Spiked water was also left to circulate in the system for 1 week. After that period, the treated water was removed and the fresh lake water spiked with cyanobacteria culture was added again to the system. This process was repeated five times, taking 5 weeks in total.
2.4. Samples Collection and Processing
After each 1 week treatment in CW microcosms, water samples were collected and stored in dark glass bottles. The volume of the treated water coming out of each CW microcosm was measured, and deionised water (600–800 mL) was added to make up the initial volume of 3500 mL introduced in CWs to compensate the loss of water through evaporation and uptake by plants. The bottles were homogenized by shaking them well.
For MC-LR analysis, 1 L of lake water or CW-treated water was filtered through glass fibre filters (1.2 μm diameter). The filters were wrapped in aluminium foils and stored at −20 °C. Between 500–800 mL of the filtered water was stored in decontaminated glass bottles at −20 °C.
For nutrient analysis, 40–45 mL of filtered water was stored in decontaminated (acid washed) falcons and kept at −20 °C.
For cyanobacteria count, 2 mL of filtered water was kept in microtubes (containing Lugol solution).
Organic matter analysis, through chemical oxygen demand (COD), was carried out in collected water (unfiltered, 2 mL) on the day of collection.
At the end of the experiment, samples of sediment (about 15 g) from each CW microcosm were also collected for toxin analysis. From each microcosm, three pools of root bed substrate (along with roots depth) were collected, homogenized, and stored in aluminium foil at −20 °C until toxin analysis.
2.5. MC-LR Extraction
The procedure for MC-LR extraction from the lake water and treated water was adapted from Lawton et al. [
29], and Ramanan et al. [
30], with slight modifications.
MC-LR extraction was performed both on the dissolved (filtrate water) and suspended matter (retained in the filter during water filtration).
For MC-LR extraction, the filters were put in beakers and 10–15 mL of 50% methanol (v/v), sufficient for immersion of filters, was added. The solution was then subject to ultrasound (60 Hz, 5 × 1 min) using a probe sonicator (Vibra cell, Sonics and Materials, Danbury, CT, USA) to help homogenize, as well as to perform cell lysis. Centrifugation (Gyrozen-2236R High-Speed Centrifuge, Gochon-eup, Korea) was done consequently at a speed of 6000 rpm for 5 min at 4 °C. The supernatant was collected and kept overnight at 4 °C. The extracted filter was also kept at 4 °C. Another cycle of extraction was done the next day and supernatants pooled together. The supernatant was evaporated to dryness using a rotavapor. The residues were then re-suspended in 1 mL solution of 50% methanol (LC-MS grade), acidified with 0.1% trifluoroacetic acid (TFA), centrifuged at 12 rpm for 5 min to remove tiny debris of filters, and transferred to a 2 mL glass vial.
The filtered water samples were defrosted and subsequently homogenized by shaking. These samples were subject to solid-phase extraction (SPE) to concentrate and purify the samples using Oasis HLB cartridges (3 mL, 3 cc) from Waters Corporation (Millford, MA, USA) in a ManiFold vacuum system (Supelco, Madrid, Spain). Briefly, the cartridges were conditioned with 5 mL of methanol, followed by 5 mL of deionized water. Then, the samples were loaded. Afterward, the cartridges were cleaned with 5 mL of methanol/water (5:95 v/v) and left to dry for 30 min. For the elution, 5 mL of methanol/formic acid (95:5 v/v) solution was used. The eluted samples were stored at −20 °C overnight and evaporated to dryness the next day using a rotavapor. The residue was re-suspended in 1 mL solution of 50% methanol (LC-MS grade), acidified with 0.1% TFA, and transferred to a 2 mL HPLC vial. Tests were made with samples with a known amount of MC-LR toxin to evaluate SPE recoveries, which were 96 ± 8%.
MC-LR extraction from the CW sediments was carried out following the procedure from Machado et al. [
11] with certain modifications. An extraction solvent of 80% methanol (
v/
v) with 0.1% (
v/
v) TFA was prepared. The sediment samples were homogenized with the extraction solvent in a ratio of 1:5 (3 g of sediment and 15 mL of extraction solvent) using a vortex. The homogenate was allowed to stand in a shaking incubator for 1 hour to increase the extraction of MC-LR. Subsequently, the sample was probe sonicated (Vibracell) for 5 min at 60 Hz and then centrifuged for 20 min at 4 °C with an rpm of 4495 g (Gyrozen-2236R High-Speed Centrifuge). The supernatant was then collected and evaporated to dryness with the use of a rotavapor. The residues were then re-suspended in 1 mL solution of 50% methanol (LC-MS grade), acidified with 0.1% TFA, and transferred to a 2 mL glass vial.
High Pressure Liquid Chromatography with Photometric Diode Array (HPLC-PDA) detection and Liquid Chromatography coupled to Tandem Mass Spectrometry (LC-MS/MS) were then performed to check the presence and quantify the amount of MC-LR both on the dissolved and on the suspended matter of the water samples, as well as on CW sediments.
LC-MS/MS was used whenever MC-LR concentrations were below the HPLC-PDA detection limit.
2.6. Detection and Quantification of MC-LR by HPLC-PDA
Samples were injected on an HPLC system equipped with a PDA detector—Waters Alliance 2695 (Waters, Milford, MA, USA). The chromatographic column was a reverse-phase Merck Lichrospher RP-18 endcapped column (250 × 4.6 mm internal diameter, 5 μm), equipped with a guard column (4 × 4 mm, 5 μm) both kept at 45 °C. Two mobile phases were used: (A) methanol + 0.1% TFA and (B) H2O + 0.1% TFA. The linear gradient elution consisted of 55% A and 45% B at 0 min, 65% A and 35% B at 5 min, 80% A and 20% B at 10 min, 100% A at 15 min, and 55% A and 45% B between 15.1 and 20 min, with a flow rate of 0.9 mL/min. The injected volume was 20 μL. The PDA range was 210–400 nm, with a fixed wavelength at 238 nm. The MC-LR was identified by comparison of spectra and retention time of a standard solution of MC-LR (code: CRM-03-CYN, batch nº. 15-001, 11.5 ± 0.7 μg/mL of MC-LR in 0.5 mL methanol, Laboratorio CIFGA S.A). The system was calibrated by using a set of seven dilutions of MC-LR standard solution (in a concentration range of 0.5 to 10 μg/mL) in methanol 50% solution. Each vial was injected in duplicate and every HPLC run series of 10 samples included a blank solution (signal always below detection limit) and two different MC-LR standard solutions. Empower 2 Chromatography Data software was used for calculation and reporting peak information. The limit of detection (LOD) and quantification (LOQ) of MC-LR were 0.3 and 0.5 μg/mL, respectively. Taking into consideration the SPE step, the LOD and LOQ in the dissolved phase were 0.6 and 1 µg/L, respectively. Considering the MC-LC in the filters (ca. 1 L of water filter), LOD and LOQ in the particulate phase were 0.3 and 0.5 ng/g.
All HPLC solvents were filtered (Pall GH Polypro 47 mm, 0.2 μm) and degassed by ultrasound bath.
2.7. Detection and Quantification of MC-LR by LC-MS/MS
MC-LR analysis by LC-MS/MS was performed on a Waters 2695 XE separation module coupled to a Waters Micromass Quattro micro Atmospheric Pressure Ionization (API) triple quadrupole mass analyser (Waters, Manchester, United Kingdom). Chromatographic separation was achieved with a core-shell Kinetex C18 column (i.d. 2.1 × 100 mm, particle size 2.6 μm) fitted with a Security Guard C18 HPLC pre-column, 3 × 4 mm. The columns were kept at 40 °C during analysis, and the injection volume was 25 μL. Mobile phase A was 1% formic acid (FA) in Milli-Q water and mobile phase B 1% FA in acetonitrile (ACN). The solvent gradient program was as follows: (1) 0–0.5 min, 10% B; (2) 0.5–5.5 min, 95% B; (3) 5.5–7.5 min, 95% B; (4) 7.5–9.0 min, 10% B. After reaching the initial conditions, the column was re-equilibrated for 5 min before the next injection. All organic solvents were of HPLC grade.
Quantification of MC-LR was performed in multiple reaction monitoring (MRM) mode using a triple quadrupole mass spectrometer (MS/MS). The MS was used in positive electro-spray mode (ES+). The optimized MS parameters were as follows: capillary voltage, 3.5 kV; source temperature, 130 °C; desolvation temperature, 500 °C; desolvation gas flow, 700 L/h; cone gas, 50 L/h; and multiplier, 650 V. High purity nitrogen (≥99.999%) and argon (≥99.999%) were used as the desolvation/cone and collision gases, respectively. The precursor and product ions as well as the cone voltage and collision energy for MC-LR analysis were determined by flow injection analysis. MRM transitions, cone voltage, and collision energies for MC-LR are listed in
Table S1 in the
Supplementary Materials section. The dwell time for each function was 100 ms. Data acquisition was performed using the Mass Lynx V4.1 software.
Criteria for positive identification and quantification of MC-LR were set in accordance with the guidance document on analytical quality control and method validation procedures for pesticide residues and analysis in food and feed SANTE/11813/2017. MC-LR was considered positively identified in samples when the relative intensities of the quantification product ion in relation to the qualifier product ion, expressed as the ion ratio, differed no more than ±30% of the ion ratio of the calibration standards. Samples were quantified by interpolation using weighted linear regression (1/x) and a minimum of five calibration points with triplicate injections of calibration standards.
Calibration standards were prepared from a stock solution of MC-LR (100 µg/mL) in 10% ACN (1% FA). Because no
13C or
15N labelled standards were available, sulfadimethoxine (100 µg/L in methanol 50%,
v/
v) was used as internal standard. Sulfadimethoxine (VETRANAL, analytical standard), was purchased from Sigma-Aldrich (Steinheim, Germany). A specific set of samples was used to determine the validity of using sulfadimethoxine as internal standard (IS). For this purpose, the standard addition method was performed with the addition of known amount of the MC-LR standard. Matrix effects were evaluated by comparing the slopes of the calibration curves and the actual concentrations obtained in the selected samples by IS and standard additions methods. Validation parameters are shown in
Table S2. The LOD and LOQ of MC-LR were 2.8 and 10 ng/mL, respectively. Taking into consideration the SPE step, the LOD and LOQ in the dissolved phase were 5.6 and 20 ng/L, respectively. Considering the MC-LC in the filters (ca. 1 L of water filter), LOD and LOQ in the particulate phase were 2.8 and 10 ng/L. For sediments, the LOD and LOQ were 0.7 and 2.7 ng/g, respectively.
2.8. Quantification of Cell Density
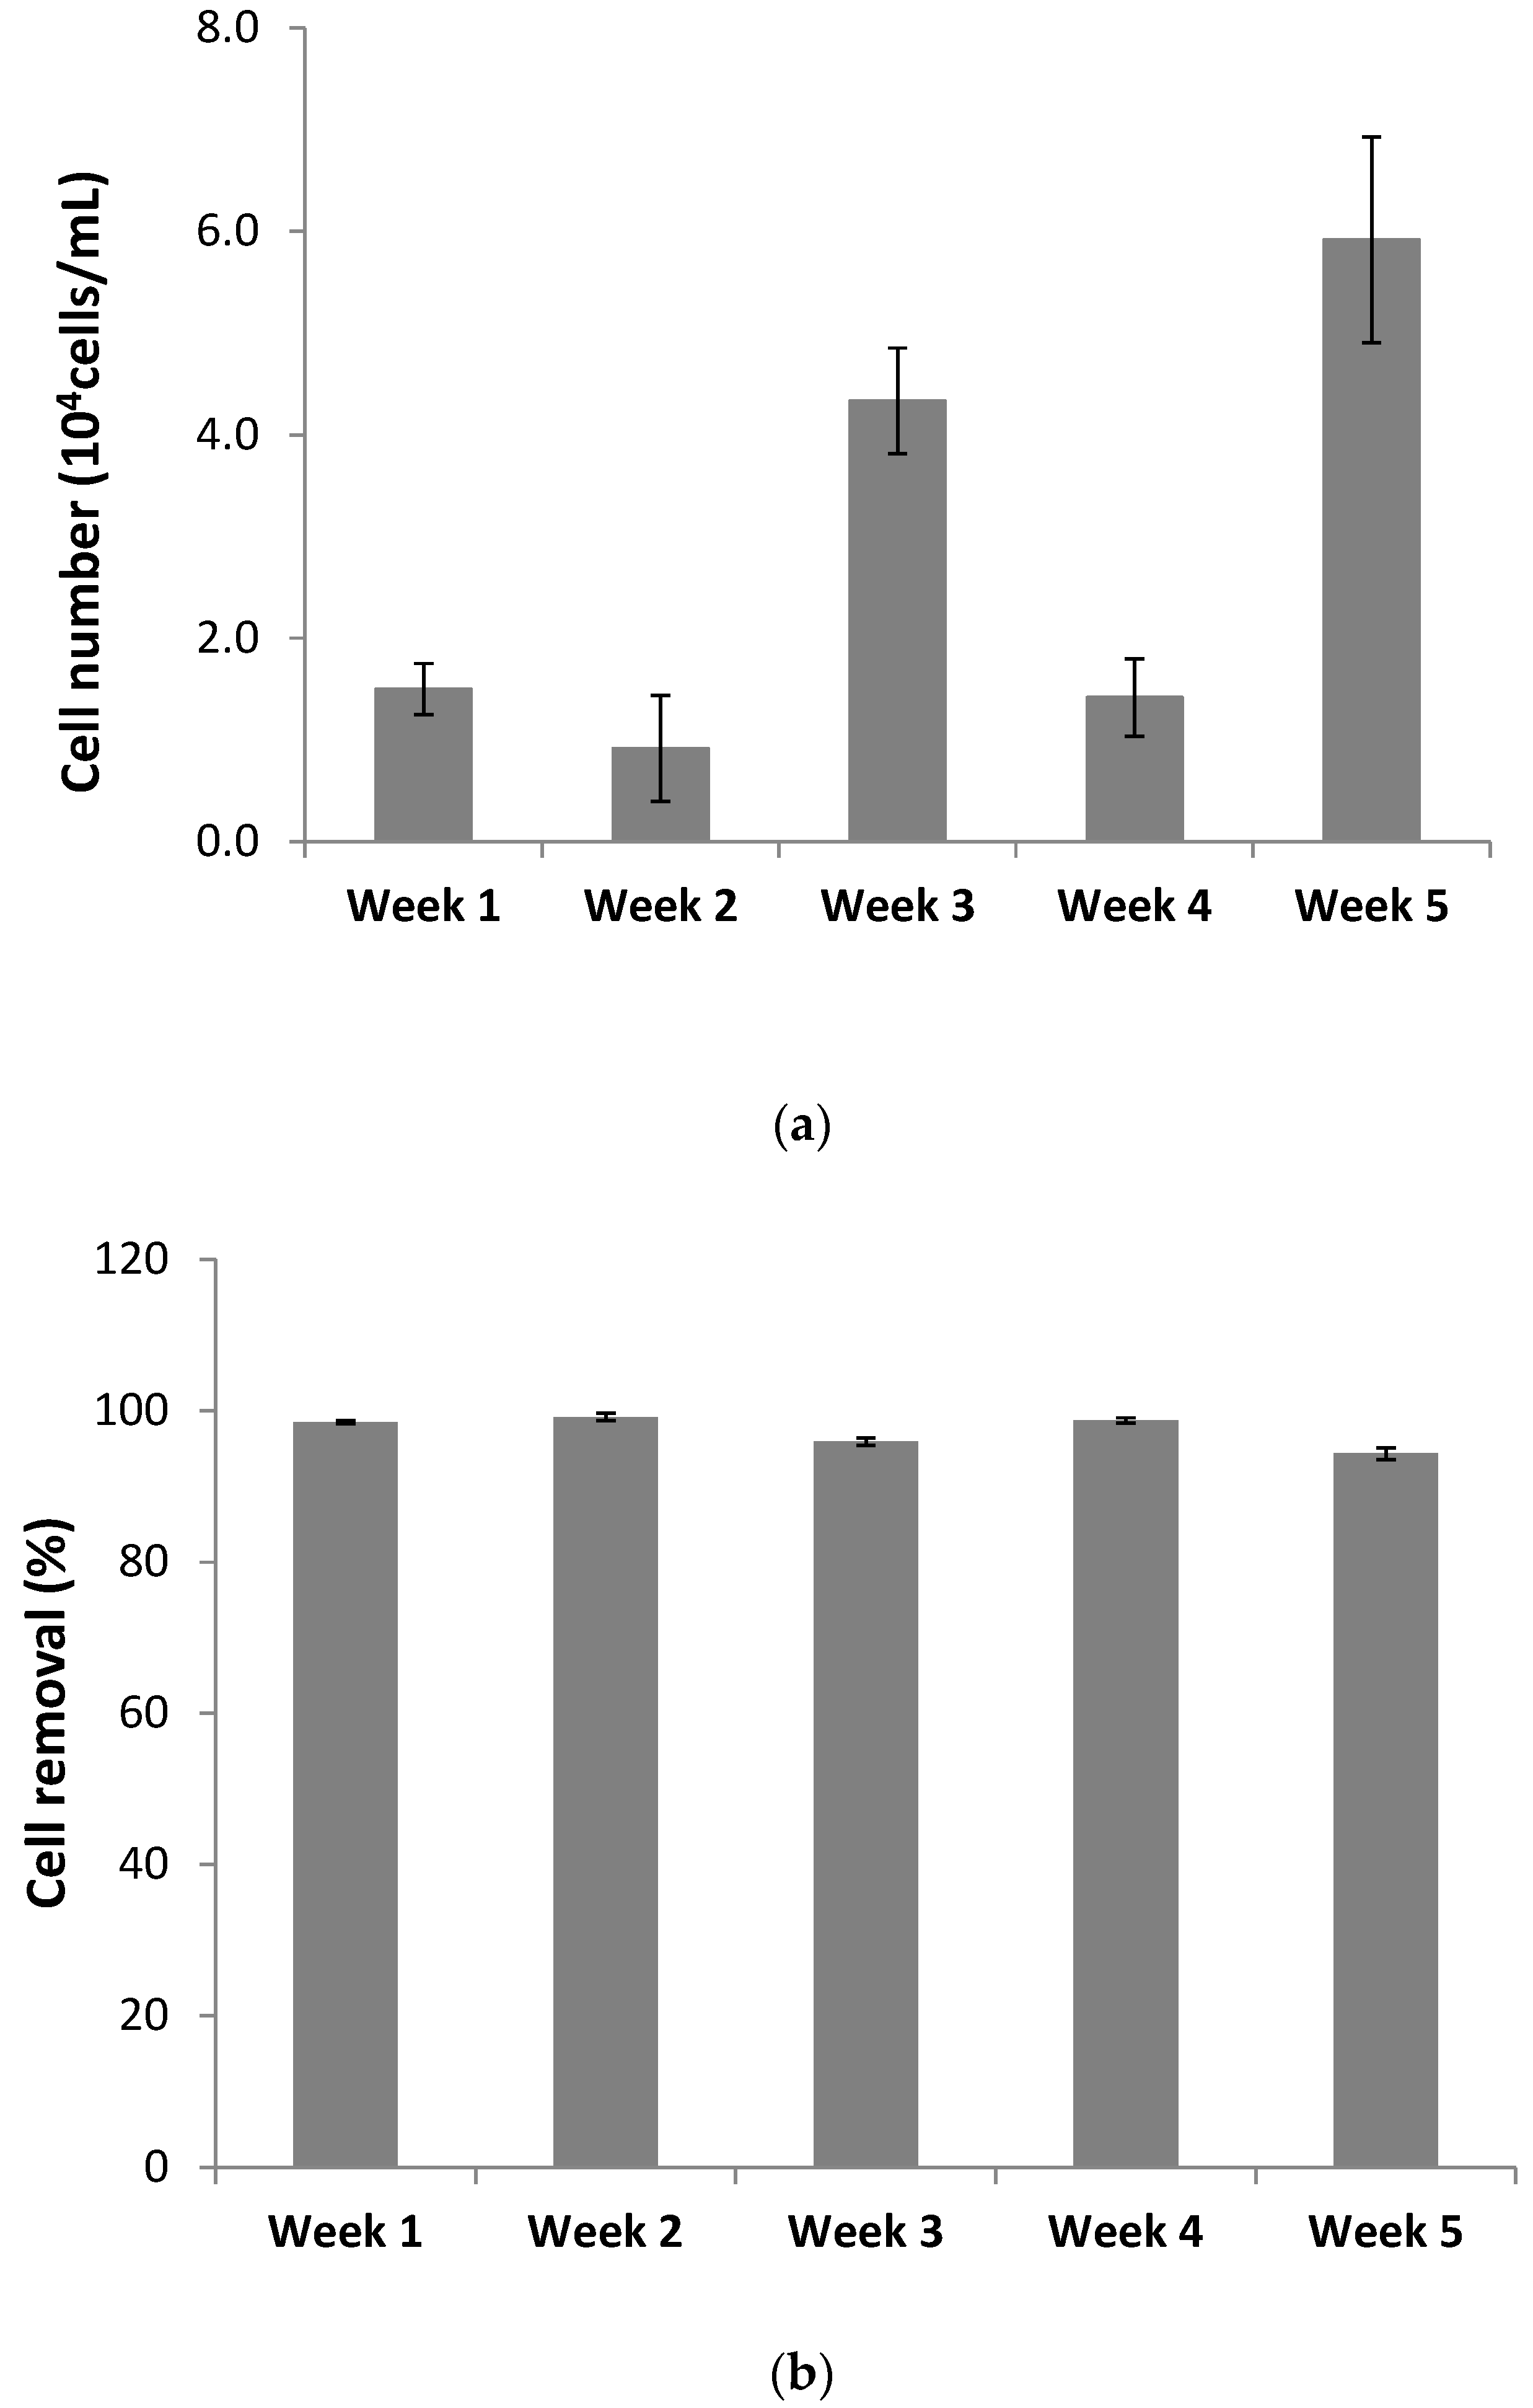
Cell counts were done in samples from the first week to the last week of the experiment, in both lake and CW-treated water using a light microscope (Leica) and a Neubauer chamber. Cell density was calculated considering the dilution factor in number of cells/mL.
2.9. Nutrient and Organic Matter Analysis
For nutrient analysis (nitrate ion, ammonium ion, and phosphate ion), samples were defrosted and shaken for homogenization. Nitrate and phosphate in lake and CW-treated waters were measured using kits HI93766-50 and HI93758C, respectively, from Hanna Instruments Portugal. Dissolved ammonium in lake and CW-treated waters was analysed following the method described in Grasshoff et al. [
31].
Organic matter content was measured through COD using kits HI93754A-25 and HI93754B-25, low range (LR) (0 to 150 mg/L) and medium range (MR) (0 to 1500 mg/L), respectively, from Hanna Instruments Portugal. Due to technical reasons, the lake water from week 6 and treated water from week 5 could not be analysed for organic matter.
2.10. Statistical Analysis
Samples from each microcosm were treated independently. Afterwards, the mean and standard deviation of the three microcosms’ results was calculated.
Significant (p < 0.05) differences among samples were evaluated through a parametric one-way analysis of variance (ANOVA) followed by Tukey’s pairwise comparisons test.
4. Discussion
The current work aimed to test the potential of removing both cyanotoxins and cyanobacteria cells, as these pollutants can be harmful to the environment and can compromise water use, including irrigation.
Tests were carried out with lake water contaminated with a
M. aeruginosa culture that contained both cyanobacteria cells (
M. aeruginosa) and microcystins (MC-LR).
M. aeruginosa is widely found associated with cyanobacteria bloom, specifically in many freshwater bodies across Portugal, including in the lake water of the city park of Porto [
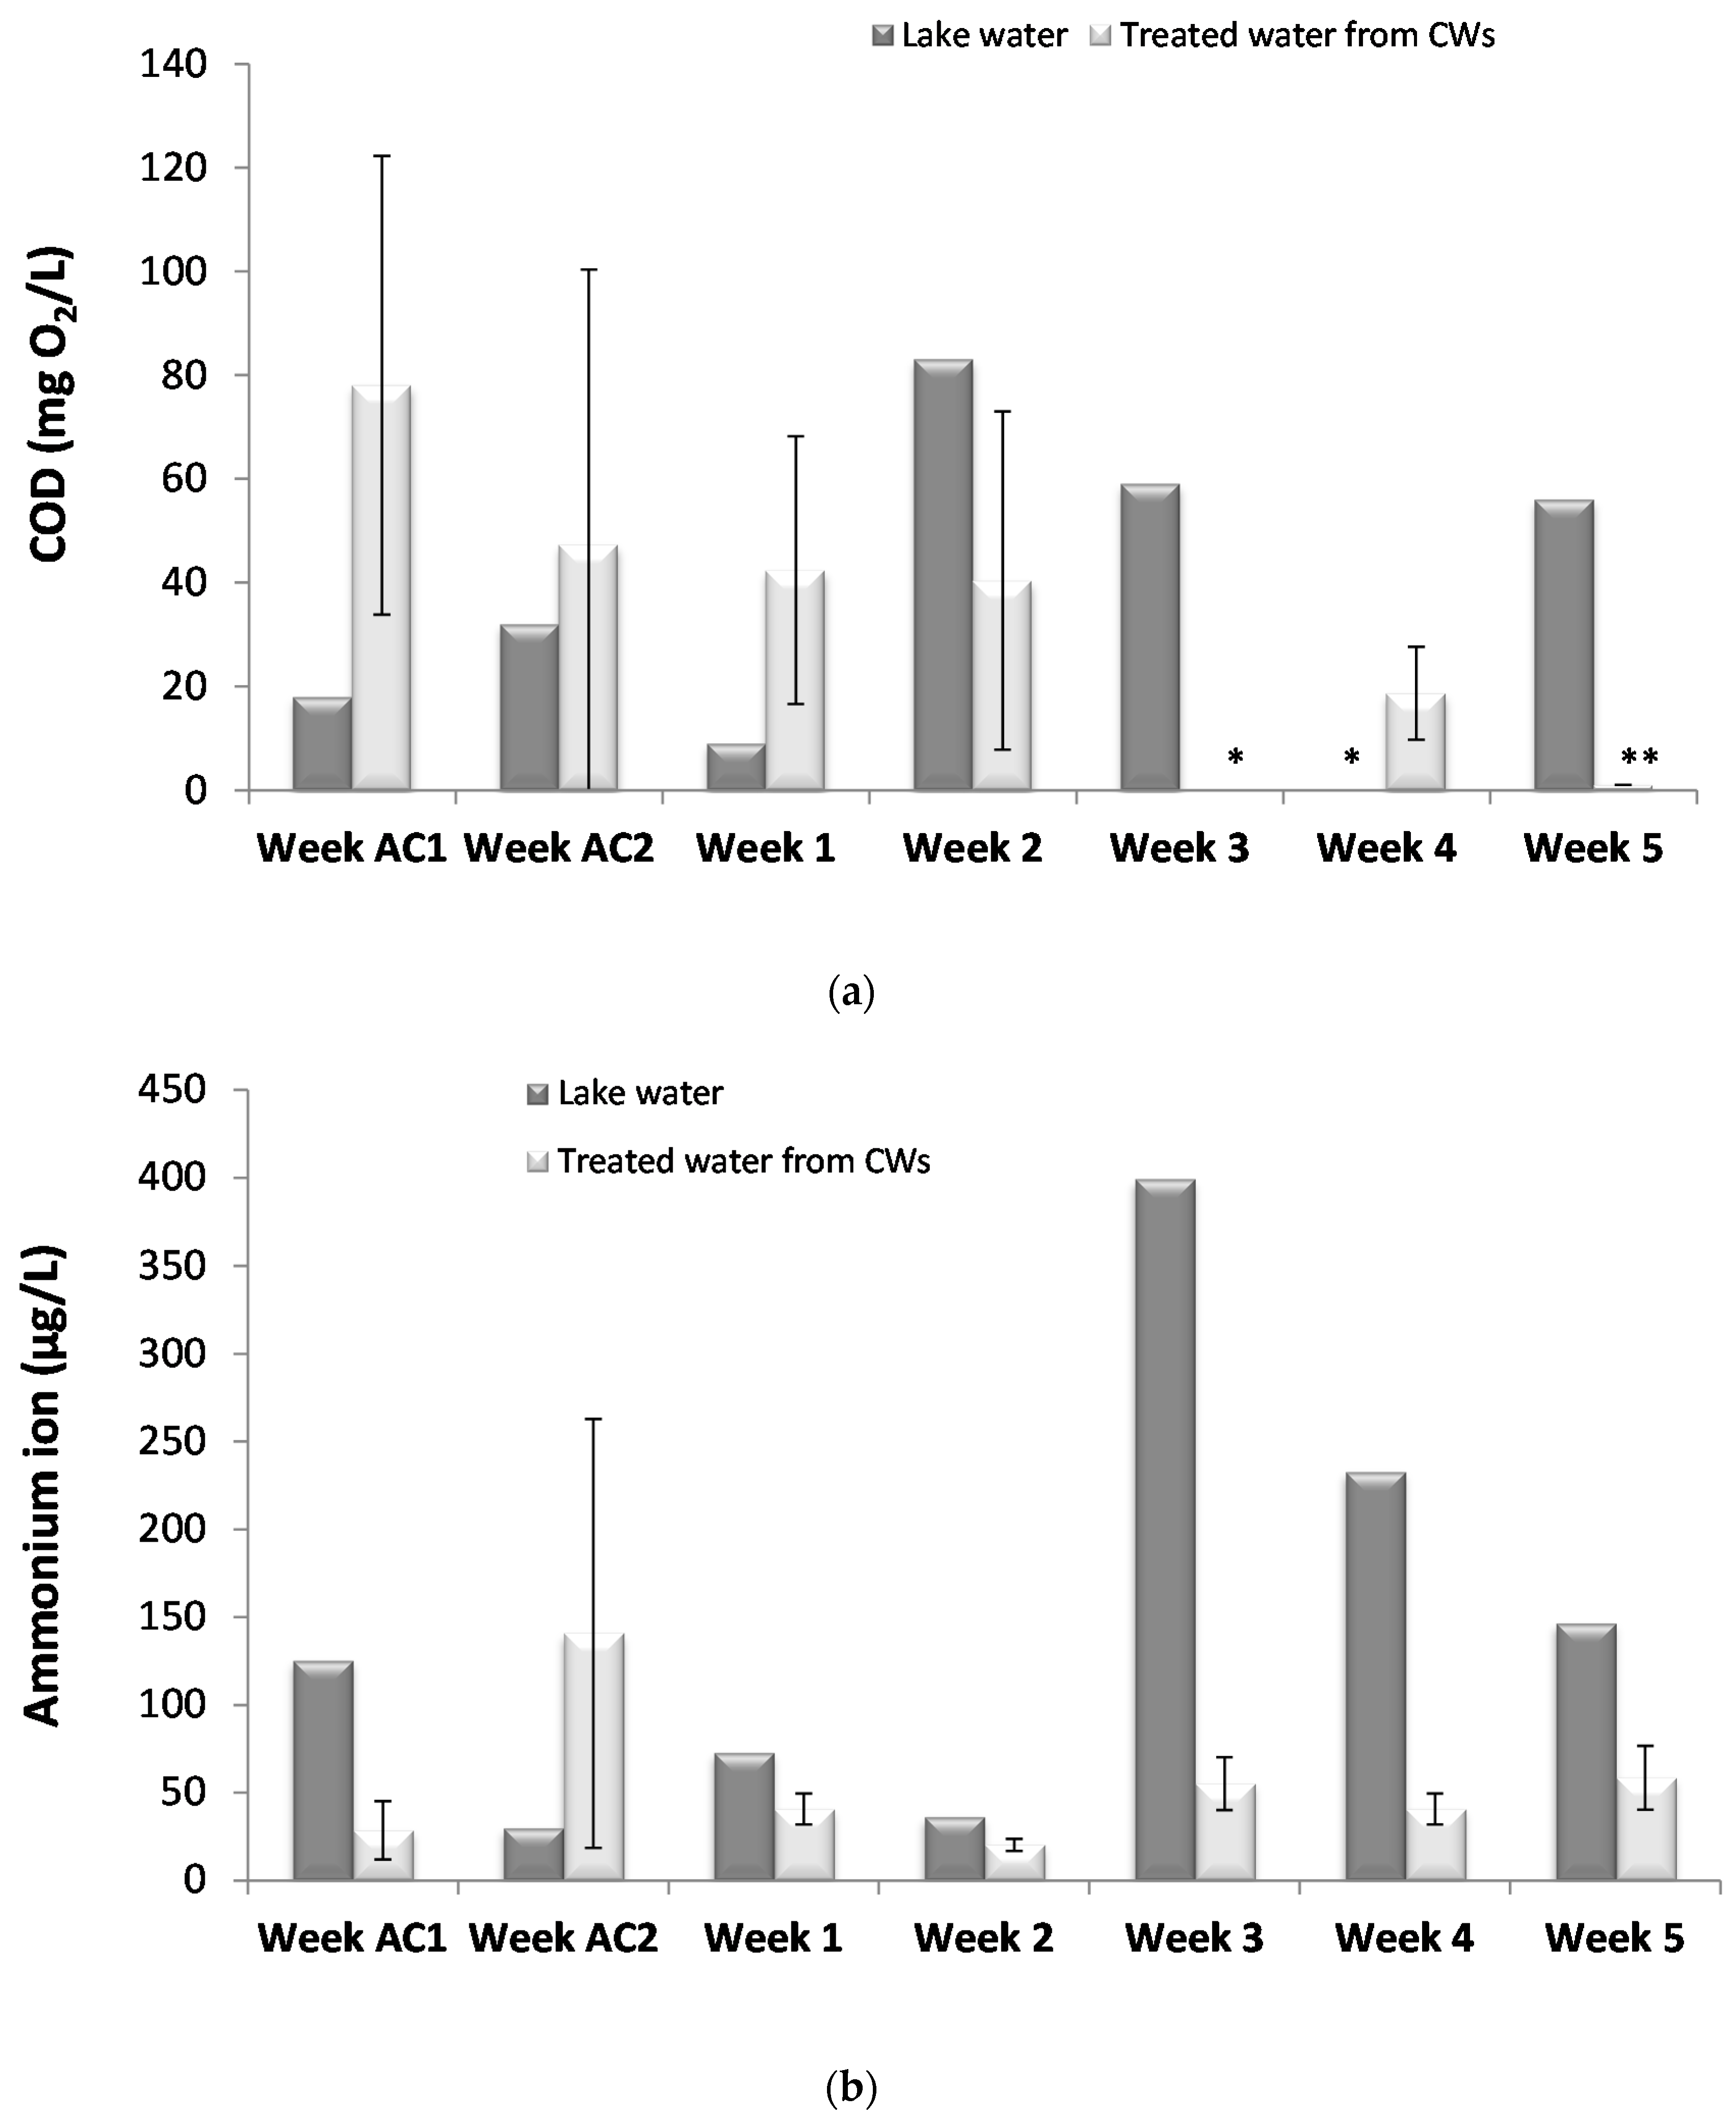
28]. A primary role of CWs is the removal of organic matter and nutrients. In the present study, high removal percentages were observed for both organic matter and ammonium after adaption of the system to the lake water and its stabilization, a feature previously observed [
33]. Organic matter removal results from a combination of physical and microbial mechanisms, namely, physical retention in the substrate, which results in microorganisms’ proliferation and biodegradation [
34]. Moreover, plants can also positively influence this removal by stimulating microbial activity [
20]. An important issue in CWs is the choice of the plant species because they mediate important processes [
35]. For instance, plants can release oxygen through their roots, promoting bacteria activity, bacteria often involved in nitrogen, and carbon cycles. Furthermore, nutrient bioavailability affects plant growth and resource allocation, which influences CW removal efficiency. Thus, in the present work, the plant
P. australis was chosen. This plant has been commonly used in CWs and has shown a positive role on pollutant removal in these systems [
36,
37], showing a high capacity to tolerate and remove some pollutants from contaminated waters (e.g., [
38]).
Ammonium removal processes also include a combination of physical and microbial mechanisms, although for this compound microbial mechanisms (nitrification coupled with denitrification) seems to be the major removal process [
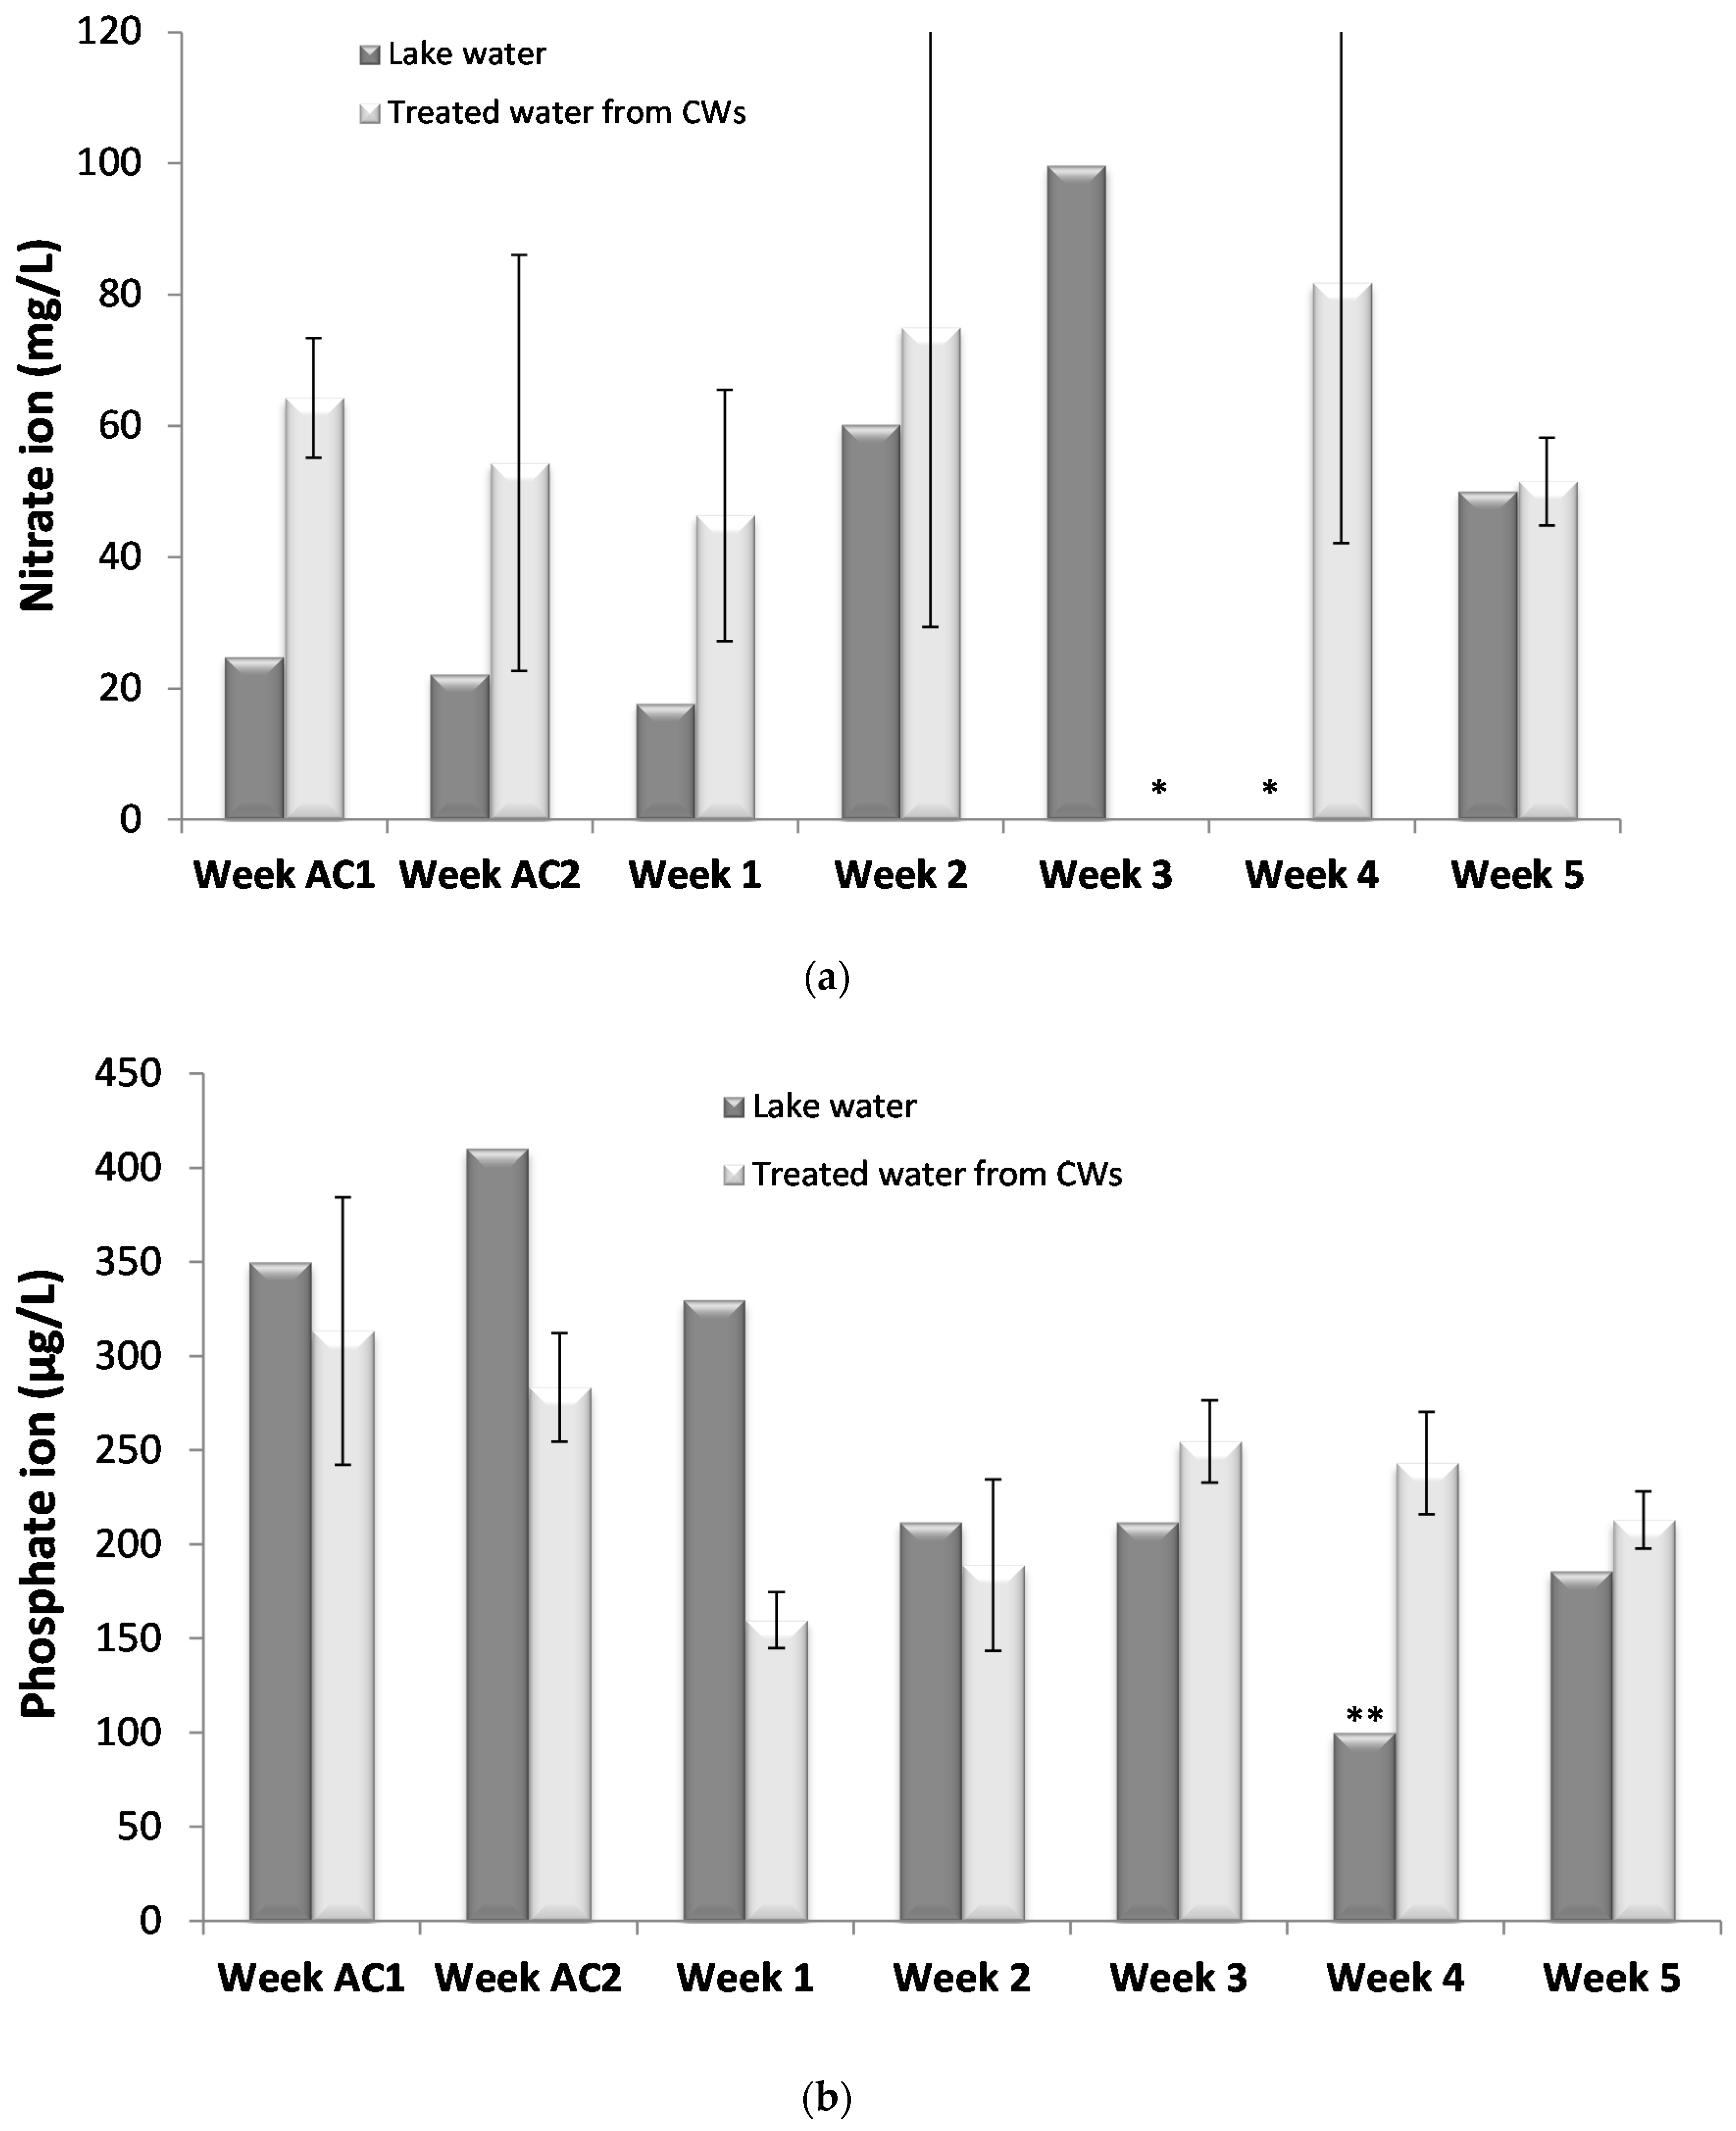
17]. Nitrate removal also depends on denitrification processes, which in the present study were not effective as no significant nitrate removal was observed. Denitrification is the process in which nitrate is converted into dinitrogen via intermediate nitrite, nitric oxide, and nitrous oxide [
33]. This result was expected as CWs with vertical water flow are known for their low nitrate removal rates.
Regarding phosphorus, no significant removals were observed, probably due to its low levels. Phosphorus cycle is fundamentally different from nitrogen cycle. Major phosphorus removal processes are sorption, precipitation, and plant uptake [
17]. Sorption processes are controlled by the concentration of phosphate in soil porewater and the ability of the solid phase to replenish phosphate into soil porewater. Thus, it was likely that the low levels in the water were similar to those in substrate porewater not resulting in phosphorus removal. Plant uptake also did not seem significant. The presence of cyanobacteria and cyanotoxins could have also affected phosphorus removal. Corbel et al. [
22] reported a negative correlation between total phosphorous (TP) and MC concentration in aquatic/soil ecosystems. There may have been lesser uptake of phosphorous from plants due to the presence of cyanobacteria and cyanotoxins.
In general, although CW operating conditions and influent loads can influence the rates of elimination of nutrients and removal yields might vary considerably, in the present study, organic matter and ammonium removal rates were similar to those already reported for bench-scale [
33] and full-scale [
17,
20] CW systems. Thus, the CW microcosms assembled were working adequately, simulating a real CW system throughout the experimental period.
Present CW microcosm systems showed high removal rates of MC-LC (>99%), and the present values were higher than the ones reported by Wang et al. [
25] (up to 90%) when testing removal of MC from doped synthetic water in CW systems. There are many possible ways in which the MCs could have been processed in the CWs. CW performance is accomplished by a synergic combination of physical, chemical, and biological (microbial) mechanisms. In fact, several studies have shown that removal of pollutants in CWs occurs mainly by substrate adsorption, microbial biodegradation, and plant uptake, in a combined action of substrate, microorganisms, and plants [
39,
40], which, in the present study, can be responsible for cyanotoxin removal from the contaminated waters. Studies have shown that once the cyanotoxins enter into aquatic or soil ecosystems they can undergo photochemical degradation by UV, absorption onto sediments or suspended solids, and biodegradation by microorganisms [
22]. In this study, the CWs in the plastic containers were wrapped in aluminium foil to prevent any kind of sunlight exposure and photodegradation of compounds. Corbel et al. [
22] reported that even with full sunlight exposure it takes at least 2 to 6 weeks for photochemical degradation. Therefore, photochemical degradation was probably not a significant removal mechanism, although slight photochemical degradation on the surface of the CWs during the recirculation of the water cannot be excluded.
Removal of microcystins from the contaminated water may have occurred through physical separation by the CW substrate. Rapala et al. [
41] and Lahti et al. [
42] reported that no more than 20% of cyanotoxins can be adsorbed on sediments. In the present study, MC was detected in the root bed substrate at the end of the experiment, ca. 0.033 µg/g, indicating MC probable adsorption. Considering the inputs of MC in the water going into the CWs along the 7 weeks and making an estimation of the mass of substrate used in the current systems [
26], it can be estimated that ca. half of the MC-LR amount remained adsorbed to the substrate. Therefore, part of the MC_LR was probably biodegraded by microorganisms present in root bed substrate or taken up by plants, although adsorption of the MC-LR onto lava rocks (a porous material that promotes adsorption as well as biofilm formation), not analysed in the present study, cannot be discarded.
Retention in the substrate would have increased breakdown by the microbial community present in the wetland substrate and in biofilms [
22]. The presence of plants (
P. australis) in the CWs can also increase the microbial activity, for instance through release of exudate compounds, leading to increased removal by biodegradation of pollutants, in the present case microcystins, along with other organic matter [
20]. As mentioned above, plants can also biostimulate the microbial rhizosphere by rhizosphere aeration [
33]. Thus, biodegradation can be a significant MC removal process in CWs. Studies have indicated that biodegradation can, in fact, be the main fate for the removal of most cyanotoxins in aquatic systems [
22,
23] and CWs were designed to mimic natural wetlands processes. Several microorganisms have been identified as MC degraders, such as Proteobacteria and Actinobacteria [
23], two phyla already identified in CW substrate [
43]. Moreover, Wang et al. [
25] also concluded that bioaugmentation, that is, the addition of selected MC-degrader bacteria, could improve MC removal rates.
Plant uptake can also be responsible for MC-LR removal. In the present study, analysis of MC-LR in plant tissues was not possible, but taking into consideration previous results, the removal process cannot be excluded. Pflugmacher et al. [
44] reported that the aquatic macrophytes
Ceratophyllumdemersum,
Elodea canadensis,
Vesiculariadubyana, and
Phragmites australis could uptake MC-LR, and plant accumulation ranged from 1.0 to 120.0 pg/g of fresh weight after 7 days of exposure to 2.5 mg/L of
14C-MC-LR contaminated medium. The highest uptake was by the common reed plant
P. australis. Mycotoxins can also be toxic to plants, inhibiting for instance their growth [
22]. However, in the present study
P. australis seemed to resist toxins and no visible signs of toxicity where observed, with plants looking healthy through the experimental time.
Thus, MC-LR removal in CWs might have occurred through a combination of processes, such as adsorption on the CW substrates, degradation by microorganisms, and/or plant uptake.
The present study showed not only a high removal of the cyanobacteria toxin from the contaminated water, but also a high removal rate of cyanobacteria cells. Cell removal could be due to a combination of filtration, followed by adsorption and aggregation, and then metabolic activity of biofilm microorganisms and macrophytes, processes responsible for the removal of bacteria in CW systems [
45,
46]. In fact, CW efficiency for the removal of bacteria has been already shown for different domestic wastewaters (e.g., [
45,
46]), with percentages of removal also higher than 90% [
45]. For instance, filtration through the substrate of CWs was responsible for a significant removal of faecal indicator bacteria [
47]. This physical process results in the retention of bacteria in the CW system, with bacteria being adsorbed to CW substrate or plant roots. Then, bacteria can be eliminated through natural die-off (starvation or predation) [
46].
From this study, we can conclude that CWs have great potential for the removal of cyanobacterial cells and cyanotoxins from contaminated fresh water. Removal of cyanobacterial cells and respective cyanotoxins by CW is a promising approach to treat contaminated water, especially considering the increasing number of eutrophic water bodies. In fact, recent research suggests that eutrophication and climate change are two processes that may promote the proliferation and expansion of harmful cyanobacterial blooms in fresh water, estuarine, and marine ecosystems. CWs can also be useful in reducing nutrient amounts in fresh water, and also reducing eutrophication problems.

 ,
, 


