Article

Molecular Analyses of Fecal Bacteria and Hydrodynamic Modeling for Microbial Risk Assessment of a Drinking Water Source

1
Department of Microbiology, Tumor and Cell Biology, Karolinska Institutet, 17177 Stockholm, Sweden
2
Department of Architecture and Civil Engineering, Chalmers University of Technology, 41296 Gothenburg, Sweden
3
Institute of Molecular Biology and Biotechnology, Universidad Mayor de San Andrés, La Paz 10077, Bolivia
4
Department of Disease Control and Epidemiology, National Veterinary Institute, 75189 Uppsala, Sweden
*
Author to whom correspondence should be addressed.
Both authors contributed equally.
Water 2020, 12(1), 3; https://doi.org/10.3390/w12010003
Submission received: 13 November 2019 / Revised: 9 December 2019 / Accepted: 15 December 2019 / Published: 18 December 2019
(This article belongs to the Section Water Resources Management, Policy and Governance)

Abstract

:
Safe water is a global concern, and methods to accurately monitor quality of water are vital. To assess the risks related to bacterial pathogen load in Lake Vomb that provides drinking water to the southern part of Sweden, this study combined molecular analyses of enterobacteria and bacterial pathogens in water using quantitiative real-time PCR with hydrodynamic modeling and quantitative microbial risk assessment (QMRA). A real-time PCR assay to detect enterobacteria was set up by primers targeting ssrA. Between February 2015 and May 2016, presence of ssrA gene copies as well as Campylobacter spp., Salmonella spp., and EHEC O157 DNA was analyzed by real-time PCR at several locations in the catchment of Lake Vomb and its tributaries Björkaån, Borstbäcken, and Torpsbäcken. Björkaån had the highest detected concentrations of the ssrA gene and, according to the results of hydrodynamic modeling, contributed most to the contamination of the water intake in the lake. None of the water samples were positive for genes encoding EHEC O157 and Campylobacter spp., while invA (Salmonella spp.) was present in 11 samples. The QMRA showed that the suggested acceptable risk level (daily probability of infection <2.7 × 10⁻⁷) is achieved with a 95% probability, if the Salmonella concentrations in the water intake are below 101 bacteria/100 mL. If a UV-disinfection step is installed, the Salmonella concentration at the water intake should not exceed 106 bacteria/100 mL.

1. Introduction

Public health risks associated with fecal contamination in recreational and drinking water are of global concern. Human or animal fecal contamination in water increases the risk of presence of pathogenic microorganisms, and a variety of illnesses have been associated with intake of, or exposure to, contaminated water, including gastrointestinal infections, skin-diseases, and eye and ear infections [1]. Diarrheal diseases, many times caused by water-borne outbreaks, claim millions of lives annually [2]. Epidemiological studies worldwide have established links between gastrointestinal infections and exposure to contaminated water due to breakdown of the drinking water supply systems in poor areas, during wars, in crowded refugee camps, and after natural catastrophes [3,4]. However, in most countries with developed water supply systems, increased levels of contamination are often linked to failures in water piping systems or drinking water treatment plants [5,6]. Storms and heavy rainfalls resulting in discharges of wastewater and runoff from livestock or wildlife into rivers and lakes can also increase microbial contamination [7,8,9].
Presence of fecal indicator bacteria (FIB), such as Escherichia coli or Enterococcus spp., is commonly used to estimate the risk of microbial contamination. Another common strategy is to culture for so-called coliforms growing on agar plates. The term coliform includes the lactose-fermenting Enterobacteriaceae genera Escherichia, Klebsiella, Citrobacter, and Enterobacter [10]. These species can be naturally present both in human and animal feces as well as in environmental sources, but increased numbers of coliforms are interpreted as an elevated risk of impact on water quality. Although most of the FIB are not harmful to humans, some Escherichia coli (e.g., enterohemorrhagic E. coli O157 (EHEC O157)) are pathogens [10]. Increased presence of FIB is also interpreted as an increased risk of presence of pathogens of fecal origin, such as, Giardia, Cryptosporidium, Campylobacter, Salmonella, and norovirus. Increased concentrations of FIB are hence used to warn the public to either avoid swimming or boil tap water before consumption. The culture-dependent FIB methods do not however detect pathogenic species [11]. Recently, culture-independent molecular methods have proven to be useful for specific detection of pathogenic species, and real-time PCR has been widely used to detect and quantify DNA from microbial pathogens in water [12,13,14].
To manage microbial risks in drinking water systems, the World Health Organisation (WHO) [15] recommends a holistic approach encompassing the entire drinking water system from catchment to consumer. Thus, it is of great importance to consider source water quality prior to drinking water treatment. In Sweden, many of the larger water suppliers perform a basic quantitative microbial risk assessment (QMRA) to ensure adequate drinking water quality [16,17]. However, the suppliers have difficulties estimating putative pathogen concentrations at the water intake, due to sparse monitoring of pathogens and lack of quantitative data. Thus, to support risk assessment and evaluate risk reduction measures, fate and transport modeling of FIB and pathogens has been applied [18,19,20,21,22]. In Sweden, coupling fate and transport modeling with QMRA is still relatively rare, but some examples exist [23] and simplified methods have been developed for practical application to meet the increasing interest and need, see e.g., Åström and Johansson [24], Åström, Lindhe, Bergvall, Rosén, and Lång [17]. Additionally, an approach combining incidence data with hydrodynamic modeling to estimate pathogen concentrations for QMRA and the effect of mitigation measures has been suggested [25,26]. Measurements of FIB and pathogen concentrations would enhance the applicability of the fate and transport modeling and add to the overall risk assessment.
The purpose of the present study was to use molecular methods to determine the presence and quantity of enterobacteria and presence of bacterial pathogens in relation to water flow and seasonal variations in the catchment of Lake Vomb, located in Skåne, Southern Sweden. Additionally, observed bacterial concentrations in the tributaries were used to provide input for hydrodynamic modeling in order to estimate reduction of bacteria in the lake during transport from the tributaries to the water intake. Finally, health risk assessment using QMRA and the pathogen removal in the drinking water treatment plant was conducted to determine acceptable pathogen concentrations in critical points in the treatment processes.

2. Materials and Methods

2.1. Case Study Area

Lake Vomb supplies a large part of southern Sweden (approximately 400,000 consumers), including the city of Malmö, with drinking water. Lake Vomb is a nutrient rich lake with alkaline pH located in an agricultural area [27]. Lake Vomb has an area of 12 km2 and has three main tributaries, the rivers Borstbäcken, Torpsbäcken, and Björkaån with average water flows of 0.21, 0.32, and 3.53 m3/s, respectively. The main sources of fecal contamination in the catchment are on-site sewers, a few small wastewater treatment plants, and agricultural activities [28]. The drinking water treatment plant includes artificial infiltration, rapid sand filtration, softening, and monochloramination.

2.2. Collection of Surface Water

A total of 289 water samples were collected during February 2015–May 2016 in the catchment of Lake Vomb. Samples were collected once or twice every month, and during the summer months sampling was performed every week. Water samples were collected at seven different sampling locations (Figure 1). The natural groundwater source (Figure 1, point 6) is not connected to the artificial groundwater recharge zone (Figure 1, point 1a). Sterile glass bottles were used for collection of 1 L samples at each sampling site; date and water temperature at the time of sampling were recorded. The samples were kept cold on ice and transported to Chalmers University of Technology in Gothenburg, Sweden, or to the laboratory at Ringsjöverket close to Lake Vomb for filtration. The samples were filtrated onto sterile 47 mm diameter filters (MF-Millipore) with pore sizes 0.22 and 0.45 μm (half of sample volume per filter type) using a filtration device with applied vacuum. Using sterile forceps, each filter was folded into a cylinder with the sample side facing inward, and then inserted into eppendorf tubes and kept frozen at −20 °C until DNA extraction. The filters were transported to Karolinska Institutet, Stockholm, Sweden where the DNA extraction and real-time PCR analysis were conducted.

2.3. DNA Extraction

DNA was extracted from thawed filters cut into a quarter or half a filter using sterile scissors and forceps. The cut filters were immersed in 1 mL Qiagen Inhibit buffer (Qiagen, Hilden, Germany) in 2 mL Eppendorf tubes and sonicated at 20 kHz on ice for 2 min using Fisherbrand Model 50 Sonic Dismembrator (Fisher Scientific, Hampton, NH, USA). Sonication was used to ensure proper release of attached bacteria and increased DNA recovery. The sonicated samples were incubated at 70 °C for 15 min. After incubation, 600 μL of the solution was mixed with 25 μL Proteinase K and incubated over night at 56 °C. DNA was extracted using the QiaAMP fast DNA kit (Qiagen) as described by the manufacturer and eluted in 200 μL of elution buffer. Extraction blanks were prepared from inhibitex buffer at each extraction time point. Positive control DNA was extracted from 2–3 colonies of enteric bacteria grown on blood agar plates overnight. The colonies were washed once with 200 μL sterile milliQ water and spun down for 2 min at 13,000 rpm in a table top centrifuge. The pellets were extracted with QiaAMP fast DNA kit (Qiagen) as described by the manufacturer. The DNA concentrations were recorded using a Qubit spectrophotometer and extracted DNA was stored at −20 °C.

2.4. Quantitative PCR

PCR primers for real-time PCR quantification of coliforms were designed by primer3 [29]. The sequence of E. coli ssrA (tmRNA) was analyzed by BLAST (www.ncbi.nlm.nih.gov), and conserved regions and base pairs shared by several Escherichia and Citrobacter genomes were used to design primers for detection of coliforms and genetically related species of Enterobacteriaceae. Primers for specific detection of Salmonella spp., EHEC O157 and Campylobacter spp. were selected from previous publications (Table 1).
Since we used a molecular approach, the ssrA primers also detected the closely related genera Shigella and Salmonella. Specific PCR amplification was confirmed in all target genera (E. coli, Citrobacter spp., Enterobacter spp., and Klebsiella spp. as well as Salmonella spp. and EHEC O157). For ssrA, other members of Enterobacteriaceae, such as lactose negative Edwardsiella, Erwinia, and Yersinia, as well as more distantly related bacteria, such as Vibrio cholerae and Campylobacter spp., were not detected by the primers. Specific amplifications of Salmonella, EHEC O157, and Campylobacter using the respective primers were confirmed using DNA from all species mentioned above. Campylobacter, Salmonella, and EHEC O157 are pathogenic genera commonly found in natural waters [33] and were chosen as pathogens since they might be present in animal sources or as fecal contamination, are food- or water-borne pathogens, and are common causes of gastroenteric infections in humans in Sweden.
Real-time PCR reactions were run in duplicates for each dilution in 96-well plates on Roche with a total volume of 25 μL in each reaction. The PCR mix contained 12.5 μL Power SYBR®Green PCR Master mix (Life Technologies, Carlsbad, CA, USA), 10 pmol of each primer, 8.5 μL MilliQ water, and 2 μL DNA. Negative and positive controls and a standard curve were included in each PCR run using the settings for absolute quantification for LightCycle®480 Instrument II (Roche Molecular Diagnosis, Inc., Pleasanton, CA, USA).
A standard curve of serial diluted purified PCR product was included in each run and for each primer and used to calculate the copy number of target gene per sample. The details of the standard curve and real-time PCR methods have been described in previous publications [34,35,36,37]. Briefly, amplified PCR products of each target gene were purified using Qiagen PCR purification kit (Qiagen). The DNA concentration of the purified PCR product was measured in a Qubit (Invitrogen, Carlsbad, CA, USA), and the molar weight of the PCR product and Avogadro’s number were used to calculate DNA copy numbers per μL. The purified PCR fragments were then serially diluted in Qiagen elution buffer to concentrations of 106, 105, 104, 103, 102, 10, and 1 copies per μL. The amplification efficiencies and limit of detection (LOD) of the respective primer sets were determined by regression analyses of Log10-transformed genome copy numbers using the serially diluted standard curve of purified PCR products plotted against CT values to 1 copy per reaction for invA, and 10 copies for ssrA, EHEC, and cadF (Supplementary Material Figure S1). The dilution series was aliquoted into 200 μL eppendorf tubes and stored at −20 °C until use. A new tube for each dilution was used for each experiment. The dilution series was run in duplicate and used as standard curve in each real-time PCR run. Each run was manually inspected to ensure that the 10-fold dilutions of the standard curve had differences in CT values of around 3.3 (23.3 = 10) between each dilution, and to confirm the expected temperature of melting Tm (±0.5 °C) for each primer pair.
To calculate the efficiency of real-time PCR reactions, the logarithm of copy numbers was plotted against CT values for all runs for each primer, and linear regression analyses were performed to determine the slope and intercept. The linear dynamic ranges for all primers were at least six orders of magnitude. The mean slope and intercept for all primers are shown in the Supplementary Material (Figure S1). Since gene copy concentrations in the water samples usually were very low, and most of the water samples displayed a completely flat line indicating complete absence of the respective species, we recorded all positive signals with a CT value differing less than 0.5 °C above or below the correct Tm. Only samples with one peak in the melting curve analysis were classified as positive. For each water filter, DNA was analyzed undiluted and diluted tenfold and in some cases hundredfold, to eliminate possible inhibitory factors, in duplicate real-time PCR reactions. Samples with positive signals in the initial duplicate real-time PCR run were repeated twice. All individual results from each water filter samples with positive Tm peaks were combined to generate the mean from all real-time PCR runs per sample. Assuming one real-time PCR copy of the target gene ssrA per genome determined by BLAST analysis of enterobacterial genomes, the amount of ssrA in the original water source was calculated as number of genomes per 100 mL of filtrated water. To do this, the extraction procedures described in Section 2.3 including the volume of initial water filtrate (500 mL), cut filters (one quarter or one half filter was used), and dilution of samples during DNA extraction (600 μL of the 1 mL filter and inhibitex buffer sonicate was used for subsequent DNA extraction), were taken into account. By using 2 μL of DNA per real-time PCR reaction of the total volume of 200 μL elution buffer and the same volume (2 μL) for the standard curve, the initial numbers of target bacteria in the water sample could be calculated. Since the detection of gene copies of invA (Salmonella spp.) were very close to the detection limit, invA was only reported as present or absent in order not to overestimate the true concentrations due to the dilution factor calculations.

2.5. Hydrodynamic Modeling

To simulate the water flows in the lake, the three-dimensional time-dependent hydrodynamic model MIKE 3 FM (MIKE Powered by DHI) was used. The model consists of continuity, momentum, temperature, salinity, and density equations, and is closed using a turbulent closure scheme. The application of this model to Lake Vomb has been described by Sokolova, Lindström, Pers, Strömqvist, Lewerin, Wahlström, and Sörén [22]. In brief, the model was set up and validated to simulate the conditions during the year 2015. The following input data were used: inflow from the tributaries Björkaån, Torpsbäcken, and Borstbäcken, outflow from the lake, water extraction for drinking water production, precipitation on the lake surface, wind speed and direction, air temperature, cloudiness (clearness coefficient), relative humidity (Supplementary Materials Figures S2 and S3). The model was set up to account for the hydrometeorological conditions (e.g., wind and precipitation on the lake surface), and to simulate the heat exchange between the atmosphere and the lake. The water density was formulated as a function of temperature. In order to simulate the pathogen fate and transport in Lake Vomb, the microbial water quality model ECO Lab was coupled to the hydrodynamic model of the lake. ECO Lab used flow fields from the hydrodynamic model to calculate the pathogen concentrations in the lake. Due to the lack of knowledge on ssrA decay in water, the contaminant decay was described in the model assuming a half-life time of 3 days—this value is representative for decay of culturable bacteria, as summarized in [22].
The hydrodynamic model was then used to simulate the impact of the tributaries (sampling points 2b, 3, and 4) and of wastewater from on-site sewers (sampling point 2a) on the ssrA concentrations at the water intake. For this purpose, the period July–September 2015 was simulated, since the sampling results showed most frequent detections and the highest concentrations of ssrA during this period, and the water flows in the tributaries were relatively constant (Supplementary Material Figure S2). Two scenarios were simulated—it was assumed that the concentrations in the tributaries and wastewater from on-site sewers were (a) the median concentrations calculated using the Log10-transformed measured data for July–September 2015, and (b) the maximum concentrations measured in the tributaries and wastewater.

2.6. Quantitative Microbial Risk Assessment

To investigate the potential health risks associated with Salmonella, the QMRA method was applied [38]. Calculations were performed using a QMRA-tool [16] developed for Swedish drinking water producers built up using the software Analytica 5.1.6.119 from Lumina Decision Systems. Based on the pathogen reduction in the drinking water treatment plant, the impact of Salmonella concentrations at the water intake (sampling point 1b) and in the infiltrated groundwater from the boreholes (sampling point 1a) on the risk level was estimated. The acceptable risk level was set as the daily probability of infection of 2.7 × 10⁻⁷ infections per person per day [39].
The dose-response model used for Salmonella was an approximate Beta Poisson distribution expressed as:
P i n f = 1 ( 1 + d β ) α ,
where Pinf was the daily probability of infection, d was the Salmonella dose, and α = 0.428 and β = 8524 [40]. The dose (d) was calculated based on the Salmonella concentration in the drinking water and the drinking water consumption in Sweden:
d = D W c · C S a l m ,
where DWc was the drinking water consumption volume, and CSalm was the Salmonella concentration in drinking water. The drinking water consumption (DWc) was calculated as:
D W c = e N ,
where N was a normal distribution with µ = −0.299 and σ = 0.57 [41].
The Log10 Salmonella reduction in the drinking water treatment plant was assumed to be the same as previously reported for Campylobacter by Bergion et al. (2018). Salmonella reduction by the artificial infiltration was represented by a Beta General probability density function (α1 = 2.8963, α2 = 5.9153, min = 0, and max = 25.521) with a mean value of 8.4 Log10 units. Salmonella reduction by the rapid sand filtration was represented by a triangular probability density function (min = 0.4, mid = 0.5, and max = 0.6) with a mean value of 0.5 Log10 units. The effect of a UV disinfection treatment step on the potential risks was also studied. The typical UV dose for Sweden results in a maximum Salmonella reduction [42]. Thus, an additional reduction of 5.6 Log10 units (point estimate) representing the reduction by UV disinfection [42] was included for this analysis. Monte Carlo simulations were used to account for variation in the Log10 reduction by the artificial infiltration and the rapid sand filtration treatment steps, as well as for variation in drinking water consumption.
Using QMRA, we calculated the threshold Salmonella concentrations at the water intake and in the infiltrated groundwater from boreholes that should not be exceeded in order to meet the acceptable risk level looking at the 95th percentiles. We used this approach, instead of using the invA data as input to QMRA, due to the presence/absence nature of the invA data, and the fact that the presence of invA genes does not necessarily mean the presence of viable Salmonella cells posing infection risks.

2.7. Statistical Analyses

Regression curve analyses of the real-time PCR standard curves were performed using Graph Pad PRISM version 7.0. To compare the proportion of positive samples during the cold and the warm periods, paired samples t-tests were performed using IBM SPSS Statistics 19. To analyze the potential seasonality of the measured data for each sampling point, a logistic regression model using binary data (where detect/non-detect is the dependent variable and warm/cold period is the independent variable) was used in Stata v15 by StataCorp. p-values < 0.05 were considered significant.

3. Results

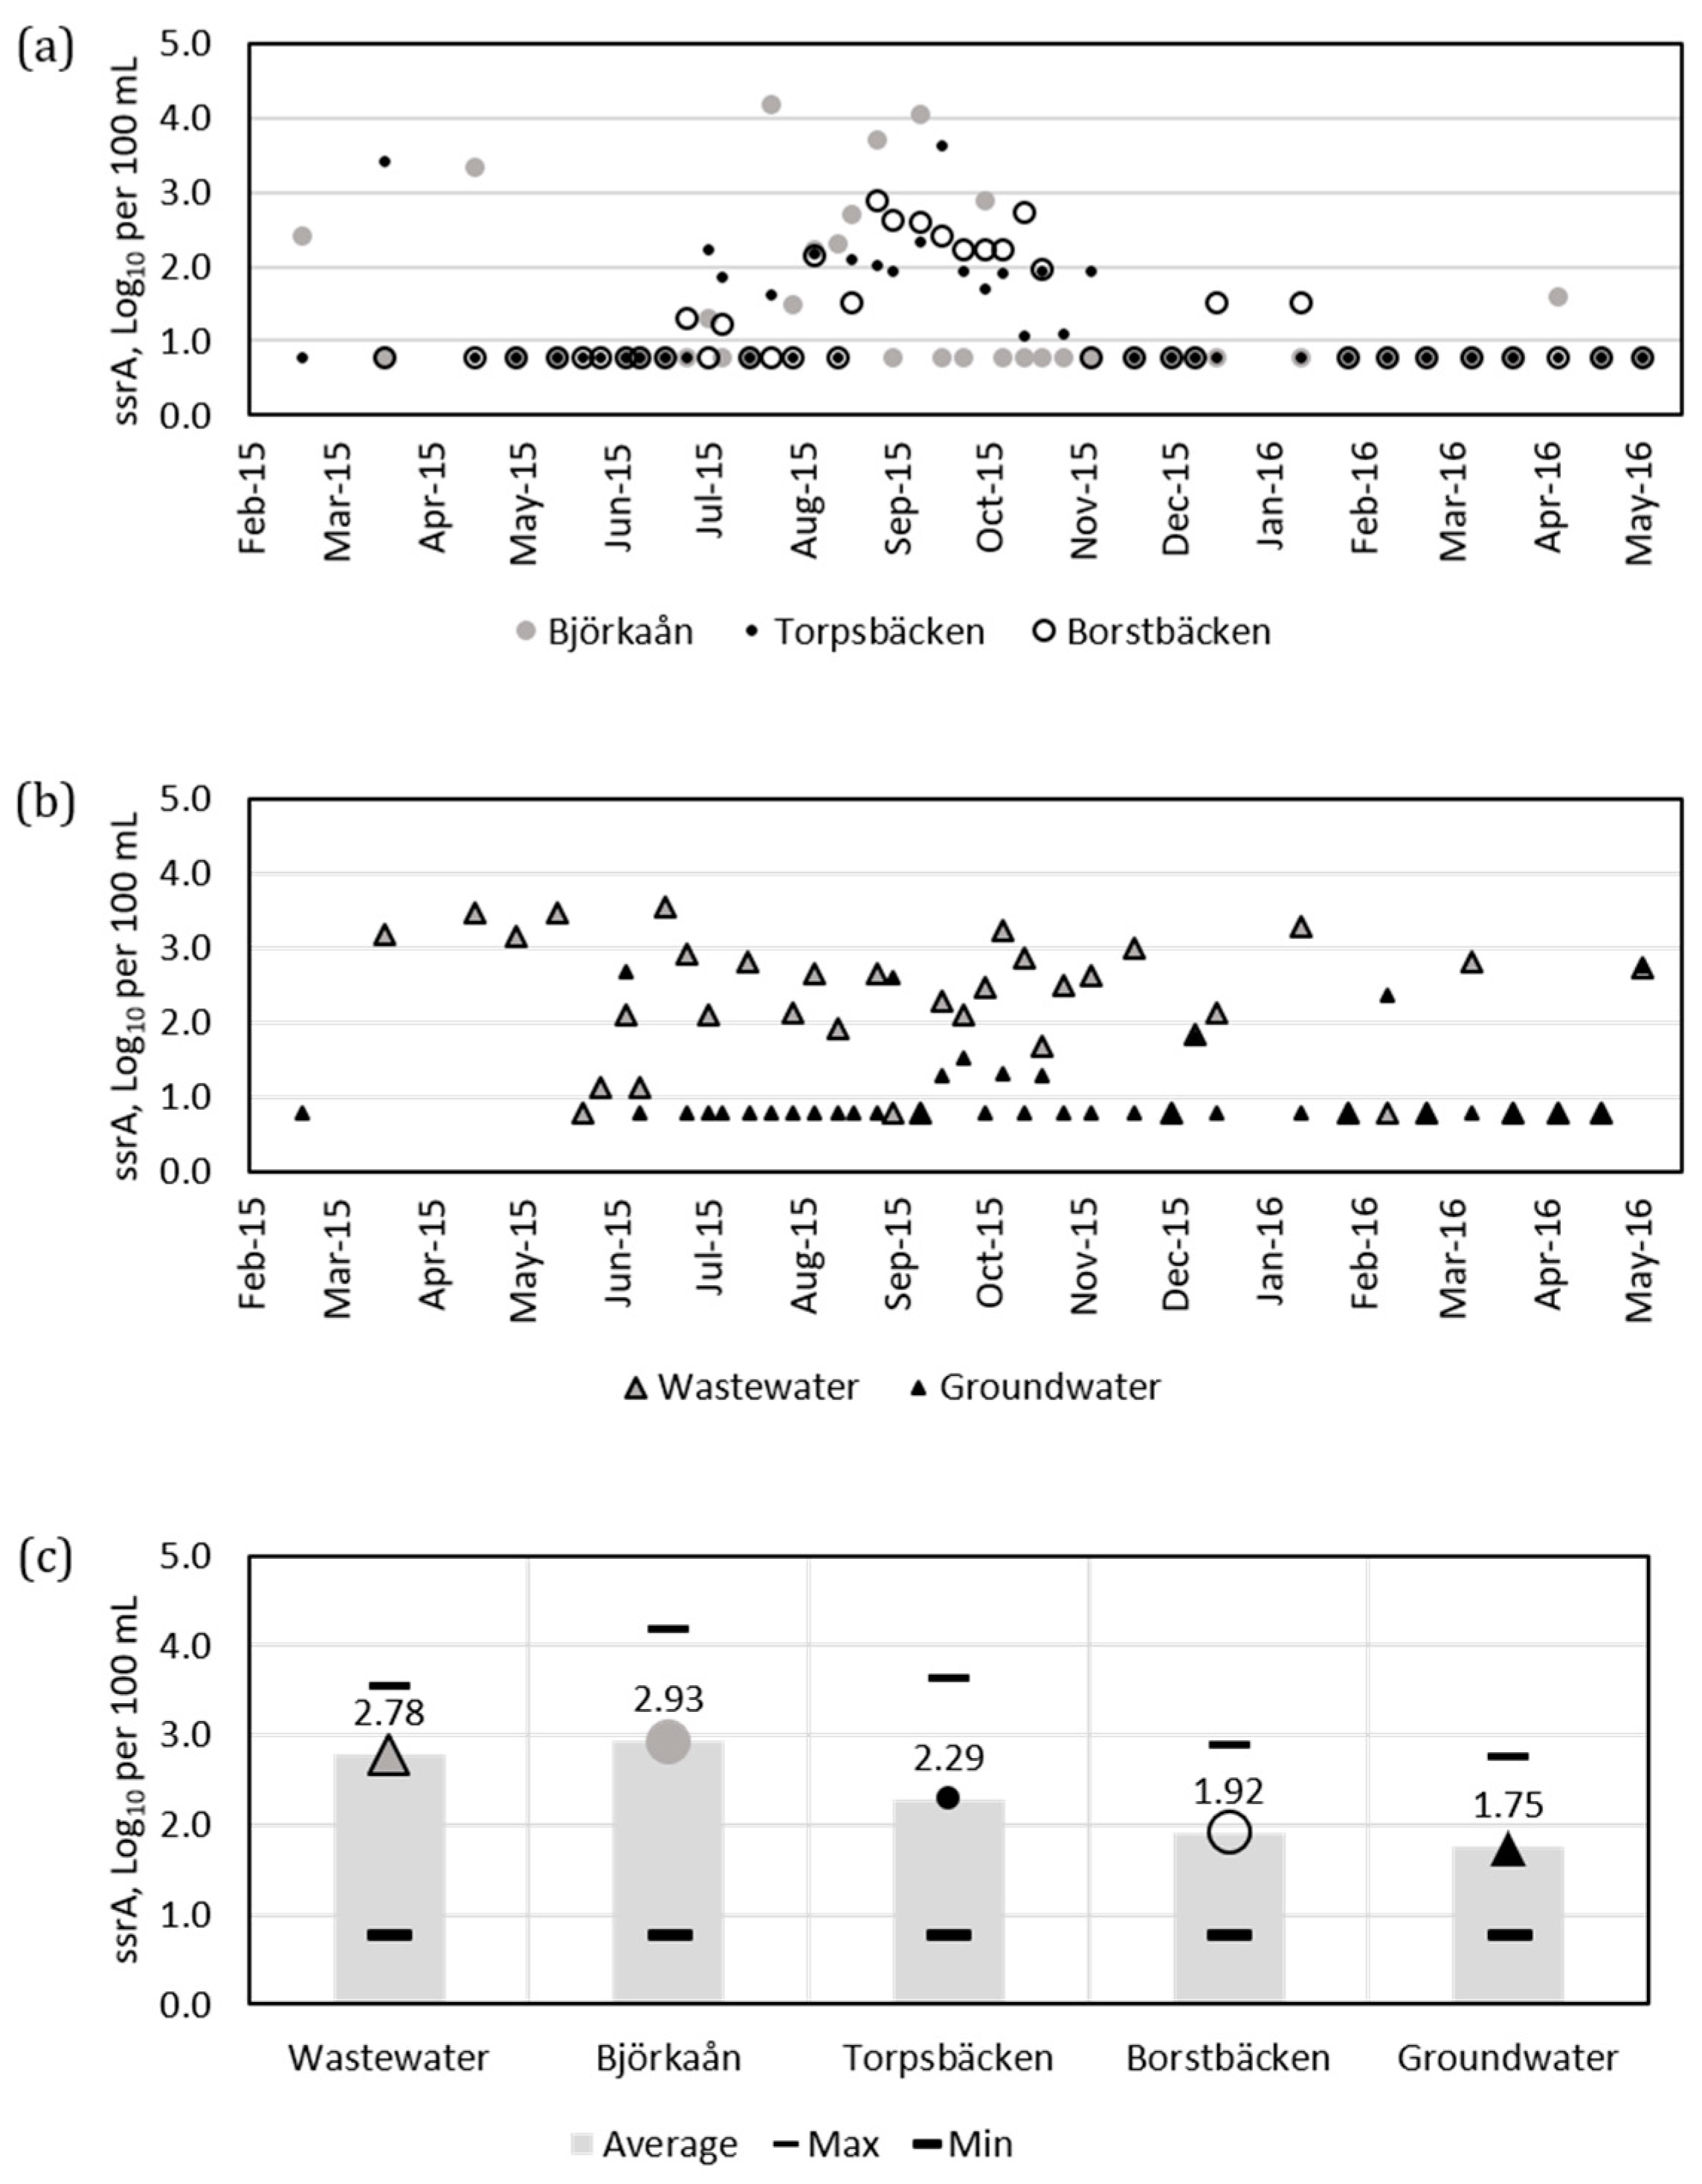
3.1. Detection of ssrA Positive Bacteria by Real-Time PCR

DNA was extracted from each filtrated water sample collected in the catchment of Lake Vomb, and the concentration was measured, the DNA concentrations were generally low and ranged from 0 to 6 ng/μL. The DNA recovery was comparable between the filters with different pore sizes, and no significant difference in recovery was detected. Hence, results from both filters were used as biological replicates, and the mean values from the two filters were reported. Real-time PCR using the ssrA assay was used to enumerate the numbers of putative coliforms (Figure 2).
We observed seasonal patterns, as only few of the samples collected during the cold season contained measurable amounts of ssrA positive bacteria, while we found presence at all sampling locations during the warm period of the year. Additionally, the proportion of ssrA-positive samples was significantly higher in the warm period than in the cold period (paired samples t-test, p < 0.05) (Table 2).
The tributary Björkaån (sampling point 2b), contained the highest concentrations of ssrA positive bacteria, and two peaks were observed: one in mid-April 2015 and one in late July–August 2015 (Figure 2a). For the tributaries Torpsbäcken (sampling point 3) and Borstbäcken (sampling point 4), lower concentrations of ssrA gene copies were detected than in Björkaån, and most positive samples were found during the summer months (Figure 2a). The seasonal variation was less clear for the wastewater and groundwater (Figure 2b, Table 2). At the water intake from the lake (sampling point 1b), high concentrations of ssrA gene copies were found in July (Figure 3a). The probability of detecting ssrA was significantly higher in the warm period than in the cold period for the water intake (sampling point 1b) and the tributary Torpsbäcken (sampling point 3), but not for the other sampling points (according to the logistic regression model, p < 0.05).

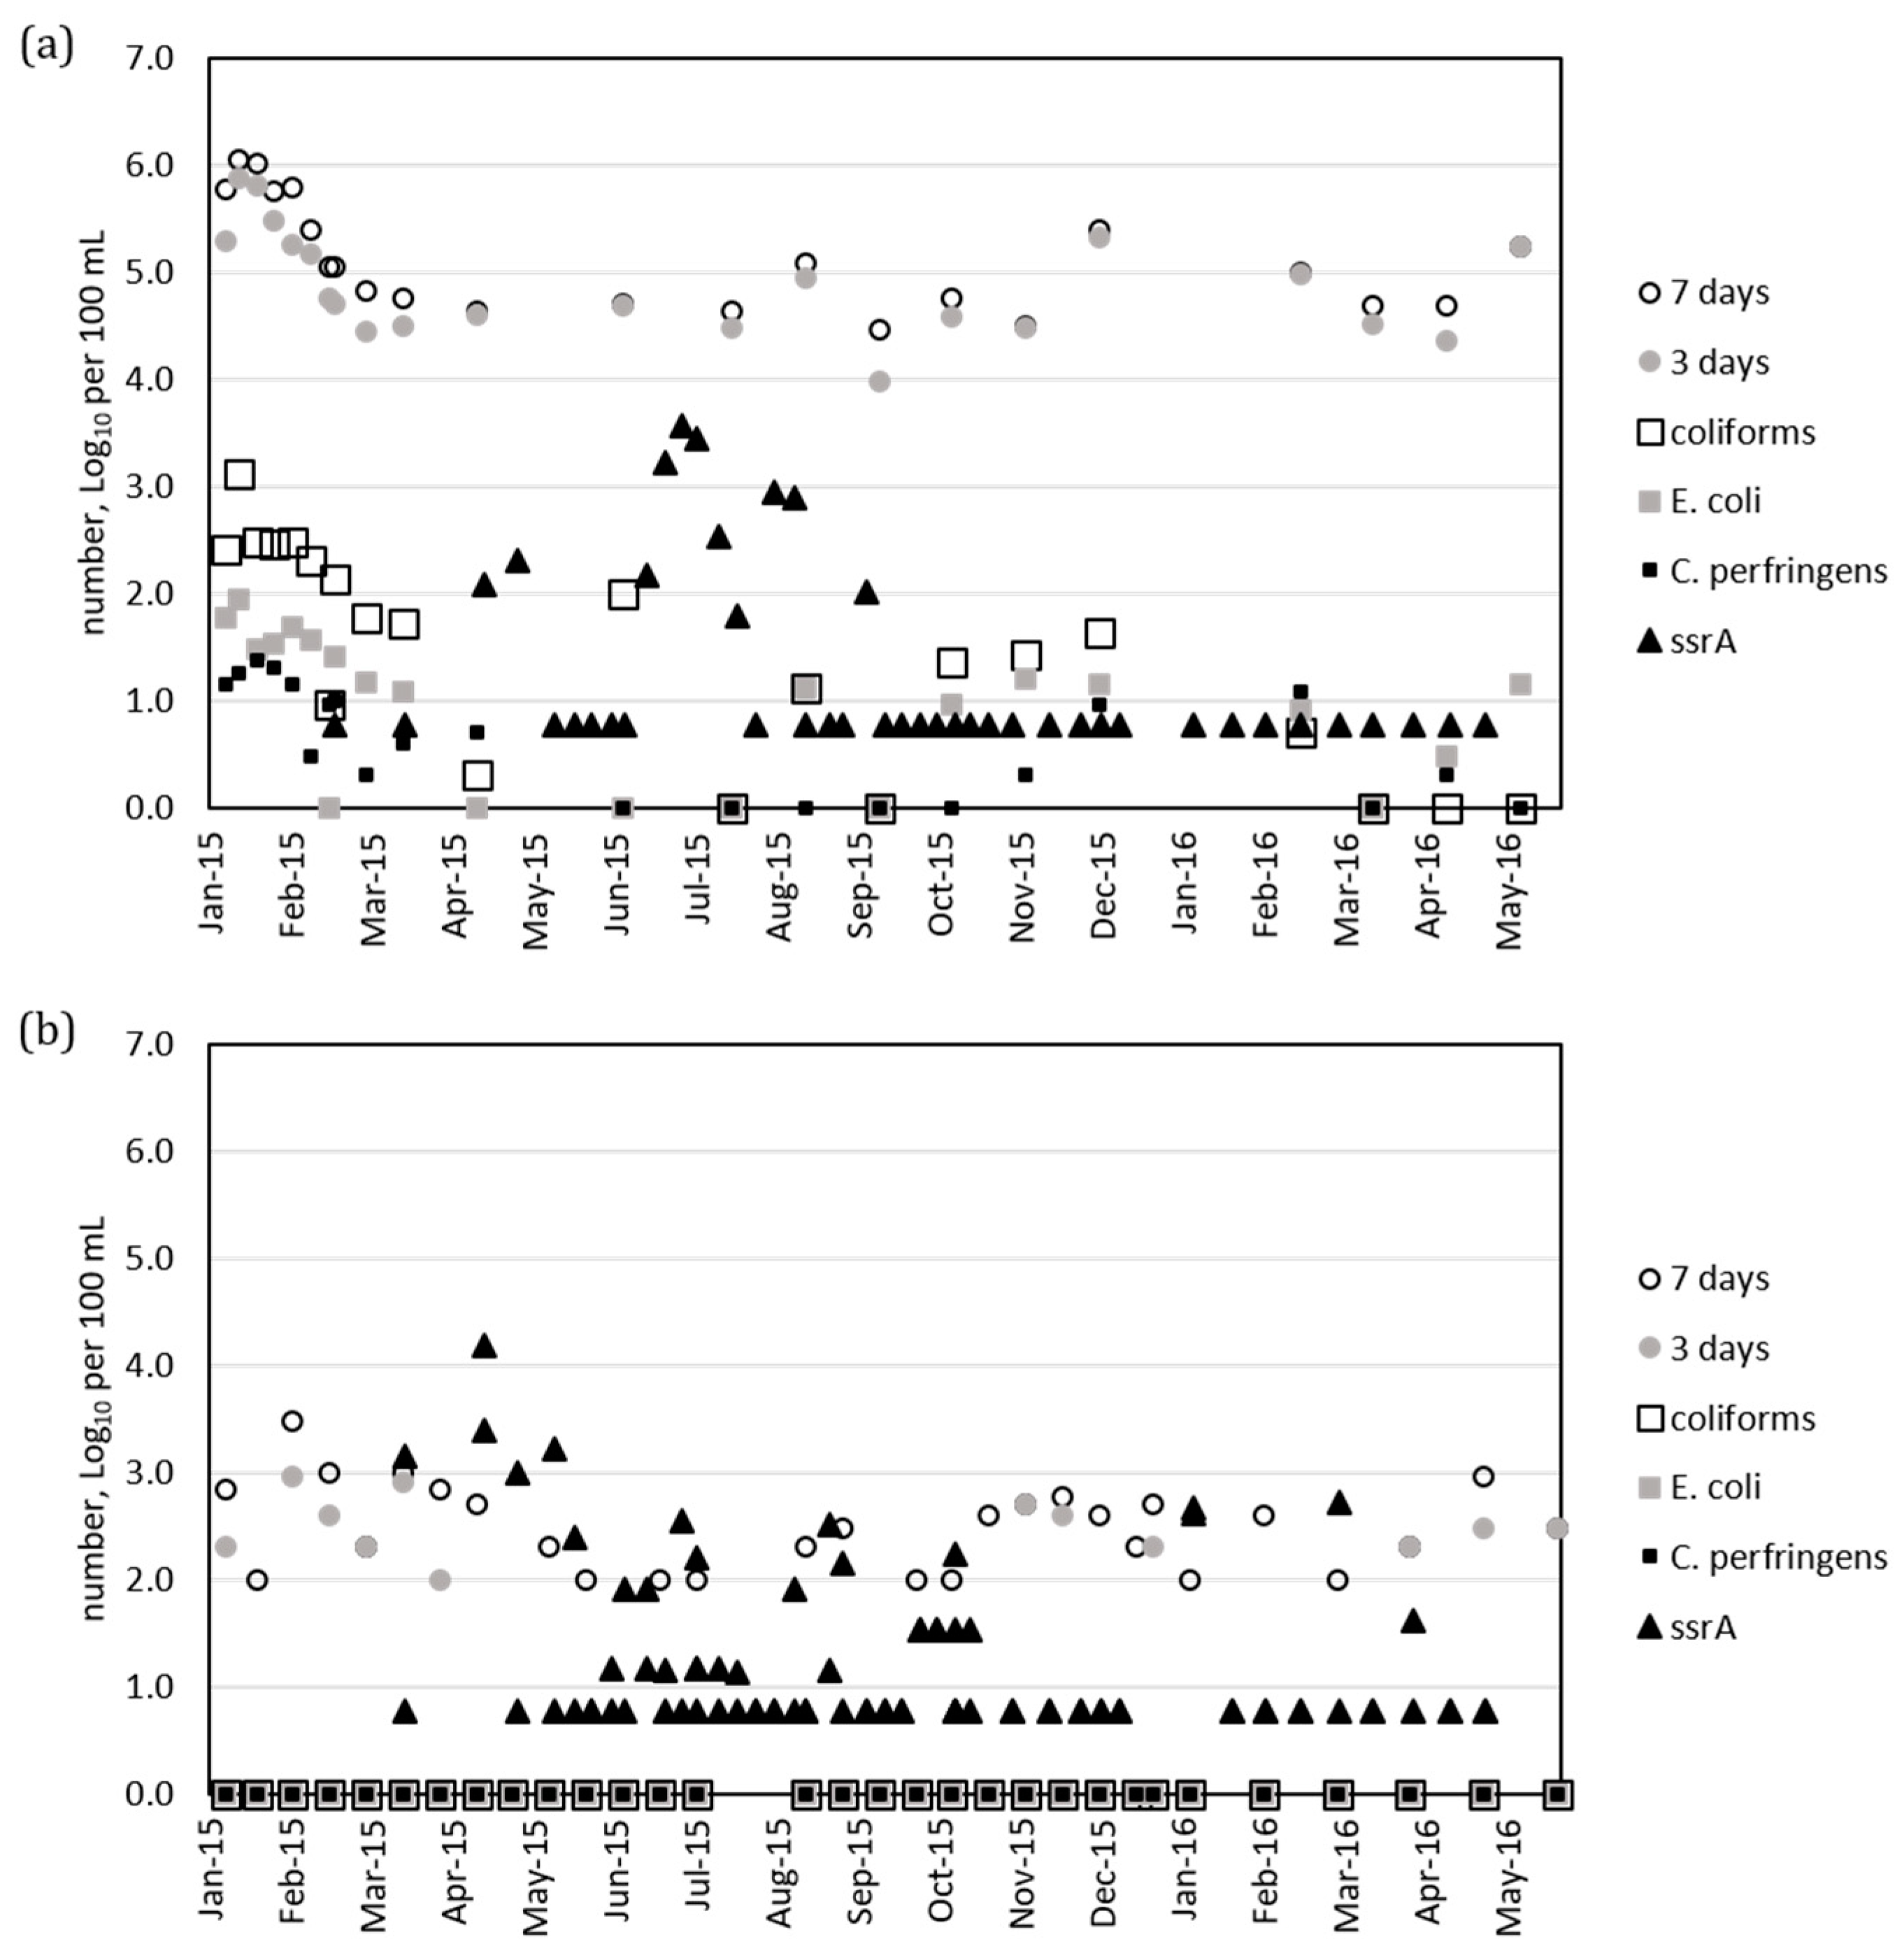
3.2. Comparison of ssrA Data with Routine Culture Assays

Culture data collected over one and a half years, as part of the Vomb drinking water treatment plant routine sampling, indicated that at the water intake (1b) higher concentrations of coliforms were found in the colder months rather than during the summer, while for the infiltrated water (1a) the concentrations were below the detection limit (Figure 3).
The microorganisms cultured for 3 and 7 days had higher counts than the three other cultivation methods (coliforms, E. coli, Clostridium perfringens) both for the water intake (1b) (102–105 per 100 mL higher) and the infiltrated water (1a) (102–103 per 100 mL higher). The ssrA assays did not show the same seasonal variation as the culture methods. For the infiltrated water (Figure 1, point 1b) the ssrA counts (101–104 per 100 mL), when present, were found in a similar range as the 3- and 7-day cultivation methods, but when looking at the raw water intake (Figure 1, point 1a) the 3- and 7-day cultivation methods showed concentrations in a higher range than the ssrA. To further compare the molecular results with routine methods performed at the Vomb drinking water treatment plant, samples were collected on selected dates simultaneously as the samples for real-time PCR method and analyzed according to Swedish standardized methods for detection of E. coli (SS 028167 version 2) and coliforms (SS 028167 version 2). Although some results corroborated each other, the results were not compatible (Supplementary Material Table S1).

3.3. Detection of Pathogens by Real-Time PCR

Samples were analyzed for presence of Salmonella spp., Campylobacter spp., and EHEC O157 by SybrGreen real-time PCR analyses. Salmonella spp. DNA was indicated in boreholes (sampling point 1a) at four occasions (16 April, 15 July, 22 July, and 17 August 2015), in the tributary Björkaån (sampling point 2b) at four occasions (16 April, 29 July, 26 August, and 31 August 2015), and in the on-site sewers (sampling point 2a) at three occasions (30 September, 6 October, and 26 October 2015). Corroborating the findings of invA, we observed that water samples positive for invA were also positive for ssrA, which detects several enterobacteria including Salmonella. This was observed for all dates except 17 August (sampling point 1a) and 29 July (sampling point 2b). All water samples were analyzed for the presence of Campylobacter, but no positive real-time PCR signals were detected. Finally, presence of the pathogenic E. coli subtype EHEC O157 was analyzed in samples that scored as positive for ssrA, which would detect E. coli, by using primers specific for the high-pathogenicity plasmid of EHEC O157. No indications of presence of EHEC O157 in the samples were found.

3.4. Hydrodynamic Modeling of ssrA Concentrations

The modeling results for the ssrA concentrations showed that the maximum simulated total concentrations at the water intake were 4 and 634 ssrA copies/100 mL for the two scenarios (using median and maximum input concentrations, respectively). The tributary Björkaån contributed the most to contamination at the water intake, followed by (in decreasing order) Torpsbäcken, Borstbäcken, and wastewater from on-site sewers (Supplementary Material Figure S4). The order holds for both tested scenarios (using median and maximum input concentrations).

3.5. QMRA Analyses

The daily probability of infection resulting from different Salmonella concentrations at the water intake (sampling point 1b) and in the infiltrated groundwater from boreholes (sampling point 1a) is presented in Figure 4.
In Figure 4 the large distance between the 5th, 50th, and 95th percentiles for raw water intake (sampling point 1b) is caused by high variability in the reduction potential of the artificial infiltration in the Monte Carlo simulations. The QMRA results showed that without UV disinfection, the Salmonella concentration at the water intake and in the infiltrated groundwater from boreholes should not exceed ≈10 per 100 mL and ≈0.001 per 100 mL respectively, in order to meet the daily risk limit looking at the 95th percentiles (Figure 4a); while including UV disinfection, these concentrations become ≈5 × 10⁶ and 500 per 100 mL (Figure 4b).

4. Discussion

The risk for bacterial contamination increases during warm and rainy periods, particularily in tropical areas. Warmer temperatures have been associated with higher numbers of pathogenic bacteria as well as fecal indicator bacteria in water [43,44]. It has been shown that presence of diarrheagenic E. coli is higher in water during the warm-rainy season in areas with diarrheal epidemics [35,45], and although the summer period in Sweden is often warm and dry, incidences [46] of food and water-borne bacterial infections in Sweden increase during summer periods (Supplementary Material Figure S5).
During mid-April, when the water flow decreased and the water temperature was 7–8 °C at the sampling locations, high concentrations of ssrA and Salmonella gene copies were detected. The period might correlate with migrating birds and/or release of grazing herds. Additionally, during low water flow, less dilution contributes to a higher concentration. The findings of high concentrations may also indicate that water flow can affect the ability to sample and detect bacteria using grab sampling. In this study higher concentrations were detected by real-time PCR when water flow was low. The sampling regime must therefore be taken into consideration when evaluating results.
We found amplification of both invA (Salmonella) and ssrA (enterobacteria) at distinct time points in April and July–August in Björkaån, on-site sewers, and surprisingly in the infiltrated groundwater. These findings were not supported by the culture analyses performed during comparable time periods in the infiltrated groundwater, where concentrations of coliforms, E. coli, and Clostridium perfringens were below the detection limit. The primers were chosen amongst other Salmonella specific primers due to their superior performance in real-time PCR. Although presence of Salmonella in the tributary Björkaån could be due to e.g., agricultural runoff [9,47], the finding in infiltrated groundwater was not expected. It is possible that migrating birds or other wild animals residing close to the infiltration ponds and the water extraction wells caused the occurrence of Salmonella spp. in the infiltrated water. Biofils consisting of bacterial communities also residing in sand filters and might be a source of contamination depending on their composition of microorganisms [48]. Other studies have detected Salmonella in treated effluent wastewater [49]. Salmonella in water is linked to warmer temperatures and to wet seasons [50,51,52] confirming our results during the spring and summer. Outbreaks of Salmonella gastroenteritis have been associated with Salmonella water contamination [53]. Salmonella outbreaks caused by contaminated water are however not common in Sweden and the Nordic countries [54].
Campylobacter spp. and EHEC O157 were not detected in any water samples. While Campylobacter is associated with water-borne outbreaks [47] and swimming in lakes [55], the pathogen is usually isolated in low numbers directly from water sources by culture [56,57]. The main normal habitat for Campylobacter is in warm-blooded animals, and similar to Salmonella enterica, it is often found in birds [56]. EHEC O157 is associated to bovine origin and a commensal in cattle. Farm animal manure runoff is hence a likely source in agricultural areas. In the study area, the between-herd prevalence of EHEC O157 (VTEC O157) in cattle can be assumed to be around 10% [58,59]. Cattle and sheep are grazing in areas close to Lake Vomb. The fact that no water samples were positive for EHEC O157, although some herds around Lake Vomb probably were infected, is interesting. The reasons for this could be several; either the bacteria, if present, were efficiently removed upstream the tributary discharges, or the sampling and analysis methods failed to detect them. In comparison, no EHEC O157 (VTEC O157) positive water samples (n = 400) were detected when samples were gathered from surface water in areas in Sweden with known EHEC O157 positive herds [60].
The numbers of ssrA positive bacteria determined by real-time PCR per 100 mL of water in this study were comparable to other studies reporting between 102 and 104 E. coli and/or coliform genomes per 100 mL [12,61,62]. The simulated concentrations of ssrA at the water intake (100–102 per 100 mL) were lower than the observed concentrations (101–103 per 100 mL), potentially due to additional fecal sources (migrating birds, wildlife, etc.) not included in the hydrodynamic modeling. Levantesi et al. [63] compiled an overview of reported Salmonella concentrations in surface water (from various countries, although not from Sweden). Their findings indicated that the occurrence and concentrations are variable and highly dependent on the contamination sources present in the catchment area. Salmonella concentrations ranged from <1 to 106 per 100 mL [63].
In this study, a small number of samples were analyzed using traditional culture methods for enumeration of fecal indicator coliforms and E. coli, to compare with the real-time PCR method (Supplementary Material Table S1). We did not see any clear correlation; there were samples, for which the culture method detected coliforms and/or E. coli, while the real-time PCR did not detect ssrA, and vice versa. The culture analysis indicated higher concentrations of coliforms and E. coli in samples collected in colder water. These findings are corroborated by other studies in countries with more temperate climate where higher concentrations of coliforms correlated positively with cold water and high rainfall [7] and cold water and high conductivity [64]. Bacteria measured by culture methods (coliforms, E. coli and C. perfringens) (Figure 3) were efficiently reduced by the artificial infiltration, while ssrA DNA copies from real-time PCR analysis were detected in similar concentrations both before and after the artificial infiltration, indicating that the ssrA DNA were transported through the infiltration or that there were additional sources impacting the infiltrated water. Studies comparing molecular methods with culture methods have reported underestimation by real-time PCR [65], overestimation by real-time PCR [66], or comparable results [12]. Differences in primers, generation of standard curves, DNA extraction, as well as presence of inhibitors could all influence the outcome. Inhibitors, e.g., humic acid, might be present in fresh waters and can be transmitted in the DNA extraction and result in false negative results [67]. To avoid this, serial dilution of the sample is often used and analyzed together with the undiluted sample. On the other hand, the higher sensitivity of real-time PCR and the possible inclusion of both dead and alive cells might overestimate the number of viable bacteria. Additionally, the persistence of bacteria and of DNA copies may differ in the water environment [68,69].
The ssrA assay in this study detects the genera Escherichia, Klebsiella, Citrobacter, and Enterobacter that constitute the defined group of coliforms. However, the molecular methods will detect genetically closely related genera such as Salmonella, Shigella, and Serratia and perhaps other species, in addition to the traditional coliforms. In addition, the ssrA primers might be able to amplify DNA from bacteria not able to grow on plates. There is also a possibility that agar plating allows growth of unrecognized water-resident bacteria, especially in the 3- and 7-day cultures. Molecular techniques to identify species on agar plates might resolve the results found in this study. It may not be possible to directly compare cultivated coliforms or E. coli colony forming units to the DNA copies found in the real-time PCR analysis. The results indicate that additional studies using direct comparison between culture and real-time PCR are needed.
Real-time PCR analyses were able to detect ssrA and Salmonella DNA copies in the water samples. However, it should be noted that the observed concentrations of bacterial gene copies detected by real-time PCR were very low and at the border of detection for the method. Real-time PCR analyses were thus repeated several times and also performed with diluted samples to avoid inhibition of the PCR reactions by contaminants. Corrected calculations for the dilution factors during extraction of DNA from the water samples also magnified the detected concentrations in positive samples. Regardless, we were surprised to find indications of Salmonella in the infiltrated groundwater (sampling point 1a).
Since invA was detected in infiltrated groundwater with only rapid sand filtration remaining as a barrier, it is important to investigate what concentrations of Salmonella might pose a risk to the drinking water consumers. Viability assays of Salmonella in water should also be performed since we cannot conclude that the invA gene copies represent live and infectious bacteria. In order to use the acceptable concentrations presented, the decision makers need to agree on the suggested acceptable risk level (2.7 × 10⁻⁷ infections per person per day) [39], when evaluating the QMRA results. However, this level may not be applicable to all drinking water systems, and it is up to each organization to decide their own acceptable risk level. Regardless of the decided acceptable risk level, the presented figures can be used to read a rough estimate of the concentration, in either water intake (sampling point 1b) or the infiltrated ground water boreholes (sampling point 1a), that cannot be exceeded in order to keep the risk level below the decided acceptable risk level. Adding a UV-disinfection step in the drinking water treatment plant, providing additional 5.6 Log10 reduction of Salmonella, would allow for higher Salmonella concentrations both in the water intake (sampling point 1b) and in the infiltrated groundwater from the boreholes (sampling point 1a). In this regard, it should be noted that the combination of UV-disinfection and artificially infiltrated groundwater would achieve a multi-barrier approach, as recommended by WHO [15].

5. Conclusions

  • Molecular methods indicated presence of enterobacteria detected by the ssrA primers and of Salmonella detected by invA primers in the water samples at distinct times. The samples collected during the colder period often had concentrations of ssrA below the detection limit, while samples collected in April, July, August, and September 2015 were more often positive.
  • The ssrA primers detect genes of the genera Escherichia, Klebsiella, Citrobacter, and Enterobacter that constitute the defined group of coliforms. However, the molecular methods will also detect genetically closely related genera as well as potentially amplify DNA from bacteria not able to grow on plates. The direct comparison between coliforms or E. coli measured using culture methods and the ssrA DNA copies measured using real-time PCR analysis is not straightforward and further investigations are needed.
  • Hydrodynamic modeling showed that ssrA contribution from tributaries to the concentrations at the water intake was the highest for Björkaån followed by Torpsbäcken, Borstbäcken, and wastewater from on-site sewers.
  • Given the current processes in the drinking water treatment plant, the quantitative microbial risk assessment showed that an acceptable risk level can be achieved if <10 Salmonella per 100 mL is observed in the water intake from the lake. If UV-disinfection is installed, an acceptable risk level is achieved if <5 × 10⁶ Salmonella per 100 mL is observed.

Supplementary Materials

The following are available online at https://www.mdpi.com/2073-4441/12/1/3/s1, Figure S1: Standard curves of 10-fold serial dilutions of PCR products, Figure S2: Water flow in the tributaries to Lake Vombsjön, Figure S3: Measured and simulated water level in Lake Vombsjön during the year 2015, Figure S4: Simulated concentrations of ssrA (number per 100 ml) at the water intake in Lake Vomb, Figure S5: Reprted weekly incidence in Skåne county, Table S1: Simultaneous water sampling to compare culture methods and realtime PCR methods.

Author Contributions

Conceptualization, V.B., K.S., L.R., T.J.R.P., E.S. and Å.S.; Formal analysis, O.D.C., J.G.-O. and Å.S.; Funding acquisition, L.R. and Å.S.; Investigation, V.B., L.R., T.J.R.P. and E.S.; Methodology, O.D.C., V.B., J.G.-O., E.S. and Å.S.; Software, V.B. and E.S.; Supervision, E.S. and Å.S.; Visualization, E.S. and Å.S.; Writing—original draft, V.B., E.S. and Å.S.; Writing—review and editing, O.D.C., J.G.-O., K.S., L.R. and T.J.R.P. All authors have read and agreed to the published version of the manuscript.

Funding

Financing from the Swedish Water and Wastewater Association (project 13-102, Risk-Based Decision Support for Safe Drinking Water), the Hans Dahlgren foundation, and the Swedish Civil Contingencies Agency is highly appreciated. The research was also conducted within the framework programme for drinking water research, DRICKS, at the Chalmers University of Technology.

Acknowledgments

Discussions and information provided by Britt-Marie Pott at the Southern Sweden Water Supply are most appreciated.

Conflicts of Interest

The authors declare no conflict of interest.

References

  1. Haile, R.W.; Witte, J.S.; Gold, M.; Cressey, R.; McGee, C.; Millikan, R.C.; Glasser, A.; Harawa, N.; Ervin, C.; Harmon, P.; et al. The health effects of swimming in ocean water contaminated by storm drain runoff. Epidemiology 1999, 10, 355–363. [Google Scholar] [CrossRef] [PubMed]
  2. WHO. The Global Burden of Disease: 2004 Update; World Health Organization, Ed.; World Health Organization: Geneva, Switzerland, 2008. [Google Scholar]
  3. Ashbolt, N.J. Microbial contamination of drinking water and disease outcomes in developing regions. Toxicology 2004, 198, 229–238. [Google Scholar] [CrossRef] [PubMed]
  4. Rebaudet, S.; Sudre, B.; Faucher, B.; Piarroux, R. Environmental determinants of cholera outbreaks in inland Africa: A systematic review of main transmission foci and propagation routes. J. Infect. Dis. 2013, 208 (Suppl. 1), S46–S54. [Google Scholar] [CrossRef] [Green Version]
  5. Dettori, M.; Piana, A.; Castiglia, P.; Loria, E.; Azara, A. Qualitative and quantitative aspects of drinking water supply in Sardinia, Italy. A descriptive analysis of the ordinances and public notices issued during the years 2010–2015. Annali di Igiene Medicina Preventiva e di Comunità 2016, 28, 296–303. [Google Scholar] [PubMed]
  6. Kauppinen, A.; Pitkänen, T.; Al-Hello, H.; Maunula, L.; Hokajärvi, A.M.; Rimhanen-Fine, R.; Miettinen, I.T. Two drinking water outbreaks caused by wastewater intrusion including Sapovirus in Finland. Int. J. Environ. Res. Public Health 2019, 16, 4376. [Google Scholar] [CrossRef] [PubMed] [Green Version]
  7. Åstrom, J.; Pettersson, T.J.; Stenstrom, T.A. Identification and management of microbial contaminations in a surface drinking water source. J. Water Health 2007, 5 (Suppl. 1), 67–79. [Google Scholar] [CrossRef] [Green Version]
  8. McLellan, S.L.; Salmore, A.K. Evidence for localized bacterial loading as the cause of chronic beach closings in a freshwater marina. Water Res. 2003, 37, 2700–2708. [Google Scholar] [CrossRef]
  9. Olds, H.T.; Corsi, S.R.; Dila, D.K.; Halmo, K.M.; Bootsma, M.J.; McLellan, S.L. High levels of sewage contamination released from urban areas after storm events: A quantitative survey with sewage specific bacterial indicators. PLOS Med. 2018, 15, e1002614. [Google Scholar] [CrossRef] [Green Version]
  10. Allen, M.J.; Edberg, S.C.; Reasoner, D.J. Heterotrophic plate count bacteria—What is their significance in drinking water? Int. J. Food Microbiol. 2004, 92, 265–274. [Google Scholar] [CrossRef] [Green Version]
  11. Girones, R.; Ferrus, M.A.; Alonso, J.L.; Rodriguez-Manzano, J.; Calgua, B.; Correa Ade, A.; Hundesa, A.; Carratala, A.; Bofill-Mas, S. Molecular detection of pathogens in water—The pros and cons of molecular techniques. Water Res. 2010, 44, 4325–4339. [Google Scholar] [CrossRef]
  12. Fang, T.; Cui, Q.; Huang, Y.; Dong, P.; Wang, H.; Liu, W.T.; Ye, Q. Distribution comparison and risk assessment of free-floating and particle-attached bacterial pathogens in urban recreational water: Implications for water quality management. Sci. Total Environ. 2018, 613–614, 428–438. [Google Scholar] [CrossRef] [PubMed]
  13. Aw, T.G.; Rose, J.B. Detection of pathogens in water: From phylochips to qPCR to pyrosequencing. Curr. Opin. Biotechnol. 2012, 23, 422–430. [Google Scholar] [CrossRef]
  14. Botes, M.; de Kwaadsteniet, M.; Cloete, T.E. Application of quantitative PCR for the detection of microorganisms in water. Anal. Bioanal. Chem. 2013, 405, 91–108. [Google Scholar] [CrossRef] [PubMed]
  15. WHO. Guidelines for Drinking-Water Quality, 4th Edition, Incorporating the 1st Addendum, 2017 ed.; World Health Organization, Ed.; World Health Organization: Geneva, Switzerland, 2017; p. 631. [Google Scholar]
  16. Abrahamsson, J.L.; Ansker, J.; Heinicke, G. MRA—A Model for Swedish Water Works; 2009-05; Swedish Water and Wastewater Association: Stockholm, Sweden, 2009. [Google Scholar]
  17. Åström, J.; Lindhe, A.; Bergvall, M.; Rosén, L.; Lång, L.-O. Microbial Risk Assessment of Groundwater Sources—Development and Implementation of a QMRA Tool; 2016-19; Swedish Water and Wastewater Association: Stockholm, Sweden, 2016; p. 86. [Google Scholar]
  18. Benham, B.; Baffaut, C.; Zeckoski, R.; Mankin, K.; Pachepsky, Y.; Sadeghi, A.; Brannan, K.; Soupir, M.; Habersack, M. Modeling bacteria fate and transport in watersheds to support TMDLs. Trans. ASAE 2006, 49, 987–1002. [Google Scholar] [CrossRef] [Green Version]
  19. Coffey, R.; Cummins, E.; O’ Flaherty, V.; Cormican, M. Pathogen Sources Estimation and Scenario Analysis Using the Soil and Water Assessment Tool (SWAT). Hum. Ecol. Risk Assess. Int. J. 2010, 16, 913–933. [Google Scholar] [CrossRef]
  20. Schijven, J.; Derx, J.; de Roda Husman, A.M.; Blaschke, A.P.; Farnleitner, A.H. QMRAcatch: Microbial Quality Simulation of Water Resources including Infection Risk Assessment. J. Environ. Qual. 2015, 44, 1491–1502. [Google Scholar] [CrossRef] [PubMed] [Green Version]
  21. Bergion, V.; Sokolova, E.; Åström, J.; Lindhe, A.; Sörén, K.; Rosén, L. Hydrological modelling in a drinking water catchment area as a means of evaluating pathogen risk reduction. J. Hydrol. 2017, 544, 74–85. [Google Scholar] [CrossRef] [Green Version]
  22. Sokolova, E.; Lindström, G.; Pers, C.; Strömqvist, J.; Lewerin, S.S.; Wahlström, H.; Sörén, K. Water quality modelling: Microbial risks associated with manure on pasture and arable land. J. Water Health 2018, 16, 549–561. [Google Scholar] [CrossRef]
  23. Sokolova, E.; Petterson, S.R.; Dienus, O.; Nyström, F.; Lindgren, P.-E.; Pettersson, T.J.R. Microbial risk assessment of drinking water based on hydrodynamic modelling of pathogen concentrations in source water. Sci. Total Environ. 2015, 526, 177–186. [Google Scholar] [CrossRef] [Green Version]
  24. Åström, J.; Johansson, V. GIS-Based Dispersion Modelling of Parasites in Surface Water Sources; 2015-07; Swedish Water and Wastewater Association: Stockholm, Sweden, 2015; p. 66. [Google Scholar]
  25. Sokolova, E.; Åström, J.; Pettersson, T.J.R.; Bergstedt, O.; Hermansson, M. Estimation of pathogen concentrations in a drinking water source using hydrodynamic modelling and microbial source tracking. J. Water Health 2012, 10, 358–370. [Google Scholar] [CrossRef] [Green Version]
  26. Bergion, V.; Lindhe, A.; Sokolova, E.; Rosén, L. Risk-based cost-benefit analysis for evaluating microbial risk mitigation in a drinking water system. Water Res. 2018, 132, 111–123. [Google Scholar] [CrossRef] [PubMed] [Green Version]
  27. Baath, E.; Kritzberg, E. pH tolerance in freshwater bacterioplankton: Trait variation of the community as measured by leucine incorporation. Appl. Environ. Microbiol. 2015, 81, 7411–7419. [Google Scholar] [CrossRef] [PubMed] [Green Version]
  28. Sundahl, A.-C.; Wennberg, C.; Tilly, L.; Wettemark, F.; Magnusson, P.; Schuster, J. Vombsjön—A Water Framework Directive project. In Swedish: Vombsjön–ett Ramdirektivprojekt; VATTEN: Lund, Sweden, 2008; pp. 129–136. [Google Scholar]
  29. Koressaar, T.; Remm, M. Enhancements and modifications of primer design program Primer3. Bioinformatics 2007, 23, 1289–1291. [Google Scholar] [CrossRef] [PubMed] [Green Version]
  30. Hoorfar, J.; Ahrens, P.; Radstrom, P. Automated 5′ nuclease PCR assay for identification of Salmonella enterica. J. Clin. Microbiol. 2000, 38, 3429–3435. [Google Scholar]
  31. Sjöling, Å.; Sadeghipoorjahromi, L.; Novak, D.; Tobias, J. Detection of major diarrheagenic bacterial pathogens by multiplex PCR panels. Microbiol. Res. 2015, 172, 34–40. [Google Scholar] [CrossRef]
  32. Luedtke, B.E.; Bono, J.L.; Bosilevac, J.M. Evaluation of real time PCR assays for the detection and enumeration of enterohemorrhagic Escherichia coli directly from cattle feces. J. Microbiol. Methods 2014, 105, 72–79. [Google Scholar] [CrossRef] [Green Version]
  33. Rangel, J.M.; Sparling, P.H.; Crowe, C.; Griffin, P.M.; Swerdlow, D.L. Epidemiology of Escherichia coli O157:H7 outbreaks, United States, 1982–2002. Emerg. Infect. Dis. 2005, 11, 603–609. [Google Scholar] [CrossRef]
  34. Sjöling, Å.; Qadri, F.; Nicklasson, M.; Begum, Y.A.; Wiklund, G.; Svennerholm, A.M. In vivo expression of the heat stable (estA) and heat labile (eltB) toxin genes of enterotoxigenic Escherichia coli (ETEC). Microbes Infect. 2006, 8, 2797–2802. [Google Scholar] [CrossRef] [Green Version]
  35. Lothigius, Å.; Janzon, A.; Begum, Y.; Sjöling, Å.; Qadri, F.; Svennerholm, A.M.; Bolin, I. Enterotoxigenic Escherichia coli is detectable in water samples from an endemic area by real-time PCR. J. Appl. Microbiol. 2008, 104, 1128–1136. [Google Scholar] [CrossRef]
  36. Janzon, A.; Sjöling, Å.; Lothigius, A.; Ahmed, D.; Qadri, F.; Svennerholm, A.M. Failure to detect Helicobacter pylori DNA in drinking and environmental water in Dhaka, Bangladesh, using highly sensitive real-time PCR assays. Appl. Environ. Microbiol. 2009, 75, 3039–3044. [Google Scholar] [CrossRef] [Green Version]
  37. Begum, Y.A.; Rydberg, H.A.; Thorell, K.; Kwak, Y.K.; Sun, L.; Joffre, E.; Qadri, F.; Sjöling, Å. In Situ Analyses Directly in Diarrheal Stool Reveal Large Variations in Bacterial Load and Active Toxin Expression of Enterotoxigenic Escherichiacoli and Vibrio cholerae. mSphere 2018, 3. [Google Scholar] [CrossRef] [PubMed] [Green Version]
  38. Haas, C.N.; Rose, J.B.; Gerba, C.P. Quantitative Microbial Risk Assessment; Wiley: Hoboken, NJ, USA, 2014; Volume 2. [Google Scholar]
  39. Signor, R.S.; Ashbolt, N.J. Comparing probabilistic microbial risk assessments for drinking water against daily rather than annualised infection probability targets. J. Water Health 2009, 7, 535–543. [Google Scholar] [CrossRef] [PubMed] [Green Version]
  40. Teunis, P.; van der Heijden, O.; van der Giessen, J.; Havelaar, A. The Dose-Response Relation in Human Volunteers for Gastro-Intestinal Pathogens; RIVM: Bilthoven, The Netherlands, 1996. [Google Scholar]
  41. Westrell, T.; Andersson, Y.; Stenström, T.A. Drinking water consumption patterns in Sweden. J. Water Health 2006, 4, 511–522. [Google Scholar] [CrossRef] [PubMed] [Green Version]
  42. Hijnen, W.A.M.; Beerendonk, E.F.; Medema, G.J. Inactivation credit of UV radiation for viruses, bacteria and protozoan (oo)cysts in water: A review. Water Res. 2006, 40, 3–22. [Google Scholar] [CrossRef]
  43. LeChevallier, M.W.; Welch, N.J.; Smith, D.B. Full-scale studies of factors related to coliform regrowth in drinking water. Appl. Environ. Microbiol. 1996, 62, 2201–2211. [Google Scholar]
  44. Francisque, A.; Rodriguez, M.J.; Miranda-Moreno, L.F.; Sadiq, R.; Proulx, F. Modeling of heterotrophic bacteria counts in a water distribution system. Water Res. 2009, 43, 1075–1087. [Google Scholar] [CrossRef]
  45. Ahmed, D.; Islam, M.S.; Begum, Y.A.; Janzon, A.; Qadri, F.; Sjöling, Å. Presence of enterotoxigenic Escherichia coli in biofilms formed in water containers in poor households coincides with epidemic seasons in Dhaka. J. Appl. Microbiol. 2013, 114, 1223–1229. [Google Scholar] [CrossRef]
  46. PHAS. Weekly Salmonella Incidence in Southern Sweden; Bergion, V., Ed.; The Public Health Agency of Sweden: Solna Municipality, Sweden, 2018. [Google Scholar]
  47. Haley, C.E.; Gunn, R.A.; Hughes, J.M.; Lippy, E.C.; Craun, G.F. From the Center for Disease Control. Outbreaks of waterborne diseases in the United States, 1978. J. Infect. Dis. 1980, 141, 794–797. [Google Scholar] [CrossRef]
  48. Chan, S.; Pullerits, K.; Riechelmann, J.; Persson, K.M.; Rådström, P.; Paul, C.J. Monitoring biofilm function in new and matured full-scale slow sand filters using flow cytometric histogram image comparison (CHIC). Water Res. 2018, 138, 27–36. [Google Scholar] [CrossRef]
  49. Odjadjare, E.C.; Olaniran, A.O. Prevalence of Antimicrobial Resistant and Virulent Salmonella spp. in Treated Effluent and Receiving Aquatic Milieu of Wastewater Treatment Plants in Durban, South Africa. Int. J. Environ. Res. Public Health 2015, 12, 9692–9713. [Google Scholar] [CrossRef] [Green Version]
  50. Haley, B.J.; Cole, D.J.; Lipp, E.K. Distribution, diversity, and seasonality of waterborne salmonellae in a rural watershed. Appl. Environ. Microbiol. 2009, 75, 1248–1255. [Google Scholar] [CrossRef] [PubMed] [Green Version]
  51. Liang, Z.; He, Z.; Zhou, X.; Powell, C.A.; Yang, Y.; He, L.M.; Stoffella, P.J. Impact of mixed land-use practices on the microbial water quality in a subtropical coastal watershed. Sci. Total Environ. 2013, 449, 426–433. [Google Scholar] [CrossRef] [PubMed]
  52. Kostyla, C.; Bain, R.; Cronk, R.; Bartram, J. Seasonal variation of fecal contamination in drinking water sources in developing countries: A systematic review. Sci. Total Environ. 2015, 514, 333–343. [Google Scholar] [CrossRef] [PubMed]
  53. Angulo, F.J.; Tippen, S.; Sharp, D.J.; Payne, B.J.; Collier, C.; Hill, J.E.; Barrett, T.J.; Clark, R.M.; Geldreich, E.E.; Donnell, H.D., Jr.; et al. A community waterborne outbreak of salmonellosis and the effectiveness of a boil water order. Am. J. Public Health 1997, 87, 580–584. [Google Scholar] [CrossRef] [PubMed] [Green Version]
  54. Guzman-Herrador, B.; Carlander, A.; Ethelberg, S.; de Blasio, B.F.; Kuusi, M.; Lund, V.; Löfdahl, M.; MacDonald, E.; Nichols, G.; Schönning, C. Waterborne outbreaks in the Nordic countries, 1998 to 2012. Eurosurveillance 2015, 20, 1–10. [Google Scholar] [CrossRef] [Green Version]
  55. Schönberg-Norio, D.; Takkinen, J.; Hänninen, M.-L.; Katila, M.-L.; Kaukoranta, S.-S.; Mattila, L.; Rautelin, H. Swimming and Campylobacter infections. Emerg. Infect. Dis. 2004, 10, 1474–1477. [Google Scholar] [CrossRef]
  56. Bopp, D.J.; Sauders, B.D.; Waring, A.L.; Ackelsberg, J.; Dumas, N.; Braun-Howland, E.; Dziewulski, D.; Wallace, B.J.; Kelly, M.; Halse, T.; et al. Detection, isolation, and molecular subtyping of Escherichia coli O157:H7 and Campylobacter jejuni associated with a large waterborne outbreak. J. Clin. Microbiol. 2003, 41, 174–180. [Google Scholar] [CrossRef] [Green Version]
  57. Pitkanen, T. Review of Campylobacter spp. in drinking and environmental waters. J. Microbiol. Methods 2013, 95, 39–47. [Google Scholar] [CrossRef]
  58. Widgren, S.; Soderlund, R.; Eriksson, E.; Fasth, C.; Aspan, A.; Emanuelson, U.; Alenius, S.; Lindberg, A. Longitudinal observational study over 38 months of verotoxigenic Escherichia coli O157:H7 status in 126 cattle herds. Prev. Vet. Med. 2015, 121, 343–352. [Google Scholar] [CrossRef]
  59. Widgren, S.; Engblom, S.; Emanuelson, U.; Lindberg, A. Spatio-temporal modelling of verotoxigenic Escherichia coli O157 in cattle in Sweden: Exploring options for control. Vet. Res. 2018, 49, 78. [Google Scholar] [CrossRef] [Green Version]
  60. SNBHW. Infection with EHEC/VTEC—A Document for National Strategy; Swedish National Board of Health and Welfare: Stockholm, Sweden, 2014. [Google Scholar]
  61. Schang, C.; Henry, R.; Kolotelo, P.A.; Prosser, T.; Crosbie, N.; Grant, T.; Cottam, D.; O’Brien, P.; Coutts, S.; Deletic, A.; et al. Evaluation of Techniques for Measuring Microbial Hazards in Bathing Waters: A Comparative Study. PLoS ONE 2016, 11, e0155848. [Google Scholar] [CrossRef] [PubMed]
  62. Vital, P.G.; Van Ha, N.T.; Tuyet, L.T.; Widmer, K.W. Application of quantitative real-time PCR compared to filtration methods for the enumeration of Escherichia coli in surface waters within Vietnam. J. Water Health 2017, 15, 155–162. [Google Scholar] [CrossRef] [PubMed]
  63. Levantesi, C.; Bonadonna, L.; Briancesco, R.; Grohmann, E.; Toze, S.; Tandoi, V. Salmonella in surface and drinking water: Occurrence and water-mediated transmission. Food Res. Int. 2012, 45, 587–602. [Google Scholar] [CrossRef]
  64. Guzman-Otazo, J.; Gonzales-Siles, L.; Poma, V.; Bengtsson-Palme, J.; Thorell, K.; Flach, C.-F.; Iñiguez, V.; Sjöling, Å. Diarrheal bacterial pathogens and multi-resistant enterobacteria in the Choqueyapu River in La Paz, Bolivia. PLoS ONE 2019, 14, e0210735. [Google Scholar] [CrossRef]
  65. Noble, R.T.; Blackwood, A.D.; Griffith, J.F.; McGee, C.D.; Weisberg, S.B. Comparison of rapid quantitative PCR-based and conventional culture-based methods for enumeration of Enterococcus spp. and Escherichia coli in recreational waters. Appl. Environ. Microbiol. 2010, 76, 7437–7443. [Google Scholar] [CrossRef] [Green Version]
  66. Haugland, R.A.; Siefring, S.C.; Wymer, L.J.; Brenner, K.P.; Dufour, A.P. Comparison of Enterococcus measurements in freshwater at two recreational beaches by quantitative polymerase chain reaction and membrane filter culture analysis. Water Res. 2005, 39, 559–568. [Google Scholar] [CrossRef]
  67. Sidstedt, M.; Jansson, L.; Nilsson, E.; Noppa, L.; Forsman, M.; Radstrom, P.; Hedman, J. Humic substances cause fluorescence inhibition in real-time polymerase chain reaction. Anal. Biochem. 2015, 487, 30–37. [Google Scholar] [CrossRef] [Green Version]
  68. Sokolova, E.; Åström, J.; Pettersson, T.J.R.; Bergstedt, O.; Hermansson, M. Decay of Bacteroidales Genetic Markers in Relation to Traditional Fecal Indicators for Water Quality Modeling of Drinking Water Sources. Environ. Sci. Technol. 2012, 46, 892–900. [Google Scholar] [CrossRef] [Green Version]
  69. Lothigius, Å.; Sjöling, Å.; Svennerholm, A.M.; Bolin, I. Survival and gene expression of enterotoxigenic Escherichia coli during long-term incubation in sea water and freshwater. J. Appl. Microbiol. 2010, 108, 1441–1449. [Google Scholar] [CrossRef] [Green Version]
Figure 1. Map of Lake Vombsjön and its catchment area. The colors represent land use types: arable land (yellow), grazing areas (red), urban areas (black), and forest (green). The sampling points are shown with numbers: wastewater from on-site sewers (2a), natural groundwater (6), and tributaries Björkaån (2b), Torpsbäcken (3), and Borstbäcken (4). Infiltrated groundwater from boreholes (sampling point 1a) was collected at the drinking water treatment plant (outside of the map). The position of the water intake in the lake (sampling point 1b) is not shown on the map for security reasons.
Water 12 00003 g001
Figure 2. Measured concentrations of ssrA (Log10 per 100 mL) in the samples from/of (a) the tributaries Björkaån (sampling point 2b), Torpsbäcken (sampling point 3), and Borstbäcken (sampling point 4); (b) wastewater from on-site sewers (sampling point 2a) and natural groundwater (sampling point 6); (c) the maximum, average, and the minimum values for the series in (a,b). See Figure 1 for locations of sampling points. The concentrations below the limit of detection are shown in the figure as 0.78 Log10 per 100 mL (half the detection limit) for visualization purposes and were also used to calculate the averages. Values in (c) report the average, and the symbol attached to each bar corresponds to the symbols in (a,b).
Water 12 00003 g002
Figure 3. Comparison of the concentrations of ssrA measured by real-time PCR (“ssrA”) with the microorganisms measured by culture assays: microorganisms cultivated during 3 days at 22 °C (“3 days”, SS-EN ISO 622 method), microorganisms cultivated during 7 days at 22 °C (”7 days”, SS-EN ISO 6222 method), coliforms (“coliforms”, SS028167 method), E. coli (“E. coli”, SS028167 method), Clostridium perfringens (“C. perfringens”, ISO/CD 6461-2:2002 method). Results are shown for (a) the water intake (sampling point 1b) and (b) boreholes (sampling point 1a). For visualization purposes, the value 1 is shown in the figures when culture assays reported <1 number per 100 mL. In (a) the concentrations were reported <1 number per 100 mL on 2, 3, 5 occasions for coliforms, E. coli. and C. perfringens respectively. In (b) all culture assays for coliforms, E. coli and C. perfringens were <1 number per 100 mL.
Water 12 00003 g003
Figure 4. Salmonella concentrations (number per 100 mL) plotted against the daily probability of infection (probability, between 0 and 1) for the 5th, 50th, and 95th percentiles of the Monte Carlo simulations. Results are shown for the infiltrated groundwater from boreholes (sampling point 1a, black lines) and the raw water intake in Lake Vomb (sampling point 1b, light grey lines), assuming drinking water treatment (a) without UV-disinfection or (b) including UV-disinfection. The vertical line represents the acceptable daily risk level.
Water 12 00003 g004
Table 1. Primers for detection of coliforms, (ssrA), Salmonella spp., (invA), Campylobacter spp., (cadF), and enterohemorrhagic Escherichia coli (EHEC O157, (EHEC)).
GeneForward Primer 3′–5′Reverse Primer 3′–5′SizeTmReference
ssrACGAATCAGGCTAGTCTGGTAGTGGCGTCCGAAATTCCTACATC10281.4This study
invATCGTCATTCCATTACCTACCAAACGTTGAAAAACTGAGGA11978.5Hoorfar, et al. [30]
cadFTCAAGTCTTAAAGCCAAAGAATCAGCAGGTGGAGGATATGAGG11977.1Sjoling, et al. [31]
EHECTATCAGCACCAAAGAGCGGGAACACCCTTATGAAGAGCCAGTACTGAA9978.9Luedtke, et al. [32]
Table 2. Number of positive samples in the warm and cold periods related to the total number samples. a
Target GenessrA (coliforms)
Sampling Points bWarm Period: Positive (tot.)Cold Period: Positive (tot.)
Boreholes 1a 22 (50)10 (38)
Intake 1b13 (50)2 (41)
Wastewater 2a30 (42)24 (40)
Björkaån 2b12 (46)5 (44)
Torpsbäcken 320 (49)5 (38)
Borstbäcken 416 (50)5 (34)
Groundwater 67 (39)4 (38)
a The warm or cold periods were defined as the periods with the average daily air temperature above or below 10 °C respectively; the start of each period was determined as the first day of at least five consecutive days with the average daily air temperature above or below 10 °C. b See Figure 1 for locations.

