Article

Characterization of Carbonate Crust from a Recently Discovered Methane Seep on the North Atlantic Continental Margin of the USA

1
Department of Geosciences, Mississippi State University, Mississippi State, MS 39762, USA
2
Department Earth & Environmental Sciences, University of Rochester, Rochester, NY 14627, USA
3
Rensselaer Polytechnic Institute, Troy, NY 12180, USA
4
Institute of Solid State Physics, RAS, Chernogolovla 142432, Russia
5
Center for Arctic Gas Hydrate, Environment and Climate, The Arctic University of Norway in Tromsø (UiT), 9037 Tromsø, Norway
6
Department of Earth Sciences, Syracuse University, Syracuse, NY 13210, USA
7
Department of Physical and Life Sciences, Chadron State College, Chadron, NE 69337, USA
*
Author to whom correspondence should be addressed.
Minerals 2019, 9(3), 138; https://doi.org/10.3390/min9030138
Submission received: 11 January 2019 / Revised: 18 February 2019 / Accepted: 21 February 2019 / Published: 26 February 2019

Abstract

:
This study is focused on mineralogical and chemical characterization of an authigenic carbonate rock (crust) collected at a recently discovered cold seep on the US North Atlantic continental margin. X-ray diffraction (XRD) and scanning electron microscopy (SEM) indicate that the carbonate rock is composed of microcrystalline aragonite cement, white acicular aragonite crystals (AcAr), equant quartz crystals, small microcrystalline aluminosilicates, and trace amounts of iron sulfide microcrystals. Element/calcium ratios were measured with laser ablation inductively-coupled plasma mass spectrometry (LA-ICP-MS) using a calcite standard, which was prepared by annealing USGS certified carbonate powder (MACS-3). The occurrence of microscopic, non-carbonate inclusions precluded evaluation of trace elements in the aragonite cement, but allowed for in situ analysis of AcAr crystals. Carbon and oxygen isotopes were analyzed via isotope ratio mass spectrometry (IRMS) and expressed as δ13C and δ18O. Low δ13C values suggest that aragonite grew as a result of anaerobic oxidation of methane and observed δ18O values indicate that the temperature of aragonite crystallization was 1.7–1.9 °C.

1. Introduction

Authigenic carbonates, which are a significant ocean carbon sink, occur widely as carbonate crusts near cold methane seeps at the seafloor [1,2]. Anaerobic oxidation of methane (AOM) and sulfate reduction are among the associated microbial metabolic processes that increase local alkalinity and cause precipitation of carbonate minerals. The commonly accepted mechanism of carbonate precipitation by AOM is expressed as [3,4]:
CH4 + SO42− → HCO3 + HS + H2O
HCO3 + Ca2+ → CaCO3solid + H+
This mechanism, in which HCO3 is released, increases alkalinity and promotes carbonate crystallization within seafloor sediment pore space as well as the production of authigenic carbonate rock. McVeigh et al. [5] reported that AOM was directly observed within overlying authigenic carbonate rocks collected at the seep site studied in this work.
Methane fluxes through sediments into seawater affect local, and potentially global, environmental biogeochemistry. Therefore, the reconstruction of methane seepage in the past through analysis of seep associated authigenic carbonate rock could lead to an improved understanding of the evolution of ocean and atmospheric carbon cycles, as well as past climate change events. However, mineralogical and geochemical characterizations of authigenic carbonate crust are needed for the development of a reliable and useful proxy for past methane flux. Previous geochemical studies conducted on carbonate crust collected worldwide include the Mediterranean region [6,7,8], Arabian sea [9], Gulf of Guinea [10], South China Sea [11], Hydrate Ridge (Cascadia accretionary complex), offshore Costa Rica, the Eel River Basin, and the Norwegian Sea [12]. However, little is known about samples from the northern US Atlantic continental margin, where widespread methane seepage with associated carbonate crusts have recently been reported [13]. Mineralogical and stable isotope analysis of carbonate samples collected at the Norfolk and Baltimore Canyon seep sites indicate that microbial degradation of organic matter within near surface sediments is the common source of the discharged methane [14]. Additionally, those investigators found that the average δ13C value of sampled authigenic carbonates is −47‰, and reported U–Th dates varying from 14.7 ± 0.6 ka to 15.7 ± 1.6 ka at the Baltimore Canyon seep field and from 1.0 ± 0.7 ka to 3.3 ± 1.3 ka at the Norfolk seep field. Here, we present the results of major, minor, and trace elemental analyses, as well as δ13C values of a carbonate crust sample collected at the Veatch Canyon seep site off the New England coast, here being investigated for the first time.
This contribution is focused on understanding seafloor methane seep processes through characterization of the mineralogy and chemical composition of associated deep-sea carbonate crust. An integral part of this work, is the development of a secondary CaCO3 standard for LA-ICP-MS analysis of carbonates starting from the USGS MACS-3 reference material. This approach, which does not simply rely on natural calcite samples as a secondary standard, could potentially be replicated by other laboratories.

2. Materials and Methods

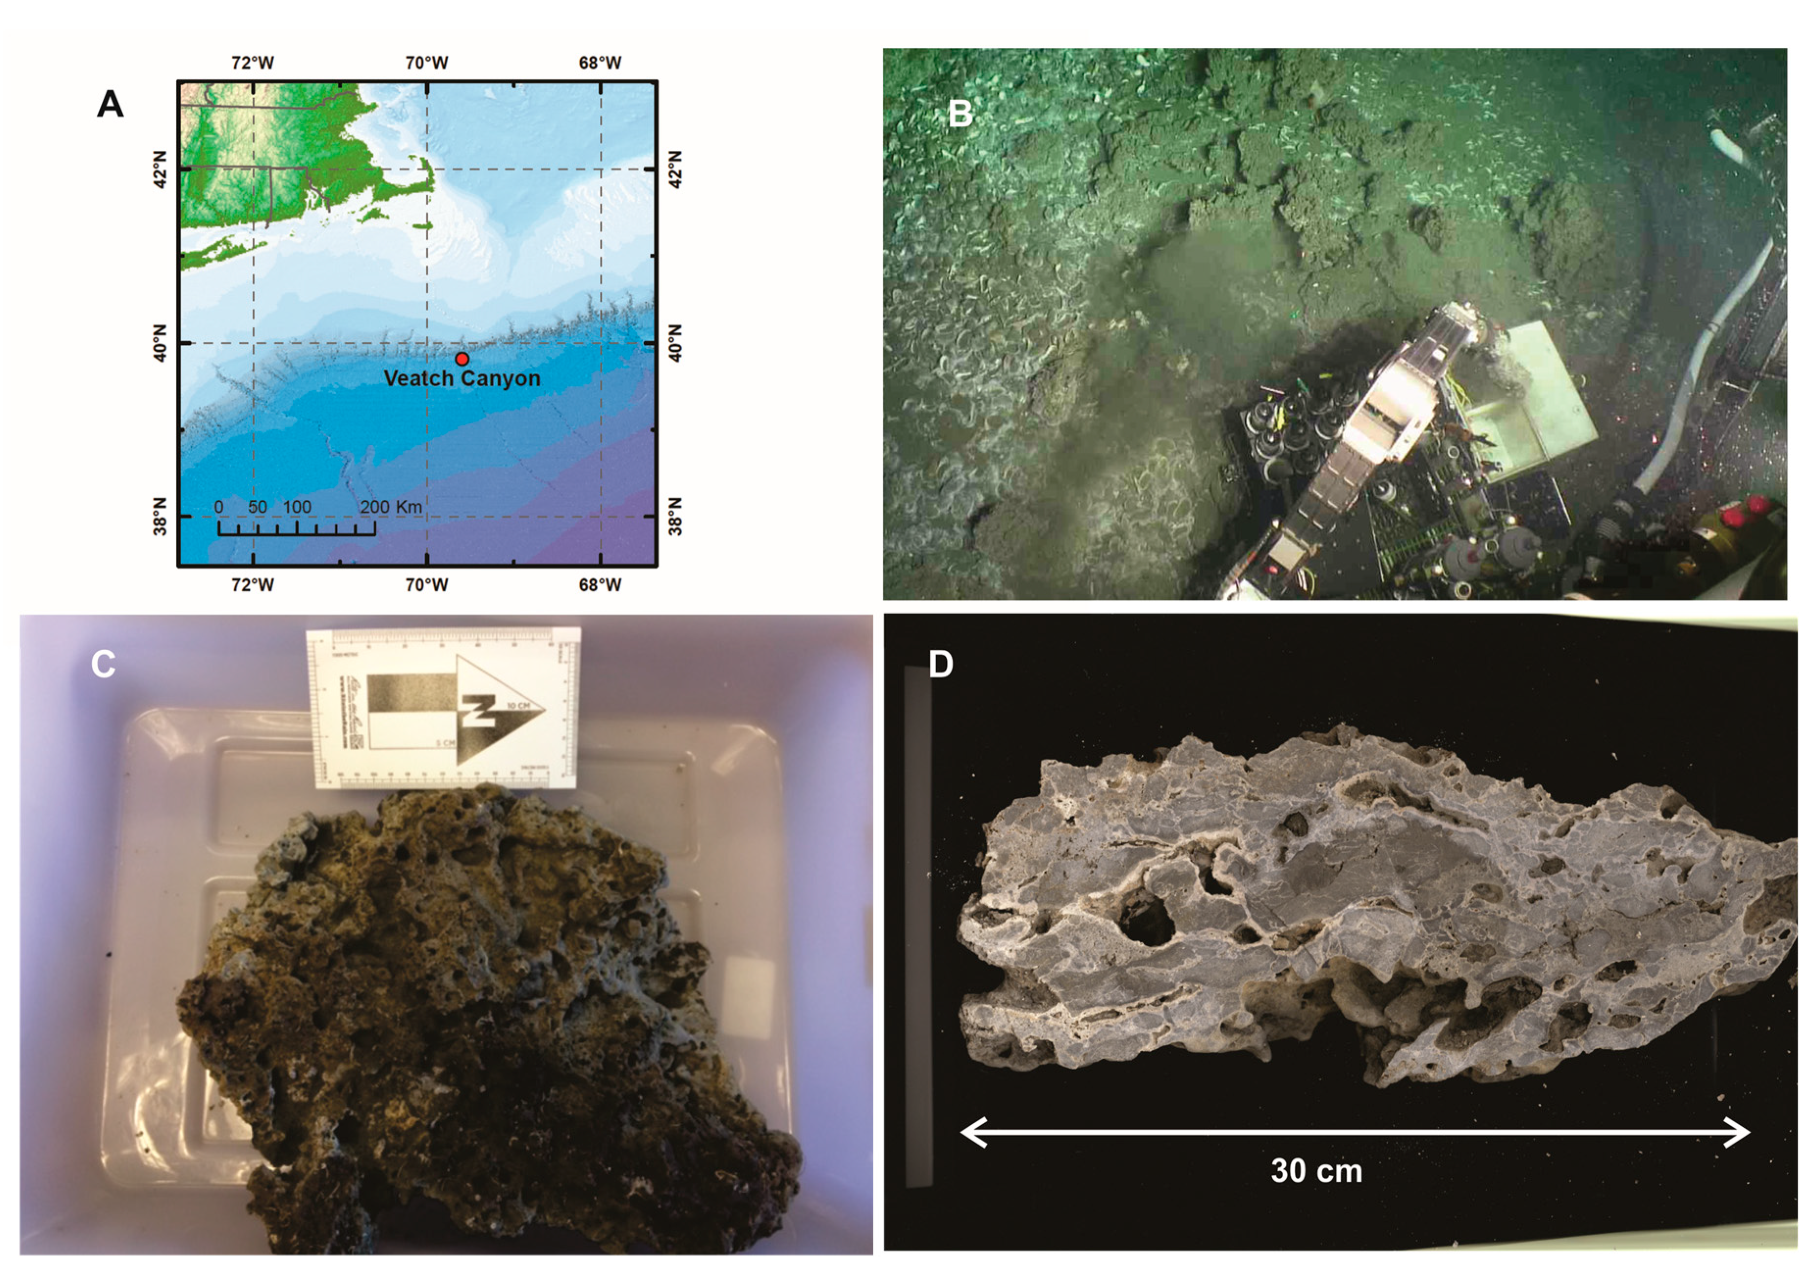
2.1. Sample Collection and Preparation

A large sample of thick (>10 cm) carbonate crust rock (Sample No. AD4835 BB4-S22) was collected at Veatch Canyon seep site (39.805860; −69.592593; Figure 1A) (WGS 1984) at a depth of 1419.6 m. At the collection site, the observed seafloor temperature was 3.8–4 °C. The sampling was performed with the submersible Alvin (Dive 4835) during cruise AT36 of the R/V Atlantis in August of 2016. The carbonate crust used in this study was collected using one of the submersible’s manipulator arms (Figure 1B) and stored in a biobox on the vehicle basket for the remainder of the dive. Knowing the original orientation of the carbonate crust is of fundamental importance because it helps determine the direction of crust growth. Thus, a picture of the sample in its original orientation, as determined from the video record of collection, was taken once the sample was transferred from the Alvin biobox to the laboratory on board to R/V Atlantis to ensure the direction of crust growth was known (Figure 1C). After initial inspection of the crust sample, the visible macrofauna was removed and the carbonate crust was rinsed with tap water. The crust was then preserved in a polyester sample bag and transferred to the laboratory of the Department of Geosciences at Mississippi State University (Mississippi State, MS, USA), where it was cut with a diamond saw into 2–4 cm thick vertical slabs, based on the orientation of the sample when collected. Vertical sections were chosen with the goal of exposing a surface parallel to crust growth based on the preliminary assumption that the crust grew in a downward direction (Figure 1D), e.g., [6]. Once the sample was cut, grey cemented sandstone, white veins (consisting of AcAr), and large vugs became visible with the naked eye (Figure 1D).

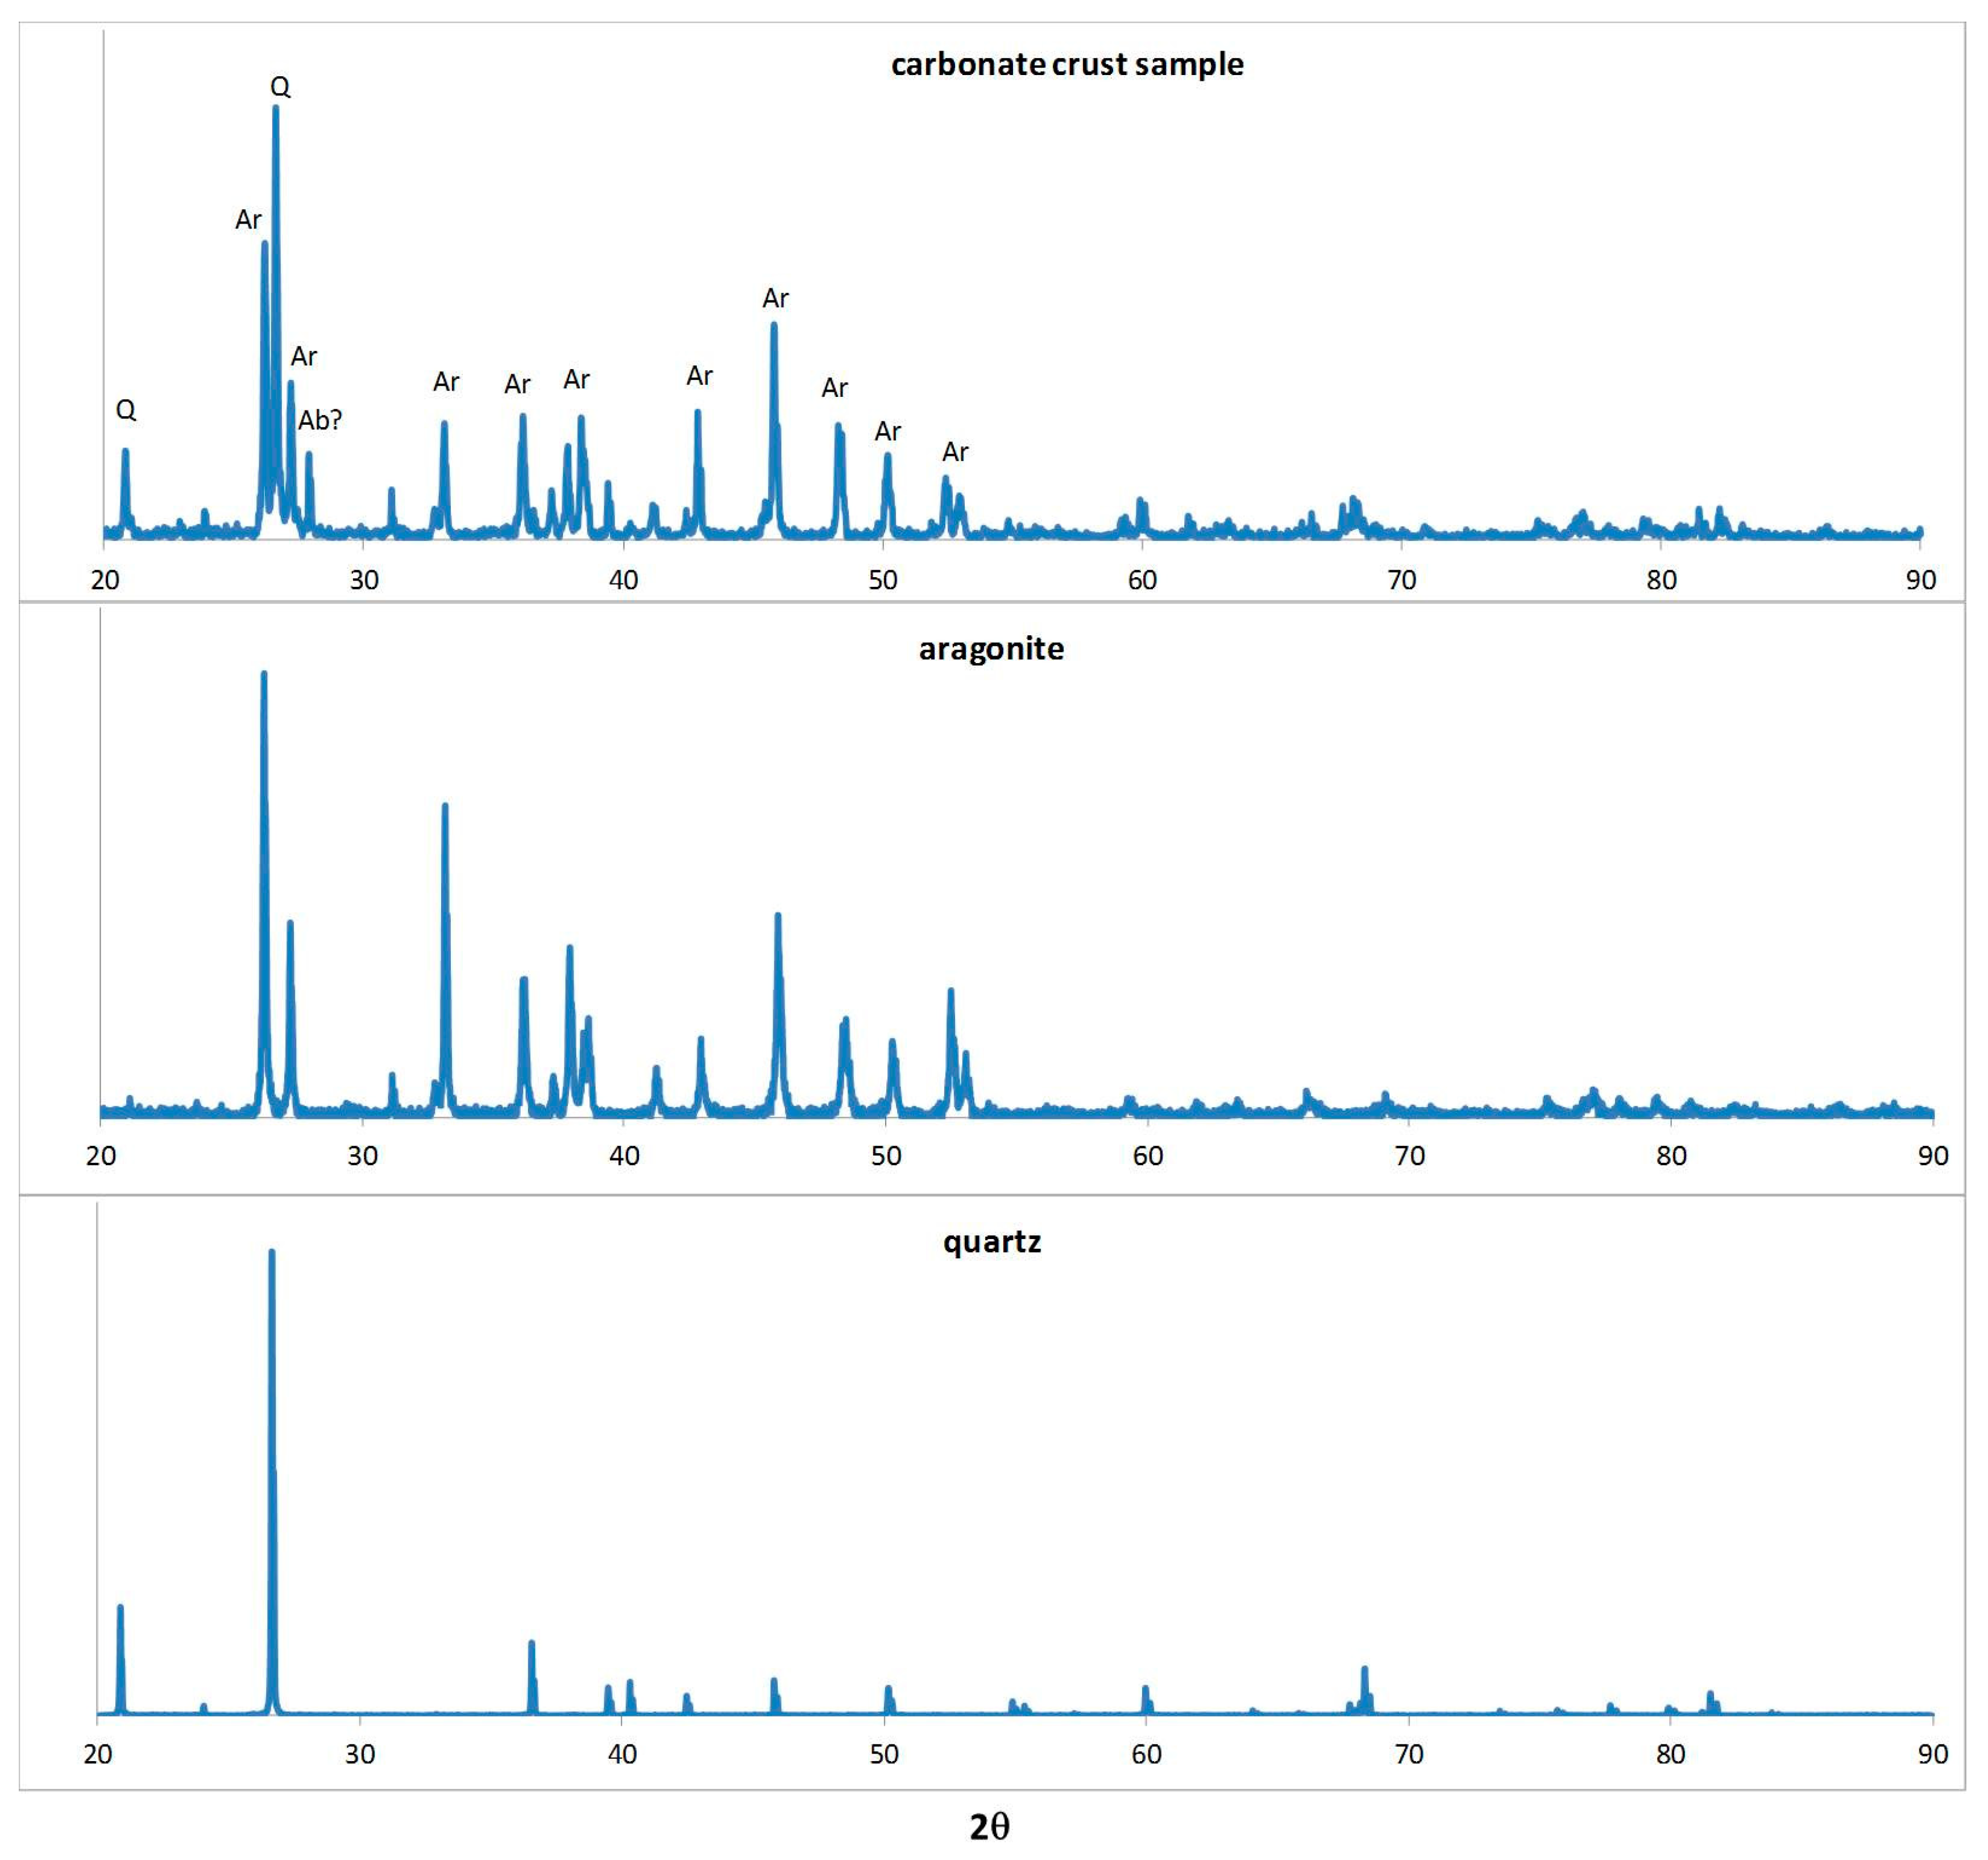
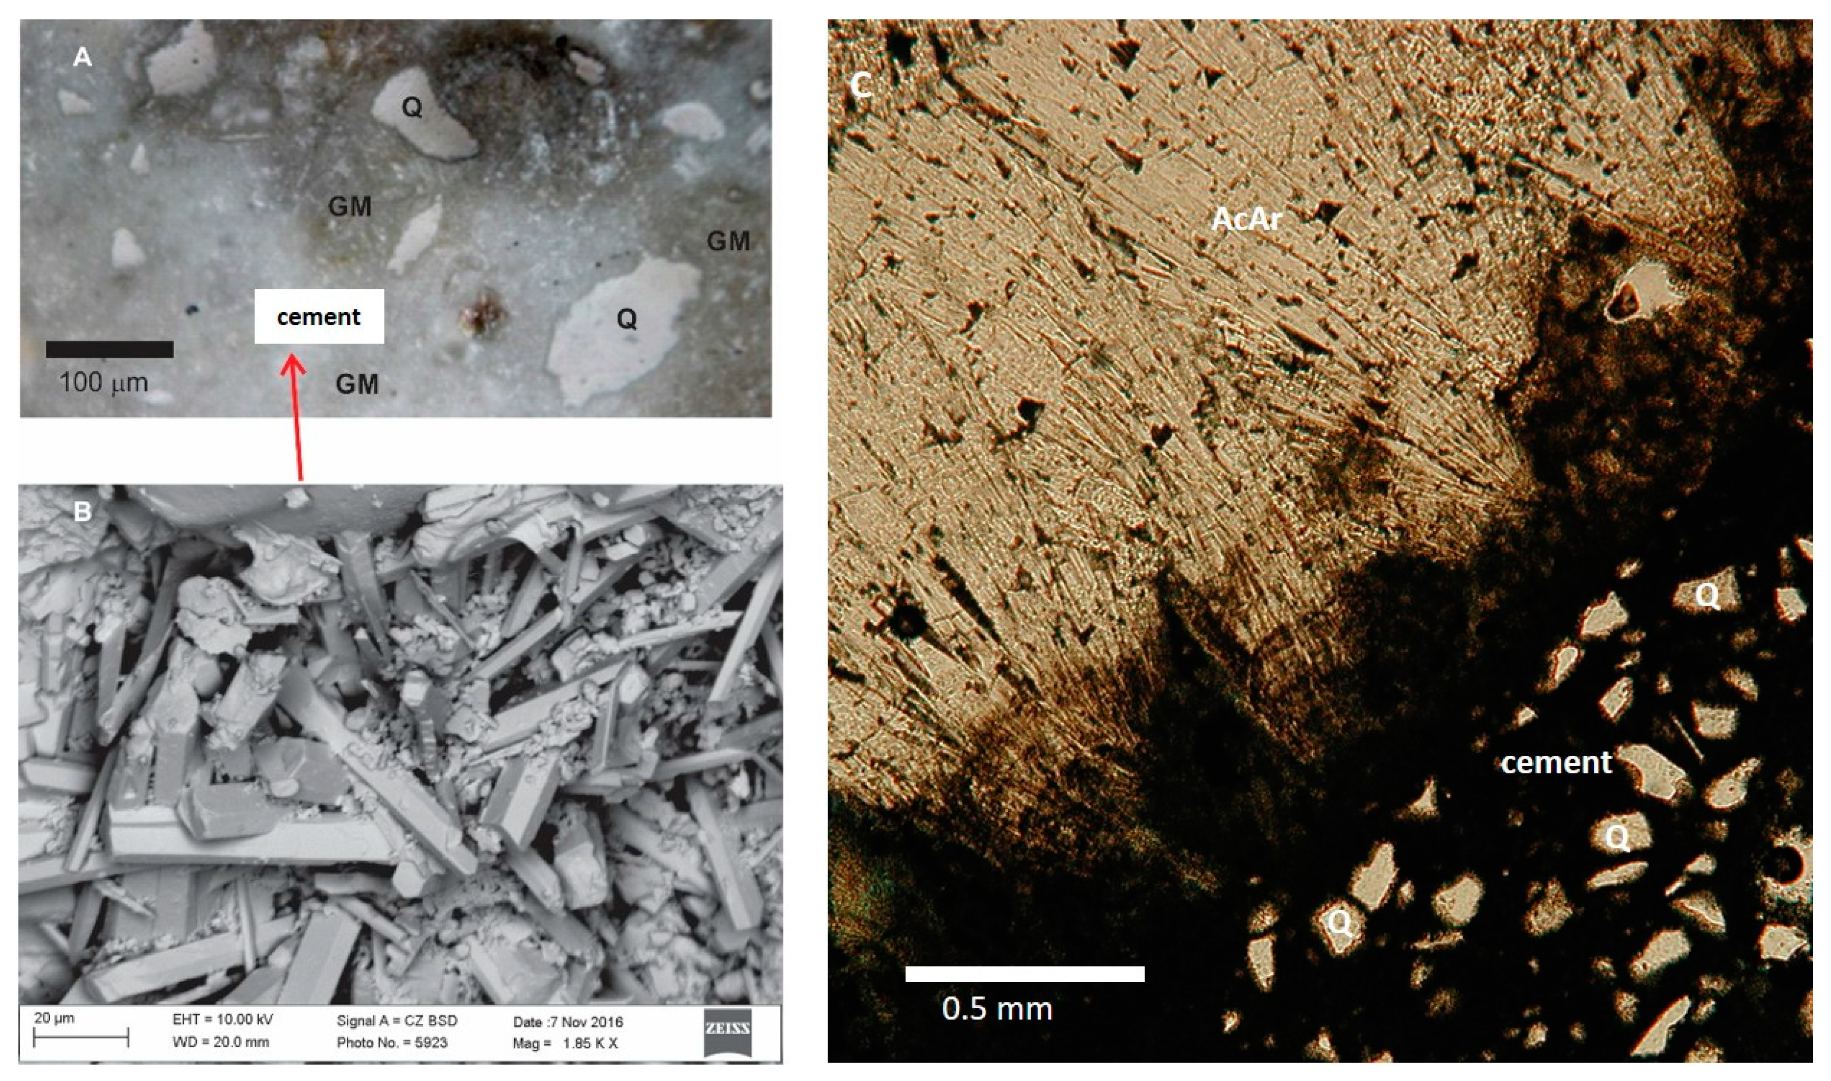
2.2. X-ray Diffraction (XRD), Scanning Electron Microscopy (SEM), and Optical Microscopy

Slabbed rock samples were examined with a Huvitz Upright optical microscope at up to 50× magnification. Additionally, powdered samples were examined for mineral presence using a Rigaku Ultima III X-ray Diffraction (XRD) System (Cu Kα radiation) at the Institute of Imaging and Analytical Technologies (I2AT) at Mississippi State University. We used a Cu X-ray source with receiver side monochromator to filter the Kβ out before contacting the detector. The analyses were conducted at 40 kV and 40 mA. The major elemental composition of the same samples characterized with XRD was evaluated with energy dispersive spectroscopy (EDS) combined with a Carl Zeiss EVO50VP scanning electron microscope (SEM) at I2AT. Analyses were performed over 250 × 250 µm2 areas at 15 kV. SEM imaging of secondary electrons (SE) was performed on platinum coated acicular aragonite to identify crystal morphology. Energy-dispersive X-ray spectroscopy (EDS) imaging was performed on uncoated samples over 25 × 25 µm2 areas to identify major elements in the crystals.

2.3. Carbonate Standard Development

To our knowledge, certified standards for LA-ICP-MS analyses of carbonates are not available yet, e.g., [15,16,17]. Therefore, we developed our own in-house carbonate standard, to analyze our carbonate crust samples with a matrix-matching standard in addition to the more widely used NIST-610 and NIST-612 silicate glass standards. In doing so, our goal was to develop a carbonate standard using a protocol that could be reproduced in other laboratories. Previous studies have reported the development of carbonate reference materials, with amounts that are generally limited to an individual laboratory, e.g., [18]. Therefore, we selected the USGS MACS-3 carbonate reference material as our starting point. However, that standard is a pressed powder that consists of crystals which are too small to allow laser beam focusing on individual grains. Accordingly, we fused the MACS-3 powder at 800 °C and 10 kbar for 48 h in a piston cylinder following the protocol described by Wark and Watson [19]. This resulted in a densely packed multi-crystalline calcite with an average grain size of 50 µm-sufficiently large for LA-ICP-MS single-crystal analyses. At the end of the experiment MACS-3 was characterized by LA-ICP-MS following the analytical protocol described in the following section and using Sigma-Aldrich NIST-610 and NIST-612 as the standards. The results obtained were compared with the certificate of analysis provided by the USGS at the time of the MACS-3 purchase.

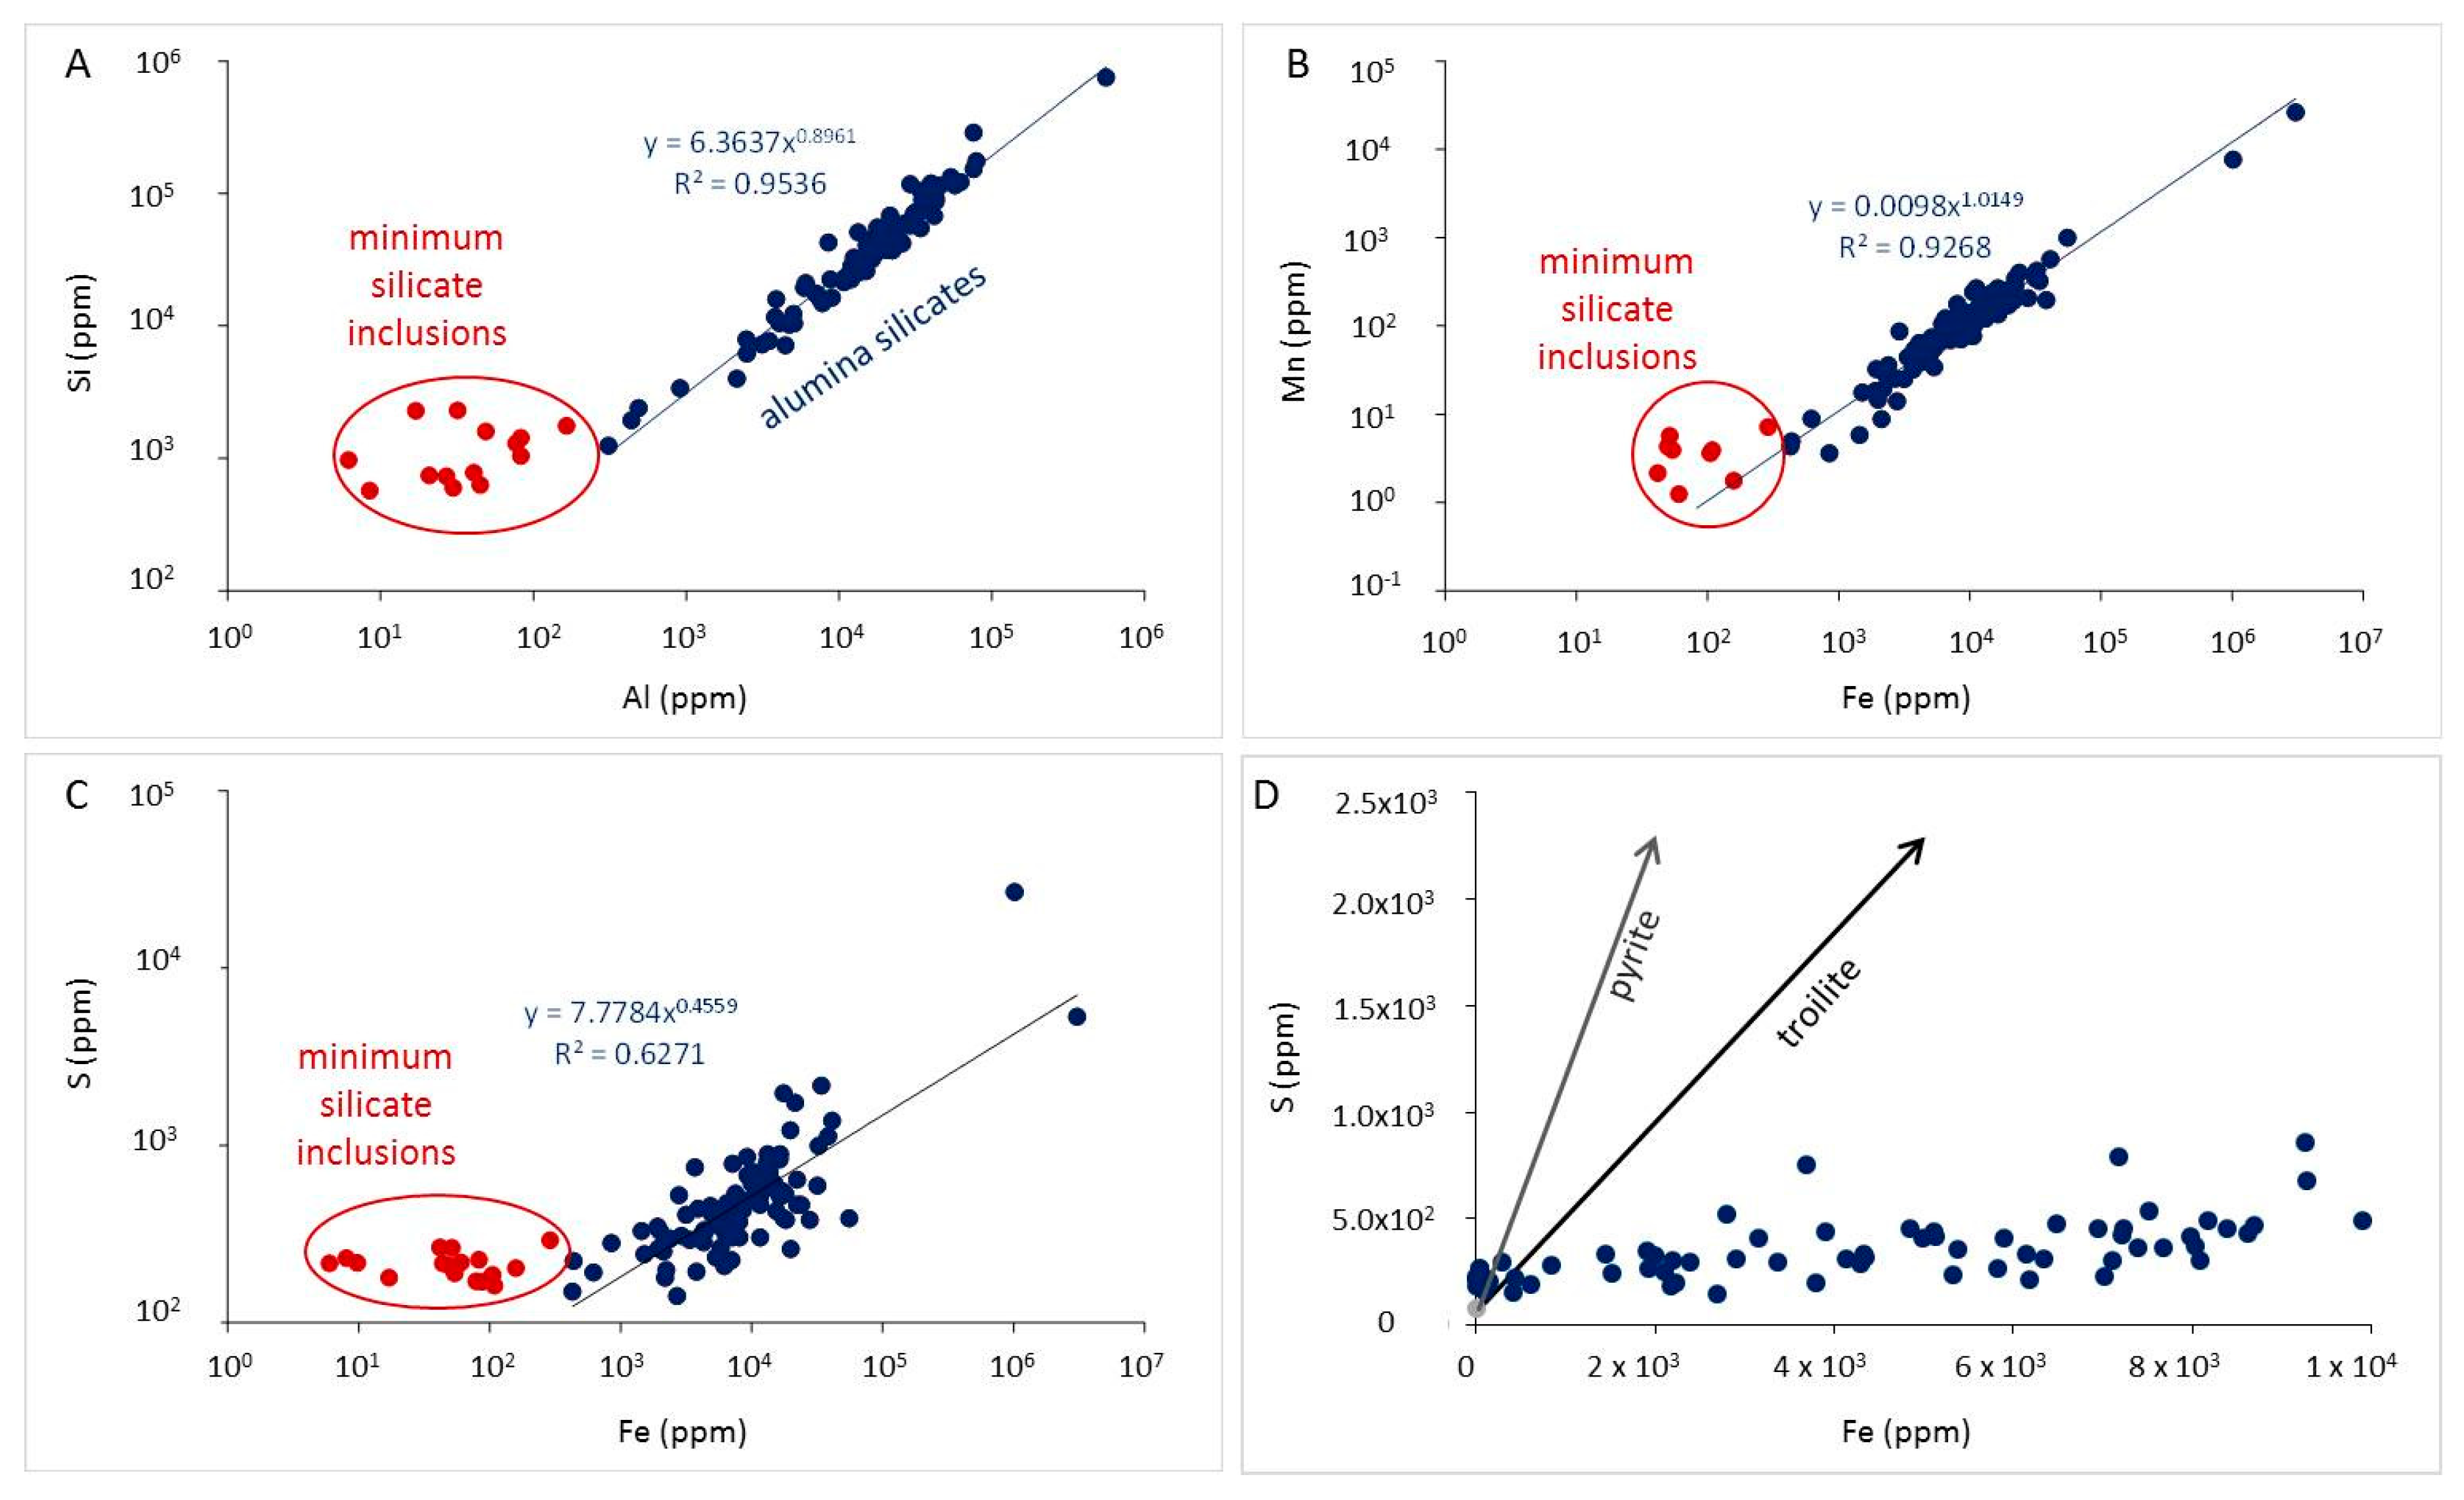
2.4. Elemental Analysis with Laser Ablation Inductively Coupled Plasma Mass Spectrometry (LA-ICP-MS)

A portion of one vertically sectioned slab of the sample was cut into seven slabs (1–2 cm) small enough to be fitted into cylindrical epoxy mounts with an inner diameter of 2.5 cm. Each mount was polished with 600, 800, and 1200 grit silicon carbide (SiC) paper (Buehler). Elemental analyses were performed on an Agilent 7900 quadrupole mass spectrometer outfitted with a CETAC (formerly Photon Machines) 193 nm excimer laser at the Department of Earth and Environmental Sciences at the University of Rochester (Rochester, NY, USA). Data were collected in three analytical sessions within a week. Prior to each analytical session, the instrument was tuned using the NIST-612 glass standard. Analyses were conducted along the growth axis of the crust and were performed using a laser spot size of 40 μm (circle), a laser fluence of 4.72 J/cm2, a laser pulse rate of 5 Hz, and a shot count of 150 (Table 1). In the LA sample chamber (MFC1), helium was used as the carrier gas with a flow rate of 0.6 liter per minute. The helium flow in the HelEx arm had a flow rate of 0.2 liters per minute (MFC2). Argon was used as the ICP-MS carrier gas and its flow was set at 1.3 liter per minute. To minimize oxide interferences, a helium flow of 0.5 milliliter per minute in the ICP-MS collision reaction cell was used. Oxide and doubly charged ion interferences were monitored during the instrument tuning, at the beginning of each analytical session. Each analysis incorporated approximately 60 s of background acquisition (gas blank) and 20 s of data acquisition (Table 1). Analysis of 23Na, 24,25,26Mg, 27Al, 29Si, 33,34S, 39K, 43,44Ca, 55Mn, 54,56,58Fe, 88Sr, 90,91Zr, 137,138Ba, and 235,238U were conducting using the NIST silicate glass standards (NIST-610 and NIST-612) and the USGS carbonate standard (baked MACS-3, see “Standard Development” sub-section) (Tables S1–S3). Standards were measured every five to ten unknown samples. Integration times were the following: 0.01 s for Na, Mg, Al, Si, Ca, Sr, Ba; 0.02 s for K, Fe, Mn; 0.04 s for S; 0.06 s for Zr and U. Data were obtained by reducing the LA-ICP-MS outputs with the Iolite software package, e.g., [20,21]. For those elements for which we monitored multiple isotopes, the data reported in the following sections in the manuscript refer to 24Mg, 34S, 56Fe, 90Zr, 138Ba, and 238U. Element to Ca ratios were calculated by standardizing against MACS-3, using 43Ca as the internal standard (default content in the samples 40.04 wt %). Data collected on NIST-610, NIST-612, and MACS-3 were used as a check of the instrument performance, while instrument was tuned with NIST-612. Reproducibility and accuracy of LA-ICP-MS analyses are presented in Supplementary Materials (Tables S1–S3). There, each standard was treated as unknown and its data were reduced with two other standards. For example, when NIST-610 is reduced with NIST-612 the standard deviation varies from 1.9% to 6.9% depending on particular element, with an average value of 3.4%.

2.5. Stable Isotope Analysis with Isotope Ratio Mass Spectrometry (IRMS)

Bulk samples of powdered carbonate crust were obtained with a hand drill. Three samples were collected within 25 cm of each other. Collected powdered samples were analyzed for δ13C and δ18O using an automated carbonate preparation device (KIEL-III) combined with an isotope ratio mass spectrometer (IRMS) (Finnigan MAT 252) in the Environmental Isotope Laboratory at the University of Arizona (Tucson, AZ, USA). Powdered samples were reacted with dehydrated phosphoric acid under a vacuum at 70 °C. The isotope ratio measurement was calibrated based on repeated measurements of NBS-19 and NBS-18 with a precision of ±0.08‰ (δ13C) and ±0.1‰ (δ18O) at 1σ level.

3. Results

3.1. Comparison of LA-ICP-MS Data Reduction for Silicate and Carbonate Standards

We compared our data with published values for elemental concentration in NIST-610, NIST-612, and MACS-3 (Tables S1–S3). A large inconsistency was observed when glass standard (NIST-610 and NIST-612) data were reduced with carbonate standard (MACS-3) data. Thus, a difference greater that 100% was observed between certified data for NIST glass standards and when NIST glasses were treated as unknowns and reduced with MACS-3 carbonate standard for Na, Zr, and U; and a difference greater than 10% was observed for Mg, S, Mn, Fe, and Ba (Tables S1 and S2). Some inconsistency (more than 10%) was observed for Mg, K, and Fe when data from one glass standard were reduced with another glass standard. When MACS-3 was treated as unknown and reduced with glass standards, the obtained concentrations of Na, Mg, S, Fe, Zr, and U yielded more than 10% difference with MACS-3 certified values (Table S3).

3.2. Carbonate Crust

Aragonite was the most abundant mineral identified with XRD spectra in the powdered carbonate rock sample. Figure 2 contains a diffraction pattern of the carbonate crust sample (mostly cement and clastic material), aragonite, and quartz (downloaded from the RRUFF online database). Quartz is the second most abundant mineral in the rock and albite is potentially present in minor amounts.
Optical microscopy of the polished slabs showed that the carbonate rock sample is heterogeneous and consists of angular pieces of sandstone where sand grains are lithified by a fine-grained, grey cement and the fracture veins in between them are lined with rims of white botryoidal aragonite (further referred to as acicular aragonite, AcAr). In SEM, the white portion of the cement lithifying the sand grains consists of crystals of a few to hundreds of µm in size (Figure 3A) with a width is typically below 20 µm (Figure 3B). The AcAr crystals completely fill the vugs in the cement. SEM EDS analyses showed that the cement and AcAr are CaCO3. EDS spectra of large cemented equant crystals indicated that their composition is SiO2 confirming XRD findings of quartz (the second most abundant mineral). Ten SEM EDS images 25 × 25 µm2) were used to identify two sulfur rich submicron inclusions (<1 µm) with molar S/Fe ratios of 2.33 and 1.05. Those data show that pyrite and pyrrhotite are present in the rock in trace amounts. The tightly lithified sandstone is fractured and space between the sandstone is filled with white veins of aragonite. The aragonite grew along the surface of the fractured sandstone forming large splays of botryoidal aragonite composed of acicular crystals that can be centimeters in length (Figure 3C).
Aragonite cement and AcAr crystals were measured with LA-ICP-MS. Analytical spots were aligned in the direction from the lowest to the highest portion of the carbonate rock samples in a way that equant quartz crystals were avoided. All analyses of aragonite cement yielded correlations between: Si and Al with R2 = 0.95 (Figure 4A), Mn and Fe with R2 = 0.93 (Figure 4B), and S and Fe with R2 = 0.63 (Figure 4C). There data collected on AcAr and cement with minimum of silicate inclusions were excluded from the fitting curves. LA-ICP-MS measurements of white cement (slab-6) and AcAr crystals (slabs 7) produced the only reliable chemical composition data for the CaCO3 portion of the carbonate crust sample because of low or non-detectable contents of Si and Al as well as the absence of Si–Al correlation in AcAr (Figure 4A, data inside red circle). Additionally, these crystals yielded lower contents of all measured elements, with the exception of Sr and Ca compared to the cement (Table S4). Mg, S, Ca, Sr, Ba, and U data were used to calculate element to calcium molar ratios (E/Ca). Table 2 contains observed E/Ca values in the white cement and AcAr from two upper crust slabs (6 and 7) of the same rock slice. All spot samples from slab 6 were collected in white aragonite cement with no visible silicate minerals. The majority of the spot samples (nos. 40–45) of slab 7 were collected in thicker AcAr (average thickness of 50 µm) located at the most upper edge of the crust, i.e. no aragonite cement was present above. Those AcAr (slab 7) contain lower Mg/Ca, Sr/Ca, Ba/Ca, and U/Ca ratios compared to those rations in white cement (slab 6). This result suggests that non-detected nano-inclusions of clastic silicate minerals present in white cement and affect the elemental analysis; although amount of possible silicate inclusions in white cement is much smaller than those in grey cement.
Carbon isotope analyses were reported relative to the Vienna PeeDee Belemnite (VPDB) standard and yielded δ13CVPDB values of −50.25, −49.81, and −50.19‰ (Table 3). Two of those values overlap with analytical uncertainty of 0.08‰, the one (−49.81‰) is distinct. The average δ13CVPDB is equal to −50.09 ± 0.24‰, where error is the standard deviation of isotope values from the three measured samples. Oxygen isotope composition of the aforementioned three samples were similar to each other within analytical error, i.e., δ18OVPDB = 4.53‰, 4.50‰, and 4.53‰, with an average value of 4.52 ± 0.02‰.

4. Discussion

4.1. Carbonate Standard for LA-ICP-MS

Reduction of silicate data with silicate standard yielded less than a 5% difference between obtained and certified concentrations for Na, Al, Si, Sr, Zr, Ba, and U and less than a 10% difference for Mn (Tables S1 and S2). The larger inconsistences for other elements (Mg, K, and Fe) show that those elements are more sensitive to concentration differences (by a factor of 10) between NIST-610 and NIST-612 glass standards. In summary, the application of glass standards for the reduction of Mg and K in glass samples is not recommended when differences in elements concentrations are at an order of magnitude. Given that the inconsistency for Fe is 9%–11%, Fe reduction should be used with caution.
Reduction of carbonate data with silicate standard and vice versa show that Sr is the least sensitive to the matrix effect. The difference between certified and reduced concentrations (inconsistency) of Sr varies from 2% to 3% (Table S3). NIST-610 (inconsistency ≤10% for Mg, Mn, Sr, and Ba) is found to be a better standard for reduction of carbonate data compared to NIST-612 (inconsistency <10% for Sr and Ba). Overall, the application of silicate standards for carbonate samples is not recommended for Na, Fe, Zr, and U. Given that the inconsistency for S is 11% (NIST-610 reduction only) and for Mg is 8% (NIST-610 reduction), those elements should be used with caution. The observed inconsistences while applying the silicate glass standard for carbonate samples could be explained not only by difference in element concentrations, but also by the matrix effect. Elemental fractionation can bias quantitative analyses because it can lead to a non-stoichiometric detection for some elements when a non-matrix-matching standard is used to calibrate the LA-ICP-MS machine, e.g., [22]. In general, lasers using shorter UV wavelengths (e.g., laser at 193 nm) reduce the severe elemental fractionation effects typical of analyses performed using longer wavelengths, e.g., [23]. Here we show that analyses with a laser wavelength of 193 nm still show large inconsistences for Na, Fe, Zr, and U; this is likely due to matrix effect, as inconsistences between certified and reduced data are the same or not very different for Na, Zr, U, and Fe reduced with NIST-610 and NIST-612 (Table S3).

4.2. Stable Isotopes

Highly negative δ13CVPDB values suggest that precipitation of authigenic aragonite was induced by AOM at the Veatch Canyon seep site. These δ13C values overlap with those reported by Prouty at al. for the Norfolk and Baltimore Canyon seep sites [14]. An effort was made to estimate the temperature of the water from which carbonate crust grew using δ18Oaragonite data from cement. Due to the unavailability of δ18Owater at our site, the δ18OSMOW value of 0.34‰ reported for Norfolk seep field [14] was used. The calibration equation developed by Kim et al. [24] was applied to our data. The calculated temperature range of 1.7–1.9 °C is lower than temperature (3.9–4 °C) measured during sample collection. The difference between estimated and measured temperatures could be related to the release of 18O-enriched water from hydrate dissociation of clay mineral dehydration [25,26,27].

4.3. Mineralogy

High Si and Al in the cement (relative to AcAr), as well as a strong correlation between Si and Al (Figure 4A), suggest the presence of aluminosilicate inclusions in the cement (Table S4). Correlation of Mn with Fe (Figure 4B) suggests an occurrence of micro inclusions of Fe-Mn oxy-hydroxides as was earlier observed cold seep carbonates in the Sea of Marmara by Crémière et al. [28]. Alternatively, the Mn-Fe trend could be explained by the presence of those elements in micro-silicate inclusions (undetected by XRD due to their small amount, i.e., below 3%–5%). The correlation of S with Fe (Figure 4C) cannot be explained by the presence of iron sulphides in the sample. A plot of S versus Fe yielded almost no correlation with the stoichiometric sloped for pyrite (FeS2) and troillite (FeS) (Figure 4D). However, this observation does not eliminate the possibility of occurrence of iron sulfide in trace amounts. The strong deviation of S-Fe trend from stoichiometry of iron sulfides could be explained by the presence of Fe oxy-hydroxides, which is consistent with reddish inclusions observed with optical microscopy.
Clastic sediments (quartz and alumina silicates) were cemented by microcrystalline aragonite. Larger acicular aragonite crystals were likely formed later in the voids through which methane was passing [29]. The presence of trace amounts of iron sulfides of likely authigenic origin suggests that the sampled carbonate crust formed via AOM coupled with sulfate reduction (Reaction (1)), which likely was not very intensive, as indicated by the small amount of sulfide minerals present. Thus, exclusive aragonite crystallization suggests that the crust formed at a near-seafloor environment and higher supersaturation as Mg-calcite normally forms deep in sediments at lower sulfate concentration and lower supersaturation [30,31,32,33]. On the other hand, the study of Zhang et al. [34,35] showed that dissolved sulfide plays a critical role in mineralogy of carbonates. They showed that a few millimoles of dissolved sulfide promote crystallization of calcite and dolomite by reducing the energy required for Mg dehydration from solution. Overall, it is likely that a high concentration of sulfate inhibited crystallization of calcite and dolomite, and that the concentration of sulfide was too low to promote the precipitation of calcite and dolomite. Notably, sulfate concentrations at a different location within the Veatch Canyon seep site were measured to be slightly lower than average values reported for modern ocean (28 mM) [5,36,37]. The concentration of dissolved sulfide of 0.07–0.3 mM at the 0–9 cm below seafloor (bsf) was reported for aforementioned seep site [5]. There, sulfate concentration increased from 22.13 to 27.73 mM as depth increased from 0–3 to 12–15 cm bsf, and the concentration of sulfate in bottom waters was 24.34 mM. This sulfate concentration profile is substantially different from seeps with strong sulfate reduction, e.g., seeps at Makran convergent continental margin, where sulfate concentration decreased to values of lower than 5 mM at depth pf 15 cm bsf [37]. The presence of trace amounts of iron sulfide in our samples suggests that sulfate reduction was weak but that it occurred and is occurring at the sampled seep site. This conclusion is supported by presence of dissolved sulfide and Fe2+ in the samples from the other seep site in Veatch Canyon [5]. The presence of two sulfide minerals suggests that sulfur occurs at two oxidation states: S in pyrite and mostly as S2− in pyrrhotite.

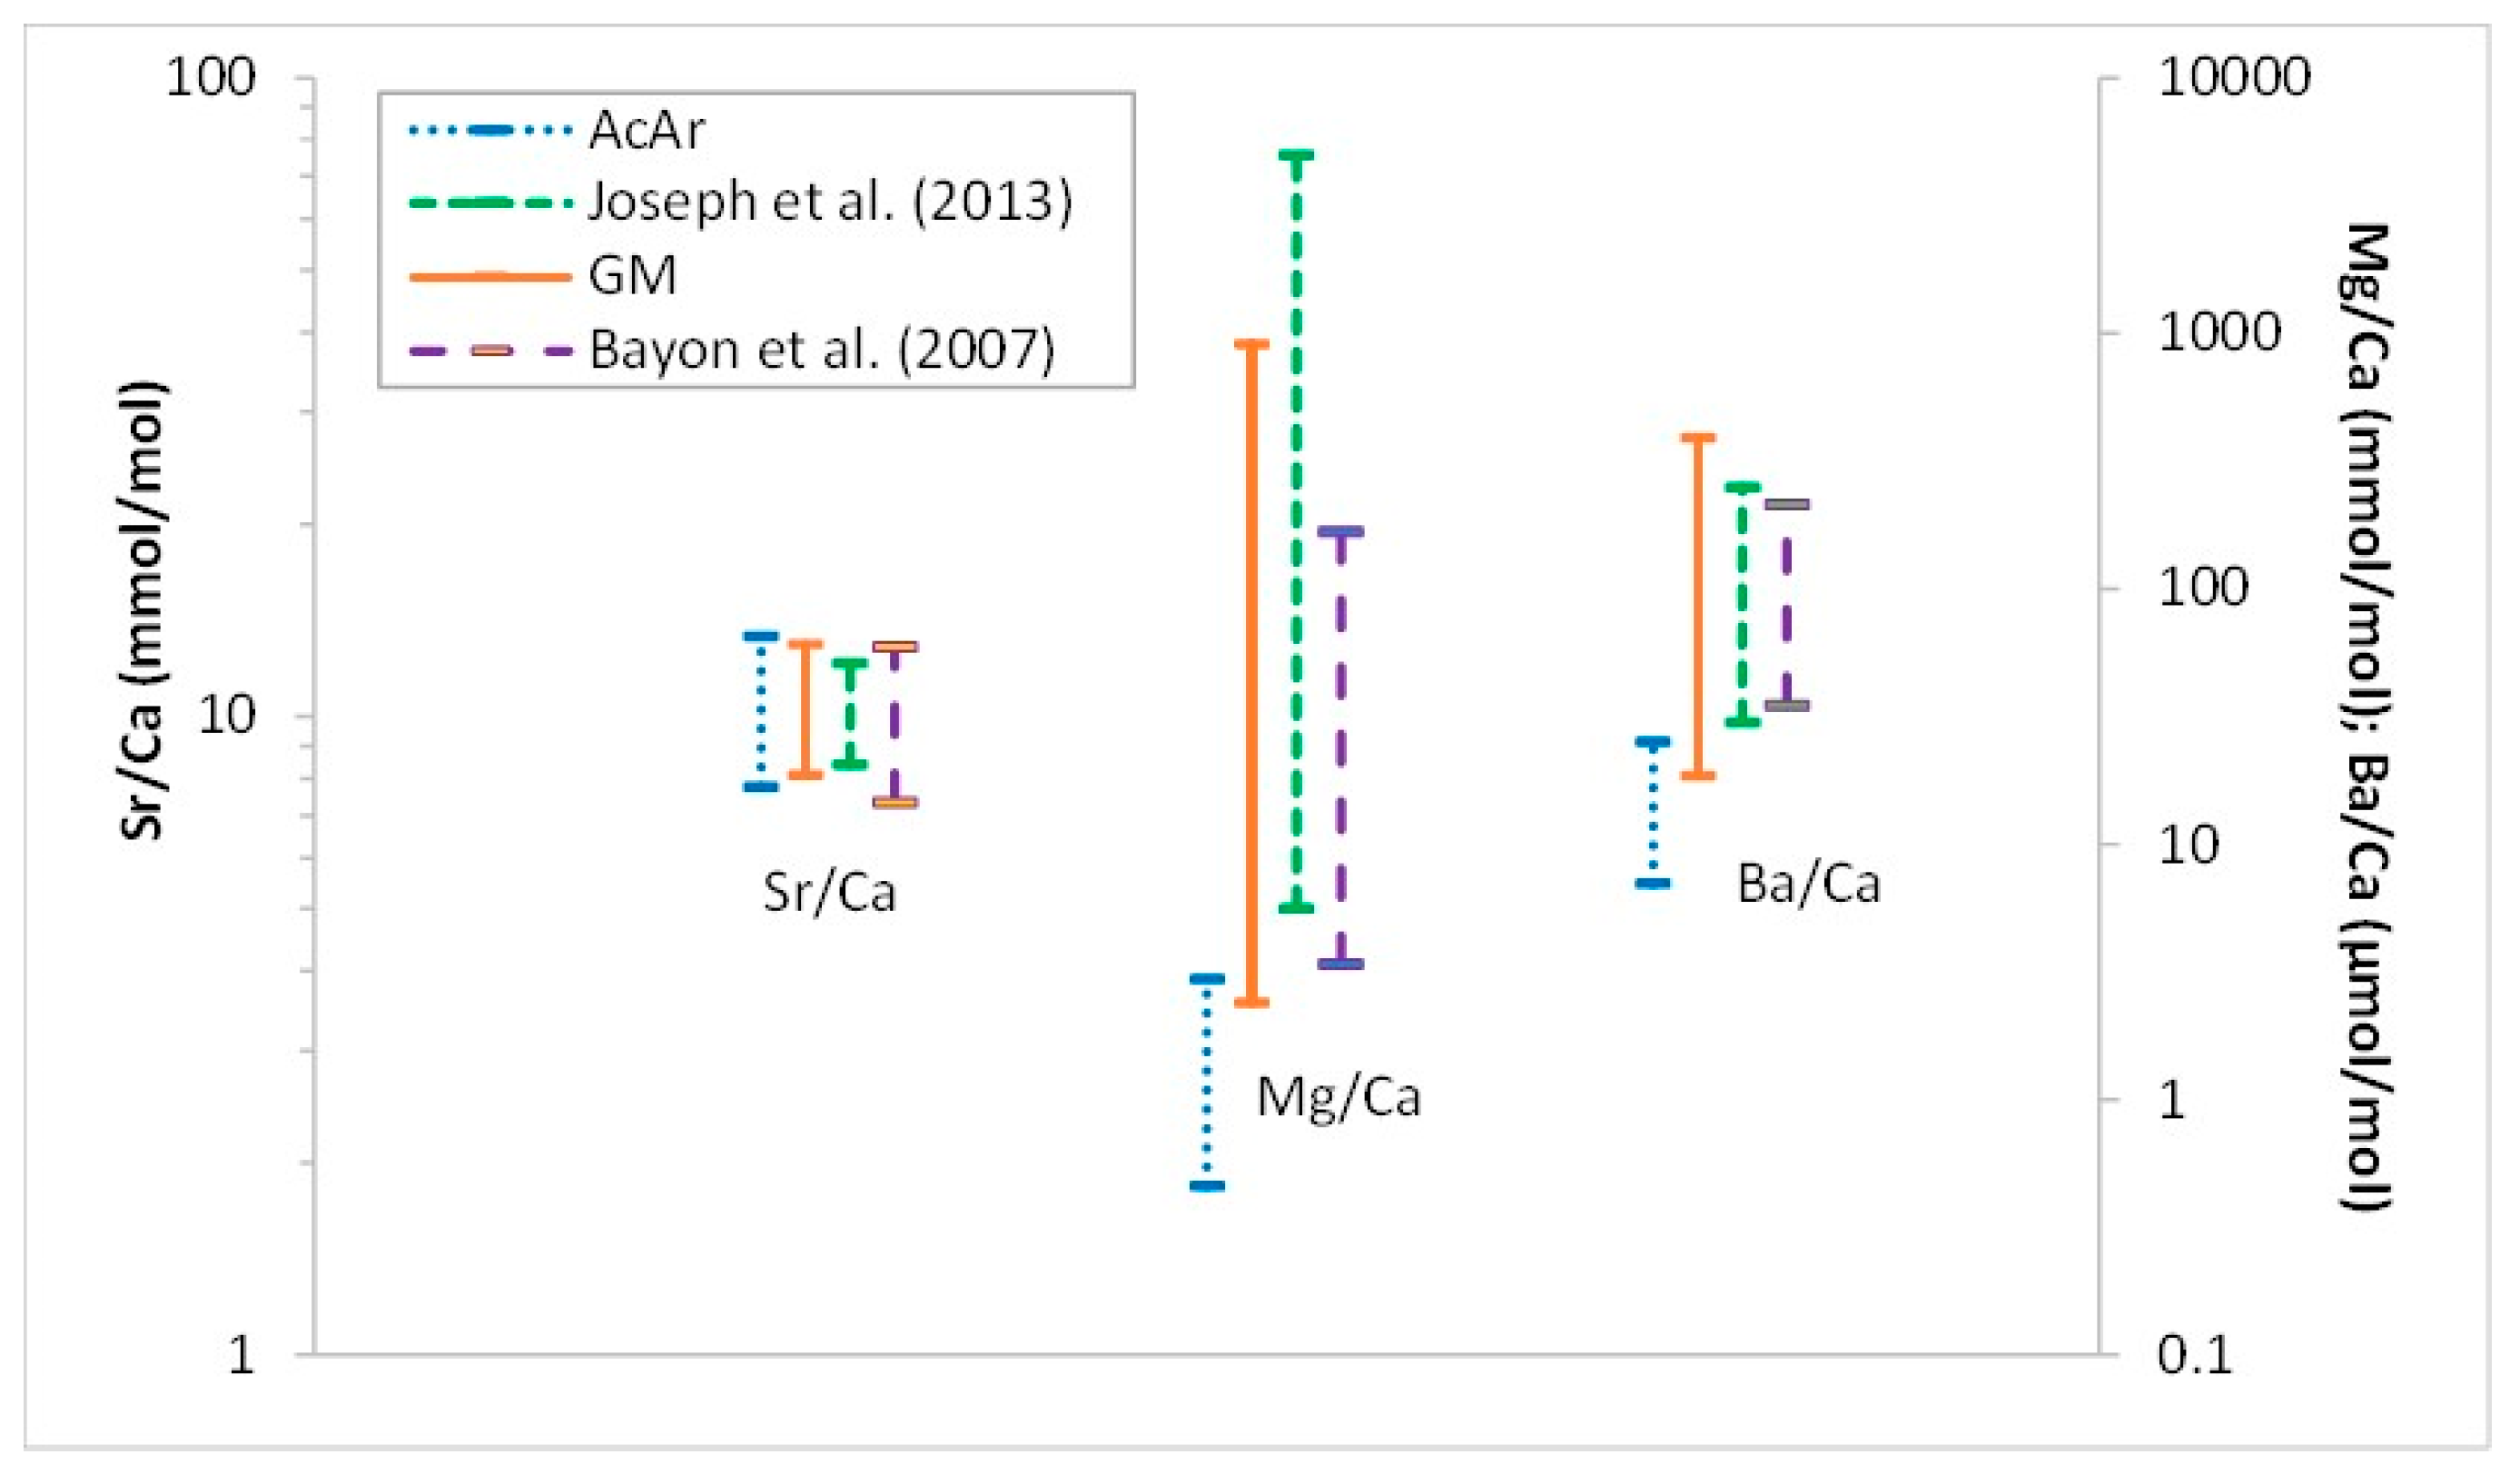
4.4. Minor and Trace Elements

The range of values for cement Mg/Ca, Sr/Ca, and Ba/Ca ratios overlap with those reported for aragonite samples collected at modern methane seep sites on the Cascadia margin (Hydrate Ridge and Barkley Canyon) (Table 2 in Joseph et al. [38]) and Niger Delta sediments [39] (Figure 5). Similarly, the ratios of Sr/Ca in AcAr overlap with those in the cement (7.73–13.13 mmol/mol) and in the study of Joseph et al. [38] (8.4–12.1 mmol/mol). In contrast, Mg/Ca and Ba/Ca ratios (0.4–2.8 mmol/mol and 6.57–23.2 µmol/mol; respectively) in AcAr are lower than in cement, where Mg/Ca = 2.4–905 mmol/mol and Ba/Ca = 18.6–389 µmol/mol. Also, the Mg/Ca and Sr/Ca for aragonites (no micrographs were provided) from methane seeps in Northern Congo Fan [33] overlap with the data shown in Figure 5. The large ranges in E/Ca observed in our study are likely due to the occurrence of small aluminosilicate and iron sulfide inclusions, which were not avoided by LA-ICP-MS spot analyses. The potential presence of dolomite or high Mg calcite could explain a greater Mg/Ca ratio in white cement (slab-6) in comparison to AcAr (slab-7) as those Mg-rich carbonates were reported in a number of seep carbonate samples from other locations including mid-Atlantic margin e.g., [14,40]. A much smaller, but quantitatively significant (within 1 standard deviation) difference in S/Ca and especially U/Ca between white cement (slab 6) and AcAr (slab 7) could be explained by the presence of small unresolved non-aragonite inclusions of sub-micron size (Table 2). The relatively high heterogeneity of those ratios (especially in white cement) supports the aforementioned explanation. An alternative explanation for the geochemical heterogeneity of the carbonate crust is the evolution of fluid composition during diagenesis [40]. There, the REE contents in carbonate crust were different for earlier and later precipitated aragonite. This observation was explained by evolution of the fluid chemical composition through time.
In summary, LA-ICP-MS analyses showed that cemented clastic minerals could not be avoided with a laser spot diameter of 40 µm precluding the use of LA-ICP-MS for the reconstruction of paleoenvironmental conditions in such cement samples. Therefore, in situ analyses of trace elements should be considered only for carbonate crust regions free of clastic sediment, which, in our case, are AcAr crystals. Strontium was the only element with similar concentrations in both the cement and AcAr, suggesting that aluminosilicate inclusions do not contain Sr, corroborating the potential of using Sr isotope data to evaluate methane genesis in Veatch Canyon in future studies.
Overall, this study shows that the sampled carbonate crust is composed of clastic sediments (mostly quarts and aluminosilicates) cemented with microcrystalline aragonite of light carbon isotope composition. Younger and larger acicular crystals composed of aragonite likely precipitated in the rock voids that remained after cementation of clastic sediments [29]. Trace amounts of iron sulfides (likely authigenic) were observed in the crust, which together with low δ13Ccement, suggests that AOM and sulfate reduction caused the formation of the sampled carbonate crust. The precipitation of only aragonite is consistent with carbonate crust growth at near seafloor conditions.

5. Conclusions

In this study, we characterize the mineralogical, elemental, and isotopic composition of an authigenic carbonate crust sample from a recently discovered methane seep site on the US North Atlantic continental margin. The strong depletion of 13C in aragonite indicates that the carbonate crust formed via anaerobic oxidation of methane. The presence of trace amounts of iron sulfides suggests that AOM is coupled with sulfate reduction, which likely was not always intense during the formation of the carbonate crust. Evaluation of trace element concentrations was possible in acicular aragonite crystals, which likely precipitated after cementation, and therefore, do not contain visible inclusions of clastic minerals.
Methane cold seeps are ubiquitous features on continental margins around the world [41], and represent an important source in ocean [14], and in some limited cases, atmospheric [42], carbon budgets. Methane released at these sites is largely anaerobically oxidized in the water column, resulting in ocean acidification and deoxygenation [43]. Authigenic carbonate crust sequesters much of the carbon released at cold seeps, and therefore, its mineralogical and stable isotopic composition serves as a record of methane source and flux [44,45]. However, mineralogical and isotopic compositions vary with seep location as a result of localized controls on flux, including the structure of underlying gas transport pathways, the presence of gas hydrate, and the evolution of the carbon source [44]. Accordingly, the presented results provide initial constraints on the source and emission of methane at a newly discovered seep site, and will inform future efforts to further refine a geochemical proxy for methane flux and to better understand the associated evolution of global ocean carbon cycles.

Supplementary Materials

The following are available online at https://www.mdpi.com/2075-163X/9/3/138/s1, Table S1: Concentrations in NIST-610 determined using carbonate (MACS-3) and glass (NIST-612) standards; Table S2: Concentrations in NIST-612 determined using using carbonate (MACS-3) and glass (NIST-610) standards; Table S3: Concentrations in MACS-3 determined using glass standards (NIST-610 and NIST-612); Table S4: (a) Carbonate crust data collected using a LA-ICP-MS. Data are reduced using the glass standard NIST-610. Ppm = parts per million; s.e. = standard error; (b) Carbonate crust data collected using a LA-ICP-MS. Data are reduced using the carbonate standard MACS-3. ppm = parts per million; s.e. = standard error.

Author Contributions

Conceptualization, R.G., C.B., A.S. and G.P.; methodology, R.G., C.B., A.S., B.K., C.H., S.K., I.Z., J.W., J.T., R.T., D.T., M.W., B.G., M.T. and J.B.; writing—original draft preparation, R.G., C.B., B.K. and A.S.; writing—review and editing, R.G., C.B., A.S. and B.K.; supervision, R.G.; funding acquisition, R.G. and D.T.

Funding

This study was supported by: NSF Center for Dark Energy Biosphere Investigations (C-DEBI), Henry Family Research Fund (MSU), and Institute for Imaging & Analytical Technologies (MSU). The cruise was funded by the National Science Foundation [award: NSF OCE 1641453]. The LA-ICP-MS instrument at the University of Rochester is partially supported by a grant from the Instrumentation and Facilities Program, Division of Earth Sciences, NSF [EAR-1545637].

Acknowledgments

We thank Bruce Watson, Karyn Rogers, Jared Singer, and Mimi Katz for fruitful discussion and sharing the lab equipment. Also, we are thankful to David Dettman and Xiaoyu Zhang for performing isotope analysis and sample preparation.

Conflicts of Interest

The authors declare no conflict of interest.

References

  1. Greinert, J.; Bohrmann, G.; Suess, E. Gas hydrate-associated carbonates and methane-venting at Hydrate Ridge: Classification, distribution, and origin of authigenic lithologies. Geophys. Monogr. Am. Geophys. Union 2001, 124, 99–113. [Google Scholar]
  2. Sun, X.; Turchin, A.V. Significant contribution of authigenic carbonate to marine carbon burial. Nat. Geosci. 2014, 7, 201–204. [Google Scholar] [CrossRef] [Green Version]
  3. Suess, E.; Torres, M.E.; Bohrmann, G.; Collier, R.W.; Greinert, J.; Linke, P.; Rehder, G.; Trehu, A.; Wallmann, K.; Winckler, G.; et al. Gas hydrate destabilization: Enhanced dewatering, benthic material turnover and large methane plumes at the Cascadia convergent margin. Earth Planet. Sci. Lett. 1999, 170, 1–15. [Google Scholar] [CrossRef]
  4. Boetius, A.; Ravenschlag, K.; Schubert, C.J.; Rickert, D.; Widdel, F.; Gieseke, A.; Amann, R.; Jùrgensen, B.B.; Witte, U.; Pfannkuche, O. A marine microbial consortium apparently mediating anaerobic oxidation of methane. Nature 2000, 407, 623–626. [Google Scholar] [CrossRef] [PubMed]
  5. McVeigh, D.; Skarke, A.; Dekas, A.E.; Borrelli, C.; Hong, W.-L.; Marlow, J.J.; Pasulka, A.; Jungbluth, S.P.; Barco, R.A.; Djurhuus, A. Characterization of benthic biogeochemistry and ecology at three methane seep sites on the Northern U.S. Atlantic margin. Deep Sea Res. Part II Top. Stud. Oceanogr. 2018, 150, 41–56. [Google Scholar] [CrossRef]
  6. Bayon, G.; Henderson, G.M.; Bohn, M. U–Th stratigraphy of a cold seep carbonate crust. Chem. Geol. 2009, 260, 47–56. [Google Scholar] [CrossRef] [Green Version]
  7. Pierre, C.; Bayon, G.; Blanc-Valleron, M.-M.; Mascle, J.; Dupré, S. Authigenic carbonates related to active seepage of methane-rich hot brines at the Cheops mud volcano, Menes caldera (Nile deep-sea fan, eastern Mediterranean Sea). Geo-Mar. Lett. 2014, 34, 253–267. [Google Scholar] [CrossRef]
  8. Donda, F.; Forlin, E.; Gordini, E.; Panieri, G.; Buenz, S.; Volpi, V.; Civile, D.; De Santis, L. Deep-sourced gas seepage andmethane-derived carbonates in the Northern Adriatic Sea. Basin Res. 2015, 27, 531–545. [Google Scholar] [CrossRef]
  9. Himmler, T.; Birgel, D.; Bayon, G.; Pape, T.; Ge, L.; Bohrmann, G.; Peckmann, J. Formation of seep carbonates along the Makran convergent margin, northern Arabian Sea and a molecular and isotopic approach to constrain the carbon isotopic composition of parent methane. Chem. Geol. 2015, 415, 102–117. [Google Scholar] [CrossRef]
  10. Rongemaille, E.; Bayon, G.; Pierre, C.; Bollinger, C.; Chu, N.C.; Fouquet, Y.; Riboulot, V.; Voisset, M. Rare earth elements in cold seep carbonates from the Niger delta. Chem. Geol. 2011, 286, 196–206. [Google Scholar] [CrossRef]
  11. Feng, D.; Chen, D. Authigenic carbonates from an active cold seep of the northern South China Sea: New insights into fluid sources and past seepage activity. Deep-Sea Res. II 2015, 122, 74–83. [Google Scholar] [CrossRef]
  12. Loyd, S.J.; Sample, J.; Tripati, R.E.; Defliese, W.F.; Brooks, K.; Hovland, M.; Torres, M.; Marlow, J.; Hancock, L.G.; Martin, R.; et al. Methane seep carbonates yield clumped isotope signatures out of equilibrium with formation temperatures. Nat. Commun. 2016, 7, 12274. [Google Scholar] [CrossRef] [PubMed] [Green Version]
  13. Skarke, A.; Ruppel, C.; Kodis, M.; Brothers, D.; Lobecker, E. Widespread methane leakage from the seafloor on the northern US Atlantic margin. Nat. Geosci. 2014, 7, 657–661. [Google Scholar] [CrossRef]
  14. Prouty, N.G.; Sahy, D.; Ruppel, C.D.; Roark, E.B.; Condon, D.; Brooke, S.; Ross, S.W.; Demopoulos, A.W.J. Insights into methane dynamics from analysis of authigenic carbonates and chemosynthetic mussels at newly-discovered Atlantic Margin seeps. Earth Planet. Sci. Lett. 2016, 449, 332–344. [Google Scholar] [CrossRef] [Green Version]
  15. Fallon, S.J.; White, J.C.; McCulloch, M.T. Porites corals as recorders of mining and environmental impacts: Misima Island, Papua New Guinea. Geochim. Cosmochim. Acta 2002, 66, 45–62. [Google Scholar] [CrossRef]
  16. Hathorne, E.C.; Alard, O.; James, R.H.; Rogers, N.W. Determination of intratest variability of trace elements in foraminifera by laser ablation inductively coupled plasma-mass spectrometry. Geochem. Geophy. Geosyst. 2003, 4, 8408. [Google Scholar] [CrossRef]
  17. Barats, A.; Pécheyran, C.; Amouroux, D.; Debascoux, S.; Chauvaud, L.; Donard, O.F.X. Matrix-matched quantitative analysis of trace-elements in calcium carbonate shells by laser-ablation ICP–MS: Application to the determination of daily scale profiles in scallop shell (Pecten maximus). Anal. Bioanal. Chem. 2007, 387, 1131–1140. [Google Scholar] [CrossRef] [PubMed]
  18. Tanaka, K.; Takahashi, Y.; Shimizu, H. Determination of rare earth element in carbonate using laser-ablation inductively-coupled plasma mass spectrometry: An examination of the influence of the matrix on laser-ablation inductively-coupled plasma mass spectrometry analysis. Anal. Chim. Acta 2007, 583, 303–309. [Google Scholar] [CrossRef] [PubMed]
  19. Wark, D.A.; Watson, E.B. Grain-scale permeabilities of texturally equilibrated, monomineralic rocks. Earth Planet. Sci. Lett. 1998, 164, 591–605. [Google Scholar] [CrossRef]
  20. Woodhead, J.D.; Hellstrom, J.; Hergt, J.M.; Greig, A.; Maas, R. Isotopic and elemental imaging of geological materials by Laser Ablation Inductively Coupled Plasma-Mass Spectrometry. Geostand. Geoanal. Res. 2007, 31, 331–343. [Google Scholar] [CrossRef]
  21. Paton, C.; Hellstrom, J.; Paul, B.; Woodhead, J.; Hergt, J. Iolite: Freeware for the visualisation and processing of mass spectrometric data. J. Anal. Atom. Spectrom. 2011, 26, 2508–2518. [Google Scholar] [CrossRef]
  22. Outridge, P.M.; Doherty, W.; Gregoire, D.C. Ablative and transport fractionation of trace elements during laser sampling of glass and copper. Spectrochim. Acta B 1997, 52, 2093–2102. [Google Scholar] [CrossRef]
  23. Guillong, M.; Horn, I.; Günter, D. A comparison of 266 nm, 213 nm and 193 nm produced from a single solid state Nd:YAG laser for laser ablation ICP-MS. J. Anal. At. Spectrom. 2003, 18, 230. [Google Scholar] [CrossRef]
  24. Kim, S.-T.; O’Neil, J.R.; Hillaire-Marcel, C.; Mucci, A. Oxygen isotope fractionation between synthetic aragonite and water: Influence of temperature and Mg2+ concentration. Geochim. Cosmochim. Acta 2007, 71, 4704–4715. [Google Scholar] [CrossRef]
  25. Hesse, R.; Harrison, W.E. Gashydrates (clathrates) causing pore-water freshening and oxygen isotope fractionation in deep-water sedimentary sections of terrigenous continental margins. Earth Planet. Sci. Lett. 1981, 55, 453–462. [Google Scholar] [CrossRef]
  26. Sheppard, S.M.F.; Gilg, H.A. Stable isotope geochemistry of clay minerals. Clay Miner. 1996, 31, 1–24. [Google Scholar] [CrossRef]
  27. Tryon, M.D.; Henry, P.; Çağatay, M.N.; Zitter, T.A.C.; Géli, L.; Gasperini, L.; Burnard, P.; Bourlange, S.; Grall, C. Pore fluid chemistry of the North Anatolian Fault Zone in the Sea of Marmara: A diversity of sources and processes. Geochem. Geophys. Geosyst. 2010, 11, Q0AD03. [Google Scholar] [CrossRef]
  28. Crémière, A.; Bayon, G.; Ponzevera, E.; Pierre, C. Paleo-environmental controls on cold seep carbonate authigenesis in the Sea of Marmara. Earth Planet. Sci. Lett. 2013, 376, 200–211. [Google Scholar] [CrossRef]
  29. Testa, M. Imaging Calcium Carbonate Crystallization in Association with Organic Compounds. Ph.D. Thesis, Mississippi State University, Starkville, MS, USA, 2017. [Google Scholar]
  30. Burton, E.A. Controls on marine carbonate cement mineralogy: Review and reassessment. Chem. Geol. 1993, 105, 163–179. [Google Scholar] [CrossRef]
  31. Aloisi, G.; Bouloubassi, I.; Heijs, S.K.; Pancost, R.D.; Pierre, C.; Sinninghe Damsté, J.S.; Gottschal, J.C.; Forney, L.J.; Rouchy, J.-M. CH4-consuming microorganisms and the formation of carbonate crusts at cold seeps. Earth Planet. Sci. Lett. 2002, 203, 195–203. [Google Scholar] [CrossRef]
  32. Luff, R.; Wallmann, K. Fluid flow, methane fluxes, carbonate precipitation and biogeochemical turnover in gas hydrate-bearing sediments at Hydrate Ridge, Cascadia Margin: Numerical modeling and mass balances. Geochim. Cosmochim. Acta 2003, 3403–3421. [Google Scholar] [CrossRef]
  33. Nöthen, K.; Kasten, S. Reconstructing changes in seep activity by means of pore water and solid phase Sr/Ca and Mg/Ca ratios in pockmark sediments of the Northern Congo Fan. Mar. Geol. 2011, 287, 1–13. [Google Scholar] [CrossRef]
  34. Zhang, F.; Xu, H.; Konishi, H.; Kemp, J.M.; Roden, E.E.; Shen, Z. Dissolved sulfide-catalyzed precipitation of disordered dolomite: Implications for the formation mechanism of sedimentary dolomite. Geochim. Cosmochim. Acta 2012, 97, 148–165. [Google Scholar] [CrossRef]
  35. Zhang, F.; Yan, C.; Teng, H.H.; Roden, E.E.; Xu, H. In situ AFM observations of Ca–Mg carbonate crystallization catalyzed by dissolved sulfide: Implications for sedimentary dolomite formation. Geochim. Cosmochim. Acta 2013, 105, 44–55. [Google Scholar] [CrossRef]
  36. Canfield, D.E.; Farquhar, J. Animal evolution, bioturbation, and the sulfate concentration of the oceans. PNAS 2009, 106, 8123–8127. [Google Scholar] [CrossRef] [PubMed] [Green Version]
  37. Tostevin, R.; Turchyn, A.V.; Farquhar, J.; Johnston, D.T.; Eldridge, D.L.; Bishop, J.K.B.; McIlvin, M. Multiple sulfur isotope constraints on the modern sulfur cycle. Earth Planet. Sci. Lett. 2014, 396, 14–21. [Google Scholar] [CrossRef] [Green Version]
  38. Joseph, C.; Campbell, K.A.; Torres, M.E.; Martin, R.A.; Pohlman, J.W.; Riedel, M.; Rose, K. Methane-derived authigenic carbonates from modern and paleoseeps on the Cascadia margin: Mechanisms of formation and diagenetic signals. Palaeogeogr. Palaeoclim. Palaeoecol. 2003, 390, 52–67. [Google Scholar] [CrossRef]
  39. Bayon, G.; Pierre, C.; Etoubleau, J.; Voisset, M.; Cauquil, E.; Marsset, T.; Sultan, N.; Le Drezen, E.; Fouquet, Y. Sr/Ca and Mg/Ca ratios in Niger Delta sediments: Implications for authigenic carbonate genesis in cold seep environments. Mar. Geol. 2007, 241, 93–109. [Google Scholar] [CrossRef]
  40. Crémière, A.; Lepland, A.; Chand, S.; Sahy, D.; Kirsimäe, K.; Bau, M.; Whitehouse, M.J.; Noble, S.R.; Martma, T.; Thorsnes, T.; et al. Fluid source and methane-related diagenetic processes recorded in cold seep carbonates from the Alvheim channel, central North Sea. Chem. Geol. 2016, 432, 16–33. [Google Scholar] [CrossRef]
  41. Campbell, K.A. Hydrocarbon seep and hydrothermal vent paleoenvironments and paleontology: Past developments and future research directions. Palaeogeogr. Palaeoclim. Palaeoecol. 2006, 232, 362–407. [Google Scholar] [CrossRef]
  42. McGinnis, D.F.; Greinert, J.; Artemov, Y.; Beaubien, S.E.; Wüest, A. Fate of rising methane bubbles in stratified waters: How much methane reaches the atmosphere? J. Gephys. Res. 2006, 111, C09007. [Google Scholar] [CrossRef]
  43. Biastoch, A.; Treude, T.; Rüpke, L.H.; Riebesell, U.; Roth, C.; Burwicz, E.B.; Park, W.; Latif, M.; Böning, C.W.; Madec, G.; et al. Rising Arctic Ocean temperatures cause gas hydrate destabilization and ocean acidification. Geophys. Res. Lett. 2011, 38, L08602. [Google Scholar] [CrossRef]
  44. Naehr, T.H.; Eichhubl, P.; Orphan, V.J.; Hovland, M.; Paull, C.K.; Ussler, W.; Lorenson, T.D.; Greene, H.G. Authigenic carbonate formation at hydrocarbon seeps in continental margin sediments: A comparative study. Deep-Sea Res. II Top. Stud. Oceanogr. 2007, 54, 1268–1291. [Google Scholar] [CrossRef]
  45. Marlow, J.J.; Steele, J.A.; Ziebis, W.; Thurber, A.R.; Levin, L.A.; Orphan, V.J. Carbonate-hosted methanotrophy represents an unrecognized methane sink in the deep sea. Nat. Commun. 2014, 5, 5094. [Google Scholar] [CrossRef] [PubMed] [Green Version]
Figure 1. (A) Location of methane seeps at Veatch Canyon located (US Atlantic margin) determined using water-column backscatter data. (B) Collection of carbonate crust samples using robotic arm (1 Dive Site). (C) Sample: AD4835-BB4-S22; original location is preserved; time collected [GMT]: 18:50:51 August 6, 2016. (D) Picture of the sliced rock (30 cm width).
Minerals 09 00138 g001
Figure 2. XRD spectra of carbonate crust, aragonite (Ar), and quartz (Q). The presence of albite (Ab) is in question.
Minerals 09 00138 g002
Figure 3. (A) Optical micrograph of polished carbonate crust sample (GM = groundmass (grey aragonite cement with non-carbonate inclusions), Q = quartz); (B) SEM image of white aragonite cement crystals coated with platinum; (C) Optical micrograph (ppl) of thin section showing fractured sandstone (lower right corner) lined with large aragonitic botryoids (i.e., AcAr = acicular aragonite).
Minerals 09 00138 g003
Figure 4. Elemental plots of all data collected in aragonite cement and AcAr crystals with LA-ICP-MS. Correlation of Si and Al, data with minimal contents of Si and Al (i.e., deviation from Si-Al trend) are labeled (A); correlation of Mn with Fe (B); S-Fe plot (C); magnified S-Fe plot (D), here arrows show the predicted stoichiometric lines for pyrite and troilite assuming that those minerals are the only sources for Fe and S.
Minerals 09 00138 g004
Figure 5. Comparison of Mg/Ca, Sr/Ca, and Ba/Ca between cement (GM), AcAr, and literature data.
Minerals 09 00138 g005
Table 1. Laser-ablation system and operation conditions.
ICP-MS in Laser-Ablation Mode
InstrumentAglient 7900
Carrier gas flow rateAr: 1.3 L/min
Gas flow in the collision reaction cellHe: 0.5 mL/min
Isotopes23Na, 24,25,26Mg, 27Al, 29Si, 33,34S, 39K, 43,44Ca
Monitored54,56,58Fe, 55Mn, 88Sr, 90,91Zr, 137,138Ba, 235,238U
Background acquisition time60 s
Data acquisition time20 s
Laser-Ablation System
InstrumentCETAC
Beam193 nm excimer
Fluence4.72 J/cm2
Repetition rate5 Hz
Shot count150
He gas flow rate0.6 L/min (MFC1)
0.2 L/min (MFC2)
Laser spot diameter40 µm
Table 2. Elemental ratios of AcAr from rock slabs 6 and 7.
Spot # *Mg/CaS/CaSr/CaBa/CaU/Ca
Slab-6
420.7910.98613.36625.2922.195
430.5310.76511.26413.7030.870
562.9651.25811.36713.7762.994
570.9140.81211.08115.3791.783
580.6100.7349.2538.7470.690
592.0391.13311.35516.2542.044
671.8490.90811.65214.4322.271
701.7710.83310.48713.4841.114
752.0920.59910.62413.9941.817
average1.5070.89211.16115.0071.753
s.d.0.8340.2061.0944.3810.743
Slab-7
240.6840.5998.9336.9970.891
400.4590.65610.4538.7470.673
410.6590.6997.7689.6941.165
420.6180.6687.97411.6621.034
430.4570.64010.3969.0380.576
440.6510.65910.29310.4960.984
450.6750.6528.13410.7151.009
average0.6000.6539.1369.6210.905
s.d.0.0990.0301.2201.5340.210
Element concentrations were determined through data reduction using the carbonate standard MACS-3. Data are reported in the Table S4. Mg/Ca, S/Ca, and Sr/Ca are in mmol/mol; Ba/Ca and U/Ca are in µmol/mol. s.d. = standard deviation. * Spot # is identified as “Source file” in Table S4.
Table 3. Stable isotope analysis.
Samplesδ13CVPDBδ18OVPDB
LR-1−50.250.084.530.1
LR-2−49.810.084.500.1
LR-3−50.190.084.530.1
average−50.09 4.52
1s.d.0.24 0.02
1σ is an analytical uncertainty; 1s.d. is a standard deviation between analyses of three samples.

