Formulating Operational Mitigation Options and Examining Intra-Urban Social Inequality Using Evidence-Based Urban Warming Effects
 Yuanhui Zhu
 Soe W. Myint
 Danica Schaffer-Smith2,3
  Rebecca L. Muenich
 Yubin Li
- 1School of Geographical Sciences and Urban Planning, Arizona State University, Tempe, AZ, United States
- 2School of Life Sciences, Arizona State University, Tempe, AZ, United States
- 3The Nature Conservancy, Durham, NC, United States
- 4School of Sustainable Engineering, Arizona State University, Tempe, AZ, United States
Human-induced climate change is bringing warmer conditions to the Southwestern United States. More extreme urban heat island (UHI) effects are not distributed equally, and often impact socioeconomically vulnerable populations the most. This study aims to quantify how land surface temperature (LST) changes with increasing green vegetation landscapes, identify disparities in urban warming exposure, and provide a method for developing evidence-based mitigation options. ECOSTRESS LST products, detailed land use and land cover (LULC) classes, and socioeconomic variables were used to facilitate the analysis. We examined the relationship between LST and the fractions of LULC and socioeconomic factors in the city of Phoenix, Arizona. A machine learning approach (Random Forest) was used to model LST changes by taking the LULC fractions (scenario-based approaches) as the explanatory variables. We found that vegetation features—trees, grass, and shrubs—were the most important factors mitigating UHI effects during the summer daytime. Trees tended to lower surface temperature more effectively, whereas we observed elevated daytime LST most often near roads. Meanwhile, higher summer daytime temperatures were observed on land with unmanaged soil compared to the built environment. We found that affluent neighborhoods experienced lower temperatures, while low-income communities experienced higher temperatures. Scenario analyses suggest that replacing 50% of unmanaged soil with trees could reduce average summer daytime temperatures by 1.97°C if the intervention was implemented across all of Phoenix and by 1.43°C if implemented within the urban core only. We suggest that native trees requiring little to no additional water other than rainfall should be considered. We quantify mitigation options for urban warming effect under vegetation management interventions, and our results provide some vital insight into existing disparities in UHI impacts. Future UHI mitigation strategies seriously need to consider low-income communities to improve environmental justice. These can be used to guide the development of sustainable and equitable policies for vegetation management to mitigate heat exposure impacts on communities.
1 Introduction
Urbanization, or the conversion of natural landscapes to the human-built environment, is driven by population growth and socioeconomic development (Bettencourt et al., 2007; Grimm et al., 2008; Peng et al., 2012; Seto et al., 2012). These changes in land use and land cover (LULC) can cause land surface temperature (LST) changes through alteration of the albedo, roughness, and heat flux exchange of the land surface in urban and sub-urban environments (Estoque et al., 2017; Singh et al., 2017). The LULC changes are accompanied by well-known urban heat island (UHI) issues. The UHI is a particularly important issue because it is leading to substantial challenges to urban ecosystem functionality (e.g., the loss of vegetation), the increase of energy and water consumption, and heightened risks of heat-related mortality and morbidity among vulnerable groups (Chen et al., 2006; Tran et al., 2006; Buyantuyev and Wu, 2010; Zhou et al., 2011; Jesdale et al., 2013; Wang et al., 2018). To counterbalance these negative impacts, formulating operational UHI mitigation options and examining intra-urban social inequality are needed.
Most studies focus on the effect of LULC changes, impervious surface expansion, and landscape configuration on UHI (Dousset and Gourmelon, 2003; Voogt and Oke, 2003; Weng et al., 2004; Chen et al., 2006; Tran et al., 2006; Weng, 2009). There is substantial evidence that urbanization drives LULC changes (e.g., vegetated features converted to built-up areas), which also impacts LST (Pan et al., 2019). Moreover, socioeconomic disparities are well recognized factors in connection to UHI, and these factors merit attention in identifying UHI problem areas and developing solutions (Harlan et al., 2006). It is essential to identify the inequalities in LST exposure associated with different socioeconomic groups. Hence, the available socioeconomic data need to be assessed to explain observed LST distributions. LST has disproportionately influenced the neighborhoods with family types and dwellings, where areas with low-income, higher Black and Hispanic populations may experience higher levels of UHI (Oreszczyn et al., 2006; Mashhoodi, 2021). Previous studies on LST and social inequality have focused on the cities of Phoenix, New York, Los Angeles and Chicago (Jenerette et al., 2011; Chow et al., 2012; Mitchell and Chakraborty, 2015). For example, urban residents in metropolitan Phoenix with lower income usually face greater risk of heat stress than wealthier neighborhoods because the latter can afford air conditioning and water to supply green vegetation (Harlan et al., 2006; Chow et al., 2012). The more limited resources available to socially vulnerable populations raise inequality concerns (Li et al., 2016; Tang et al., 2017; Li et al., 2020). Therefore, more attention should be paid to socioeconomic disparities in connection to LST.
UHI is a particularly important issue for the desert cities of southwestern United States, as climate change is bringing even hotter and drier conditions to the region, which is experiencing substantial population growth (Christensen and Lettenmaier, 2007; Seager et al., 2007; Barnett and Pierce, 2008). For example, Phoenix, Arizona’s mean daily temperature has increased by 3.1°C during the last 50 years due to climate change and rapid urbanization, while summer nighttime temperatures have increased by as much as 6°C (Brazel et al., 2000). The conversion to built-up areas from all other LULC types has been determined as the dominant cause of the UHI effect in Phoenix (Wang C. et al., 2016). However, desert cities do not fit the conventional UHI trend but show unique patterns of LST variation. For arid desert regions specifically, tree cover typically reduces summer daytime temperature more effectively than grass, while unmanaged soil and dark impervious surfaces (e.g., asphalt surfaces) elevate temperature more than buildings (Myint et al., 2013; Zhang et al., 2019). Urban areas in desert cities can be cooler in summer than suburban regions where vegetation is sparse, and unmanaged soil is the primary reflecting surface (Xian and Crane, 2006; Lazzarini et al., 2013; Myint et al., 2013). Unlike other cities, higher densities of built infrastructure are not necessarily responsible for extreme heat in desert communities (Hartz et al., 2006; Cui and De Foy, 2012; Lazzarini et al., 2013). However, there is an emerging need to explore the UHI in harsh environments to develop effective and practical solutions that can be implemented immediately to mitigate urban warming effects.
Maintaining and enhancing urban vegetation is a well-tested mitigation and adaptation strategy for UHI in arid desert areas (Bowler et al., 2010; Myint et al., 2010; Huang and Cadenasso, 2016). Green vegetation surfaces store less heat than unmanaged soil, buildings, parking lots, streets, and other impervious surfaces, although the impact of trees, shrubs, and grass on the UHI may vary (Guhathakurta and Gober, 2010; Myint et al., 2010; Myint et al., 2013). It has been widely accepted that increasing green vegetation surfaces can effectively mitigate UHI (Weng et al., 2004; Zhou et al., 2011; Li et al., 2013). Studies in the Sonoran and Mojave Deserts, and the Phoenix Metropolitan Area specifically, have demonstrated that areas dominated by drought tolerant shrubs and woody plants show strong daytime transpirative cooling effects (Smith, 1978; Hamerlynck et al., 2000; Wang et al., 2019). Consequently, there is an increased interest in the effect of both the type and extent of greenspace on the level of UHI and formulating operational action plans to mitigate urban warming effects. In addition, the intensity of cooling effects on LST by increasing green space need to be quantified to provide insights for green infrastructure planning and management. However, most impervious surfaces in urban centers cannot realistically be changed or replaced by other LULC features with less heat storage to mitigate the UHI effect. Opportunities may exist to convert areas of unmanaged soil in desert cities to green vegetation to lower LST. This is an operational UHI mitigation option in desert cities. However, there is a lack of research on determining the intensity of heat reduction possible in response to the level of conversion from unmanaged soil to green vegetation biomass.
Remotely sensed data is well-suited for examining the relationships between urban LULC and LST (Voogt and Oke, 2003; Lu and Weng, 2006; Connors et al., 2013; Myint et al., 2013; Maimaitiyiming et al., 2014; Fan et al., 2015; Myint et al., 2015; Wang C. et al., 2016). To define urban heat islands, LST derived from remote sensing data is widely used as an indicator. Satellite-based LST is considered superior to other types of sensors (e.g., urban weather station, flux tower) for tracking spatial distributions of temperature (Nichol and To, 2012). Thermal remote sensing sources can retrieve LST across a wide range of the earth surface at various temporal and spatial scales (Chen et al., 2006). LST has been studied with different space-borne sensors at different spatial resolutions, including the Moderate Resolution Imaging Spectroradiometer (MODIS; 1-km) (Tran et al., 2006), Advanced Very High Resolution Radiometer (AVHRR; 1-km) (Streutker, 2003), LANDSAT (60–90-m) (Chen et al., 2006), and the Advanced Spaceborne Thermal Emission and Reflection Radiometer (ASTER; 90-m) (Stathopoulou et al., 2009). NASA’s ECOsystem Spaceborne Thermal Radiometer Experiment on Space Station (ECOSTRESS), launched in June 2018, covers several key biomes of the terrestrial biosphere using surface temperature information measured from the thermal infrared (TIR) bands (Hulley et al., 2017; Hook and Hulley, 2019). It can be used to study the heat stress of urban green spaces and provide surface temperature and emissivity (Level 2 product, 70-m) with high spatiotemporal resolution.
This study aims to fill the gap in managing vegetation to reduce urban heat island impacts and examine intra-urban social inequality. We applied an evidence-based approach, a problem-solving tactic using features, objects, phenomena, and changes apparent in remotely sensed data, to mitigate urban warming effects by intervening the key contributing factors of LST. We investigate satellite-based LST across the city of Phoenix, Arizona and examine the relationship between LST measurements, detailed LULC, as well as socioeconomic factors to understand LST patterns and the distribution of heat exposure. We employ scenario analyses to predict the LST changes that could result from urban vegetation management interventions aimed at improving urban sustainability and the quality of life.
2 Materials and Methods
2.1 Study Area
Phoenix is the sixth most populous city in the United States with an estimated population of approximately 1.68 million (2019) within a 1,941 km2 area (United States Census Bureau, 2019; Zhang et al., 2019) (Figure 1). Phoenix has a subtropical desert climate with mild winters and scorching summers; daily maximum temperatures exceed 38°C throughout summer, making Phoenix the hottest city in the United States. Average annual precipitation is 195 mm (Fan et al., 2015), with most rainfall attributed to winter storms from December to March, or the monsoon season from July to September. The study area is characterized by a diversity of urban land use and land cover classes, including impervious surfaces (road and building), agriculture (active cropland, orchard, and fallow), shrub, tree, grass, unmanaged soil, and water (permanent river and canal, seasonal river, swimming pool). Phoenix is continuing to experience rapid urbanization, tracking with global trends toward development of desert environments (Wang et al., 2019), and represents a key case study for understanding urban-induced climate change.
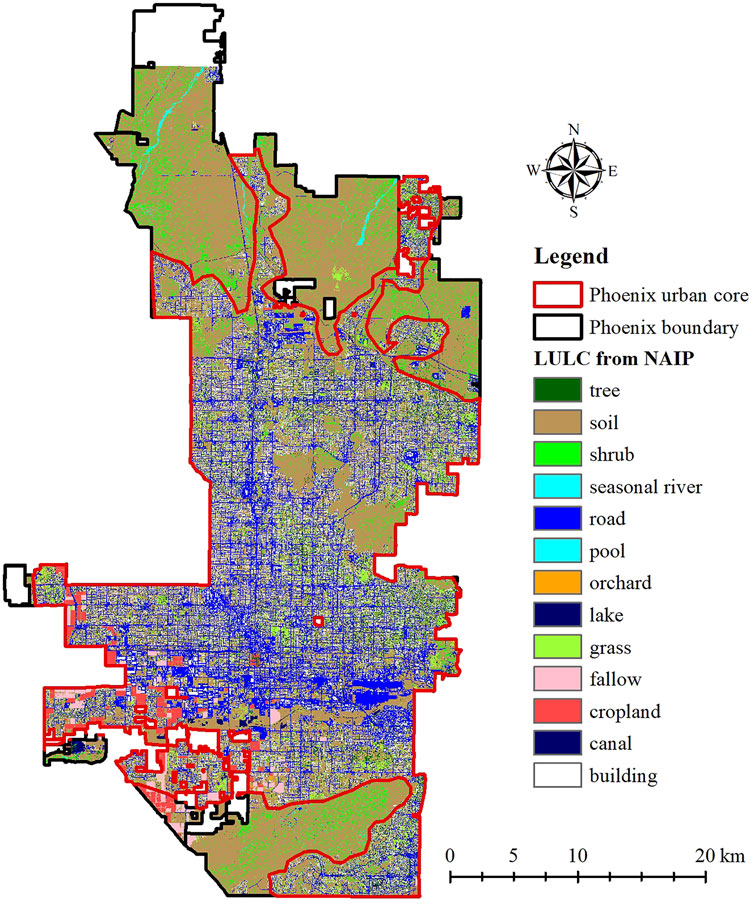
FIGURE 1. Land use and land cover map derived from 1-m resolution data acquired by the National Agricultural Imagery Program (NAIP) within the city limits of Phoenix, Arizona.
2.2 Data and Methods
We employed high-resolution LULC and socioeconomic variables collected at the U.S. Census block group level, and satellite-derived 70 m LST measurements. To understand the distribution of UHI across Phoenix, we explored the spatial correlation of the LST, LULC fractions, socioeconomic and demographic variables. To identify options for UHI mitigation within the city boundaries, we then developed random forest (RF) algorithms to model LST changes with LULC composition changes. We examined UHI within the entire extent of Phoenix, and also within the urban core areas of the city alone (Figure 1). We manually delineated regions with a high density of anthropogenic features and settlements (i.e., residential, commercial, industrial land uses) as the “urban core” and excluded open spaces in outlying areas within the city boundary. The majority of Phoenix’s population resides in the urban core, which is subject to more serious water uses and heat-related health problems linked to the UHI effect (Gober et al., 2009). A flow chart that demonstrates the data processing and analytical procedure used in this study is presented in Figure 2.
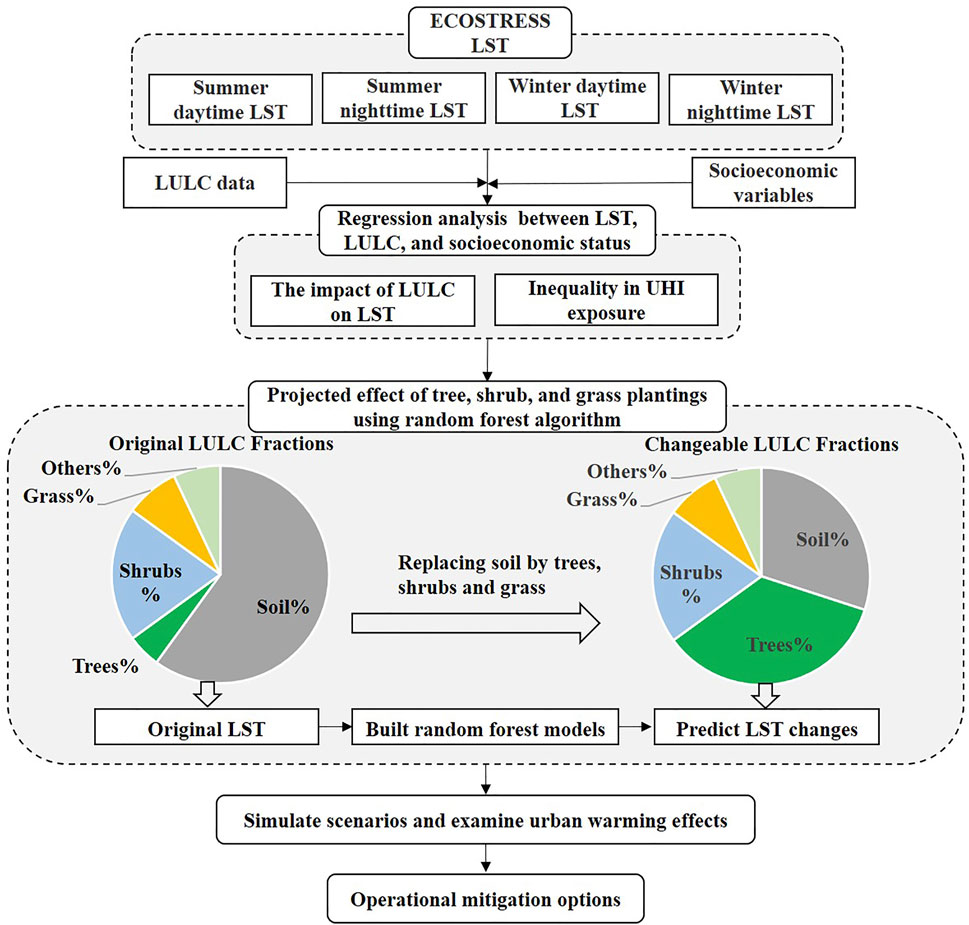
FIGURE 2. Data processing and analytical procedure.
2.2.1 ECOSTRESS Data and LST Products
To explore the UHI phenomenon in Phoenix, we used ECOSTRESS data. ECOSTRESS consists of five thermal infrared (TIR) bands (Hulley et al., 2017). ECOSTRESS data have been available since June 29, 2018 with global coverage. We used the 70 m surface temperature and emissivity (Level 2) product which is available on a 3–5 days interval. The LST product (ECO2LSTE v001) is derived from five TIR bands based on a physics-based Temperature/Emissivity Separation (TES) algorithm (Hook and Hulley, 2019). We chose three scenes per season to reflect seasonal daytime and nighttime differences (Table 1). A total of 622,179 observations derived from ECOSTRESS LST within Phoenix City area were obtained for each selected time period.
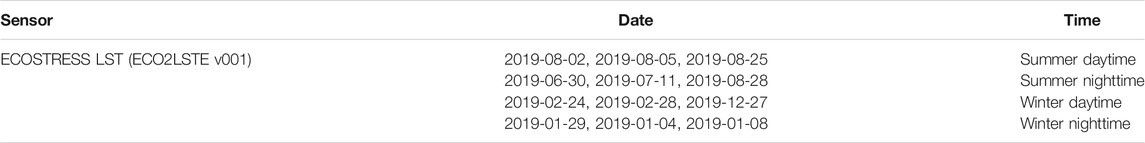
TABLE 1. List of the selected ECOSTRESS LST products in different periods.
2.2.2 Land Use and Land Cover Data
To explore the relationship between LST and LULC, we obtained a high-resolution land cover map derived from NAIP. NAIP 1-m images have four bands, including red, green, blue, and infrared wavelengths. The images of the study area were acquired on June 10, 2010 during the growing season (Li et al., 2014). As part of the Central Arizona-Phoenix Long Term Ecological Research Program, the Aerial Photography Field Office (APFO) generated the LULC map using an object-based image analysis (OBIA) method leveraging multiple image segmentation algorithms to achieve an overall accuracy of 91.9% (Li et al., 2014). The final land cover classification included thirteen detailed LULC classes, including buildings, roads, unmanaged soil, trees, shrubs, grass, fallow, swimming pools, seasonal rivers, lakes, canals, cropland, and orchards (Figure 1).
2.2.3 Socioeconomic Variables
When evaluating UHI relationship with communities, social and economic factors are important considerations. The increased UHI is not caused by socioeconomic variables, rather UHI spatial disparities are related to the characteristics of these variables. To explore the relationship between the spatial distribution of LST and socioeconomic characteristics, we used data from the U.S. Census (https://www.census.gov/en.html). The most recent census (2019) provided a variety of socioeconomic variables, including household property values, median household income, per capita income, and poverty status of household at the block group level based on 5-year American Community Survey (ACS) estimates. We selected the percentage of household below poverty level reported at the block group level, which was calculated based on the number of households with the income below poverty level divided by the total number of households in each block.
2.2.4 Assessing the Relationship Between LST, LULC, and Socioeconomic Status
We obtained ECOSTRESS-based LST, high resolution LULC, and socioeconomic and demographic variables collected at the U.S. Census block group level to explore the contributing factors or effects of LST. Univariate regression models were used to quantify the relationship between LST and other variables. Some preprocessing was required to examine these datasets together, which were in different formats, derived from different sources.
To minimize errors that might occur due to misregistration of ECOSTRESS or random error, and temperature variation, we calculated the mean LST from the set of three distinct scenes representing each season and time of day combination (summer daytime, summer nighttime, winter daytime, and winter nighttime) (Figure 3). For each 70-m LST pixel, we computed the fraction of each LULC class and the proximity to buildings and roads within 100 m.
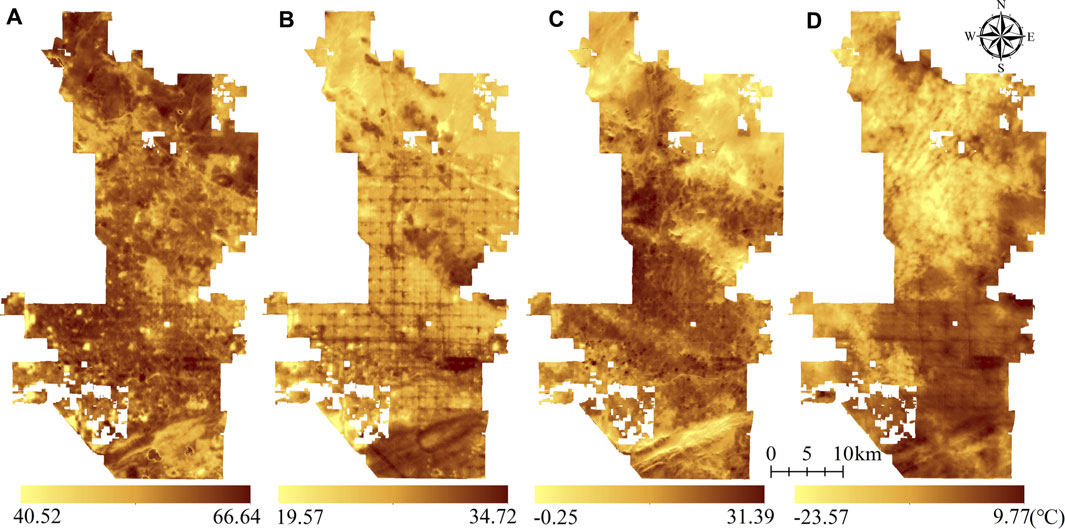
FIGURE 3. Land surface temperature derived from ECOSTRESS data over Phoenix during (A) summer daytime, (B) summer nighttime, (C) winter daytime, and (D) winter nighttime.
Anthropogenic features (buildings and roads) representing urban development intensity have been demonstrated to significantly increase LST (Pan et al., 2019). Decreasing the extent of anthropogenic features can be one of the most effective approaches to mitigate UHI. We explored the combined effects of vegetation cover and development intensity to better understand the potential for vegetation planting to lower LST. To better understand the effect of landscape factors on UHI, we considered the combined effects of vegetation cover and development intensity by multiplying the tree cover fraction by proximity to buildings and roads for each 70-m pixel. We selected proximity to buildings and roads within 0–100 m because we assumed a negligible effect of building and roads on LST beyond 100 m.
In order to explore LST disparities in socioeconomic variables, average LST was calculated for each census block group within Phoenix’s urban core areas, because most of the population resides in the urban core. Block groups (BGs) are statistical divisions of census tracts used by the United States Census Bureau which are the smallest unit for sample data published by the Bureau. They generally contain clusters of blocks within the same census tract and have between 600 and 3,000 people. Please note that our study area contained 974 block groups in 2019. Each block group included the mean LST and associated socioeconomic variables. Regression analyses were conducted to examine the relationship between household property values, median household income, per capita income, poverty status of household and LST at the block group level.
2.2.5 Simulating Scenarios of LST Changes
We expected that increasing the extent of green vegetation in areas that are currently dominated by unmanaged soil would help to mitigate the UHI effect. To explore the relative effectiveness of trees, shrubs, and grass vegetation for mitigating UHI, we developed models to simulate LST changes associated with planting each type of vegetation in unmanaged soil regions of Phoenix. LULC fractions (proportion of LULC with 1 m resolution at 70 m × 70 m grid) were used to model LST changes because spatial disparities of LST are mainly caused by landscape heterogeneity in a specific area.
We used RF approaches to model LST changes that would result from replacing 10, 20, 30, 40, and 50% of unmanaged soil with trees, shrubs, or grass, respectively. We select replacing 10–50% of unmanaged soil as simulating scenarios considering the feasibility of the options and applicability of the level of operations depending on budget constraints. We randomly selected 70% of pixels to train the RF models, and the remaining pixels to validate the accuracies of our models. To account for spatial variation in LST due to landscape heterogeneity, we incorporated observed LST for pixels with a range of landscape composition—specifically with a range of proportional cover of each type of vegetation (trees, grass, and shrubs). We incorporated additional static variables, including the fraction of river, road, pool, orchard, lake, fallow, cropland, canals, and buildings for the lands converted from unmanaged soil to vegetation. For all of Phoenix and the Phoenix urban core only (Figure 1), we calculated the mean LST change under each intervention scenario.
Meanwhile, we also quantified the most influential factors affecting UHI mitigation effectiveness using the RF variable importance. The RF algorithm combines bootstrap aggregating and random feature selection to build decision trees. In this process, it randomly uses 2/3 of the samples as “in-bag data” and the remaining samples as “out-of-bag data” (OOB) to measure the model’s error. The importance of each input variable (LULC fractions) was quantified using the mean decrease in accuracy (MDA)—the OOB model’s error difference between the original dataset and a dataset with the randomly permutated input variable.
3 Results
3.1 Regression Analysis Between LULC Fractions and LST
For summer daytime, all LULC fractions had a significant correlation with surface LST (Figure 4). Road fraction had the most significant association (slope = 0.0244) with daytime summer surface temperature, followed by unmanaged soil fraction (slope = 0.0178). Building and seasonal river fractions had comparatively smaller effects on LST. Shrub fractions had a weak positive association (slope = 0.0032) with LST. Shrub vegetation most commonly occurs in suburban areas where unmanaged soil is the dominant LULC class. Therefore, we expect that these areas’ temperatures are primarily influenced by unmanaged soil and show a higher trend than the urban core. The other nine LULC classes had a consistently negative relationship with LST; tree (slope = −0.0847) and grass (slope = −0.0590) fractions showed the strongest UHI mitigating effect. Lake, cropland, fallow, orchard, canal, and pool fractions also had negative associations with summer daytime LST. These LULC classes involve either vegetation or water, thus lowering daytime surface temperatures in the summer. Pool fractions showed the weakest UHI mitigating effect (slope = −0.0055) on summer daytime temperature.
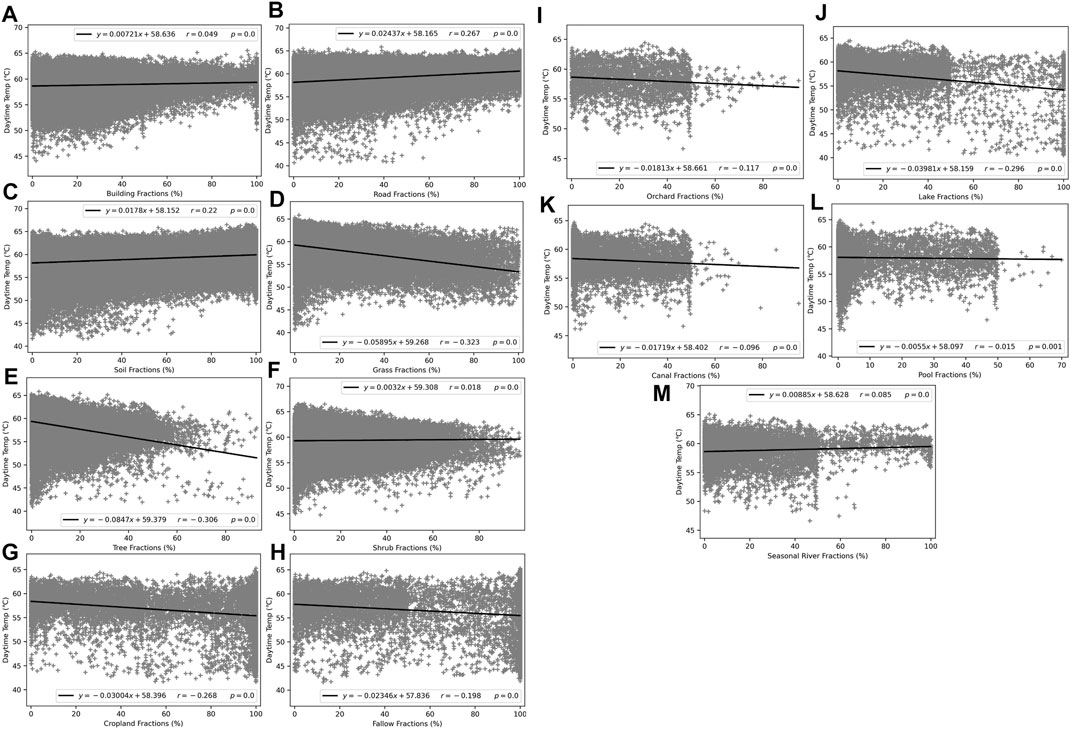
FIGURE 4. Relationships between summer daytime LST and LULC fractions in Phoenix including the percent cover of (A) road, (B) building, (C) active cropland, (D) orchard, (E) fallow, (F) shrub, (G) tree, (H) grass, (I) unmanaged soil, (J) permanent river, (K) canal, (L) seasonal river, and (M) swimming pool, determined by linear regression.
For summer nighttime, we selected key variables (building, road, tree, grass, shrub, and soils) to explore the relationship between LULC classes and LST. These classes are the most critical factors for urban surface temperatures (Myint et al., 2010; Myint et al., 2013; Li et al., 2016). We found that summer nighttime temperatures were related with a selected set of LULC classes (Figure 5). Anthropogenic features did not all have the same relationship with LST. Road fractions were weakly positively correlated with summer nighttime temperatures (slope = 0.0185). In contrast, building fractions have a weak cooling effect (slope = −0.0013). Vegetation cover (trees, shrubs, and grass) presents significant negative correlations with LST, with slopes of −0.02349 for trees, −0.00672 for shrubs, and −0.02678 for grass. While trees and grass seem to effectively lower summer nighttime temperature, shrub fractions have a weaker mitigating influence. We also found that soils can lower summer nighttime surface temperature slightly (slope = −0.00549). The relationship between LULC classes and LST in winter daytime and winter nighttime is detailed in the Supplementary Material.
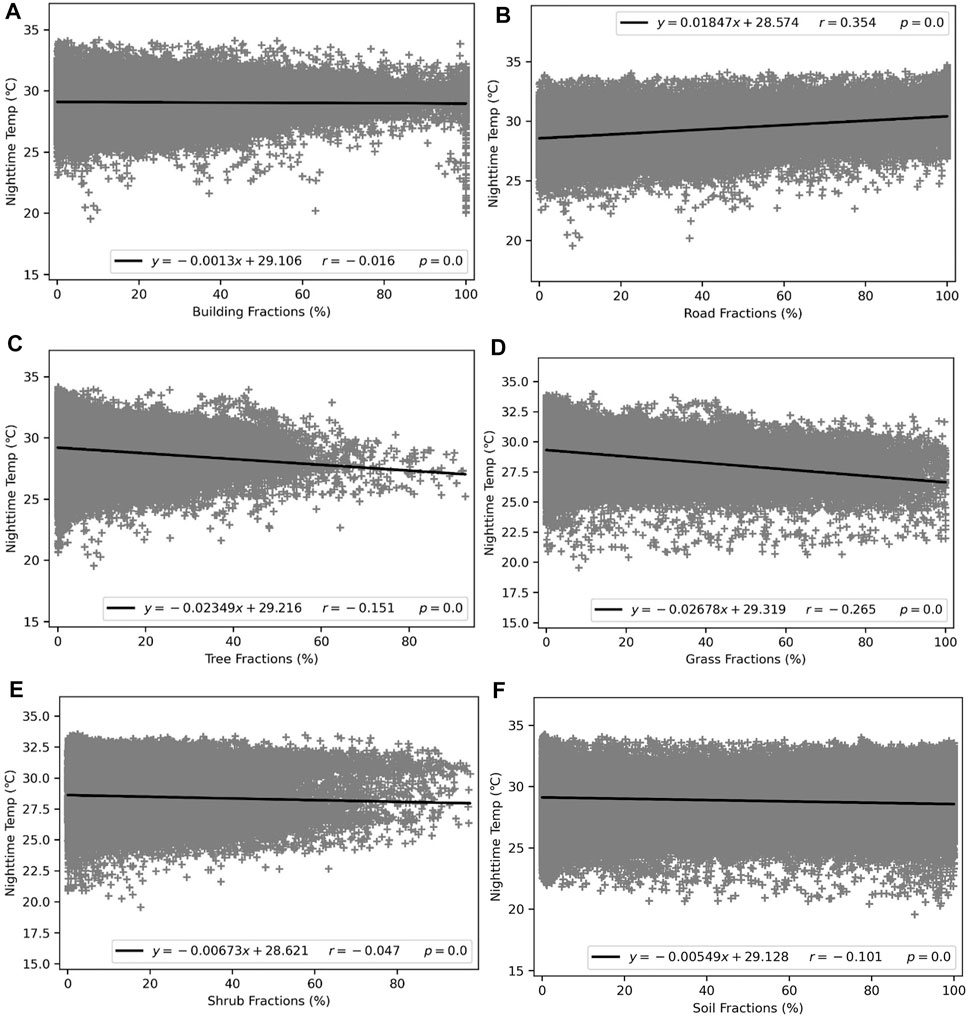
FIGURE 5. Relationship between summer nighttime LST and selected LULC fractions in Phoenix including (A) building, (B) road, (C) tree, (D) grass, (E) shrub, and (F) soils, determined by linear regression.
Although buildings and roads have strong relationships with LST for summer days and nights, we found that vegetation cover and distance moderated these effects (Figure 6). For summer daytime LST, the impacts of elevated LST were strongly close to these figures, dissipating with distance up to 100-m away (Figures 6A,B). The effect of roads was persistent at greater distances (slope = −0.0185) compared to buildings (slope = −0.00185). Additional linear regressions revealed significant negative relationships between LST and the combined effects of tree fractions and distances from 0 to 100 m to anthropogenic features (Figures 6C,D). Their regression slopes were steeper than any other variables (LULC types). For summer daytime, the combined effects were stronger predictors of LST than any LULC fractions alone. The combined effects between tree fraction and distance to road (slope = −0.282) was more strongly related to summer daytime surface temperature than the interaction between tree fraction and distance from buildings.
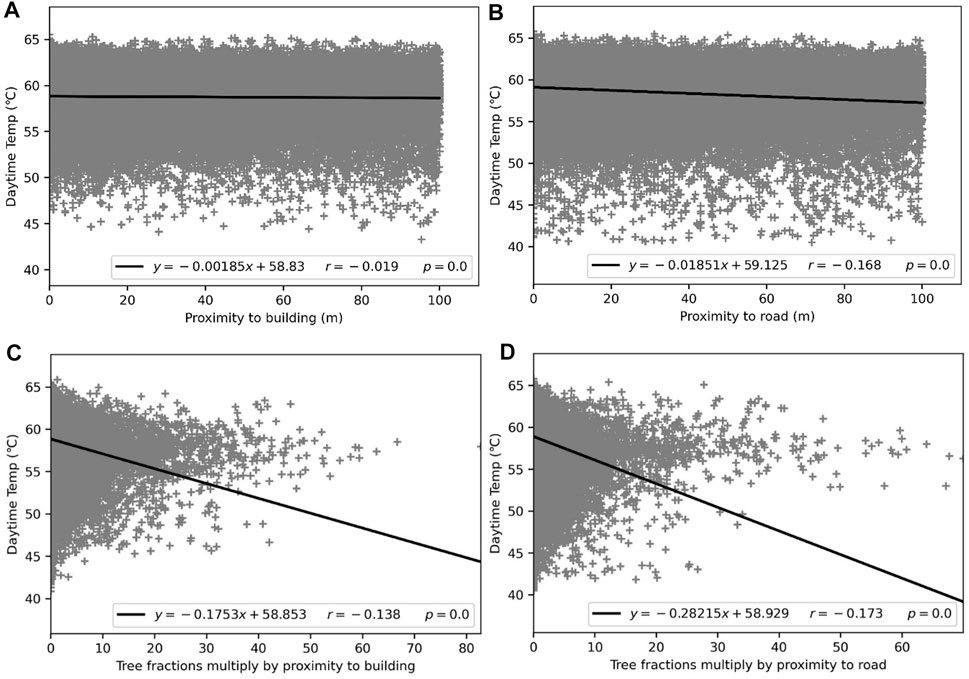
FIGURE 6. Relationship between summer daytime LST and (A) proximity to building, (B) proximity to road, (C) interaction of tree fraction and proximity to building, and (D) interaction of tree fraction and proximity to road, determined by linear regression.
In addition, the percentages of unmanaged soil according to the terrain conditions were explored because the terrain slope can be a useful parameter for the selection of suitable vegetation species. That would be further helpful for implementing urban forestry programs. Hence, we downloaded the terrain dataset derived from NASA’s Shuttle Radar Topography Mission (SRTM) from the USGS website (https://earthexplorer.usgs.gov/). Then the slope layer was generated using the SRTM data. Slope intensity values were later split into five categories with regard to their standard deviation. For each slope category area, we calculated the percentage of unmanaged soil (Table 2). The results showed that the slope lower than 5.73° occupied more than 80% of the unmanaged soil category, whereas the areas of unmanaged soil with slope greater than 14.92° have 7.05%. This demonstrates that unmanaged soil in our study area mainly occurs on flat terrain, and hence slope does not play an important role in mitigating urban warming effect.

TABLE 2. Statistics of the percentage of unmanaged soil according to their slope categories across the City of Phoenix.
3.2 Distribution of UHI Impacts by Socioeconomic Status
We identified strong correlations between the spatial distribution of summer daytime and nighttime LST and the spatial distribution of socioeconomic disparities (Figure 7). The relationship between the socio-economic indicators including house property values, median household income, per capita income and percentage of household below poverty level, and surface temperatures were explored in summer days and nights in the urban core. We found that household property values were significantly negatively correlated with summer day and night temperatures. The regression slopes for summer daytime were steeper, implying that communities with lower property values tend to have disproportionate exposure to UHI, while communities with higher property values have lower exposure. We found similar patterns for median household income and per capita income. We observed a positive correlation between the percentage of households below the poverty level in a census block group and LST in both summer day and night, with a stronger relationship. For further details about the correlations between the LST and socioeconomic variables for winter day and night please see the Supplementary Material.
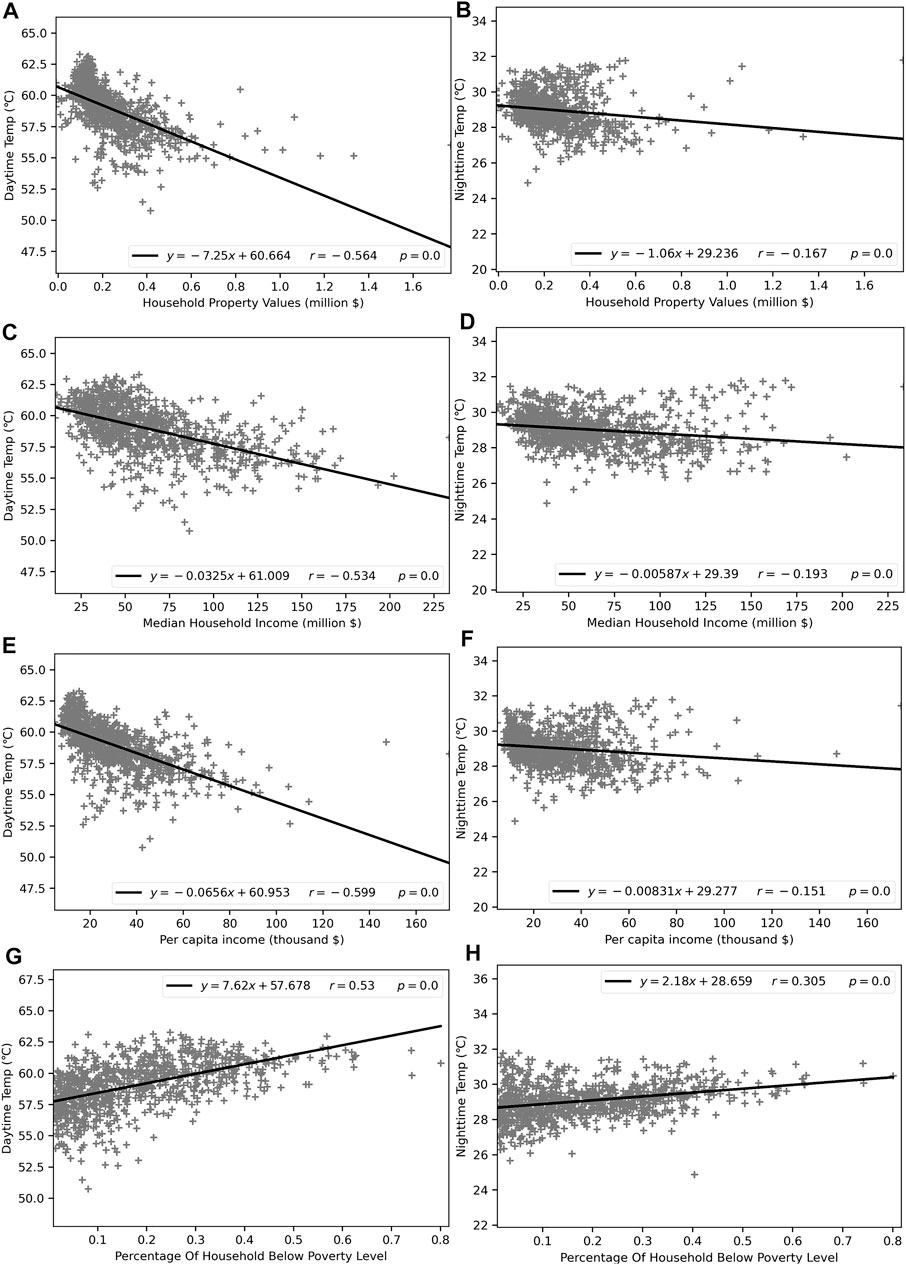
FIGURE 7. Disproportionate impacts of UHI on socioeconomically disadvantaged communities in Phoenix’s urban core were identified by linear regression between (A) summer daytime LST and house property values, (B) summer nighttime LST and house property values, (C) summer daytime LST and median household income, (D) summer nighttime LST and median household income, (E) summer daytime LST and per capita income, (F) summer nighttime LST and per capita income, (G) summer daytime LST and percentage of households below the poverty line, and (H) summer nighttime LST and percentage of household below the poverty line.
3.3 Projected Effect of Tree, Shrub, and Grass Plantings for UHI Mitigation
To understand how LULC contributes to LST distributions across Phoenix total extent and within the urban core only for different times of day in summer, we evaluated the relative importance of LULC fractions using the RF variable importance (Table 3). We observed that the fraction of unmanaged soil was the most important LULC composition explaining LST patterns across the whole city and the urban core roads, grass, and trees were among the top five variables in both regions. However, the fractional cover of shrubs was the second most important LULC for the whole city, different from urban core. Shrubs mainly grow in suburban areas and present a more significant effect on LST than in Urban Core. Other than the whole city, buildings have a more significant impact on urban core. Other factors, such as orchard, canal, seasonal river, lake, and fallow, present a consistently ineffective influence on LST in both areas.
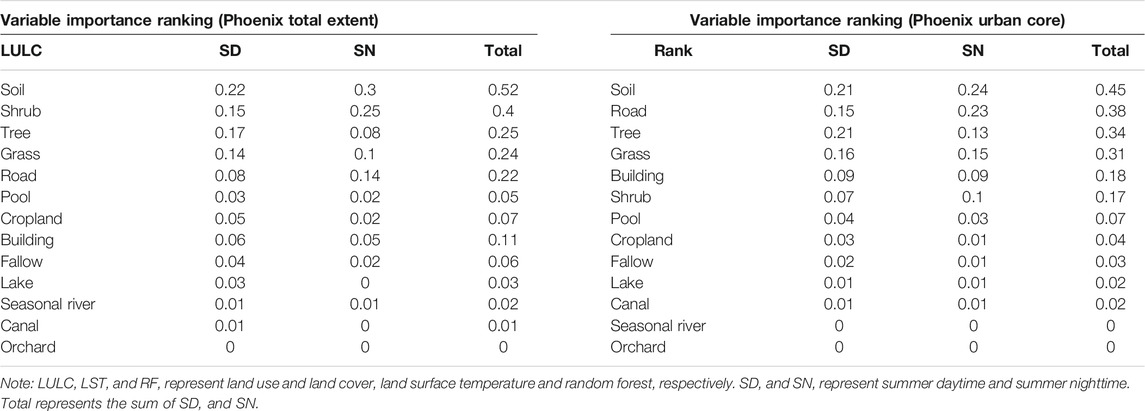
TABLE 3. Importance of LULC composition for explaining LST patterns across Phoenix according to RF models for Phoenix total extent and the urban core only.
Our scenario-based analysis based on RF demonstrated that LST could be effectively reduced by converting currently unmanaged soil to trees, shrubs, and grass (Table 4). We found that the mean summer daytime LST across Phoenix total extent (59.04°C) was higher than mean LST within the urban core (58.75°C). Phoenix total area extent and urban core cover unmanaged soil areas of 656 km2 (occupying the total area of 33.80%) and 361 km2 (occupying the total area of 26.78%), respectively. When trees, shrubs, or grass replace 10, 20, 30, 40, and 50% of unmanaged soil, the mean LST decreased accordingly.
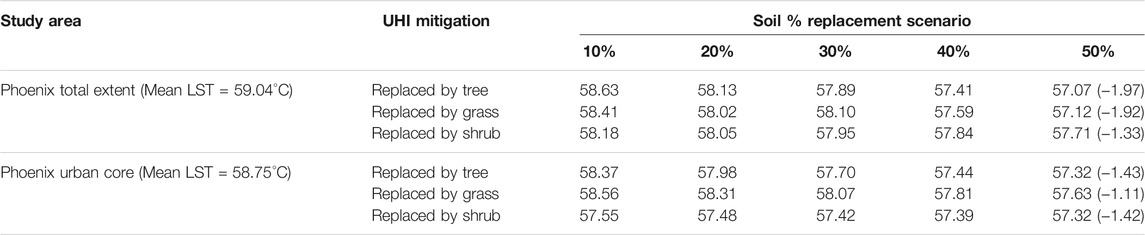
TABLE 4. Projected mean summer daytime temperatures across Phoenix total extent and the urban core alone that would result from replacement of 10, 20, 30, 40, or 50% of unmanaged soil by trees, shrubs, or grass, based on random forest (RF) scenario models.
For Phoenix total extent, replacing unmanaged soil with trees produced the greatest cooling effect, followed by grass and shrubs in summer daytime. The RF scenario replacing 50% of unmanaged soil with trees and grass across Phoenix total extent reduced LST by 1.97°C and 1.92°C, respectively. The effect of trees and grass planting on LST were similar. For Phoenix urban core, the results of the RF scenario showed replacing unmanaged soil with trees produced the greatest cooling effect, followed by shrubs and grass with lowering 1.43°C, 1.42°C, and 1.11°C, respectively. Planting these three types of vegetation achieve the similar effects for cooling in the urban core alone. We found that tree plantings had the greatest effect on lowering LST across vegetation intervention scenarios for Phoenix total extent and for the urban core alone.
We found that the mean summer nighttime LST across Phoenix (28.86°C) was lower than the urban core (29.14°C). Through scenario analysis with RF models, we found that mean summer nighttime LST dropped gradually across Phoenix total extent and within the urban core when progressively more unmanaged soil was replaced by trees, shrubs, or grass (Table 5). Replacing unmanaged soil across Phoenix total extent with grass delivered the best cooling effect, followed by trees and shrubs from the RF approach. The RF scenario replacing 50% of unmanaged soil with grass, trees and shrubs across Phoenix total extent reduced LST by 0.57°C and 0.46°C, and 0.21°C, respectively. For Phoenix urban core, the models indicated that grass had the best cooling effect, followed by shrubs and trees with the LST reduction of 0.50°C, 0.41°C, and 0.27°C, respectively. We found that grass plantings were the greatest effective than other two vegetation types for cooling across vegetation intervention scenarios neither in Phoenix total extent nor the urban core alone. Changes in mean temperatures in Phoenix total extent and urban core detailed in Supplementary Material during winter daytime.
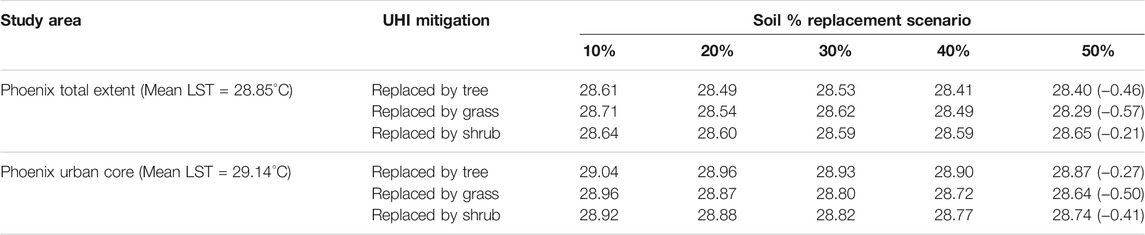
TABLE 5. Changes in mean temperatures in Phoenix total extent and urban core when replacing 10, 20, 30, 40, and 50% of unmanaged soil by trees, shrubs, or grass based on RF during summer nighttime.
4 Discussion
4.1 The Impact of LULC on LST
Urbanization creates a concentration of anthropogenic features (e.g., impervious surfaces) leading to the UHI with implications for water and energy consumption, ecosystem services and human health in Phoenix and other cities. We discovered significant positive relationships between road fractions and surface temperatures in all time periods considered in this study. Consistent with previous studies (Myint et al., 2013; Wang C. et al., 2016; Mohajerani et al., 2017), we found that the extent of roads impacts surface temperatures more than other factor during summer days and nights. Contrary to previous studies which identify buildings as a driver of increasing surface temperatures in summer (Zhou et al., 2011; Bokaie et al., 2016), we found that buildings are not associated with high daytime surface temperatures, yet are associated with lower nighttime temperatures in our study area.
The distinct impacts of buildings and roads are likely caused by differences in their composition materials. Roads, parking lots, driveways, and sidewalks are primarily made of asphalt—a dark surface—while buildings are composed of bright materials. Darker surfaces usually absorb and retain heat longer than white or bright-colored surfaces (Mohajerani et al., 2017). Conversely, most rooftops and walls of buildings in Phoenix are composed of bright materials resulting in lower heat retention and high surface reflectance (Myint et al., 2013). Furthermore, the perimeters of buildings are usually associated with vegetation covers, such as grass or trees providing a cooling effect. Some building rooftops in Phoenix are “cool roofs” with solar panels that produce emissions-free electricity to cool the buildings. Finally, buildings can provide shade during the day, thereby acting somewhat similar to the effect of vegetation and reinforcing a cooling effect. These features can explain why roads cause more significant temperature increases than buildings in Phoenix.
It is not surprising that the urban core areas had higher summer nighttime LST compared to Phoenix total extent; anthropogenic features (buildings and roads) in the urban core absorbed and retained more heat than unmanaged soil in suburban areas. Surprisingly, we found that unmanaged soil was associated with higher summer daytime LST than buildings in Phoenix. Unmanaged soil mainly exists outside the urban core, while buildings, trees, and grass are concentrated within the urban core—this may explain why summer daytime temperatures in suburban areas are generally hotter than in the urban core. Unmanaged soil is the primary reflecting surface in Phoenix; which is also true of other desert cities and is an important consideration for managers interested in mitigating UHI.
In addition, the relationship between swimming pool fractions and summer daytime temperature was the lowest (Figure 4L) since swimming pool fraction values could be very low at 70 × 70 spatial resolution in some cases. Therefore, we conclude that swimming pools do not significantly impact daytime surface temperature, nor do they effectively lower the thermal energy in a desert area. This finding is the same as what was reported in Myint et al. (2013).
Our study gives particular attention to trees, grass, and shrubs because these vegetation features generally have cooler surface temperatures than other LULC (Zhang et al., 1998; Tran et al., 2006), and they also provide important ecosystem services within the urban landscape. We found that vegetation features have a cooling effect on summer day and summer night surface temperatures. Trees are the most effective for cooling summer daytime temperature, while grass is more effective for cooling summer nighttime temperatures. Shrubs were generally less effective for cooling UHI, likely because shrubs mainly grow in suburban areas where unmanaged soil dominates.
4.2 Inequality in UHI Exposure
We documented disparities in the distribution of UHI within Phoenix’s urban core, based on property values, median household income, and the percentage of household below poverty level. Lower socioeconomic status census block groups are more likely to be exposed to high temperatures in the summer, while affluent neighborhoods may experience relatively cooler temperatures. Land cover features may contribute to these disparities (Uejio et al., 2011). Political and socioeconomic factors may cause LULC and management (e.g., xeric residential versus mesic residential) differences among communities, thus leading to LST spatial disparities (Harlan et al., 2006; Chow et al., 2012). These findings are consistent with the luxury effect, which suggests that ecosystem variation conforms to socioeconomic status (Hope et al., 2003). Residential landscape composition is typically associated with the period of development and income levels. In Phoenix, affluent neighborhoods have more vegetation (trees and grass lawns), and their cooling influence is more accessible for these residents, whereas low income neighborhoods tend to have little vegetation or access to greenspace (Harlan et al., 2006; Jenerette et al., 2007; Jenerette et al., 2011; Li et al., 2016). Mean temperatures higher than 100°F (37.78°C) can persist for at least 3 months in our study area, imposing an extended burden on vulnerable residents in Phoenix, which could be alleviated with strategic vegetation-based UHI mitigation. Such analyses provide the implications that future urban heat mitigation options should focus on communities with lower socioeconomic status to achieve environmental justice instead of simply concentrating on cooling effect.
4.3 Operational Urban Warming Mitigation Through Sustainable Planning
One strategy to mitigate the UHI effects, which are more intense for desert cities than other urban centers, is to increase green vegetation landscapes. Previous studies have suggested that increasing green space can achieve significant cooling potentials (Zhang et al., 2017). The city of Phoenix has launched an urban planning effort to mitigate UHI by increasing the amount of green space (Phoenix, C.O., 2010), however, the potential cooling effect across the region has not been quantitatively assessed. In Phoenix, there exists a large extent of unmanaged soil which is unconsolidated material that supports plant growth. From our analysis, unmanaged soil caused higher summer daytime LST than buildings. It was the most important composition explaining LST patterns as well. Vegetation (trees, grass, and shrubs) are the top five variables explaining LST patterns and has been well-documented to alleviate UHI (Bowler et al., 2010; Myint et al., 2010; Huang and Cadenasso, 2016). Therefore, we determined that replacing unmanaged soil—a primary contributor to UHI—with vegetation is an operational option to mitigate UHI.
We have two study areas—the total extent of Phoenix and the city’s urban core—to explore LST changes based on scenario models. Phoenix urban core is necessary to be explored due to owning the majority of Phoenix’s population and facing more severe heat-related issues. Scenario models demonstrate that these two areas have the similar ranking in the importance of LULC composition for explaining LST patterns. We observed that unmanaged soil was the most important variable across these two areas because open land areas are the primary reflecting surface in desert cities. Vegetation features (trees, grass, and shrubs) were also one of the most important variables. Other than the whole city, buildings and roads have more significant impacts on urban core. This is because building and road categories are one of the main land cover types and has more impact on UHI than the whole city. The results of UHI mitigation derived from scenario-based models present the analogous change trends in Phoenix total extent and urban core when replacing 10, 20, 30, 40, and 50% of unmanaged soil by trees, shrubs, or grass.
Our scenario models demonstrate that tree plantings represent the best strategy to lower summer daytime LST, while grass is more effective summer nighttime in Phoenix total extent and urban core. The results are consistent with our regression analysis between LULC fractions and LST where the strongest UHI mitigating effect was shown by trees in summer daytime and by grass in summer nighttime, respectively. Scenario-based models present that the benefit of increased vegetation cover on heat mitigation was more pronounced on summer daytime than on summer nighttime. Previous studies demonstrated that interactions between vegetation cover and land surface on higher LST are stronger, thus producing higher cooling effect by planting vegetation in the areas with higher LST (Ziter et al., 2019). The benefit of planting vegetation in an urban area may be amplified on days with extreme heat. In our study, most unmanaged soil occurs mainly outside the urban core where the minority of the population resides. We explored the LST changes based on scenario models in Phoenix total extent and urban core. The latter has the majority of population and faces more severe heat exposure. Hence, planting vegetation in unmanaged soil needs to focus on urban core area to achieve the optimal intervention to mitigate UHI.
We assume that landscape compositions will determine spatial disparities of surface temperatures under the same solar radiation in a specific area. Therefore, LULC fractions can be used as explanatory variables to model LST. In this study, we demonstrated that tree or grass plantings provide the best strategy to cool the environment. We focused solely on vegetation interventions for urban UHI mitigation without considering the tradeoffs of the cost and other environmental factors, such as outdoor water use, energy consumption, biodiversity, air pollution, and landscape configuration. It is reported that shade trees in xeric landscapes requires less irrigation than grass because of different cooling mechanisms of grass and trees—grass primarily lowers LST by latent heat of vaporization through ET, while trees are mainly induced by radiative shading (Wang Z.-H. et al., 2016). Different irrigation requirement imposes the constraints on water resource management and planning especially for cities in arid areas. Therefore, shade provided by trees should be taken into account more seriously than grass in addition to the point of saving of irrigation water use by trees. Since water conservation is crucial in a desert city, we suggest native tree species (e.g., Palo Verde, Desert Ironwood, Mesquite, Acacia, Desert Willow) requiring little to no irrigated water other than rainfall would be the best option to minimize urban heat island effect in the city of Phoenix. Drought tolerant species and less water use species are also an option for mitigating surface temperatures. We believe that the actionable options provided above are manageable and can be implemented immediately to mitigate urban warming effect in arid, semi-arid, and dry climate regions.
5 Conclusion and Perspectives
We explored the relationship between urban LULC fractions, socioeconomic factors, and LST measured from ECOSTRESS satellite images in Phoenix. Socioeconomically vulnerable communities are disproportionately exposed to UHI, particularly high summer daytime temperatures; disparities in exposure to UHI may cause a higher incidence of heat-related health problems (e.g., asthma, bronchitis, lung diseases, heart diseases, heat stroke) in underprivileged communities. UHI disparities are linked to LULC composition differences, which also vary with socioeconomic factors across the city. We found that unmanaged soil significantly increases temperatures in the city, followed by roads and buildings. Vegetation features help to moderate high daytime temperatures. Trees lower daytime surface temperature more effectively than grass and shrub cover, making them the optimal intervention to mitigate UHI and potentially reduce energy demand in desert cities. Through scenario analysis, we found that replacing 50% of unmanaged soil with trees could reduce average summer daytime temperatures by as much as 1.97°C if the intervention was implemented across all of Phoenix and by 1.43°C if implemented within the urban core only. Since Phoenix city is located in a desert environment, native trees requiring little to no additional water other than rainfall would be ideal to mitigate urban warming effects. It is recommended that policymakers and planners incorporate and optimize the spatial configuration of urban landscapes by increasing green infrastructure in unmanaged soil and pay more attention to environmental social justice or equity in urban planning and urban forestry programs.
Data Availability Statement
The original contributions presented in the study are included in the article/Supplementary Material, further inquiries can be directed to the corresponding author.
Author Contributions
SM and YZ conceived the study and developed the methodology, carried out the data analysis. YZ, SM, and DS-S interpreted results and co-wrote the manuscript. RM, DT, and YL provided critical feedback and helped shape the analysis and manuscript.
Funding
This work is funded by NASA (NASA grant number: 80NSSC20K0168).
Conflict of Interest
The authors declare that the research was conducted in the absence of any commercial or financial relationships that could be construed as a potential conflict of interest.
Publisher’s Note
All claims expressed in this article are solely those of the authors and do not necessarily represent those of their affiliated organizations, or those of the publisher, the editors and the reviewers. Any product that may be evaluated in this article, or claim that may be made by its manufacturer, is not guaranteed or endorsed by the publisher.
Supplementary Material
The Supplementary Material for this article can be found online at: https://www.frontiersin.org/articles/10.3389/fenvs.2021.795474/full#supplementary-material
References
Barnett, T. P., and Pierce, D. W. (2008). When Will Lake Mead Go Dry? Water Resour. Res. 44, W03201. doi:10.1029/2007wr006704
Bettencourt, L. M. A., Lobo, J., Helbing, D., Kuhnert, C., and West, G. B. (2007). Growth, Innovation, Scaling, and the Pace of Life in Cities. Proc. Natl. Acad. Sci. 104, 7301–7306. doi:10.1073/pnas.0610172104
Bokaie, M., Zarkesh, M. K., Arasteh, P. D., and Hosseini, A. (2016). Assessment of Urban Heat Island Based on the Relationship between Land Surface Temperature and Land Use/Land Cover in Tehran. Sustainable Cities Soc. 23, 94–104. doi:10.1016/j.scs.2016.03.009
Bowler, D., Buyung-Ali, L., Knight, T., and Pullin, A. (2010). How Effective Is ‘greening’of Urban Areas in Reducing Human Exposure to Ground Level Ozone Concentrations, UV Exposure and the ‘urban Heat Island Effect’? CEE Review 08-004 (SR41). Environ. Evid. 5, 1–6. doi:10.1186/s13750-016-0054-y
Brazel, A., Selover, N., Vose, R., and Heisler, G. (2000). The Tale of Two Climates-Baltimore and Phoenix Urban LTER Sites. Clim. Res. 15, 123–135. doi:10.3354/cr015123
Buyantuyev, A., and Wu, J. (2010). Urban Heat Islands and Landscape Heterogeneity: Linking Spatiotemporal Variations in Surface Temperatures to Land-Cover and Socioeconomic Patterns. Landscape Ecol. 25, 17–33. doi:10.1007/s10980-009-9402-4
Chen, X.-L., Zhao, H.-M., Li, P.-X., and Yin, Z.-Y. (2006). Remote Sensing Image-Based Analysis of the Relationship between Urban Heat Island and Land Use/cover Changes. Remote Sensing Environ. 104, 133–146. doi:10.1016/j.rse.2005.11.016
Chow, W. T. L., Chuang, W.-C., and Gober, P. (2012). Vulnerability to Extreme Heat in Metropolitan Phoenix: Spatial, Temporal, and Demographic Dimensions. The Prof. Geographer 64, 286–302. doi:10.1080/00330124.2011.600225
Christensen, N. S., and Lettenmaier, D. P. (2007). A Multimodel Ensemble Approach to Assessment of Climate Change Impacts on the Hydrology and Water Resources of the Colorado River Basin. Hydrol. Earth Syst. Sci. 11, 1417–1434. doi:10.5194/hess-11-1417-2007
Connors, J. P., Galletti, C. S., and Chow, W. T. L. (2013). Landscape Configuration and Urban Heat Island Effects: Assessing the Relationship between Landscape Characteristics and Land Surface Temperature in Phoenix, Arizona. Landscape Ecol. 28, 271–283. doi:10.1007/s10980-012-9833-1
Cui, Y. Y., and De Foy, B. (2012). Seasonal Variations of the Urban Heat Island at the Surface and the Near-Surface and Reductions Due to Urban Vegetation in Mexico City. J. Appl. Meteorology Climatology 51, 855–868. doi:10.1175/jamc-d-11-0104.1
Dousset, B., and Gourmelon, F. (2003). Satellite Multi-Sensor Data Analysis of Urban Surface Temperatures and Landcover. ISPRS J. Photogrammetry Remote Sensing 58, 43–54. doi:10.1016/s0924-2716(03)00016-9
Estoque, R. C., Murayama, Y., and Myint, S. W. (2017). Effects of Landscape Composition and Pattern on Land Surface Temperature: An Urban Heat Island Study in the Megacities of Southeast Asia. Sci. Total Environ. 577, 349–359. doi:10.1016/j.scitotenv.2016.10.195
Fan, C., Myint, S. W., and Zheng, B. (2015). Measuring the Spatial Arrangement of Urban Vegetation and its Impacts on Seasonal Surface Temperatures. Prog. Phys. Geogr. Earth Environ. 39, 199–219. doi:10.1177/0309133314567583
Gober, P., Brazel, A., Quay, R., Myint, S., Grossman-Clarke, S., Miller, A., et al. (2009). Using Watered Landscapes to Manipulate Urban Heat Island Effects: How Much Water Will it Take to Cool Phoenix? J. Am. Plann. Assoc. 76, 109–121. doi:10.1080/01944360903433113
Grimm, N. B., Faeth, S. H., Golubiewski, N. E., Redman, C. L., Wu, J., Bai, X., et al. (2008). Global Change and the Ecology of Cities. science 319, 756–760. doi:10.1126/science.1150195
Guhathakurta, S., and Gober, P. (2010). Residential Land Use, the Urban Heat Island, and Water Use in Phoenix: A Path Analysis. J. Plann. Education Res. 30, 40–51. doi:10.1177/0739456x10374187
Hamerlynck, E. P., Huxman, T. E., Loik, M. E., and Smith, S. D. (2000). Effects of Extreme High Temperature, Drought and Elevated CO2 on Photosynthesis of the Mojave Desert evergreen Shrub, Larrea Tridentata. Plant Ecol. 148, 183–193. doi:10.1023/a:1009896111405
Harlan, S. L., Brazel, A. J., Prashad, L., Stefanov, W. L., and Larsen, L. (2006). Neighborhood Microclimates and Vulnerability to Heat Stress. Soc. Sci. Med. 63, 2847–2863. doi:10.1016/j.socscimed.2006.07.030
Hartz, D. A., Prashad, L., Hedquist, B. C., Golden, J., and Brazel, A. J. (2006). Linking Satellite Images and Hand-Held Infrared Thermography to Observed Neighborhood Climate Conditions. Remote sensing Environ. 104, 190–200. doi:10.1016/j.rse.2005.12.019
Hook, S., and Hulley, G. (2019). Producer: NASA EOSDIS Land Processes DAAC, USGS Earth Resources Observation and Science (EROS) Center: Souix Falls, SD, USA. Available at: https://lpdaac.usgs.gov/products/eco2cldv001/. doi:10.5067/ECOSTRESS/ECO2LSTE.001
Hope, D., Gries, C., Zhu, W., Fagan, W. F., Redman, C. L., Grimm, N. B., et al. (2003). “Socioeconomics Drive Urban Plant Diversity. Proceedings of the National Academy of Sciences 100(15), 8788–8792.
Huang, G., and Cadenasso, M. L. (2016). People, Landscape, and Urban Heat Island: Dynamics Among Neighborhood Social Conditions, Land Cover and Surface Temperatures. Landscape Ecol. 31, 2507–2515. doi:10.1007/s10980-016-0437-z
Hulley, G., Hook, S., Fisher, J., and Lee, C. (2017). “ECOSTRESS, A NASA Earth-Ventures Instrument for Studying Links between the Water Cycle and Plant Health over the Diurnal Cycle,” in Prceeding of the 2017 IEEE International Geoscience and Remote Sensing Symposium (IGARSS), Fort Worth, TX, USA, 23-28 July 2017 (IEEE), 5494–5496. doi:10.1109/igarss.2017.8128248
Jenerette, G. D., Harlan, S. L., Brazel, A., Jones, N., Larsen, L., and Stefanov, W. L. (2007). Regional Relationships between Surface Temperature, Vegetation, and Human Settlement in a Rapidly Urbanizing Ecosystem. Landscape Ecol. 22, 353–365. doi:10.1007/s10980-006-9032-z
Jenerette, G. D., Harlan, S. L., Stefanov, W. L., and Martin, C. A. (2011). Ecosystem Services and Urban Heat Riskscape Moderation: Water, green Spaces, and Social Inequality in Phoenix, USA. Ecol. Appl. 21, 2637–2651. doi:10.1890/10-1493.1
Jesdale, B. M., Morello-Frosch, R., and Cushing, L. (2013). The Racial/Ethnic Distribution of Heat Risk-Related Land Cover in Relation to Residential Segregation. Environ. Health Perspect. 121, 811–817. doi:10.1289/ehp.1205919
Lazzarini, M., Marpu, P. R., and Ghedira, H. (2013). Temperature-land Cover Interactions: The Inversion of Urban Heat Island Phenomenon in Desert City Areas. Remote Sensing Environ. 130, 136–152. doi:10.1016/j.rse.2012.11.007
Li, X., Li, W., Middel, A., Harlan, S. L., Brazel, A. J., and Turner, B. L. (2016). Remote Sensing of the Surface Urban Heat Island and Land Architecture in Phoenix, Arizona: Combined Effects of Land Composition and Configuration and Cadastral-Demographic-Economic Factors. Remote Sensing Environ. 174, 233–243. doi:10.1016/j.rse.2015.12.022
Li, X., Myint, S. W., Zhang, Y., Galletti, C., Zhang, X., and Turner, B. L. (2014). Object-based Land-Cover Classification for Metropolitan Phoenix, Arizona, Using Aerial Photography. Int. J. Appl. Earth Observation Geoinformation 33, 321–330. doi:10.1016/j.jag.2014.04.018
Li, X., Zhou, W., and Ouyang, Z. (2013). Relationship between Land Surface Temperature and Spatial Pattern of Greenspace: What Are the Effects of Spatial Resolution? Landscape Urban Plann. 114, 1–8. doi:10.1016/j.landurbplan.2013.02.005
Li, Y., Sun, Y., Li, J., and Gao, C. (2020). Socioeconomic Drivers of Urban Heat Island Effect: Empirical Evidence from Major Chinese Cities. Sustainable Cities Soc. 63, 102425. doi:10.1016/j.scs.2020.102425
Lu, D., and Weng, Q. (2006). Use of Impervious Surface in Urban Land-Use Classification. Remote Sensing Environ. 102, 146–160. doi:10.1016/j.rse.2006.02.010
Maimaitiyiming, M., Ghulam, A., Tiyip, T., Pla, F., Latorre-Carmona, P., Halik, Ü., et al. (2014). Effects of green Space Spatial Pattern on Land Surface Temperature: Implications for Sustainable Urban Planning and Climate Change Adaptation. ISPRS J. Photogrammetry Remote Sensing 89, 59–66. doi:10.1016/j.isprsjprs.2013.12.010
Mashhoodi, B. (2021). Environmental justice and Surface Temperature: Income, Ethnic, Gender, and Age Inequalities. Sustainable Cities Soc. 68, 102810. doi:10.1016/j.scs.2021.102810
Mitchell, B. C., and Chakraborty, J. (2015). Landscapes of thermal Inequity: Disproportionate Exposure to Urban Heat in the Three Largest US Cities. Environ. Res. Lett. 10, 115005. doi:10.1088/1748-9326/10/11/115005
Mohajerani, A., Bakaric, J., and Jeffrey-Bailey, T. (2017). The Urban Heat Island Effect, its Causes, and Mitigation, with Reference to the thermal Properties of Asphalt concrete. J. Environ. Manage. 197, 522–538. doi:10.1016/j.jenvman.2017.03.095
Myint, S. W., Brazel, A., Okin, G., and Buyantuyev, A. (2010). Combined Effects of Impervious Surface and Vegetation Cover on Air Temperature Variations in a Rapidly Expanding Desert City. GIScience & Remote Sensing 47, 301–320. doi:10.2747/1548-1603.47.3.301
Myint, S. W., Wentz, E. A., Brazel, A. J., and Quattrochi, D. A. (2013). The Impact of Distinct Anthropogenic and Vegetation Features on Urban Warming. Landscape Ecol. 28, 959–978. doi:10.1007/s10980-013-9868-y
Myint, S. W., Zheng, B., Talen, E., Fan, C., Kaplan, S., Middel, A., et al. (2015). Does the Spatial Arrangement of Urban Landscape Matter? Examples of Urban Warming and Cooling in Phoenix and Las Vegas. Ecosystem Health and Sustainability 1, 1–15. doi:10.1890/ehs14-0028.1
Nichol, J. E., and To, P. H. (2012). Temporal Characteristics of thermal Satellite Images for Urban Heat Stress and Heat Island Mapping. ISPRS J. photogrammetry remote sensing 74, 153–162. doi:10.1016/j.isprsjprs.2012.09.007
Oreszczyn, T., Hong, S. H., Ridley, I., Wilkinson, P., and Group, W. F. S. (2006). Determinants of winter Indoor Temperatures in Low Income Households in England. Energy and Buildings 38, 245–252. doi:10.1016/j.enbuild.2005.06.006
Pan, Z., Wang, G., Hu, Y., and Cao, B. (2019). Characterizing Urban Redevelopment Process by Quantifying thermal Dynamic and Landscape Analysis. Habitat Int. 86, 61–70. doi:10.1016/j.habitatint.2019.03.004
Peng, S., Piao, S., Ciais, P., Friedlingstein, P., Ottle, C., Bréon, F.-M., et al. (2012). Surface Urban Heat Island across 419 Global Big Cities. Environ. Sci. Technol. 46, 696–703. doi:10.1021/es2030438
City of Phoenix (2010). Tree and Shade Master Plan. Available at: https://www.phoenix.gov/parkssite/Documents/PKS_Forestry/PKS_Forestry_Tree_and_Shade_Master_Plan.pdf (Accessed May 05, 2022).
Seager, R., Ting, M., Held, I., Kushnir, Y., Lu, J., Vecchi, G., et al. (2007). Model Projections of an Imminent Transition to a More Arid Climate in Southwestern North America. Science 316, 1181–1184. doi:10.1126/science.1139601
Seto, K. C., Guneralp, B., and Hutyra, L. R. (2012). Global Forecasts of Urban Expansion to 2030 and Direct Impacts on Biodiversity and Carbon Pools. Proc. Natl. Acad. Sci. 109, 16083–16088. doi:10.1073/pnas.1211658109
Singh, P., Kikon, N., and Verma, P. (2017). Impact of Land Use Change and Urbanization on Urban Heat Island in Lucknow City, Central India. A Remote Sensing Based Estimate. Sustainable Cities Soc. 32, 100–114. doi:10.1016/j.scs.2017.02.018
Smith, W. K. (1978). Temperatures of Desert Plants: Another Perspective on the Adaptability of Leaf Size. Science 201, 614–616. doi:10.1126/science.201.4356.614
Stathopoulou, M., Synnefa, A., Cartalis, C., Santamouris, M., Karlessi, T., and Akbari, H. (2009). A Surface Heat Island Study of Athens Using High-Resolution Satellite Imagery and Measurements of the Optical and thermal Properties of Commonly Used Building and Paving Materials. Int. J. Sustainable Energ. 28, 59–76. doi:10.1080/14786450802452753
Streutker, D. (2003). Satellite-measured Growth of the Urban Heat Island of Houston, Texas. Remote Sensing Environ. 85, 282–289. doi:10.1016/s0034-4257(03)00007-5
Tang, J., Di, L., Xiao, J., Lu, D., and Zhou, Y. (2017). Impacts of Land Use and Socioeconomic Patterns on Urban Heat Island. Int. J. Remote Sensing 38, 3445–3465. doi:10.1080/01431161.2017.1295485
Tran, H., Uchihama, D., Ochi, S., and Yasuoka, Y. (2006). Assessment with Satellite Data of the Urban Heat Island Effects in Asian Mega Cities. Int. J. Appl. Earth Observation Geoinformation 8, 34–48. doi:10.1016/j.jag.2005.05.003
Uejio, C. K., Wilhelmi, O. V., Golden, J. S., Mills, D. M., Gulino, S. P., and Samenow, J. P. (2011). Intra-urban Societal Vulnerability to Extreme Heat: the Role of Heat Exposure and the Built Environment, Socioeconomics, and Neighborhood Stability. Health & Place 17, 498–507. doi:10.1016/j.healthplace.2010.12.005
Voogt, J. A., and Oke, T. R. (2003). Thermal Remote Sensing of Urban Climates. Remote sensing Environ. 86, 370–384. doi:10.1016/s0034-4257(03)00079-8
Wang, C., Middel, A., Myint, S. W., Kaplan, S., Brazel, A. J., and Lukasczyk, J. (2018). Assessing Local Climate Zones in Arid Cities: The Case of Phoenix, Arizona and Las Vegas, Nevada. ISPRS J. Photogrammetry Remote Sensing 141, 59–71. doi:10.1016/j.isprsjprs.2018.04.009
Wang, C., Myint, S., Wang, Z., and Song, J. (2016a). Spatio-temporal Modeling of the Urban Heat Island in the Phoenix Metropolitan Area: Land Use Change Implications. Remote Sensing 8, 185. doi:10.3390/rs8030185
Wang, C., Wang, Z.-H., Wang, C., and Myint, S. W. (2019). Environmental Cooling provided by Urban Trees under Extreme Heat and Cold Waves in U.S. Cities. Remote Sensing Environ. 227, 28–43. doi:10.1016/j.rse.2019.03.024
Wang, Z.-H., Zhao, X., Yang, J., and Song, J. (2016b). Cooling and Energy Saving Potentials of Shade Trees and Urban Lawns in a Desert City. Appl. Energ. 161, 437–444. doi:10.1016/j.apenergy.2015.10.047
Weng, Q., Lu, D., and Schubring, J. (2004). Estimation of Land Surface Temperature-Vegetation Abundance Relationship for Urban Heat Island Studies. Remote sensing Environ. 89, 467–483. doi:10.1016/j.rse.2003.11.005
Weng, Q. (2009). Thermal Infrared Remote Sensing for Urban Climate and Environmental Studies: Methods, Applications, and Trends. ISPRS J. Photogrammetry Remote Sensing 64, 335–344. doi:10.1016/j.isprsjprs.2009.03.007
Xian, G., and Crane, M. (2006). An Analysis of Urban thermal Characteristics and Associated Land Cover in Tampa Bay and Las Vegas Using Landsat Satellite Data. Remote Sensing Environ. 104, 147–156. doi:10.1016/j.rse.2005.09.023
Zhang, X., Aono, Y., and Monji, N. (1998). Spatial Variability of Urban Surface Heat Fluxes Estimated from Landsat TM Data under Summer and winter Conditions. J. Agric. Meteorol. 54, 1–11. doi:10.2480/agrmet.54.1
Zhang, Y., Middel, A., and Turner, B. L. (2019). Evaluating the Effect of 3D Urban Form on Neighborhood Land Surface Temperature Using Google Street View and Geographically Weighted Regression. Landscape Ecol. 34, 681–697. doi:10.1007/s10980-019-00794-y
Zhang, Y., Murray, A. T., and Turner, B. L. (2017). Optimizing green Space Locations to Reduce Daytime and Nighttime Urban Heat Island Effects in Phoenix, Arizona. Landscape Urban Plann. 165, 162–171. doi:10.1016/j.landurbplan.2017.04.009
Zhou, W., Huang, G., and Cadenasso, M. L. (2011). Does Spatial Configuration Matter? Understanding the Effects of Land Cover Pattern on Land Surface Temperature in Urban Landscapes. Landscape Urban Plann. 102, 54–63. doi:10.1016/j.landurbplan.2011.03.009
Keywords: ECOSTRESS, land surface temperature, land use and land cover, socioeconomic status, scenario analysis, Phoenix
Citation: Zhu Y, Myint SW, Schaffer-Smith D, Muenich RL, Tong D and Li Y (2022) Formulating Operational Mitigation Options and Examining Intra-Urban Social Inequality Using Evidence-Based Urban Warming Effects. Front. Environ. Sci. 9:795474. doi: 10.3389/fenvs.2021.795474
Received: 15 October 2021; Accepted: 09 December 2021;
Published: 21 January 2022.
Edited by:
Chenghao Wang, Stanford University, United StatesReviewed by:
Weiqi Zhou, Research Center for Eco-environmental Sciences (CAS), ChinaTao Zhang, Iowa State University, United States
Copyright © 2022 Zhu, Myint, Schaffer-Smith, Muenich, Tong and Li. This is an open-access article distributed under the terms of the Creative Commons Attribution License (CC BY). The use, distribution or reproduction in other forums is permitted, provided the original author(s) and the copyright owner(s) are credited and that the original publication in this journal is cited, in accordance with accepted academic practice. No use, distribution or reproduction is permitted which does not comply with these terms.
*Correspondence: Soe W. Myint, Soe.Myint@asu.edu