

Abstract
Reducing nutrient loss from agriculture to improve water quality requires a combination of management practices. However, it has been unclear what pattern of mitigation is likely to emerge from different policies, individually and combined, and the consequences for local and national land use and farm returns. We address this research gap by constructing an integrated multi-scale framework for evaluating alternative nitrogen loss management policies for corn production in the US. This approach combines site- and practice-specific agro-ecosystem processes with a grid-resolving economic model to identify locations that can be prioritized to increase the economic efficiency of the policies. We find that regional measures, albeit effective in reducing local nitrogen loss, can displace corn production to the area where nitrogen fertilizer productivity is low and nutrient loss rate is high, thereby offsetting the overall effectiveness of the nutrient management strategy. This spatial spillover effect can be suppressed by implementing the partial measures in tandem with nationwide policies. Wetland restoration combined with split fertilizer application, along with a nitrogen loss tax could reduce nitrate nitrogen loss to the Mississippi River by 30% while only increasing corn prices by less than 2%.
Export citation and abstract BibTeX RIS

Original content from this work may be used under the terms of the Creative Commons Attribution 4.0 license. Any further distribution of this work must maintain attribution to the author(s) and the title of the work, journal citation and DOI.
1. Introduction
Widespread and intensive agricultural activity has resulted in large amounts of nitrogen (N) loss from soils [1, 2]. Elevated N levels in streams and rivers causes a spectrum of challenging problems including biodiversity loss and threatened human health [3]. Nutrients transported through the Mississippi River basin (MRB) have been blamed for what are referred to as the 'dead zones' (low oxygen water) formed in the Gulf of Mexico [4, 5]. The largest hypoxic zone measured since 1985 was 22 730 square kilometers (8776 square miles) in 2017 (US-EPA Hypoxia Task Force). Reducing this size to an acceptable level by 2035 will require at least a 45% reduction in the N load exported by the Mississippi and Atchafalaya Rivers [6, 7].
It is widely recognized that there is no silver bullet [8] for resolving the 'wicked' problem of nonpoint source water pollution [9] in the Mississippi watershed. To achieve the 45% nutrient reduction goal, in-field nutrient management must be combined with edge-of-field measures as well as downstream nutrient removal practices [8, 10–12]. While agronomic and environmental management techniques to control and remove N loss have advanced, there is limited evidence that existing policies are effective in facilitating the adoption of these techniques [8, 13, 14]. The programs to promote improved water quality in the US have been found to be largely inefficient as the incremental cost for water quality protection has exceeded the incremental benefits [15–17]. The low efficiency is often attributed to the failure to identify the proper value of N effluent mitigation [13, 18, 19]. The uniform value assumed in current policy design does not reflect the spatially varying marginal cost of mitigating water quality damages [9]. Quantifying this cost is challenging in practice because nonpoint source pollution is often not measurable. Without knowing the site-specific biophysical and ecological characteristics of N loss, economic instruments cannot be efficiently deployed.
Our paper overcomes these problems by estimating key biophysical relationships between corn production, N fertilizer use, and nitrate pollution based on the fine-scale, agro-ecosystem model Agro-IBIS [20–22]. These biophysical relationships are then built into a grid-resolving economic model dubbed SIMPLE-G-US-CS. This model embeds a grid-cell based analysis of the continental US within a global economic model, thereby allowing for a linkage to be established between grid-cell specific interventions and national and international markets for corn and soybeans, as well as N fertilizer and other agricultural inputs. The interaction permits the identification of the spatial spillover effect, by which we mean that local responses to a policy are transmitted by markets (through input and output prices) to locations which the policy does not directly affect. We frame this capacity of the model as multi-scale analysis. Studying the Midwest and the rest of the MRB in isolation would ignore these policy externalities and may provoke misleading conclusions. Using this integrated multi-scale analytic tool, we compare the effectiveness of various policies to reduce nitrate loading in the MRB and the spatial patterns of mitigation. Four policies and their combinations are examined, including: an N loss tax, split N and side-dressing applications (thereafter 'Split N' for simplicity), controlled drainage, and wetland restoration. The tax, a commonly used economic instrument, and split N application are both applicable nationwide, while the other two strategies are subject to local feasibility and target certain locations only (hereafter referred to as partial measures). Controlled drainage is selected given that it is the most extensive soil and water management activity in Midwestern agriculture. Wetland restoration is of interest because it is widely reported as one of the most effective land-based nitrogen mitigation strategies [12, 23]. Additional information is available in the section E of the supplementary information (SI) and the methods section.
2. Methods
2.1. Integrating Agro-IBIS and SIMPLE-G-US-CS models
We first use Agro-IBIS to simulate the yield and N loss responses to N application, then build the information into the economic model SIMPLE-G-US-CS for further analysis. Agro-IBIS is a comprehensive model of land surface and ecosystem processes that simulates Midwest US natural vegetation (forests, grasslands) and corn, soybean, and wheat agroecosystems, including terrestrial C and N cycling [20]. Crop yields and N loss from the field are determined by agricultural management, environmental stresses on crop development and water balance. SIMPLE-G-US-CS is a variant of the SIMPLE-G family of models [24, 25] that has been used to study agriculture related sustainability issues. This corn-soy focused model shares many features in common with the SIMPLE-G-US model [25] but focuses on just two dominant crops in the Midwest—corn and soybeans, given that corn is an N intensive crop and often rotates with soybeans. According to 2017 Census of Agriculture (USDA NASS), these two crops account for 77% of the annual harvested area in the MRB watershed, and 42% of total nitrogen fertilizer use was attributed to the production of corn. Like the other models in the SIMPLE-G family, SIMPLE-G-US-CS is a grid-resolving global partial equilibrium model. It solves for global outcomes simultaneously with the grid level responses, thereby enabling analysis across scales. Outcomes at the grid-cell level are aggregated to determine the national supply of corn-soy product and this interacts with national and global demands to determine US and global crop prices. These prices, in turn, feed into grid level production decisions within the US. The system is fully interactive, rather than simple down-scaling of policies. The corn-soy model advances the general SIMPLE-G framework by introducing grid-cell level N loss and crop yield response parameters estimated from Agro-IBIS [20, 22, 26], as shown in figure 1. Specifically, the yield responses to N ('Yield (N)' in figure 1) simulated by Agro-IBIS are used to compute the elasticity of substitution (σ) between N fertilizer and augmented land, by grid-cell and irrigation type. The N loss processes ('N loss (N)' in figure 1) simulated by Agro-IBIS translate the economic equilibrium determined N application into N loss. More information about the two models, validation, as well as the coupling of the two can be found in the SI.
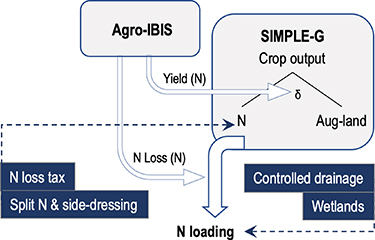
Figure 1. Connections between Agro-IBIS and SIMPLE-G-US-CS. Yield (N) and N loss (N) are transfer functions, through which biophysical characteristics are embedded into the economic model. N loss tax and split N affect N application rates and subsequently N loading through the transfer functions. Controlled drainage and wetlands restoration affect nitrate loads mainly by post-application treatment.
Download figure:
Standard image High-resolution image2.2. N loss management strategies
Four strategies are considered individually and combined in our experimental design to study the impacts of different conservation options. The first one is an N loss tax that increases the cost of N fertilizer application. N loss refers to the N fertilizer nutrient that is applied, but not taken up by the crop and leaves the root zone. The final cost is determined by the nationally uniform 5 N fertilizer price ($/kg of N applied), and the product of a nationwide tax rate of $1/kg of N loss and the N loss intensity (kg of N loss / kg of N application) that varies by location (figure S2). After being adjusted by the N loss intensity, the tax imposes the highest penalty on the heavy polluters. Their profit margin will be affected directly by the tax and indirectly by the adverse yield impacts of less N fertilizer application.
Unlike the N loss tax that reduces N use and nitrate loss via higher input costs, our second strategy achieves the same goal by using fertilizer more efficiently. We select two relatively easy thereby more likely adopted practices—split N and side-dressing 6 . According to Iowa Nutrient Reduction Strategy [27], moving from fall to spring pre-plant application and side-dressing application reduce nitrate-N loss by 6% and 4% respectively on average. This practice is implemented in the model by increasing the productivity of N fertilizer to reduce N loss by 10% while keeping the baseline crop output unchanged.
The other two strategies focus on locally feasible nutrient management practices—controlled drainage 7 and wetland restoration 8 . Both practices yield spatially varying N loss removal rates that are determined by local conditions such as water runoff, subsurface-drained area, as well as soil and vegetation characteristics. These strategies do not affect N fertilizer application directly but remove the pollutant after application and before it enters a stream. Methods to derive the seasonally and spatially varying N removal by controlled drainage and wetland construction for subsurface-drained areas are documented in the SI section D. Additional information for each conservation effort can be found in the SI section E.
Total cost associated with each policy was calculated as the product of area deployed and the annualized cost per treated acre. The spatial extent of each practice is restricted by the feasibility of installing controlled drainage or wetlands, and the total cropland area to be treated. Following Christianson et al [28], treatment cost for controlled drainage and wetland are $10 and $20 per acre per year, respectively. These annualized costs include initial investment, annual maintenance, and replacement costs projected to occur over 50 years at a 4% discount rate. We assume that 50% of the cost will be reimbursed to the producers. We also assume that treating 100 acres of subsurface-drained cropland area by wetland requires 0.5 acre of restored wetland plus 1.75 acres of wetland buffer [28, 29]. More information about the costs associated with each strategy can be found in SI table S3.
3. Results
3.1. Combining N loss tax, split N fertilizer application and wetland restoration has the potential of reducing N loss from corn production by 30%
Among the four strategies explored, wetland restoration appears to be the most effective single one, reducing N loss from corn production by 15%, followed by controlled drainage (12%) (table 1). When combined, wetland restoration, along with N loss tax and split N application can raise the reduction potential to 31%. An N loss tax of one dollar per kg of N loss that boosts the average cost of N fertilizer to corn farms by 28.9% 9 reduces N fertilizer use by 6% and total N loss by 9%. National crop yields are barely affected by the rate reduction, falling slightly from 7.48 to 7.39 corn-equivalent tons per ha. However, the local effect could be more significant. Figure S4 shows potential crop yield falls for most of the locations within and especially around the edges of the MRB because of a higher dependence on supplementary fertilization there. Farms located in the Great Plains are least affected by the tax because of their relatively lower N loss intensity (figure S2).
Table 1. Compare N loss reduction outcomes, impacts on crop output and price, and mitigation efficiency across management strategies.
| N application | Crop output | Crop price | N loss | Efficiency | ||
|---|---|---|---|---|---|---|
| Policy | million tons | million tons | $/ton | million tons | $/kg N | kg N/ha |
| N loss tax | −0.65 | −9.98 | 4.16 | −0.34 | 10.09 | 5.30 |
| (−5.91%) | (−2.08%) | (+1.84%) | (−9.02%) | |||
| Split N | −0.75 | 0.00 | 0.00 | −0.42 | 3.57 | 6.57 |
| (−6.80%) | 0.00% | 0.00% | (−11.18%) | |||
| Controlled drainage | −0.02 | −0.88 | 0.36 | −0.46 | 0.79 | 31.70 |
| (−0.17%) | (−0.18%) | (+0.16%) | (−12.15%) | |||
| Wetlands | −0.05 | −2.38 | 1.18 | −0.58 | 1.81 | 27.26 |
| (−0.47%) | (−0.55%) | (+0.48%) | (−15.41%) | |||
| Tax + Split N | −1.35 | −8.99 | 3.74 | −0.71 | 6.94 | 11.1 |
| (−12.19%) | (−1.87%) | (+1.65%) | (−18.86%) | |||
| Tax + Split N + Controlled drainage | −1.28 | −4.78 | 1.97 | −1.04 | 5.08 | 16.3 |
| (−11.63%) | (−1.00%) | (+0.87%) | (−27.66%) | |||
| Tax + Split N + Wetlands | −1.36 | −9.64 | 4.01 | −1.17 | 5.12 | 18.2 |
| (−12.30%) | (−2.01%) | (+1.78%) | (−31.00%) | |||
Note: Mitigation efficiency measured by $/kg indicates the economic efficiency in terms of direct cost incurred to reduce one unit of N loss. The efficiency measured by kg/ha indicates the biophysical efficiency regarding the potential of N loss removal per cropland area.
At the aggregated level, post-application treatments like controlled drainage and wetland construction yield much larger N loss reductions (31 and 27 kg of N/ha) than split N application and the N loss tax (7 and 5 kg of N/ha) 10 . Removing one kg of N loss costs $1.8 by wetlands and $0.8 by controlled drainage 11 . It is more costly ($3.6) by adopting side-dressing and splitting N application, and even more so ($10) by imposing a pollution tax, which is calculated from dividing total N loss tax collected through N fertilizer sales by the amount of N loss reduced. It is important to note that this accounting differs from the implementation costs associated with other practices, and must be interpreted with caution should the readers wish to compare the cost across practices. In addition, the tax revenue can be recycled to support pollution abatement, which could lower the actual cost of the policy [30]. The outcomes of alternative tax recycling schemes (e.g. to cut existing tax on capital income or to subsidize additional programs to further enhance the mitigation effect) are more extensively studied in the context of carbon tax [31] but not yet so for nutrient management. More information about how these costs are calculated is available in the SI section F.
Crop output falls in almost all cases, albeit modestly, due to the higher input costs associated with the rising N fertilizer price, infrastructure installation and maintenance, or foregone cropland (relevant to wetland only). The composite corn-soy price increases by no more than 2% regardless of the scenarios given the modest change in crop output. The sum of the individual scenarios' output and price effects is greater than when they are implemented in concert, indicating the presence of complementarities among the policies.
3.2. The most effective nitrate loss mitigation policy varies by location
While total mitigation across the four individual strategies is comparable, the spatial pattern of the N loss reductions varies remarkably (figure 2). The amount of mitigation is relatively consistent over the US Corn Belt for N loss tax and Split N application, as these are not tied to specific locations. This stands in marked contrast to the patterns associated with strategies that are contingent on local conditions. Controlled drainage is only possible in locations where subsurface drainage exists. Wetland restoration in our analysis is limited to locations where hydric soils and subsurface drainage are present. Results show that N loss mitigation per grid-cell is much higher in the heart of the Corn Belt where controlled drainage and wetland restoration are more prevalent. They also lead to much higher N removal rates in general, compared to the other two strategies.

Figure 2. Changes of N loss (unit: tons of N loss per 5 arc-min grid-cell) under N loss tax (a), split N application (b), controlled drainage (c), wetlands restoration (d), and combined strategies of tax, split N and wetlands (e). Negative value indicates N loss reduction. Sub-figure (f) shows the most effective single strategy at each grid-cell. The maps include only the grid-cells where corn and soybeans are grown in the US.
Download figure:
Standard image High-resolution imageThe gridded results reported in figures 2(a)–(d) allow us to identify the single practice among the four that exhibits the largest N loss reduction (in terms of tons N per grid-cell) at each location (figure 2(f)). Controlled drainage and wetland restoration dominate the Corn Belt as the most effective practices, except for the western edge where split N is more effective. Outside of the Corn Belt, the N loss tax stands out as the most effective strategy, especially in the Eastern US, under the current setting of the experiments (e.g. tax rate, the extent of N fertilizer productivity being increased, as well as the spatial extent of controlled drainage and restorable wetlands). This stems from a combination of factors, including relatively high N loss intensity and marginal productivity of N applications, as well as reduced prevalence of subsurface drainage and restorable wetlands in this region (figures S2, S3 and S6).
3.3. Pairing nationwide strategies with site-specific conservation practices can remedy the counterproductive policy spillovers
Conservation systems like controlled drainage and wetland restoration incur $10–$20 additional cost per acre (table S3). Despite being a small share of the $450 per acre non-land cost of producing corn (e.g. in Central Illinois circa 2010 [32]), still it could reduce profitability and curb output on adopting farms. Wetland restoration could be more costly by removing land from production, although some lands are intentionally retired due to their low productivity. Considering both factors, output on the adopting farms is likely to fall and so does the demand for N fertilizer. The local effect, when aggregated to the national level, could boost corn price but suppress the price of N fertilizer due to the weakened demand for fertilizer in the short-run. In the long-run, however, the high price of corn will induce production expansion and additional N application elsewhere. Figures 2(c) and (d) clearly shows this spatial spillover effect—N loss around the fringes of the Corn Belt rises in response to higher corn prices. Because there is little subsurface drainage in these fringe areas [33], less of the increased N loss will contribute directly to the hypoxia problem in the Gulf of Mexico, but it could result in groundwater contamination.
In order to quantify the accumulated spillover effects, we further decompose the overall change in N loss into the contributions from mitigation (N loss decrease) and from spillovers (N loss increase) (table S4). While the magnitude of the spillover effect is small compared to the potential of mitigation, the associated N application is more environmental detrimental. Table S5 shows that the additional N application caused by the spillovers demonstrates higher N loss intensity regardless of the measurement method. For example, on average, 41% of the additional N applied to the untreated cropland area will be lost, in comparison to the 33% N loss intensity on the same land but before wetland restoration is introduced. The N loss per hectare of cropland area and per ton of crop output also significantly increase. The spillovers, however, are nearly eliminated once policies are combined (figure 2(e) and table S4), because the uniform coverage of the combined policies distorts the original comparative advantage among farms less than the partial measure does, thereby limiting the market-mediated leakage.
3.4. Targeting N loss hot-spots would make conservation efforts more efficient and cost-effective
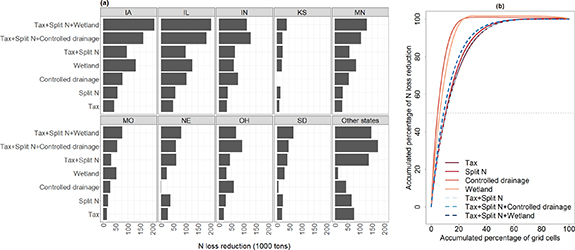
Substantial reductions in N loss are spatially concentrated in locations with large corn acreage, intensive N fertilizer use, and/or highly effective conservation practices. We find that, across all four practices, 50% of the mitigation is contributed by just 10% or fewer of the total 48 317 grid cells (figure 3), and the associated crop output reduction is small (2% or less) (table 1). The locations of these top-mitigating grid-cells are shown in the SI (figure S11). While representing just 10% of the grid-cells, they cover 39.4% of corn–soy area and produce 38.8% of the corn-soy output in the US. They also account for 42.5% of N fertilizer use and generate 46.7% of N loss among all US corn-soy production according to our baseline data. Implementing the strategy combining the tax, split N and wetlands restoration to reduce N loss by 30% costs US$6 billion per year, or about US$38 acre−1 yr−1 (table S3). Focusing on this 10% of the grid cells that contribute half of the 30% N loss reduction costs US$2.4 billion yr−1, while removing the other half of the 30% costs more (US$3.6 billion yr−1) due to lower N removal efficiency. This declining efficiency of the policy can also be detected in figure S12 that depicts mitigation outcomes at various levels of adoption. At higher adoption rates, reducing an additional unit of N costs more and N removal per ha also declines, because more 'expensive' locations are included where either N loss intensity is low, or the marginal product of N is high, or both.
Figure 3. N loss reduction by state and by mitigation strategy (a) and the accumulated percentage of N loss reduction (b). In figure 3(b), grid-cell level mitigation is first sorted descending then accumulated. Therefore, the order of the grid cells varies by policy. Dotted dashed horizontal line indicates 50% of total N loss reduction.
Download figure:
Standard image High-resolution image
Since environmental policies are typically set at the state or federal level, not at the level of individual grid-cell, we also report state level mitigation potentials in figure 3. Collectively, these nine selected states produce 80% of the corn and soy output in the US, and use 83% of the N fertilizer applied to corn production. They also account for 80%–85% of total N loss reduction under the tax and split N strategies, and almost all reduction under controlled drainage and wetlands scenarios. Controlled drainage is quite effective for Iowa, Illinois, Indiana, Minnesota, and Ohio where subsurface drainage is extensively used [33]. Wetland restoration is also quite effective across most of the Corn Belt. However, due to the presence of spillover effects, these policies could lead to N loss increase in the states without potential for controlled drainage and wetland systems. Not surprisingly, policy combinations can dominate individual policies, and this difference is particularly pronounced in Iowa, Illinois, and Minnesota.
3.5. Discussion and conclusion
By integrating a gridded economic model SIMPLE-G with the agro-ecosystem model Agro-IBIS, we investigate the effectiveness of four conservation strategies—N loss tax, split N application, controlled drainage and wetland restoration, individually and combined, to manage the nitrate-N loss from corn production in the US. Collectively, these practices have the potential to reduce N loss from corn production in the US by 30% with an estimated cost of US$6 billion per year. Several studies [34–37] reported similar magnitudes of expenditure to achieve comparable mitigation goals although based on different actions 12 . The mitigation effect of individual practice varies remarkably across space, emphasizing the importance of spatial targeting in terms of both practice and location selection to improve the cost-effectiveness of conservation practices, which echoes the findings from a rising line of studies on this topic [38–41].
Several limitations in our study should be borne in mind and warrant further investigation. Firstly, we have only focused on N loss in water but not the emission of nitrous oxide. Therefore, the effectiveness of conservation is not evaluated on a comprehensive basis. Recent study suggests that policies targeting water quality improvement provide substantial co-benefits from nitrous oxide abatement [42]. Second, our estimation of the area feasible for controlled drainage and restorable wetland includes high potential regions but does not cover the entire continental US due to limited data availability at the time when the analysis was carried out initially. AgTile-US [33] and Potentially Restorable Wetlands on Agricultural Land provided by EPA EnviroAtlas could be alternative data sources for estimating the feasibility by future studies. Third, the N loss reported in our study differs from the amount of nitrate ends up in the Gulf of Mexico and does not consider nitrogen legacy [43–45]. Both will depend on local hydrological and biogeochemical processes. The significant differences in mitigation patterns associated with individual policies will have important consequences for the amount of nitrate actually reaching the Gulf due to differential N transport through the MRB [46]. In future work, it will be valuable to incorporate our multi-scale analytical framework into hydro-ecological modeling capable of routing excess nutrients through the ecosystem.
Nonetheless, our study contributes several advancements to the current literature. The wider impacts of local decisions, or the spillover effect, is the most intriguing result we would like to emphasize. When some but all farms are targeted, the comparative advantage of farms is altered and the change is transmitted by prices in input and output markets across different scales, leading to unintended displacement of crop production and pollution. Similar 'leakage effects' associated with spatially targeted environmental policy intervention have been well recognized in the deployment of climate [47, 48] and air pollution policies [49], but the relevant literature is sparse in the context of water pollution except for a few economic studies [37, 50]. It is becoming a rising governance concern that the hidden external cost outside of the target area could 'offset the achievement within it' [47, 51]. However, the spillover phenomenon in policy making remains 'loosely conceptualized and poorly understood' [52]. The coupling of SIMPLE-G-US-CS and Agro-IBIS helps unravel the mechanism by explicitly characterizing the production technology and biophysical characteristics at different locations. We find that the spillover effects depend on the cost burden of conservation on farmers. The higher the farmers' burden, the larger the ensuing output reduction and market-mediated spillovers. The magnitude of the spillover depends on the specifics of the policy implementation, including foregone production value, co-payments required of farmers, and adoption rates. In our case, the leakage is still strongly outweighed by the mitigation efforts, but could hinder the achievement of expected conservation goals and raise questions of equity and efficiency.
This caveat, however, should not be seen as a barrier to support for targeting policy interventions that have been linked with efficiency gains and extensively prescribed by the literature [53, 54]. The ability of our model to identify the high mitigation efficiency hotspots provides an empirical foundation for formulating such policies to improve the efficacy of policy interventions [53]. Our finding that the leakage effect can be remedied by employing nationwide and regional strategies in tandem brings fresh insights into future policy design. In addition, our agroecosystem-supported economic model can be used to explore differentiated tax or subsidy to deter farmers from overapplying fertilizer or compensate them to change their behaviors. In contrast to the numerous studies that have confirmed the effectiveness of conservation practices on improving water quality, there is much less evidence to support that existing conservation programs are able to induce the enrollment of low-cost adopters and secure wide adoption of these practices. One reason why the undifferentiated policies fail could be the mismatch between the policy authorized payment and farmers' expectation, especially if the adverse yield effect is the concern. And the concern is not entirely irrational. A recent paper by Roy et al [14] shows that N application rates in many Midwest counties are still below the N input break-point, beyond which crop yield plateaus or declines. Our grid-cell based analysis also finds locations where crop yields could be limited by nutrient insufficiency. Assessing this concern requires a comprehensive understanding of site-specific N balance, the uncertainties associated with climate, production technologies, as well as the prices of crops and inputs (particularly N fertilizer).
A successful evolution from science to policy to practice hinges on innovative policy design. Future policies could pay more attention to the role of regulation on fertilizer products as an complementary tool to the voluntary, farmers-oriented conservation programs. For example, Shifren [55] advocates a municipal minimum sales share enhanced efficiency fertilizer ordinance as a new approach to tackle nitrogen pollution, not unlike what the Corporate Average Fuel Economy standards does to enhance fuel efficiency 'by regulating a handful of motor vehicles manufactures rather than by regulating hundreds of millions of drivers'. Our modeling framework can be readily extended to accommodate and test these possibilities.
Acknowledgment
We acknowledge support from the USDA-AFRI, Grants 2016-67007-24957 and 2019-67023-29679, and NSF Grants: CBET INFEWS/T2-1855937, INFEWS/T1-1855996 and AccelNet OISE-2020635. We thank Dr. Michael R Langemeier for providing the 2021 Indiana Farm Custom Rates surveyed by Purdue Center for Commercial Agriculture.
Data availability statement
The data that support the findings of this study are available upon reasonable request from the authors.
Footnotes
- 5
The N loss tax is a hypothetical nationwide policy that is expected to yield comparable mitigation outcomes as the other nationwide policy—split N application. The base tax rate is set uniformly nationwide for the sake of practical necessity. It is further adjusted by the N loss intensity to create the site-specific N loss tax rate such that the final rate is higher for the locations with higher N loss intensity. See section B of the SI for more information.
- 6
Split N means that growers make two or more N fertilizer applications during the growing season rather than supplying all of the crop's N requirements with a single treatment prior to or at planting. Side-dressing refers to applying fertilizers in a shallow furrow or band along the side of row crops.
- 7
Controlled drainage uses a water control structure to adjust the depth of the subsurface drainage outlet in order to control water in the field.
- 8
Wetland in this paper refers to constructed integrated systems that use the natural functions of vegetation, soil, and microorganisms as well as the environment to improve water quality.
- 9
Results of different tax rates from $0.1–$1/kg of N loss are reported in section G of the SI. The N loss charge (in $/kg of N application) is computed as the product of a charge rate (in $/kg of N loss) and nitrate-N loss rate (kg of N loss /kg of N application). For example, if a farm loses 30% of the N fertilizer applied, the actual cost of applying 1 kg of N fertilizer increases from the base price of $1/kg to $1.3/kg, which includes the $0.3/kg N loss charge. The 28.9% simply represents the aggregated N loss rate at the national level.
- 10
These results are generally comparable to those recorded in the CEAP regional reports, although a straight comparison between the two may not be reasonable given the difference of the actions considered in each study.
- 11
This number accounts only the cost for the control system but not the installation of the subsurface-drains itself due to lack of information. The cost of the latter varies depending on the spacing and depth of the drainage pipes.
- 12
These include the US$1.4 billion year−1 to reduce N loading in the Upper MRB by 30% through in and edge-of-field practices and retirement of land [34], US$2.6 billion year−1 through market and regulatory instruments to reduce N flows in the Ohio and Upper MRB by 25% [36], US$2.7 billion year−1 to reduce the hypoxic zone in the Gulf of Mexico to 5000 km2 through cropland conservation and fertilizer management practices [35], and US$6 billion year−1 opportunity cost in terms of the value of foregone crop production by changing N fertilizer intensification and crop acreage in order to reduce N runoff from crop production to the Gulf by 45% [37].
Supplementary data (1.6 MB PDF) The suppelmentary information provides technical details of the SIMPLE-G-US-CS and Agro-IBIS models, validation, and experimental design.