Executive summary
Climate change, population growth and income growth have the potential to significantly affect the availability and use of water in the Willamette River Basin. How these changes will affect water scarcity is uncertain. Individuals, communities, and governments across the WRB need to better understand how the supply and demand for water will evolve and vary across space and time in coming decades. The Willamette Water 2100 project was motivated in response to that need. The project was a six-year research effort aimed at developing a computer simulation model that represents the important processes of both the natural and human systems related to water supply and demand. Our understanding of water supply relies heavily on hydrology and related natural sciences, whereas our understanding of the demand for, and allocation of, water comes from economics, law, engineering and related social sciences. The linkages, interconnections and feedbacks in complex systems of this kind are very difficult to fully understand without a detailed model.
The WW2100 model allows us to project into the future the ways that changes in climate, population, and income from 2010 to 2100 will alter the supply, demand, allocation, and scarcity of water. This report describes results from the WW2100 model, with a focus on its economic dimensions, i.e., the impacts on people who live in the WRB.
Water supply
On the water supply side, the severe decline in snowpack in the next 80 years will reduce the amount of snowmelt runoff from April to June. The projected reduction in average available snowmelt (as of April 1 each year) represents a decline of about 600,000 acre-feet of stored water. However, precipitation plays a far greater role than snowmelt in determining spring streamflows in the WRB. Indeed, the projected decline in snowmelt is only one-tenth of average April–July precipitation (nearly 7 million acre-feet). As a result, unlike arid basins in eastern Oregon or neighboring states, the loss of snowmelt will have a relatively small impact on water availability in the lower elevations of the WRB in spring and summer. Nevertheless, reduced snowpack, when combined with higher summer temperatures, is projected to increase stress on upland forests and, as a result, increase the risk of wildfire.
Water use
In general, water use is influenced by both the demand (willingness to pay) for water and the cost of transporting, storing, or transforming water to make it available for a given use. The importance of cost considerations is critical. Demand for transported water depends on the value of water for a specific purpose relative to conveyance costs. For example, water is transported up to 25 miles from outside the WRB (often aided by gravity) to serve urban users. In contrast, we estimate that a quarter mile of horizontal or uphill conveyance can be costly enough to make delivery of water for irrigation uneconomic on most currently unirrigated agricultural lands in the Basin. Indeed, economic considerations explain why one-third of irrigable farmland (parcels with irrigation water rights) goes unirrigated each year. Irrigation involves costs and benefits, and, in some years and on some lands, the costs outweigh the benefits.
Key findings related to water use are as follows:
- Water use for irrigated agriculture fluctuates from year to year, but has exhibited no significant upward trend in recent decades. The per-acre amount of water required for irrigation is expected to remain relatively stable. However, seasonal patterns of irrigation are likely to shift about 2 weeks earlier in response to earlier planting dates resulting from climate change. The potential use of stored water to expand irrigation to farmlands that currently do not have irrigation water rights is limited by economic realities; conveyance costs are high relative to the economic gain from irrigating.
- Urban water use is projected to rise significantly by 2100, due primarily to population growth, but also to rising income. The growth in demand will be tempered to some degree by recent and near-term price increases related to cost recovery for infrastructure investments. The burden of these increases on WRB water supplies will be limited by several factors. First, most urban water is used indoors and is nonconsumptive, i.e., it is returned to the surface-water source from which it originated. Second, a large fraction of urban water supplies in the WRB come from sources outside the Basin. Thus, consumptive use from in-basin surface water sources represents only about 7 percent of total urban water deliveries and is projected to increase by only 16,000 acre-feet by 2100. Urban consumptive use of water from in-basin sources is small compared to other uses. Agricultural use (475,000 acre-feet) is 25 times greater, and regulatory minimum flows in the Willamette River (3.5 to 4 million acre-feet at Salem) are 200 times greater.
- Protection of in-stream flows (by federal and state law) is the largest allocation of water in the Basin under human influence or control. These flows serve multiple purposes, but are determined largely by habitat requirements of native fish. These minimum streamflows result from both federal requirements under the Endangered Species Act and state-mandated perennial minimum flows protected by in-stream water rights.
- The 13 federal storage reservoirs in the Basin produce enormous social value by reducing the risk of flood events. This benefit has been estimated at more than $1 billion per year. As urban areas expand, the value of potential damages during a flood will rise. Thus, the economic benefits of flood damage reduction will increase. To the extent that climate change leads to increases in high flow events, these benefits will become even more valuable.
Water scarcity
In some parts of the WRB and at some times of year, water is scarce, and that scarcity is likely to increase in the future. The potential for increased water scarcity will be location- and time-specific. Our model results suggest the following:
- The municipal water rights currently relied upon may reach capacity in the Metro area (in 30 years) and in Salem (in 60 years). However, when the model accounts for currently underutilized water rights and those under development, urban water rights appear to be capable of meeting the overall growth in urban water demand.
- Climate change is projected to result in earlier planting for agriculture. Earlier planting will lead to more crop growth during the months when temperatures are cooler and soil moisture is more available. Earlier planting will also lead to an earlier start, and completion, of irrigation. In the future, more farmers will have finished irrigating by the time the threat of a shutoff arises, according to the model results. As a result, the model shows a slight decrease in irrigation shutoffs. Climate models differ, however, in terms of whether precipitation is predicted to increase or decrease overall, although most models suggest somewhat wetter winters and drier summers.
- Implementation of all of the “unconverted” in-stream water rights intended to protect perennial flows would represent a significant increase in the amount of water allocated under state law to environmental values. Overall, however, our results suggest that flow requirements to protect salmon and steelhead can be met, based on 10-year average flows. Exceptions are likely to occur in drought years.
- The effects of changes in forest wildfires and fire suppression policies could have a larger effect on water supply in the Valley than all of the changes in human water use combined. If forest cover is dramatically reduced, the resulting decrease in forest evapotranspiration will increase streamflows and make more water available for human use.
Introduction
Climate change, population growth, and income growth have the potential to significantly affect the availability and use of water in the Willamette River Basin (WRB). Human decisions will contribute to these potential changes. Indirectly, changes in land use will affect where and when water is used for various purposes. Legal and regulatory changes, such as modifications to augment required in-stream flows for salmon and steelhead, will also influence the supply and demand for water.
Uncertainty about future supply of and demand for water across space and time created the motivation for this report. Individuals, communities, and governments across the WRB have a strong interest in gaining a better understanding of how changes in land use, climate, population, income, and regulatory requirements will affect the supply, demand, and scarcity of water. Policy makers, government agencies, and private interests need to better understand what kinds of changes are likely to occur so that they can act to mitigate or adapt.
Predicting the magnitude, timing, and location where water scarcity will arise requires a detailed understanding of the region’s biophysical and human systems—often referred to as a “coupled human–natural system.” Economic and biophysical components interact across space and time in complex ways.
The linkages, interconnections, and feedbacks in complex systems of this kind are very difficult to fully understand without a detailed model. Such a model was constructed by Willamette Water 2100 (WW2100), a 6-year research project.1 The WW2100 project involved dozens of researchers from Oregon State University, Portland State University, and the University of Oregon, bringing expertise in biophysical sciences, economics, engineering, planning, and law. The centerpiece of the project was the development of a large simulation model integrating all of these dimensions.
Creating a model of the human system for this region required a broad economics perspective of human actions and interactions. The model includes a system-wide representation of how humans interact with the natural system individually and collectively, as reflected in laws, regulations, property rights, and other institutions that guide and constrain our choices. These individual and public aspects of the human system manifest themselves in land use and land-use change; water supply and demand for urban, agricultural, reservoir, and in-stream flow allocations; and ecological water use by forests and other vegetation.
The main goals of the WW2100 study were twofold: (1) to project where, when, and under what institutional conditions (laws, regulations, and rights) water scarcity might increase in the WRB, and (2) to consider what kinds of policies and other actions might be warranted to prepare for, mitigate, or adapt to changes in water scarcity.
This report describes results from the WW2100 model, with a focus on its economic dimensions, i.e., the impacts on people who live in the WRB. Those impacts include two types:
- Changes in the availability of resources that are priced and exchanged in markets, such as land and urban water supplies
- Changes in nonmarket resources valued by society, including in-stream flows, forest health, flood risk protection, and recreational opportunities
The body of this report does the following:
- Describes the WW2100 model and provides an understanding of how the model and its components represent processes, interactions, and changes in the way people and resources interact
- Describes the main findings of the model’s simulations
- Highlights the economic aspects of expected changes in the Basin as they relate to water supply, demand, and availability for specific uses
Much of the technical background about the model components is included in the Appendix.
It is important to recognize the kinds of questions that our research, and this report, are not intended or able to answer. This work does not provide specific guidance to individual local governments, for example, regarding decisions to invest in or finance water supply infrastructure. Nor does our model provide advice to individual farms about adopting new irrigation methods or other farm-level investments. Although many characteristics and processes in the WRB have been modeled at high spatial and temporal detail, many other important dimensions cannot be described at the level of detail needed for decision making by individuals, farms, and local governments.
Moreover, it is important to acknowledge that results from most models, especially ones that make projections decades into the future, should be interpreted not as precise predictions, but as likely trajectories of change. Models are based on our best understanding of biophysical and human processes and how they are likely to interact in the future. In this way, a model is a tool that describes future conditions under a range of alternative assumptions and scenarios.
1 The project was funded by the National Science Foundation (EAR 1039192, 1038925, and 1038899).
Water allocation and scarcity
Economics is the study of the allocation of scarce resources—how people use and value resources such as water and land. Some resources are exchanged in markets. In this case, prices reflect their marginal (incremental) value, provide incentives, and encourage efficient use. For other resources, including water, some other allocation mechanism is often used.
Allocating water is complicated for a variety of reasons. Water is essential to all living things; as a result, most water is left in situ, or in the environment. Water has been described as a “fugitive” resource due to how it moves around, flows, seeps, evaporates, and is transpired by plants. In this and other ways, water poses challenges for individuals and society. For example:
- The availability of water varies and is uncertain across space and time.
- The cost of transporting or storing large amounts of water is high due to its high volume and weight relative to its value per unit.
- Water plays a key role in complex natural–human systems and is strongly related to public goods, such as ecosystems, fish and wildlife habitat, and recreation.
- Water plays a role in quasi-public goods, such as municipal water delivery, flood control, and power generation.
“Water scarcity” can be understood as the cost (or benefit) of having one less (or more) unit of water. It is therefore the marginal, or incremental, cost or value of water. Another way to look at this is as the cost of a decrease in water availability or the benefit of an increase in water supply.
Water scarcity can vary greatly and is often specific to a particular use, at a given time, in a particular location (Jaeger et al., 2013). It is useful to recognize that the scarcity of water depends in part on whether water can be transported to where it is needed, stored for later use, or transformed in quality (e.g., temperature, salinity, or potability) in order to be suitable for a particular use. Therefore, this key economic reality—the costs of transportation, storage, and transformation of water—is central to understanding where, when, and for what uses water will be scarce.
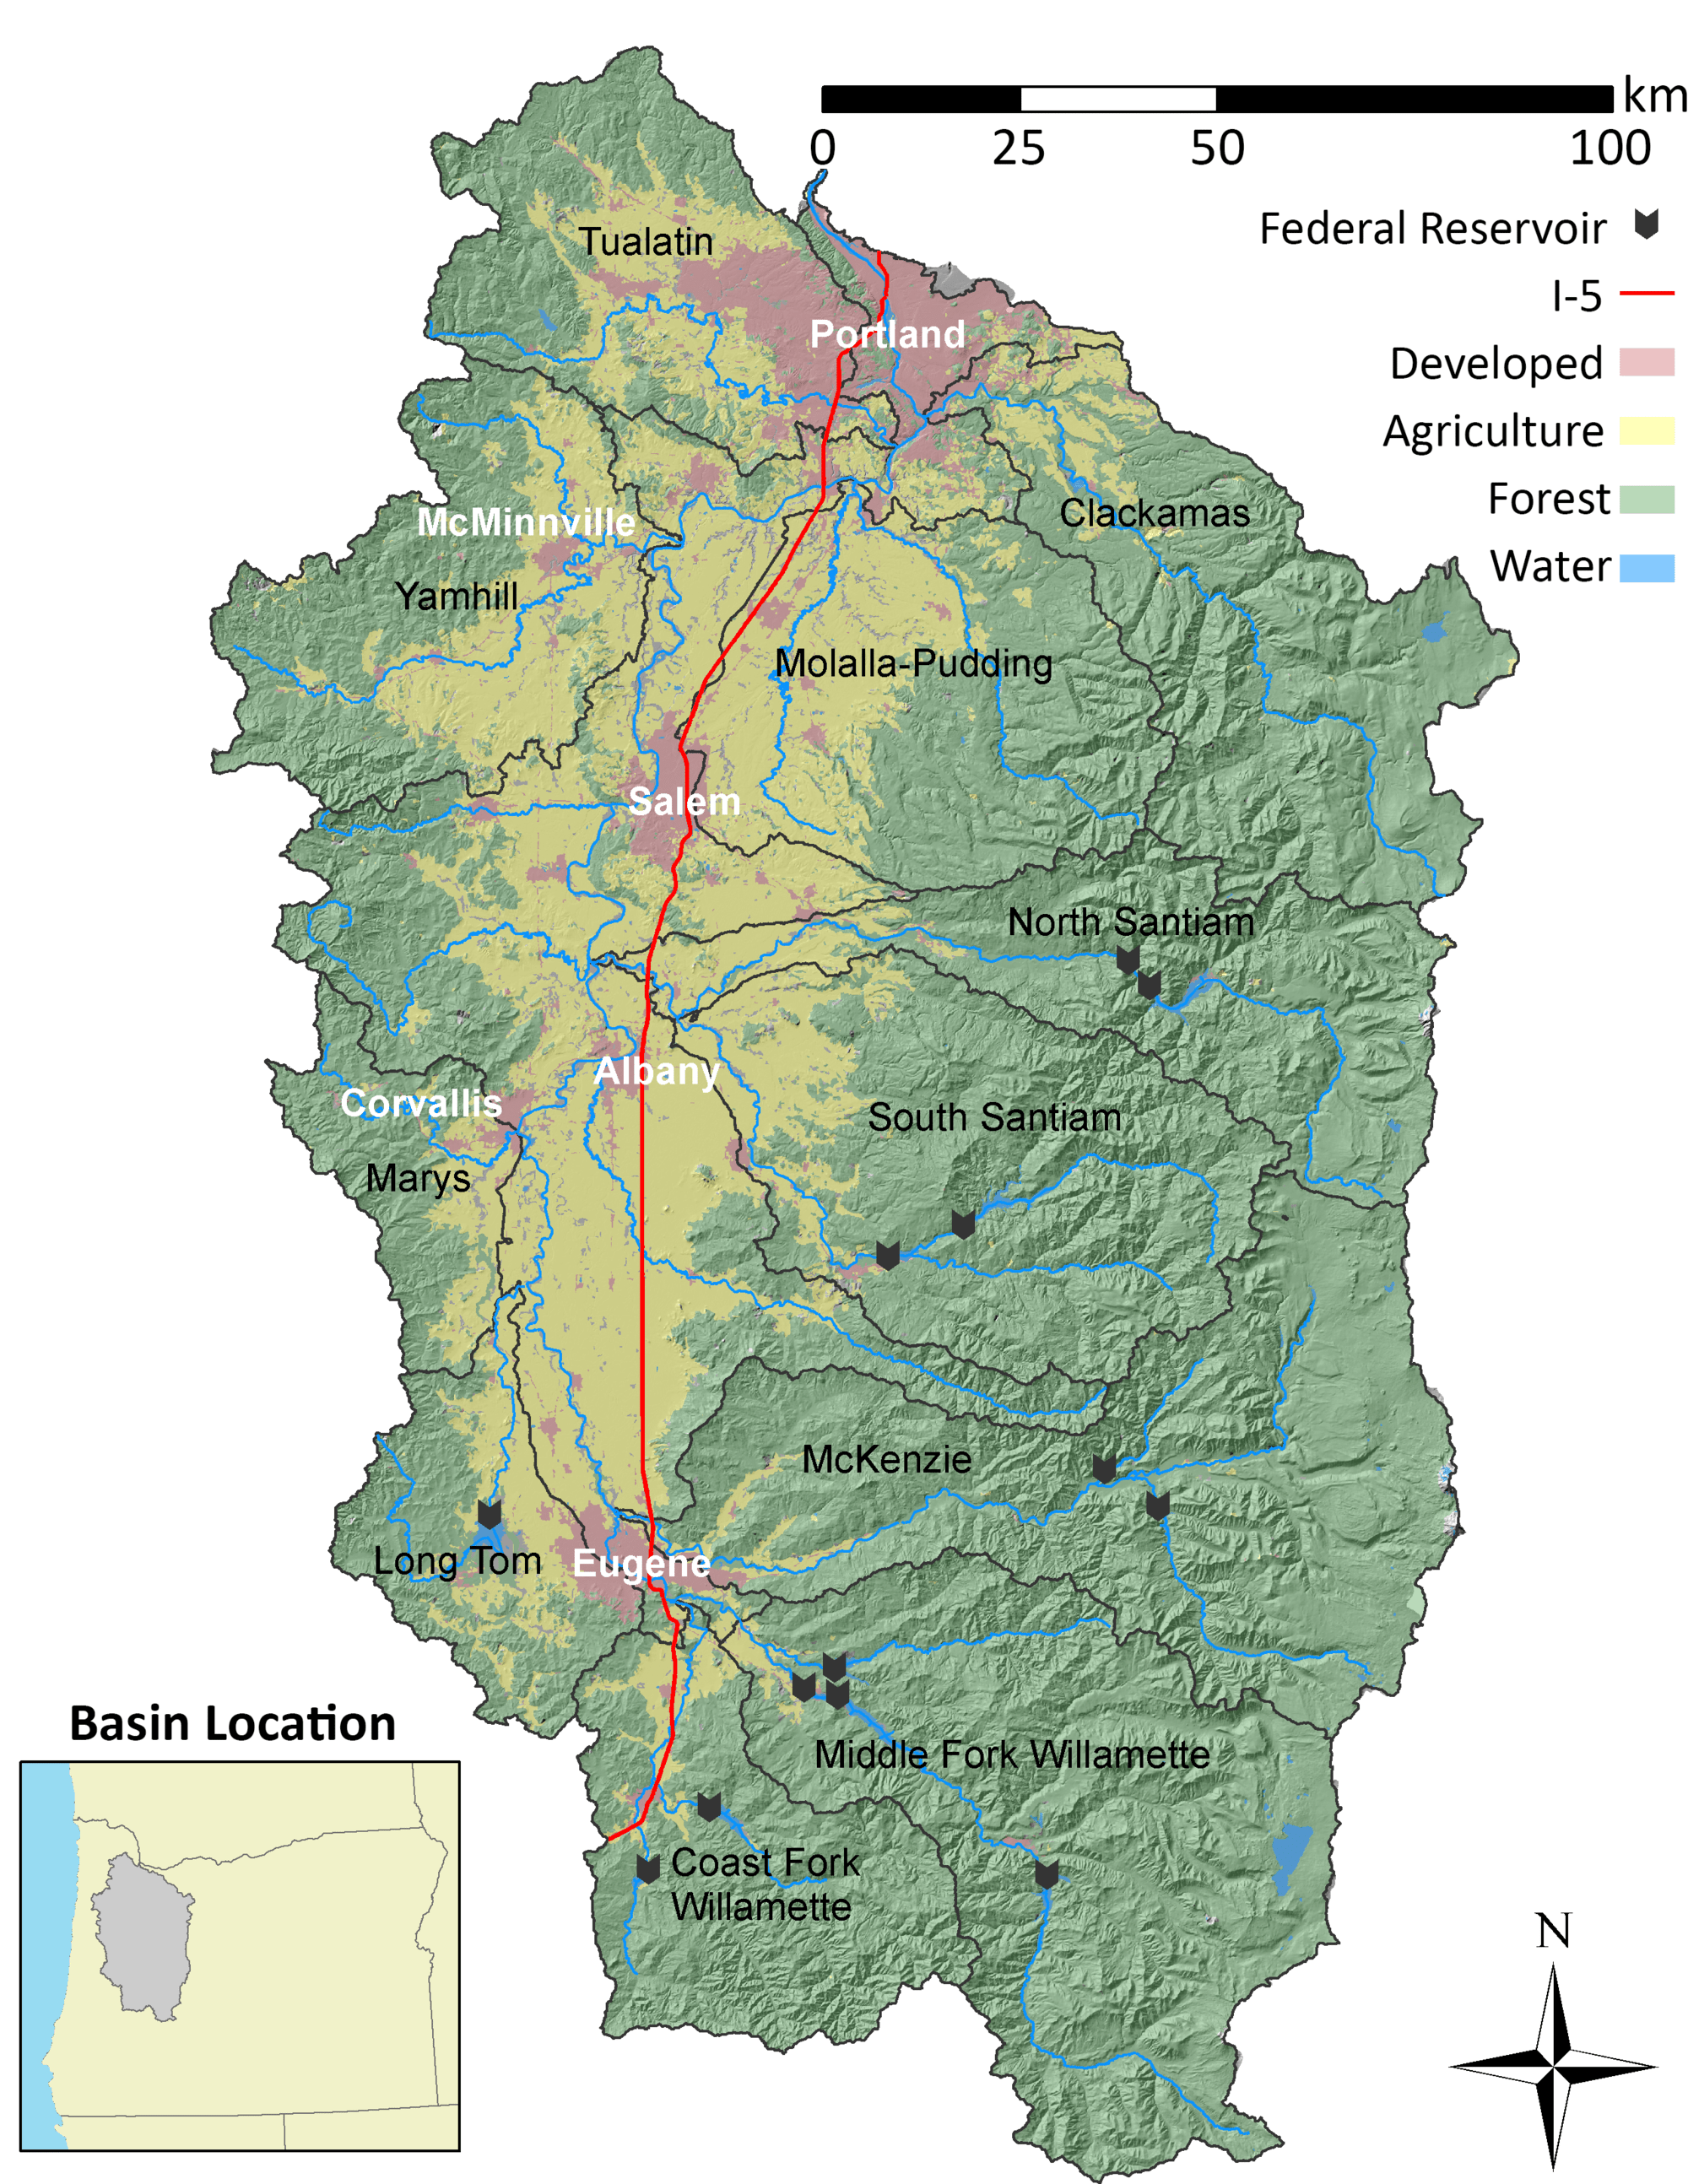
The Willamette River Basin and the WW2100 model
The Willamette River Basin encompasses 11,500 square miles in northwest Oregon, or 12 percent of Oregon’s land area (Figure 1). The Coast Fork of the Willamette River (originating in the Coast Range), the Middle Fork of the Willamette River, and the McKenzie River (both originating in the Cascade Range) join near Eugene, Oregon to form the mainstem Willamette River. From this confluence, the Willamette flows north between the Cascades and the Coast Range for 283 river km (176 miles) and enters the Columbia River near Portland, Oregon. The Willamette Valley, an agriculturally intensive region, contains Oregon’s three largest cities—Portland, Salem, and Eugene—home to over 60 percent of the state’s population.
The Basin’s underlying geology creates a setting in which various drivers of landscape change may impact hydrological processes. Thus, the Basin provides a rich and varied environment for studying the potential impacts of climate and human change on water resources.
The Cascade Mountains form the eastern border of the WRB. In this region, glaciers and extensive areas of mid-elevation snowpack are underlain by layers of low- and high-permeability volcanic bedrock. On the western border of the WRB, the Coast Range includes steep slopes underlain by low-permeability sedimentary and volcanic rock. This region receives more than 2,500 mm (98 inches) of rain per year, but little snowfall.
Tributaries of the Willamette traverse the region, providing the opportunity to examine streamflow response across a range of climatic, geologic, and ecological gradients and boundaries. After the McKenzie River, the largest tributaries are the Clackamas River, the North Santiam River, and the South Santiam River.
The WW2100 project developed a computer-based model of the Basin’s human and natural system components across time and space.2 The large number of detailed relationships and processes makes this model innovative and exceptional. The model includes physically and empirically based submodels of the biophysical system, as well as empirically based economic submodels of the human system. These submodels are linked using a simulation software platform, Envision.3
The model’s main components and linkages are represented in Figure 2). Processes determined outside the model (exogenous to the model) include daily temperature, precipitation, humidity, wind, and radiation (derived from downscaled regional climate data) and annual changes in population and income.4
The model’s economic components incorporate human behavior. The use of land and water for different purposes reflects the multitude of decisions that farmers, firms, and households make on a daily basis. Thus, the economic models incorporate choices and responses to prices in order to predict how agricultural and urban water withdrawals will vary by year and by season.
In the case of agriculture, evolving temperature and precipitation conditions affect plant growth, daily evapotranspiration (ET), and soil moisture. In turn, these factors affect decisions about crop choices, planting dates, and irrigation. In urban areas, population and income growth lead to increased water use, while other changes, such as higher water prices or increased urban density, limit the rate of increase.
The WW2100 climate projections are based on three General Circulation Models (GCMs) downscaled to 4-km resolution. The model’s reference scenario uses MIROC5. The “high climate change” scenario uses HadGEM, and the “low climate change” scenario uses GFDL.5
The Basin’s hydrology is represented by stocks and/or flows of rain, snow, soil moisture, groundwater, and streamflow in each of 160,000 landscape polygons, an overlapping network of river reaches and nodes, and 13 U.S. government reservoirs (11 of which store significant volumes of water). Daily temperature, precipitation, and atmospheric humidity determine surface hydrology, including snowmelt, ET, streamflows, and water temperatures.
The relationships between these hydrologic factors generate daily average streamflow and reservoir levels throughout the Basin’s network of stream reaches and reservoirs, all the way to the Columbia River. A reservoir model simulates reservoir fill and discharge to meet federal flood control, storage, and streamflow targets. All irrigation, municipal, and in-stream water rights are fully represented by a detailed submodel reflecting their point of use, point of diversion, priority date, maximum rate, duty (maximum total annual diversion), and beginning and end date.
Forest water use is modeled on a daily basis according to estimated ET rates, which vary with evolving forest characteristics (stand age, species type) and meteorological conditions. Forest fire and forest harvest models introduce disturbances to forest land cover and stand age.
At a fine spatial scale, the model simulates the period 2010 to 2100, with some processes adjusting annually and others taking daily time steps. Model processes that follow an annual time step include forest growth, harvest, and wildfires; the determination of land values and land-use changes; regulatory adjustments to urban growth boundaries; crop choices; and irrigation decisions. Daily time-step processes include routing of surface hydrology throughout the Basin’s stream network; water use (ET) by forests and other vegetation; and timing of crop planting, crop growth, irrigation diversions, urban water use, soil moisture, groundwater flows, and reservoir management.
2 The Willamette Water 2100 Project involved more than 40 researchers at Oregon State University, Portland State University, and the University of Oregon. The project leadership team and main investigators included Adell Amos (UO), John Bolte (OSU), Samuel Chan (OSU), Heejun Chang (PSU), Stan Gregory (OSU), Roy Haggerty (OSU), David Hulse (UO), William Jaeger (OSU), Christian Langpap (OSU), Hamid Moradkhani (PSU), Philip Mote (OSU), Anne Nolin (OSU), Andrew Plantinga (OSU), Desiree Tullos (OSU), David Turner (OSU), Kellie Vache (OSU), and Scott Wells (PSU). See a list of the entire project team.
3 The computer modeling platform Envision was developed by John Bolte at OSU.The economic model components were designed by William Jaeger, Andrew Plantinga, and Christian Langpap and were coded by David Conklin. The water rights model was developed, specified, and coded by James Sulzman, David Conklin, and William Jaeger. The forest model was developed by David Turner and David Conklin (see Turner et al., 2015). The reservoir model was developed using ResSim Lite by Desiree Tullos and Matt Cox. The hydrology modeling framework was developed by Kellie Vache. The biological water demand (ET) models were developed by Cynthia Schwartz.
4 Downscaling is a procedure whereby climate model projections for a large area (say 100 square miles) are converted into sets of estimates at a higher resolution (e.g., each 10-square mile area within the 100-square mile region).
5 For more detail on the climate model, see Turner et al. (2015).
Projected changes in climate, population and land use, 2010–2100
The WW2100 model, as described above, can simulate current or recent patterns of water supply and use. However, its main purpose is to simulate the future. In our model, future years will differ from current years due to three factors: changes in climate, changes in population, and changes in household income.
The model’s reference scenario generates trajectories of change for 2010–2100 in response to changes in climate, population, and income. The reference scenario is intended to reflect the most likely trajectory of change. It is based on “business-as-usual” assumptions about the existing system, including midrange estimates for exogenous drivers such as climate change, population growth, and rising incomes.
The reference scenario is one of more than 20 scenarios (see Appendix). Other scenarios include five different types of alternative scenarios developed for different purposes. See the Appendix for more detail.
Alternative scenarios can be very useful in helping to attribute outcomes to specific factors. They are also useful for policy analysis. The comparison of a reference scenario to a scenario that represents a policy change can provide insights into “what-if” questions about the costs, benefits, or effectiveness of public policies. See the Appendix for more details.
Natural system changes
The climate models used in WW2100 generate daily temperature, precipitation, and other variables from 2010 to 2100, based on major General Circulation Model (GCM) outputs. The WW2100 model includes three different climate scenarios. Results indicate that by the year 2100, temperatures in the WRB will rise by 1°C to 7°C (2°F to 13°F). Summer temperatures are projected to warm about 2°C (3.6°F) more than winter temperatures.
In the case of precipitation, the three climate scenarios indicate that winters will become slightly wetter and summers slightly drier (Figure 3) . However, there is no consensus, based on examination of more than 40 climate models, about whether the Basin’s climate will become wetter or drier overall.
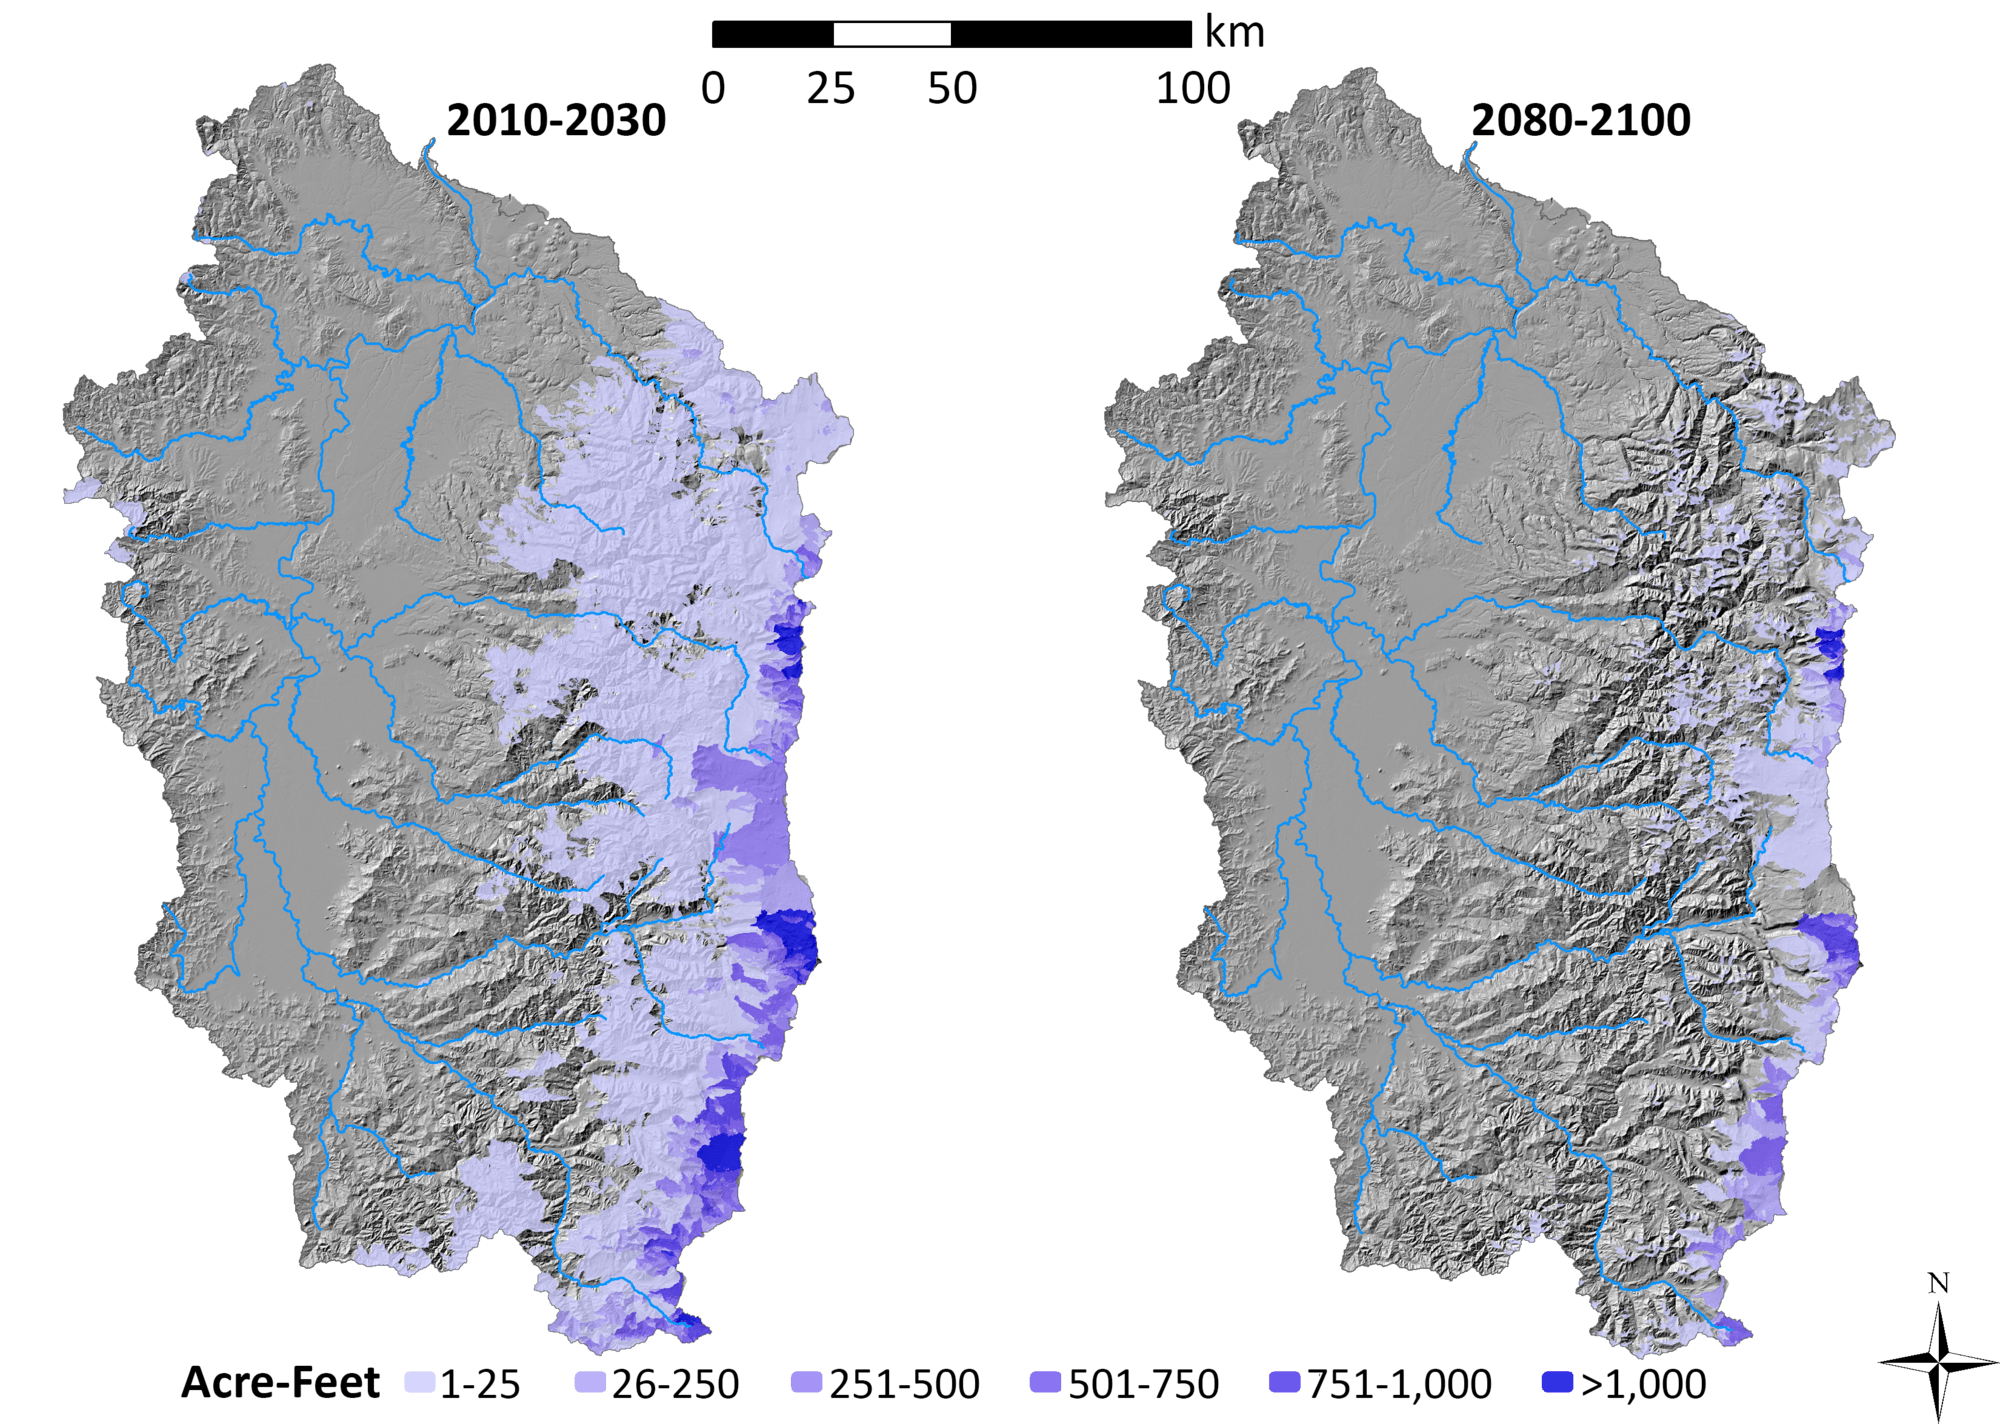
Climate change will result in changes in water supply at specific times and locations. Snowmelt has historically contributed about 600,000 acre-feet of water to streamflows from April 1 through midsummer, primarily in the Cascade Range. Snowpack may respond dramatically to even a few degrees of climate warming. The WW2100 model predicts dramatic reductions in winter snowpack (65 to 95 percent by late in the 21st century); see Figure 4.
Where streamflow depends on snowmelt, this loss of “natural” water storage will result in flows that are smaller and come earlier in spring and summer than has been the case historically (Figures 5 and 6, . However, spring precipitation plays a much larger role than snowpack in determining spring and summer flows in the WRB. Thus, the reduction in snowpack likely will have little effect on the supply of water for human uses in the lower basin. In Figure 7, we compare the 10-year-average midsummer (July and August) discharge for each subbasin. In both the reference scenario and the high climate change scenario, we see no significant decline in average summer flows.
However, the loss of spring snowmelt may have serious ecological ramifications for forests and their ecosystems. In the Mediterranean-like climate of the Pacific Northwest, available soil water declines in mid- to late summer. If less snowpack is available to delay soil water depletion, the result will be a longer summer dry period. Across the three climate scenarios, the result is an increase in the area of wildfires of 200 to 900 percent. Wildfires can be expected to increase the transition to new forest types and reduce the availability of forest land for timber harvest (see Figure 8, p. 15, and Turner et al., 2015). As forest cover declines, reduced forest water use will allow more surface water to flow into the Willamette Valley.
Changes in population, income and land use
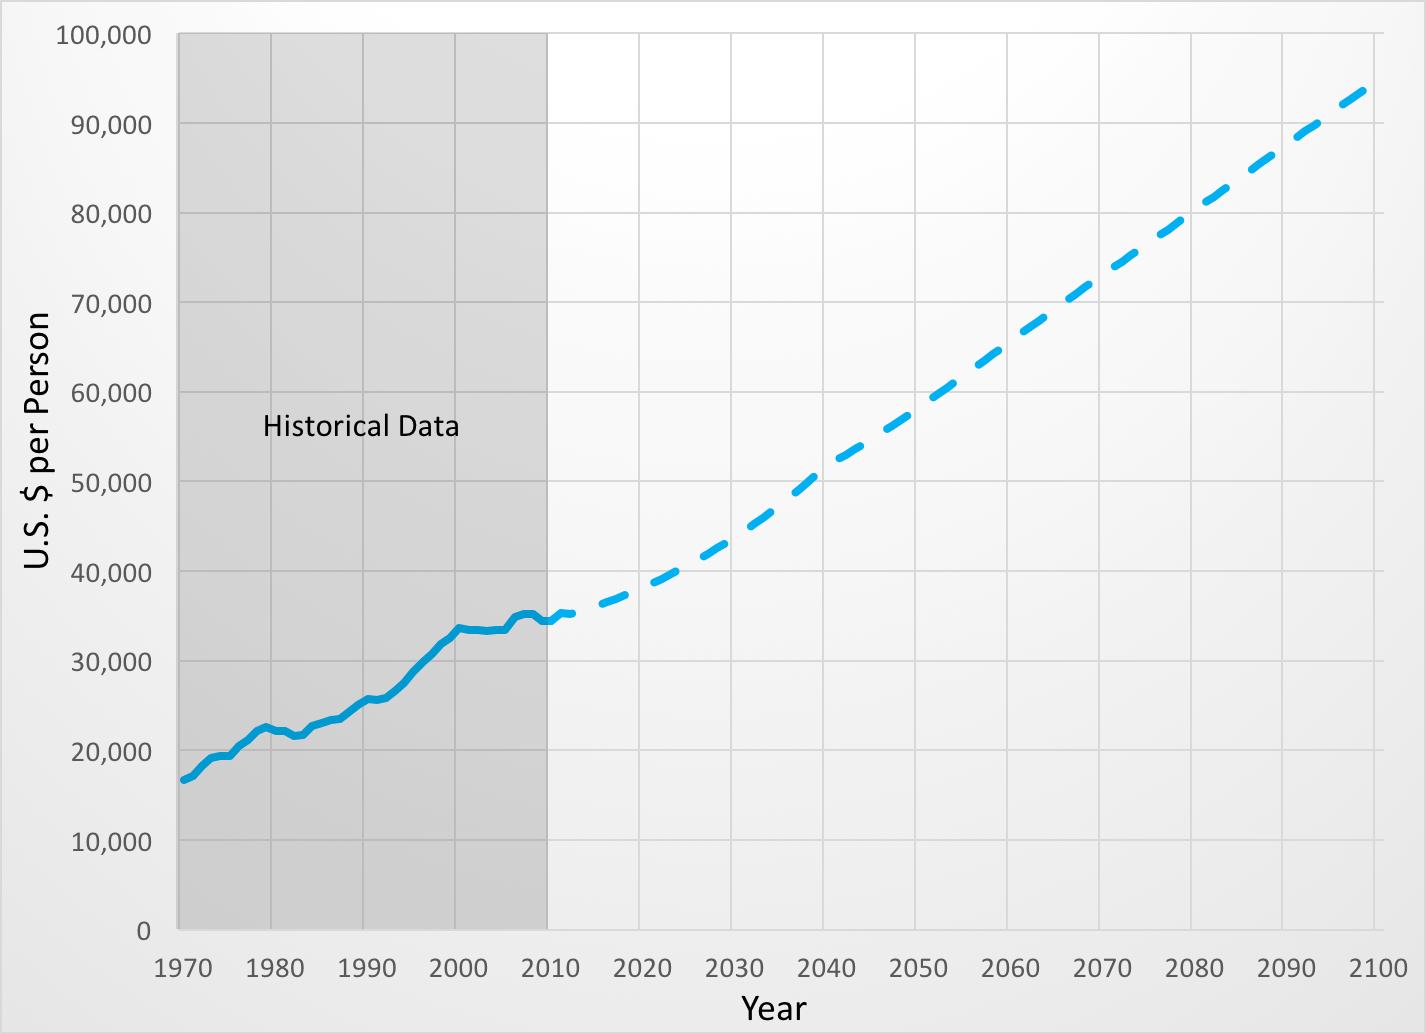
Population and income growth are assumed to be determined by forces outside the model. Thus, like climate change, these factors are exogenous to any actions by individuals or policy makers in the Basin. These trajectories are shown in Figures 9 and 10.6
County-level population projections to 2050 are taken from the Oregon Office of Economic Analysis. Income projections to 2040 are from Woods & Poole Economics, Inc.. Beyond 2050 and 2040, population and income are assumed to increase at the historical average annual rate. Income figures represent mean total personal household income expressed in “real” (inflation-adjusted) 2005 dollars. Projected trends are described in more detail and compared to historical trends in the Appendix.
The land-use model is based on historical data from the National Resources Inventory (NRI) and county assessors’ offices. The land-use models incorporate the economic returns to forest, developed, and agricultural uses for each parcel, or IDU (Integrated Decision Unit). Relevant characteristics of IDUs include distance to the nearest city, population density and household income in the nearest city, and soil quality. The calculated value for each use changes over time with evolving IDU characteristics. For example, growth in population and income increases the returns to developed uses of land, relative to forest and farm uses.
The functions that estimate the economic returns to each land use were derived from historical data for the Willamette Valley (Bigelow, 2015).7 During a model run, land-use changes may occur annually at the IDU level; in response to changes in the relative returns to different uses, IDUs may shift among agricultural, forest, and urban uses.
Urban expansion is regulated by Oregon’s statewide land-use planning system, which requires the use of urban growth boundaries (UGBs) to guide the location of urban development. It is assumed for the reference scenario that future land development will take place inside UGBs, although UGBs can expand (i.e., IDUs are added to a UGB area) when the amount of developed land within the UGB exceeds a specified percentage. Approximating rules under Oregon’s land-use planning system, the model adds IDUs to a UGB on the basis of adjacency, distance to the UGB center, distance to a major road, and zoning. As a result, development in 2100 is clustered in a way that resembles the pattern in 2010. Figure 11 shows that most urban expansion will occur in the Portland Metro area, where population increases are projected to be greatest.
Population density is an important determinant of developed land values. In many of the major cities in the Basin, population density is projected to increase under the reference scenario, although in some cases it remains relatively constant (Figure 12, p. 19). Increasing urban populations and population density will lead to rising values for developed land (Figures 13, p. 19; and 14, p. 20), thus increasing the conversion of land to developed uses. Other contributing factors to land conversion are income growth, which raises per-capita consumption of land for housing, and expansion of UGBs, which makes more land available for development.
In 2010, developed land accounted for about 4.7 percent of the total land area of the WRB; this share is projected to rise to about 7.2 percent by 2100, a 54 percent increase (Figure 15, p. 21). This increase is mirrored by declines in agricultural land (from almost 22 percent of the total area to 20.2 percent) and forest land (from 70.6 percent to 69.7 percent). Thus, despite large increases in population and income, a large amount of agricultural and forest land is expected to remain in the Basin at the end of the 21st century.
Two alternative scenarios show the sensitivity of model results to assumptions about population growth and UGB expansion rules. As expected, when population is assumed to grow at double the projected rate, or the threshold for expansion of UGBs is relaxed, urban development increases at considerably greater rates. These two alternative scenarios are compared to the reference scenario in Figure 16. In these scenarios, total developed land increases by approximately 96 percent (high population growth) and 64 percent (relaxed UGB expansion rules).
6 Recently, there has been discussion about the possibility that climate change might lead to large increases in migration from other regions of the country to relatively wet, cool regions such as western Oregon and Washington. Existing economic studies do not find evidence that migration is significantly responsive to changes in temperature in the U.S. The availability of air conditioning is one reason. Another is the fact that agriculture, as a source of employment and income, plays a much smaller role in the U.S. economy than in the past, for example, during the Dust Bowl. (See Lewis and Peri, 2015, for an overview.)
7 In the same way that population, income, and climate are treated as exogenous, we assume that prices for agricultural and forest commodities, which influence forest and agricultural land values, are exogenous, since they are determined in global markets. We assume that they will remain at current levels in real, inflation-adjusted terms, since we have no specific basis for assuming that they will rise faster or slower than other prices or wages.
Urban water use and pricing
Water in urban areas is put to residential, commercial, and industrial uses. The amount used depends on a range of factors, including population, price of water, income, population density, and the use of water-conserving technologies such as low-flow toilets. Many empirical studies based on household, city-level, or national data have estimated urban water demand and identified the most important factors affecting municipal water use (see Appendix).
The WW2100 model’s water demand relationships are used to generate estimates of the quantity of water expected to be used in each urban area in future decades. It is important to recognize that these results reflect underlying assumptions about population, income, and water price trends. Because multiple changes may affect the economics and demographics of urban water demand, these projections can be interpreted only as suggestive of a plausible future path. For example, if urban water prices rise faster than model assumptions, urban water use will be lower than the model predicts. In this case, water supply capacity might be more than sufficient to meet demand.
Urban water pricing
Unlike competitive markets, urban water prices are regulated by local governments. Urban water utilities set water prices to achieve multiple goals. These goals include generating revenue to cover costs, assuring affordability, providing stability in revenue, and achieving an allocation of cost that is considered “fair” to various types of ratepayers. Utilities may wish to fully cover all costs, while at the same time providing customers with efficient and transparent incentives to conserve water.
Urban water delivery systems are highly capital intensive, with a need for large investments in infrastructure (building, maintenance, or replacement) on an intermittent basis, sometimes decades apart. In a typical year, customers may not be aware of these capital costs, making it difficult to set prices so that long-term costs are covered. As a result, water prices tend to be somewhat lower than long-run average or marginal costs, leading to financial deficits and delays in infrastructure investment, repair, and replacement.
This situation is well documented in historical data, surveys, and engineering analyses. U.S. Environmental Protection Agency (EPA) survey data, for example, indicate that average water prices are frequently more than 20 percent below long-run average cost (USEPA, 2009). The gap between average price and average cost has fluctuated over time and across cities and states.
Water prices in major U.S. cities have at times risen more slowly than inflation. In the past 20 years, however, they have risen faster than inflation. Nationwide, an extended period of declining urban water prices (inflation-adjusted) lasted until about the 1980s. Since that time, rising urban water prices have been observed.
Since 2010, urban water prices have increased in the WRB. Increases have been due in part to the need to expand or upgrade infrastructure. In some cases, utilities face new requirements to implement seismic risk reduction upgrades. As a result, urban water prices in some parts of the Basin increased more than 30 percent between 2010 and 2015.
In a separate survey, the EPA has documented the backlog of infrastructure needs for drinking water systems nationwide (USEPA, 2013). Nationwide, the “20-year need” totaled $376 billion in 2011. This backlog has fluctuated, but has been rising, from $843 per person in 1995 to $1,205 per person in 2011.
The backlog of infrastructure needs in Oregon has generally been higher than the national average, rising from $1,108 per person in 1995 to $1,442 in 2011.8 The exception was in 2007, when Oregon’s per-capita need was $845, compared to the national average of $1,220. The reduced backlog of infrastructure needs in Oregon between 2003 and 2007 followed a 53 percent increase in average prices in Portland between 1999 and 2007, which likely financed significant infrastructure improvements.
Predicting urban water price trajectories is complicated not only by long-term infrastructure investment costs, but also by the regulatory and political factors involved in setting water prices, which often cause price increases to lag behind cost increases. Furthermore, when prices are raised to cover higher costs, the effect can be counterproductive to some extent; higher prices may lead to reduced water use, thus reducing the anticipated increase in revenues.
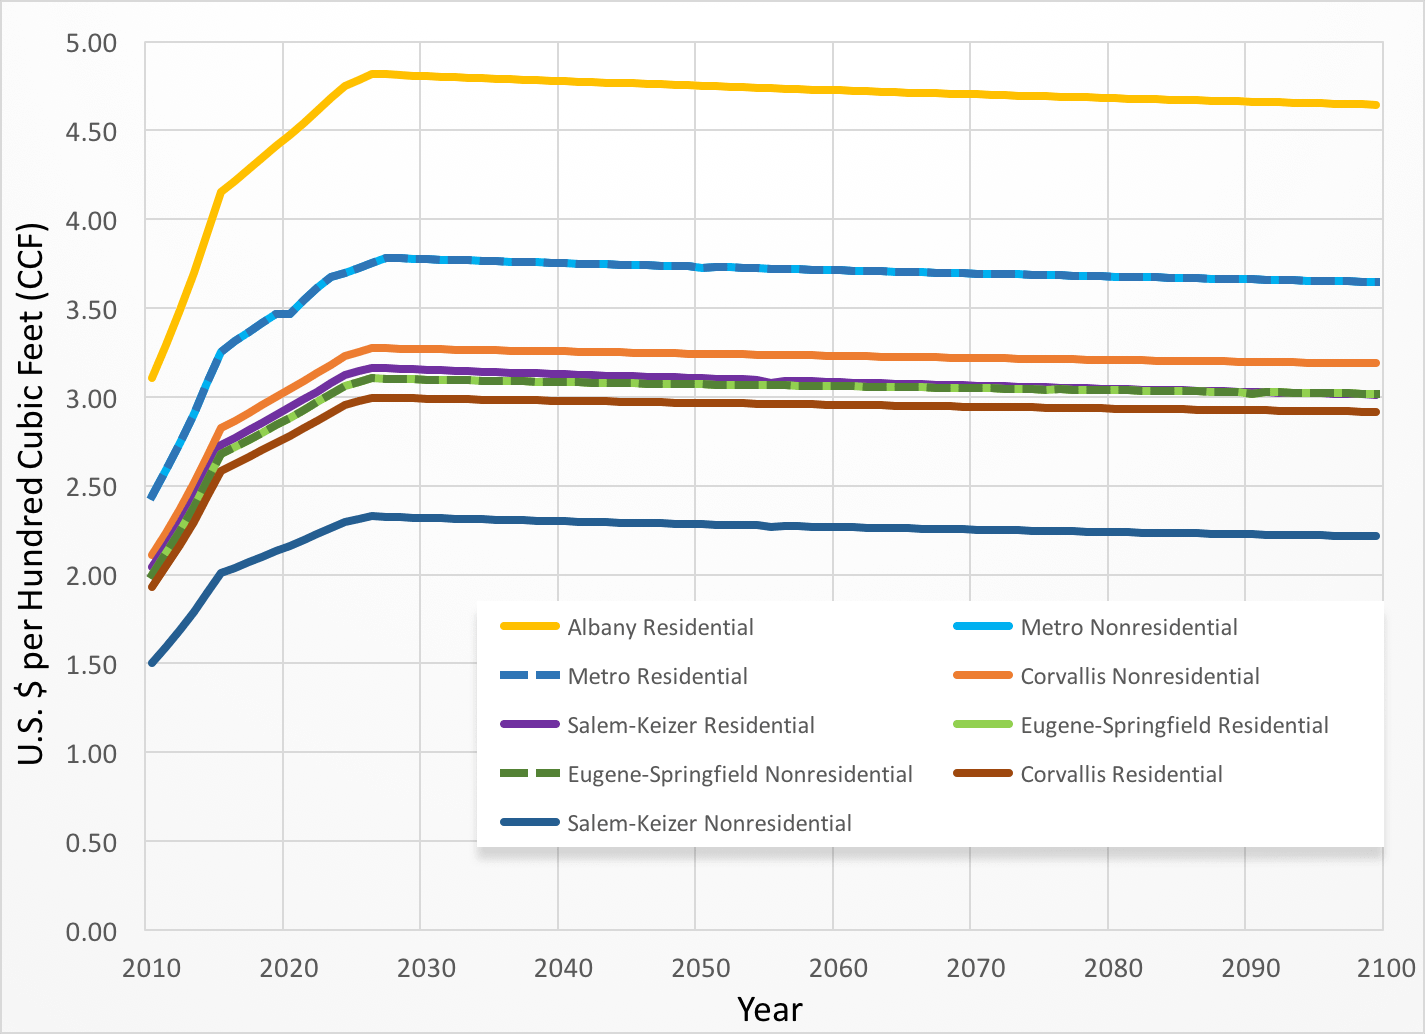
Our reference scenario assumes initial prices that reflect prices in the Basin’s major cities in 2010. Future price trends reflect observed recent price increases in many cities (as of 2015), as well as the fact that the backlog of infrastructure needs in Oregon is relatively high. To represent observed price increases, the model implements annual price increases of 6 percent from 2011 to 2015 (in real, inflation-adjusted dollars). To reduce estimated system needs over the next 20 years, from $1,442 per person to $1,050 (the national average observed since 1995), annual per-person revenues would have to increase by an additional $40, or more than 25 percent. Thus, average water prices are assumed to increase 1.5 percent per year from 2016 to 2025. The result is a cumulative price increase between 2010 and 2025 of 55 percent. After 2025, urban water prices (in inflation-adjusted dollars) are assumed to change only in proportion to changing costs. Figure 17 shows these price trends for the nine largest urban areas.
The high infrastructure costs associated with water delivery produce significant “economies of scale.” In other words, the average cost of water delivery per household is somewhat lower for large population areas than for small ones (see, for example, USEPA, 2009). The model takes account of the fact that as cities grow, the average cost per household will decline slightly.
The effect of price increases on total household expenditures will be small, as spending on water represents only one-third of 1 percent of household income, and price increases will be offset by reduced consumption of other goods and services. As incomes rise, the share of household income spent on water is expected to decline to less than half the current level (Figure 18, p. 25; and Figure 19, p. 26). For low-income households, however, the cost of water will represent a more significant share of income.
8 Since most urban populations in Oregon live in the WRB, the model uses Oregon-wide data as a reasonable indicator of the situation in the Basin.
Total urban water use
Population growth is one of the main drivers of increasing urban water use. Another factor that affects urban water use is income growth. As incomes rise, people tend to use somewhat more water (e.g., with bigger houses, yards, and gardens).9
Although it is sometimes thought that urban water use is not responsive to changes in price, dozens of economic studies have shown that long-run responsiveness to price is substantial. Indeed, on average, a 40 percent increase in the price of water can be expected to result in approximately a 24 percent decrease in water consumption. See the Appendix for more detail on the impact of price and other factors on water demand.
For four major urban areas (Portland Metro, Salem, Corvallis, and Eugene-Springfield), the WW2100 model consists of separate models for residential and nonresidential urban water demand. For other cities, residential and nonresidential demand are combined.
Per-capita consumption has been declining for the past 20 years, due to price increases and a range of urban water conservation programs (see Appendix for discussion). Model results indicate that per-capita water use (withdrawals) will stabilize at 80 to 100 gallons per person per day, before rising very gradually due to projected growth in per-capita income (Figure 20, p. 26).
For 2015, the model estimates total annual urban water withdrawals of about 330,000 ccf/day (272 million gallons), or 305,000 acre-feet/year. Our projections show this total rising in coming decades for the Basin as a whole, especially for the Portland Metro area, mainly due to population growth (Figures 21 and 22, p. 27; and Figure 23, p. 28).
Given the uncertainty about future urban water prices, the model projects urban water demand under a range of price trajectories. This sensitivity analysis makes it possible to evaluate how different price paths would affect the level of water use in the Portland Metro area and other cities. Basin-wide, if urban water prices were 25 percent higher than those projected in our reference scenario, urban water use would be 12 percent lower than in the reference scenario. With a 50 or 75 percent price hike, the reduction would be 25 percent and 37 percent, respectively (Figure 24, p. 28; Figures 25 and 26, p. 29). Under these scenarios, per-person water consumption in the Portland Metro area would be expected to decline to about 70, 62, and 55 gallons per day, respectively.
9 The model’s water demand relationships are based on peer-reviewed economics research, including more than 100 published studies of urban water demand.
Consumptive use of WRB surface water
Consumptive use of surface water refers to water that is not returned to its source; it is lost to ET, evaporation, or groundwater. In contrast, nonconsumptive use refers to water that is returned via wastewater treatment facilities to streams. Three important factors affect urban consumptive use of surface water in the WRB.
First, urban water use varies significantly between indoor and outdoor uses. Outdoor use is largely consumptive. By contrast, indoor water use is mostly nonconsumptive; the amount of water returned to streams is roughly equal to the amount diverted. Thus, the net use of water in urban areas is significantly less than total diversions (Figure 27, p. 31).
Second, urban water use shows seasonal patterns that reflect the rise and decline of outdoor water use. Whereas indoor water use is assumed to be evenly distributed throughout the year, outdoor water use is assumed to begin at low levels in April, peak in July, and decline to zero in October (Figure 28, p. 31; Figures 29 and 30, p. 32). In the summer, about 40 percent of urban water use is outdoors (consumptive).10 It is assumed that the seasonal distribution of total demand will not change in future years. For the six largest metropolitan areas in the Basin, our model predicts an increase of 36,800 acre-feet per year in summer outdoor (consumptive) use (Table 1).
| Change in urban consumptive water use (acre-ft/yr) | Net of displaced surface irrigation (acre-ft/yr) | Net of reduced surface and groundwater irrigation (acre-ft/yr) | |
|---|---|---|---|
| Portland Metro area | 25,028 | 17,532 | 5,833 |
| McMinnville | 1,181 | (664) | (1,239) |
| Salem-Keizer | 5,992 | 3,742 | 802 |
| Albany | 1,224 | 979 | 318 |
| Corvallis | 814 | 394 | (126) |
| Eugene-Springfield | 2,560 | 2,037 | 501 |
| Total | 36,800 | 24,021 | 6,090 |
Finally, it is important to recognize that nearly half of urban water demand in the WRB is met by water imported from out-of-basin surface-water sources. Most of this water comes from the Bull Run Watershed, located ٢٥ miles east of downtown Portland in the Sandy River Basin on the Mt. Hood National Forest. Bull Run supplies all of the drinking water for the City of Portland and some water to other cities in the Portland Metro area. From June through October, additional water is supplied to the western Metro area from two other out-of-basin sources, Barney Reservoir and Scoggins Reservoir, both on the western side of the Coast Range.11 As a result, consumptive urban water use from in-basin surface-water sources is less than 10 percent of total urban water deliveries. These different measures of urban water use are reflected in Figures 27 through 30.
10 The seasonal pattern of urban outdoor water use is based on 24 years of data from the Portland Water Bureau.
11 The WW2100 model does not include the climate and hydrology of these out-of-basin areas. Our implicit assumption is that these sources will continue to provide the quantities of water authorized by the corresponding municipal water rights.
Effects of climate change on urban water demand
Climate change could affect urban water demand, primarily due to the effects of changing temperatures and precipitation on lawn and garden irrigation, as warmer temperatures may increase the ET rate of grass, flowers, and trees.
Our urban water demand model does not include any adjustment for the direct impacts of climate change on urban vegetation and outdoor water use. However, the agricultural growing season (March–September) corresponds to the seasonal increase in urban water use; thus, we can make inferences based on the effects of climate change on agricultural ET and water use. The model includes ET for grass seed; orchards, vineyards and tree crops; and a broad category of “other crops.”
In the reference scenario, the trend in “maximum ET” (the total seasonal ET that occurs if plants always have adequate soil moisture) for agricultural crops is flat, fluctuating slightly around an average of 425 mm (16.7 inches). In the high climate change scenario, maximum ET for agriculture increases about 2 percent between the beginning and end of the century. For grass seed and “other crops,” maximum ET decreases slightly. By contrast, the model shows a 24 percent increase in maximum ET for orchards, vineyards, and tree crops.
Assuming that ET for urban vegetation is similar to that of crops, these estimates suggest that climate change will not lead to a significant increase in urban water use in the WRB by the year 2100.13 Furthermore, the increase in ET for orchards and trees, if comparable to urban tree cover, could be partially offset by planting species with lower water requirements.
13 Chang et al. (2014) analyzed historical data on daily water use in Portland, Oregon, as well as the effects of variations in temperature on monthly and seasonal use. Their analysis suggests that the effects of climate change on urban water use would be no more than 1 or 2 percent by late in the 21st century.
Effects of reduced agricultural irrigation on urban water supply
Urban growth will to some extent displace agriculture, including some irrigated lands. The model assumes that irrigation water rights are relinquished or converted to municipal water rights when farmland is converted to urban development. These water rights will help meet the growing demand of cities.
The model projects that displacement of surface-irrigated farmland could offset about one-third of the increase in urban consumptive (outdoor) water use, reducing the net increase to an estimated 24,000 acre-feet.
This effect varies significantly among cities, depending on the extent and direction of urban expansion, as well as on the proximity of the city to surface-irrigated farmland. In Albany, for example, the offset is only 20 percent. In McMinnville, reductions in surface irrigation will more than offset increased urban water use (see Table 1).
Scarcity in urban areas
City governments are understandably concerned about how the growing demand for water will be met. “Live” or natural surface-water flows are already fully appropriated, and currently federal reservoir storage can be allocated only to agriculture. Cities will also compete with in-stream water rights and regulatory flows established under the Endangered Species Act. These requirements represent a large proportion of summer flows and may increase (see “In-stream Flows”).
The results presented in Figure 31 suggest that currently utilized municipal water rights may reach capacity in the Metro area in 30 years. Demand (primarily in summer months) may exceed existing capacity by about 12,000 acre-feet annually by the end of the century. Our model suggests that Salem may reach the capacity of currently utilized water rights in 60 years and may require an additional 3,000 acre-feet per year by the end of the century.
Nevertheless, it appears that municipal water rights will be adequate to meet nearly all of the increased water demand expected through the year 2100 (see Appendix for details). One factor is that many cities rely on out-of-basin water and/or have multiple water rights, some of which are not currently utilized. Unutilized or underutilized sources may include surface water, groundwater, and aquifer storage and recovery. (Cities also plan strategically to have extra or redundant water rights for unexpected circumstances). Not all of these water rights are included in our model. Furthermore, the Tualatin Valley Water District is constructing a large new water supply system, which will draw water from the Willamette mainstem.14
Conditions vary across cities and towns in the WRB and will often differ from the overall or average results summarized here.
14 This water right is not included in our model. Scheduled to be completed in 2026, this source will be able to deliver 100 million gallons (more than 36,000 acre-feet) per day during the four peak summer months. It is designed to serve more than 300,000 residents in Beaverton, Hillsboro, and Tigard.
Alternative scenarios and urban water use
A number of alternative scenarios were assessed to explore how population and income growth might affect urban water use.
In a high population growth scenario, urban water use increases by almost 20 percent by 2030, 36 percent by 2060, and almost 50 percent by the end of the century, relative to the reference scenario. With high population growth, currently utilized water rights may reach capacity in the Metro area somewhat earlier (intermittently starting in 2017 and permanently from 2032 on). Demand (primarily in summer months) may exceed existing capacity by 47,000 acre-feet per year by the end of the century. Other urban areas reaching capacity for utilized water rights are Salem (by 2046) and Albany (by 2058), with demand exceeding capacity by roughly 27,000 and 2,800 acre-feet per year by the end of the century, respectively. Conversely, in a scenario in which no population growth is assumed, basinwide urban water use decreases by almost 21 percent by 2030, 38 percent by 2060, and 52 percent by the end of the century, relative to the reference scenario.
In order to assess the importance of income growth, a scenario is included in which income does not change (in real, inflation-adjusted terms). In this scenario, basinwide urban water use is 4 percent lower than in the reference scenario by 2030, 9 percent lower by 2060, and 13 percent lower by the end of the century.
Finally, a scenario is included in which both income and population are kept constant. In this case, basinwide urban water use is 24 percent lower than in the reference scenario by 2030, 44 percent lower by 2060, and 58 percent lower by the end of the century.
Water use in agriculture
More than 800 significant crops are grown in the WRB by some OSU estimates. Two crops stand out in terms of land area—grass seed, which is grown on about one-third of farmland, and pasture, which accounts for one-sixth of farmland.15 No other crop is grown on more than 5 percent of the Basin’s acreage. Crop choices have changed in the Basin and are likely to continue to do so. Nursery crops have become more important, and, as of 2016, significant new hazelnut acreage is being planted.
In Oregon, as elsewhere in the western U.S., agriculture is the largest out-of-stream human use of water, accounting for about 80 percent of out-of-stream use. Unlike many parts of the western U.S., however, most WRB farmland is not irrigated. A majority of the 1.5 million acres of farmland in the WRB rely directly on precipitation, rather than irrigation. Most of the major crops are grown both with and without irrigation. Exceptions include corn, which is always irrigated, and winter wheat, which is almost never irrigated. About a quarter of grass seed is irrigated, as is 10 to 20 percent of pasture.
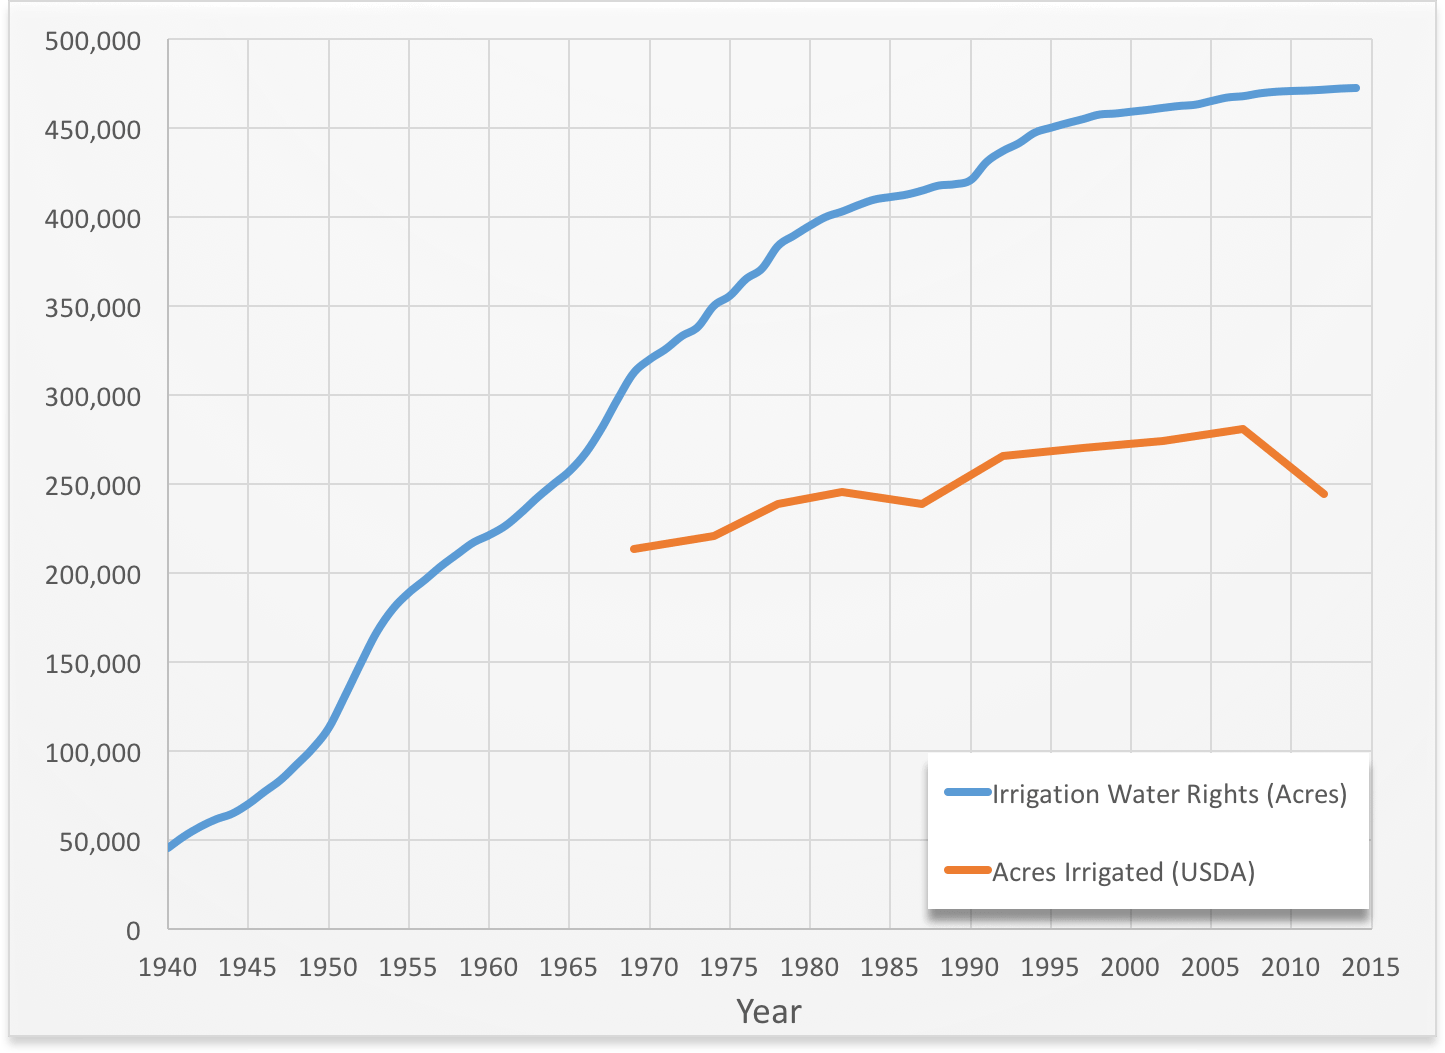
About one-third of WRB farmland has irrigation water rights. Slightly more than half of these are surface-water rights; the rest are groundwater rights. Growth in the acreage of farmland with irrigation water rights began in the 1940s and leveled off in the 1990s (Figure 32). The location of farmlands with irrigation water rights (both surface and groundwater) is shown in Figure 33.
Irrigation practices in the WRB are unusual, compared to other irrigated areas in the West, in that in any given year only about two-thirds of irrigation water rights are utilized. Of the total acres with water rights, only 60 percent or less are irrigated in a given year. See Figure 32.
Over the past 20 years, irrigated acreage in the WRB has been flat. The area irrigated varies from year to year, but averages less than 300,000 acres, or 20 percent of the region’s farmland (Figure 32). This stability is not surprising, given the dominance of grass seed and pasture. No other crop is planted on enough acreage to have a significant effect on overall crop water use.
15 The dominance of grass seed on an acreage basis has been relatively constant for more than 50 years (Fisher, 1972).
Crop choice
On a parcel of land with an irrigation water right, the choice of crop and whether to irrigate is based on several factors (see Appendix). Some factors do not vary from year to year (e.g., soil type, elevation, and average precipitation and temperature). Other factors are unpredictable, such as crop prices, costs of fertilizer and energy, and spring rains. As a result, the number of acres planted to a given crop and the number of irrigated acres varies slightly from year to year.
Our modeling of crop choice and irrigation decisions is based on established economic theory, empirical data, and a detailed farmer survey conducted in the WRB (see Appendix). Although the model allows acres planted to most crops to fluctuate from year to year, land planted to tree crops (Christmas trees), orchards, and vineyards is not allowed to vary.
Given the WRB’s strong climatic advantages for growing seed crops (see Chastain), the most likely future scenario is for grass seed and pasture to continue to dominate acreage, with other crops entering and exiting the crop mix. The projected pattern of crop mix for all agriculture, and for irrigated lands specifically, is shown in Figures 34 and 35.
Total farmland and irrigated acreage
For the reference scenario, the WW2100 model shows a slight downward trend from 2010 to 2100 in total farmland and irrigable acres (Figure 36, p. 41). The decline is about 7 percent for farmland overall and about 5 percent for irrigated lands. In comparison, the high population growth scenario produces a 14 percent decline in total farmland, and the “relaxed” urban expansion scenario generates a 9 percent reduction.
Additional analyses could be undertaken with the WW2100 model. For example, changes in relative crop prices could be introduced in an alternative scenario. Modified cropping patterns could provide insights about how a shift toward more water-intensive crops would affect water use.
Irrigation water use
The amount of water required for irrigation is expected to be relatively stable, with a slight decline in both surface and groundwater irrigation. The projected decline is due to land-use change resulting from urban expansion and the corresponding loss of irrigated acreage.
Even if new crops enter the crop mix, they are unlikely to have more than a small effect on average ET basin-wide. To produce a significant change, multiple new crops would have to have extremely high or low ET and displace current crops on a large number of acres.
One important question is whether climate change will increase irrigation water demand due to the effects of warmer temperatures on crop ET. At a given crop development stage, higher daytime temperatures lead to higher ET. However, our model indicates that warmer springtime temperatures will allow farmers to plant earlier, irrigate earlier, and harvest earlier. Thus, more plant growth will take place during months with relatively cooler temperatures, more precipitation, and higher levels of soil moisture. As a result, the positive effect of warmer temperatures on ET may be offset by the opposite effect from earlier planting, thus reducing, rather than increasing, irrigation.
What results are indicated by our model? The model simulates daily crop water demand from planting to harvest. As a result, it can capture the direct and indirect ways that climate change will affect crop water use and irrigation demand. Even in the high climate change scenario, the model shows only a 2 percent increase in maximum ET from 2010 to 2100.
There is, of course, the potential for expansion of irrigation onto currently unirrigated lands. However, “live flow” surface-water sources are already fully appropriated in the Basin. Moreover, some parts of the Basin have seen declining groundwater levels and face limitations on groundwater withdrawals. One area in southeastern Washington County has been designated a “critical” groundwater area (Herrera et al., 2014).
The projected reduction in irrigation does not take account of the possible addition of irrigation water rights from federal reservoirs. To date, farmers have contracted for only 80,000 acre-feet, or about 5 percent of this stored water. The potential for use of federally stored water is discussed below (see “Stored water”).
Change in irrigation season
The seasonal pattern of irrigation corresponds to plant water needs for growth and development. It also reflects the typical reduction in precipitation from spring into summer.
Our model indicates that warmer temperatures will cause planting and harvest dates to shift earlier in the year.16 Thus, as indicated in Figure 37 (p. 41), patterns of irrigation water use will shift about 2 weeks earlier by late in the 21st century.
16 In principle, a shift to earlier planting and harvest dates could raise the possibility of a second crop (“double-cropping”). Some sequential cropping already occurs in the WRB. For a second crop to be attractive to farmers, it must be profitable. Compared to spring-planted crops, irrigation costs would be higher for an emergent crop in August and September, when rainfall is lowest and temperatures are highest, thus reducing the likelihood that a second crop would be profitable.
Agricultural water supply and demand in alternative scenarios
Water use in agriculture may vary from the levels suggested by the reference scenario. If changes in prices, crops, or technology make irrigation more profitable, the share of irrigation water rights that goes unused each year could decline. An increase in contracts for stored water from reservoirs might also result in increased irrigation. Conversely, higher energy costs could make irrigation less attractive, or lower density urban expansion could displace more irrigated farmlands.
Stored water
The potential for using some of the 1.6 million acre-feet of water stored in federal reservoirs for new irrigation has been a topic of interest since the 1990s. Farmers may apply for a contract to use this water, provided that the water can be diverted downstream and transported to a farmer’s field for irrigation purposes. Both an Oregon water right and a contract with the U.S. Bureau of Reclamation (USBR) are required. Currently, contracts cover only about 80,000 acre-feet of stored water. The amount authorized for potential use under such contracts is currently limited by Biological Opinions under the Endangered Species Act (USFSW, 2008) to a maximum of 95,000 acre-feet, as discussed in the Appendix, Section 6.
To evaluate this potential, a scenario was developed that makes new contracted water available for irrigation on lands that currently do not have irrigation water rights. The model introduces an annual probability of acquiring a water right for stored water, where the probability is a function of the marginal value of irrigation (which varies by soil class) and the cost of conveyance to the field in question.
Estimated conveyance costs (infrastructure and pumping) are based on distance and lift from the nearest point on the relevant river. (See Appendix for details.) Conveyance costs are high for moving water to a farmer’s field, and economic returns to doing so are relatively low. Thus, the addition of irrigated lands is limited to those areas in close proximity to streams below federal reservoirs. Estimated conveyance costs for agricultural lands, and the areas that are able to profitably adopt new irrigation water rights, are shown in Figure 38 and Figure 39. The model indicates that only 7,200 additional acres are likely to add irrigation water rights from stored water. This acreage is more than offset by the reduction in surface-irrigated acres resulting from urban expansion under the reference scenario. As a result, total irrigated acreage would change only slightly.
If we modify the scenario to reflect optimistic assumptions about the costs of conveyance, and if we eliminate the price irrigators must pay to the USBR for water contracts, the number of irrigated acres would increase by 27,400, representing about 55,000 acre-feet of stored water.
Profitability of irrigation
In one scenario (high irrigation), an increase in the profitability of irrigation reduces by half the number of acres that go unirrigated in a typical year. This change would increase irrigated acres by 86,000, or 32 percent. Because of this increase in demand, competition among irrigators would be expected to increase somewhat, with a modest increase in the frequency of irrigation shutoffs (see “Water scarcity in agriculture,”).
Fallow
All agriculture in the WRB uses significant amounts of water. Since 80 percent of agricultural land is not irrigated in a given year, the amount of water used in rainfed farming is important, since its use by crops makes it unavailable for irrigation or other uses. In fact, total annual ET per acre for nonirrigated crops is, on average, slightly higher than that of irrigated crops, likely owing to crop choice and ET associated with winter groundcover.
However, a decline in rainfed farming would not necessarily result in an increase in streamflows and water available for other uses. The reason is that fallowed land will have vegetation on it. The ET for this vegetation is not significantly different on average, in our analysis, from that of crops such as grass seed and pasture. Even when all agricultural land is constrained to be fallowed, the total ET for agriculture in our model does not change significantly.
If ET did decline with increased land fallowing, streamflows would increase slightly. However, some of the moisture that would have been consumed by a crop would remain in the ground for a period of time. For this reason, it might not contribute additional water to surface flows at the time water is needed.
Water scarcity in agriculture
The demand for water for irrigation (and hence the potential for scarcity) depends on the economic returns to that activity. Economic returns to farming (annual profits or “farmland rents”) are indicated by farmland prices. Thus, the economic value of irrigation is indicated by the difference between the value of farmland with water rights and similar farmland without water rights (an amount known as the “irrigation premium”). As the irrigation premium increases, demand for irrigation water also increases.
Based on data for land values and rental contracts among farmers, the average annual profits or returns to farmland have been estimated for various land types in the Basin (see Appendix). Irrigation premiums are included in the model (Figures 40, p. 46; 41, p. 47; and 42, p. 48). These figures do not include returns to labor, capital, or management.
Water scarcity also depends on whether a farmer possesses a water right and whether that water right has “priority” over other water rights that may compete for the same water. Under Oregon water law, irrigation water rights are based on the seniority system common to most western states, known as “the prior appropriations doctrine.” Irrigation water rights are tied to a specific parcel of land on which the water can be put to a “beneficial use.” Each water right has a priority date corresponding to the first use of water on that land. The most senior water rights predate 1900. See the Appendix, Section 6, for more details on water rights.
In a time of water shortage, a senior water right holder (a person having a right with an older priority date) can “make a call,” requiring relatively junior water right holders to stop diverting water from a common stream so that the remaining water will reach the diversion point for the senior user.
A junior water right holder who is “regulated off” usually cannot irrigate for the remainder of the year. If crops have been planted that require irrigation, the loss of irrigation leads to economic losses that exceed what would have been gained by completing the irrigation season. For example, costs for planting, fertilizing, and partially irrigating the field will already have been incurred.
A direct indicator of water scarcity, therefore, is the number of irrigation shutoffs and associated value of economic losses. Because we have modeled nearly all 15,000 of the irrigation water rights in the Basin, our simulations indicate how many irrigated acres are expected to be shut off each year, and we are able to see how those numbers change over time and vary among scenarios.
Looking at annual shutoffs over time (using the 2010–2020 period as the baseline), we see a decrease in irrigation shutoffs of 10 to 30 percent under both the reference scenario and the high climate change scenario (Figure 43, p. 48). For the two scenarios that assume greater utilization of irrigation water rights (high irrigation and a worst-case scenario), the number of shutoffs is higher, but still declines over the 2020–2100 period.
The levels of irrigation shutoffs in the model are somewhat higher than those documented by the Oregon Water Resources Department (OWRD) in recent years, where 10 to 20 shutoffs per year are typical. This difference may be due to limitations in the model’s ability to fully represent the stream network and its connections with individual water rights, especially for small streams.
The apparent reduction in water scarcity (irrigation shutoffs) is an indirect result of climate change. Warmer temperatures early in the year will lead farmers to plant earlier. As a result, more crop growth will take place during months with relatively high precipitation and adequate water, decreasing the need for irrigation. Early planting and warmer temperatures will also result in earlier harvest and cessation of irrigation. Many irrigation shutoffs occur in late July and early August, but in the future many farmers will have completed irrigation by that time. A small portion of the decline in irrigation shutoffs is likely due to the displacement of irrigated lands by urban expansion.
Oregon has a large number of in-stream water rights that have not yet been implemented. If all of these water rights are implemented, the level of irrigation shutoffs is projected to be about 5 percent higher than in the reference scenario. The following section discusses in-stream water rights in detail.
In-stream flows
Under Oregon state law, all water rights must serve a beneficial use. In Oregon and some other western states, beneficial use includes in-stream flows to protect habitat for salmon, steelhead, and other native fish species, as well as for ecosystem services and other purposes.
In the WRB, in-stream water rights were established on various stream segments in the 1960s in order to provide minimum recommended perennial streamflows to protect fish habitat. Some of these water rights have been implemented or “converted” to certified water rights, i.e., put into place and enforced. Our reference scenario includes 93 certified in-stream water rights.
Many of these water rights, however, have not yet been converted to certified water rights. The OWRD has initiated a process for converting the remaining water rights. These additional regulatory allocations of water for in-stream flows represent a significant “new” use of water for many of the Basin’s main tributaries. In some cases, conversion involves an increase in the minimum flows associated with existing in-stream water rights.
An alternative scenario (“new in-stream”) assumes the conversion of in-stream water rights and gives them priority dates corresponding to their creation, typically in the 1960s. The implementation of these unconverted in-stream water rights is consistent with the Instream Water Rights Act (see also Amos, 2013). Full implementation represents an additional commitment of surface water from April through August of 1.1 million acre-feet. This total is derived by summing the flow requirements at the outlet of each main tributary, some of which would increase.
Some of these streamflows, however, are already protected by existing in-stream water rights under state law. In other cases, the minimum flows coincide with the operations of federal dams, where flow targets are already mandated under Endangered Species Act (ESA) Biological Opinions (BiOps). (See Amos, 2013, for details about relevant state and federal laws.)
The 2008 final BiOps for ESA-listed salmon and steelhead in the Willamette Basin establish minimum in-stream flows below federal reservoirs in the WRB from April through October (NMFS, 2008). Required flows are highest from April through June. These flows have built-in flexibility, whereby required flows are reduced in years considered to be “deficit” or “insufficient” water years. This determination is based on reservoir fill levels.
The BiOp flow requirements are tied to downstream control points (see Appendix). Existing required BiOp flows are higher than those that would be required under state law by conversion of all remaining in-stream water rights. Although the addition of new in-stream water rights and continued BiOp flow requirements represent challenges for federal and state water managers, our model results suggest that these flow requirements can be met, based on average 10-year flows. Exceptions may occur in severe drought years.
Reservoirs
The system of 13 reservoirs that comprise the United States Army Corp of Engineers (USACE) Willamette Project is one of the primary mechanisms used to mitigate water scarcity in large parts of the WRB. Although the Willamette Project reservoirs were built primarily for flood control, they fortuitously have a large capacity (1.6 million acre-feet in total) to store water from abundant winter and spring streamflows. This stored water is available for use during the summer, when natural flows are low.
Flood damage reduction remains the priority authorized use of these reservoirs. Nonetheless, stored water uses have become increasingly important. These uses include reservoir recreation and the augmentation of downstream flows for endangered species and irrigated agriculture. By increasing mainstem flows, these releases also indirectly contribute to urban water supplies.
When water is released to maintain reservoir capacity to buffer storm events, that water is not available for later use. Thus, flood mitigation and water storage become competing objectives as reservoirs fill during the transition from the wet to the dry season.
The balance between these objectives is expressed in the operations rule curve for each reservoir, which specifies the target level to which the reservoir is filled throughout the year (Figure 44, p. 51). During the winter flood season from December to February, the volume of water stored in the reservoirs is kept at a minimum. Starting February 1, the USACE begins adding water to storage, with the goal of filling reservoirs by May 20, ahead of the Memorial Day weekend. The reservoirs are kept as full as possible during the summer (June–August) for recreation. However, releases during the spring and summer to maintain minimum flows, as required by the BiOps, can prevent reservoirs from achieving or maintaining full pool storage through the summer. To the extent possible, releases are managed to maintain higher water levels at reservoirs with high recreational use. After Labor Day, the reservoirs are gradually drawn down to minimum levels in preparation for the next winter flood season.
Our model projects increasing shortfalls in summer reservoir fill over the course of this century, particularly under the warmer climate scenario (Figure 45, p. 51). Lower summer water levels can impact recreational use in various ways, including loss of boat ramp access, increased mud flats, and compromised aesthetics such as “bathtub rings.” Associated economic losses are based on empirical evidence that fewer people visit the reservoirs when water levels are reduced (Moore, 2015).
Lost recreational benefits across the Willamette Project reservoirs are estimated to remain relatively stable until late in the 21st century. By the 2080s and 2090s, these foregone benefits are projected to increase, to more than $12 million per year in the reference scenario. Under the high climate change scenario, they exceed $13 million per year (Figure 46, p. 52). These losses represent a 5 or 6 percent decline in total recreation visits, respectively.
Given the tradeoff involved in managing reservoirs for both flood reduction and stored water uses, these lost recreational benefits should be considered in light of the estimated value of flood damage reduction. The USACE estimates that, as of June 2015, the Willamette Project reservoirs have prevented more than $23 billion in flood damages since their completion in 1969 (USACE, 2015). Based on analyses undertaken to complement the WW2100 effort, the current annual value of reservoir buffering capacity is estimated at more than $1 billion (Moore, 2015). This estimate is based on avoided flood damages to downstream developed land, buildings, and their contents (Figure 47, p. 52). It reflects population and economic growth, but does not account for changes in flood risk due to climate change.
With the levels of economic growth and urban expansion projected under the reference scenario, this benefit is expected to triple by 2100. Under the high population scenario (Figure 47), it increases more than fivefold.
Subbasin differences
The 11 WRB subbasins differ in size, acreage of farmland, developed land area (Table 2), precipitation patterns, changes in forest water use due to harvest and wildfire, and other ways. Thus, patterns of water supply and use vary considerably and will continue to do so in the future. This section examines the differences across subbasins, how those differences are likely to change in future decades, and what implications they may have for water scarcity at the subbasin scale. For this discussion, we are omitting the Willamette mainstem as a subbasin.
It is important to keep in mind that the hydrology of subbasins in the eastern half of the WRB differs significantly from that in western subbasins. In the eastern half of the WRB, snowmelt, reservoir storage, and summer in-stream flows are greater than in the western subbasins. As indicated in Table 2, several of the eastern tributaries have minimum summer flow requirements of 520 to 2,100 cfs, while several western tributaries require flows of only 30 to 150 cfs.
The scale of agricultural land and water use differs considerably among the 11 subbasins. The largest agricultural acreage, as a percentage of total land area, is in the Yamhill and Molalla subbasins, followed by the Tualatin and Long Tom subbasins. By contrast, very little agriculture is found in the McKenzie, Middle Fork Willamette, or Coast Fork Willamette subbasins (Table 2).
We are especially interested in identifying which subbasins have the most irrigation and in particular those with large-scale surface irrigation, since surface-water irrigation represents the largest out-of-stream human consumptive use of water during the summer when water may be scarce. Table 2 reveals that the Yamhill subbasin has the most surface irrigation, followed by the Tualatin, Molalla, and Long Tom subbasins.
Developed urban land is greatest in the Tualatin subbasin, followed by the Molalla and Long Tom subbasins. A large fraction of developed land is not represented in subbasin data, however, because developed lands are concentrated along the mainstem (for example, portions of the Portland Metro area and Salem). The area designated as the Willamette mainstem subbasin also includes substantial areas of farmland and irrigation.
The period when water may become scarce is in spring (when dams are being filled and in-stream BiOp flow requirements are highest) and summer (when flows are lowest and out-of-stream use by agriculture and urban populations is highest). Ideally we would like to compare spring and summer flows in each subbasin to current and future demand for water. However, estimating urban water use by subbasin is difficult, as some major urban areas straddle multiple subbasins. In some cases, cities draw water from only one of these subbasins or from outside the WRB (for example, the City of Portland and some cities on the west side of the Portland Metro area). Moreover, because much of the water used in urban areas is returned to its original surface-water system, quantifying the net consumptive use from a given subbasin’s water sources is not straightforward.
In the case of irrigation, the number of acres irrigated provides a rough idea of the demands placed on subbasin water sources. Each acre of irrigated land diverts 1.5 to 2 acre-feet of water during a season, typically between April and August.
In the reference scenario, subbasins vary greatly in projected changes in April–August streamflows. For some subbasins, April–August flows are projected to decline by as much as 7.3 percent; for others, the model results indicate increased flows of up to 17 percent (Table 2). In the case of the Tualatin, discharge from urban water systems that draw on out-of-basin reserves (Barney and Scoggins Reservoirs) is expected to increase. It is noteworthy that all of the subbasins showing decreased flows have their headwaters in the Cascades, whereas nearly all of those with increased flows are on the west side of the Basin.
Another way to look at changing subbasin water supplies is in terms of the changes in stream flow during spring (April–June), shown in Figure 48; and in summer (July–August), shown in Figure 49. We see small decreases in spring flows in several subbasins, although the pattern varies greatly.
The largest commitment of surface water in most subbasins is the allocation of water for in-stream water rights under state law (separate from the similarly large quantities of water allocated under federal BiOp flows). In-stream water rights are largest at the confluence of the Middle and Coast Forks of the Willamette River, both for the April–September irrigation season and for the July–August low-flow period. The McKenzie has the second highest total in-stream water rights. Based on unconverted in-stream water rights, the North and South Santiam rivers follow.
One of the largest factors affecting future water scarcity in some subbasins will be the conversion of perennial minimum streamflows into binding in-stream water rights. The largest increases are for the confluence of the Coast and Middle Forks of the Willamette and the McKenzie, each with increases of more than 600,000 acre-feet from April through August. An important factor for those tributaries with federal dams is the ability to control flows by modifying management rules for dam releases.
Conclusions
Our understanding of water supply relies heavily on hydrology and related natural sciences, whereas our understanding of the demand for, and allocation of, water comes from economics, law, engineering, and related social sciences. A hydro-economic model like the one presented here makes it possible to represent the important processes of both the natural and human systems.17 The WW2100 model sheds light on how these components interact and helps us understand where, when, and why we may see more water scarcity in the future.
17 The projections in this report for both urban water use and agricultural water use are based on the set of behavioral economic models described here and elsewhere. These models reflect and are derived from economic theory. They are spatially and temporally explicit and take account of many factors, including the following: water price, household income, population, population density, water delivery costs, land values and farm profits, land-use change, crop choice, planting date, water availability across space and time, shifts in seasonality of crop growth due to climate change, daily determination of crop ET, and utilization rates for irrigation water rights. The 2015 Statewide Long-Term Water Demand Forecast Report, prepared by the consulting firm MWH for Oregon’s Water Resources Department, also estimates future water demand in Oregon. Their model takes account of a far more limited set of factors than the WW2100 model: (1) In the case of agriculture, the MWH report draws on USGS estimates (which in turn are based on USDA Census of Agriculture data) for irrigated acres by county and by crop. Irrigation water demand is estimated based on average net irrigation water requirements, which are then adjusted to reflect the effects of climate change. (2) In the case of urban water demand, MWH relies on existing Water Management and Conservation Plans (WMCP), developed by various city governments. These plans were then adjusted in proportion to estimated population growth only. Changes in per-capita demand were estimated from 50 of the most recent WMCPs from communities across Oregon.
Changing supply
On the supply side, the severe decline in snowpack in the next 80 years will reduce the amount of snowmelt runoff from April to June. The projected reduction in average available snowmelt (as of April 1 each year) represents a decline of about 600,000 acre-feet of stored water. However, precipitation plays a far greater role than snowmelt in determining spring streamflows in the WRB. Indeed, the projected decline in snowmelt is only one-tenth of average April–July precipitation (nearly 7 million acre-feet).
As a result, unlike arid basins in eastern Oregon or neighboring western states, the loss of snowmelt will have a relatively small impact on water availability in the lower elevations of the WRB in spring and summer. Nevertheless, reduced snowpack, when combined with higher summer temperatures, is projected to increase stress on upland forests and, as a result, increase the risk of wildfire.
To the extent that drier forests result in more frequent wildfires, the consequent changes in forest cover will reduce forest water use (ET) and allow more surface water to flow into the Willamette Valley. Depending on the extent of wildfires and on fire suppression policies, these changes in forest cover may have a greater influence on water supply to the lower Basin than the projected reduction in snowmelt.
Changing demand
The economic forces related to where and when water is used or not used may at times be overlooked, in part because they are not visible or immediately recognizable. The locations of various types of economic activity are influenced by land markets, and these individual and societal choices in turn influence the demand for water at each location. Our model projections find that from 2010 to 2100 developed land as a percentage of total land area in the WRB will rise from 4.7 percent to about 7.2 percent, a 54 percent increase. Agricultural land is projected to decline from almost 22 percent to 20.2 percent, and forest land from 70.6 percent to 69.7 percent. The decline in agricultural lands is about 7.5 percent for farmland overall and about 5 percent for irrigated lands.
At each location, given a particular land use, water use is influenced by both the demand (willingness to pay) for water and the cost of transporting, storing, or transforming water to make it available for a given use. The importance of cost considerations is illustrated by the case of water conveyance costs. Demand for transported water depends on the value of water for a specific purpose relative to conveyance costs. For example, water is transported up to 25 miles from outside the WRB (often aided by gravity) to serve urban users. In contrast, we estimate that a quarter mile of horizontal or uphill conveyance can be costly enough to make delivery of water for irrigation uneconomic on most agricultural lands in the Basin. Indeed, economic considerations explain why one-third of irrigable farmland (parcels with irrigation water rights) goes unirrigated each year. Irrigation involves costs and benefits, and, in some years, and on some lands, the costs outweigh the benefits.
Urban demand
Urban water use is projected to rise significantly by 2100, due primarily to population growth, but also to rising income. The growth in demand will be tempered to some degree by recent and near-term price increases related to cost recovery for infrastructure investments.
However, most urban water is used indoors and is nonconsumptive, i.e., it is returned to the surface-water source from which it originated. Consumptive use (outdoor use that is not returned to streams via wastewater infrastructure) is projected to increase by only about 37,000 acre-feet per year by 2100. (Our model suggests that climate change will not lead to a significant direct increase in consumptive use.) The displacement of surface-irrigated farmland near expanding cities may offset as much as one-third of the increase in urban consumptive water use.
Moreover, a large fraction of urban water supplies in the WRB come from sources outside the Basin (primarily the Bull Run watershed on the slopes of Mt. Hood, but also reservoirs on the west side of the Coast Range). Thus, consumptive use from in-basin surface-water sources is projected to increase from 18,000 to 34,000 acre-feet per year, representing only about 7 percent of total urban water deliveries.
It is important to note that, compared to other uses, urban consumptive use of water from in-basin sources is small. Agricultural use (475,000 acre-feet) is 25 times greater, and regulatory minimum flows in the Willamette River (3.5 to 4 million acre-feet at Salem) are 200 times greater.
Irrigation
Water use for irrigated agriculture fluctuates from year to year, but has exhibited no significant upward trend in recent decades. The per-acre amount of water required for irrigation is expected to remain relatively stable. However, seasonal patterns of irrigation are likely to shift about 2 weeks earlier in response to earlier planting dates resulting from climate change.
The potential use of stored water to expand irrigation to farmlands that currently do not have irrigation water rights is limited by economic realities: conveyance costs are high relative to the economic gain from irrigating.
In-stream flows
The largest allocation of water in the Basin under human influence or control is the protection of in-stream flows. These flows serve multiple purposes, but are determined largely by habitat requirements of native fish. These minimum streamflows result from both federal BiOp requirements, which are tied to the Endangered Species Act, and state-mandated perennial minimum flows protected by in-stream water rights. Indeed, when completed, the implementation of currently unconverted in-stream water rights represents a significant increase in water allocation in the near term.
Reservoirs
The 13 federal storage reservoirs in the Basin produce enormous social value by reducing the risk of flood events. This benefit has been estimated at more than $1 billion per year. As urban areas expand, the value of potential damages during a flood will rise. Thus, the economic benefits of flood damage reduction will increase. To the extent that climate change leads to increases in high flow events, these benefits will become even more valuable.
Economics frames choices involving tradeoffs such as that between (a) the value of keeping reservoirs empty (for flood risk reduction) and (b) the value of filling reservoirs (for multiple summer uses). Since reservoirs cannot simultaneously be kept empty and full, the timing of refill during the spring is a critical economic decision. To maximize social benefits, the choice of reservoir fill level on any given date should balance the expected benefits of the competing uses (flood risk reduction versus storing water for summer uses).
Potential water scarcity
Based on results from the WW2100 model, the potential for increased water scarcity is likely to be location- and time-specific.
- Currently utilized municipal water rights may reach capacity in the Metro area (in 30 years) and in Salem (in 60 years). However, when the model accounts for currently underutilized water rights and those under development, urban water rights appear to be capable of meeting the overall growth in urban water demand.
- Our model shows a decrease in irrigation shutoffs of 10 to 30 percent under the reference scenario and the high climate change scenario. This result is due to earlier planting, which in turn leads to an earlier start, and completion, of irrigation. In the future, more farmers will have finished irrigating by the time the threat of a shutoff arises.
- The model results indicate increasing but modest shortfalls in reservoir fill levels during summer, resulting in some loss of recreational benefits, on the order of 5 percent.
- Implementation of all of the “unconverted” in-stream water rights intended to protect perennial flows would represent a significant increase in the amount of water allocated to environmental values. The effect, based on our model results, would be a small increase (5 percent) in the number of irrigation shutoffs. Overall, however, our results suggest that flow requirements to protect salmon and steelhead can be met, based on 10-year average flows. Exceptions are likely to occur in drought years.
- The effects of changes in forest wildfires and fire suppression policies could have a larger effect on water supply in the Valley than all of the changes in human water use combined. If forest cover is dramatically reduced, the resulting decrease in forest ET will increase streamflows and make more water available for human use, reducing the likelihood of scarcity.
The high spatial resolution of the WW2100 model makes it possible to identify specific land-use changes, such as those that displace irrigated agriculture, and to estimate the distances over which water conveyance is likely to be profitable for farmers. Models of this kind have important strengths but, like any model, also have limitations. Model projections should not be interpreted as precise quantitative predictions, but rather as indicators of the kinds of change that can be anticipated, based on what is known about the system being described.
References
Amos, A. 2013. Developing the law of the river: The integration of law and policy into hydrologic and socio-economic modeling efforts in the Willamette River Basin. University of Kansas Law Review 62:1091.
Bigelow, D. 2015. How Do Population Growth, Land-use Regulations, and Precipitation Patterns Affect Water Use? A Fine-scale Empirical Analysis of Landscape Change. Doctoral dissertation, Oregon State University.
Chang, H., S. Praskievicz, and H. Parandvash. 2014. Sensitivity of urban water consumption to weather and climate variability at multiple temporal scales: The case of Portland, Oregon. International Journal of Geospatial and Environmental Research 1(1).
Fisher, D. 1972. An Economic Analysis of Farms Producing Grass Seed in the Willamette Valley, with Special Attention to the Cultural Practice of Field Burning. Doctoral dissertation, Oregon State University.
Herrera, N., E. Burns, and T. Conlon. 2014. Simulation of Groundwater Flow and the Interaction of Groundwater and Surface Water in the Willamette Basin and Central Willamette Subbasin, Oregon. U.S. Geological Survey Scientific Investigations Report No. 2014-5136.
Jaeger, W., A. Plantinga, H. Chang, K. Dello, G. Grant, D. Hulse, et al. 2013. Toward a formal definition of water scarcity in natural–human systems. Water Resources Research 4506–4517.
Kalinin, A. 2013. Right as Rain? The Value of Water in Willamette Valley Agriculture. Master’s thesis, Oregon State University.
Lewis, E. and G. Peri. 2015. Immigration and the economy of cities and regions. In Handbook of Regional and Urban Economics, volume 5. G. Duranton, V. Henderson, and W. Strange (eds.). North-Holland, Amsterdam.
Moore, K. 2015. Optimizing Reservoir Operations to Adapt to 21st Century Expectations of Climate and Social Change in the Willamette River Basin, Oregon. Doctoral dissertation, Oregon State University. (accessed November 7, 2016).
National Marine Fisheries Service (NMFS). 2008. NMFS Willamette Project Biological Opinion. (accessed November 29, 2016).
Turner, D., D. Conklin, and J. Bolte. 2015. Projected climate change impacts on forest land cover and land use over the Willamette River Basin, Oregon, USA. Climatic Change 133:335–348.
U.S. Army Corps of Engineers (USACE). 2007. HEC-ResSim Reservoir System Simulation User’s Manual, version 3.0. USACE, Davis, CA. (accessed November 7, 2016).
U.S. Army Corps of Engineers (USACE). 2011. Willamette Valley: Operating the Reservoirs: Introducing the Rule Curve. USACE, Portland District.
U.S. Army Corps of Engineers (USACE). 2012. Willamette Basin Guide Standard Operating Procedures (SOP).
U.S. Army Corps of Engineers (USACE). 2015. A Primer on Flood Risk Management. (accessed August 5, 2016).
U.S. Army Corps of Engineers (USACE) and Oregon Water Resources Department (OWRD). 2011. Small-scale Water Supply Allocation Process: Willamette River Basin. USACE, Portland District.
U.S. Environmental Protection Agency (USEPA). 2009. 2006 Community Water System Survey. (accessed November 29, 2016).
U.S. Environmental Protection Agency (USEPA). 2013. Drinking Water Infrastructure Needs Survey and Assessment: Fifth Report to Congress.
U.S. Fish and Wildlife Service (USFWS). 2008. Final Biological Opinion on the Willamette River Basin Flood Control Project.
About the authors