

A YouGov poll conducted last year showed that pets play a meaningful role in Americans’ lives. Americans often seek comfort from their pets, see their pets as part of their family, and say people who dislike animals are less trustworthy than those who like animals. A new YouGov poll explores American pet owners’ attachments to their pets and includes a thought experiment conducted to understand how Americans value their pets' lives relative to the lives of people and other animals.
Americans’ attachment to their pets
About two-thirds of Americans (66%) say they own at least one pet. Among pet owners, 70% own at least one dog, 50% own at least one cat, 6% own at least one fish, 4% own at least one bird, and 11% own another kind of pet. Most American pet owners say that of the pets they own, they are most personally attached to their dog (62%), while another 33% are most attached to their cat, and 5% are most attached to some other kind of pet. Nine in 10 dog owners (87%) say they are most attached to their dog, while only 66% of cat owners are most attached to their cat. (That may be partly because cat owners are more likely to own at least one dog than dog owners are to own at least one cat — 48% vs. 33% — though causation could go either way.) Only 31% of Americans who own a pet other than a cat or dog say they are most attached to that pet.
More than 9 in 10 American pet owners (93%) say that the pet to which they are most closely attached is part of their family, and a similar proportion (95%) think that pets are capable of love. Many pet owners (39%) think of themselves as the parent of the pet they are most closely attached to. Significant shares of American pet owners also see themselves as their closest pet’s friend (29%) or, even more often, best friend (34%).
American pet owners most closely attached to their dog are more likely than those most attached to their cat to think of themselves as that pet’s owner or master (39% as owner and 17% as master for pet owners most attached to a dog; 34% and 7%, respectively for pet owners most attached to a cat). Americans most attached to their cat (12%) are more likely than those most attached to their dog (6%) to see themselves as that pet’s servant.
How much are Americans willing to pay to save their closest pet’s life? More than half of American pet owners (55%) say they’d be willing to pay more than $1,000 to save their closest pet from a life-threatening ailment. Americans closest to their dog (59%) are more likely than those closest to their cat (49%) to say they would pay more than $1,000. Only 2% of American pet owners say they would not pay any amount to save their closest pet, while 11% say they would pay more than $10,000.
Thought experiment about Americans’ closest pets
Last month, YouGov asked Americans to consider a simplified version of a thought experiment initially conducted by a group of researchers in 2020 designed to test how people weigh the relative value of a human life to that of an animal's life. When asked to choose between saving the lives of one person and one, 10, or 100 pigs, about one in 10 Americans saved the pig(s) — a similar proportion no matter the number of pigs. Americans asked these same questions about dogs were roughly twice as likely as those asked about pigs to save the animal(s). Increasing the number of dogs from one to 100 increased the number of Americans willing to choose the hypothetical dog(s) over the imagined person — unlike with pigs.
Half of the respondents in this follow-up experiment who owned pets were asked questions about four similar scenarios. Each scenario involved two sinking boats, one containing the pet they indicated they were most personally attached to and one containing either an unspecified person, 10 people, 50 people, or 100 people. We asked respondents to choose whom they would save: their pet or the people. The other half of respondents with pets saw the same scenarios, but instead of being asked about their closest pet, they were asked about an unspecified dog. Respondents with no pets were only shown the dog scenarios. Because fish would not drown on a sinking boat — and specifying that a fish is unable to swim would be unrealistic — respondents most personally attached to their fish were treated as not being pet owners and only shown the unspecified dog scenarios. For convenience, references to this experiment in the article refer to people who are closest to a pet that isn't a fish as pet owners, and people whose closest pet is a fish are included among people who don't own pets.
In the scenarios involving an unspecified dog, only around 20% of American pet owners say they would choose to save the dog over the person or people. The number of people involved affects how Americans choose: When there is one person in the people boat, 59% of pet owners said they would save that person instead of a dog; when there are 100 people, 72% of pet owners say they would save the people instead of the dog. Only about one in 10 people who aren't pet owners say they would choose to save a dog over a person or people — no matter the number of people involved.
American pet owners asked whether they'd save the pet they are most personally attached to, rather than an unspecified dog, are roughly twice as likely as pet owners given the unspecified-dog scenarios to choose to save the animal over a person or people: 39% choose to save their pet, while 43% save a person. When the number of people in the boat increases to 100, 27% of pet owners would still save their closest pet, while 59% save the 100 people. Averaged across all four scenarios, Americans closest to their dog (35%) were more likely than Americans closest to their cat (30%) to save that pet instead of the person or people.
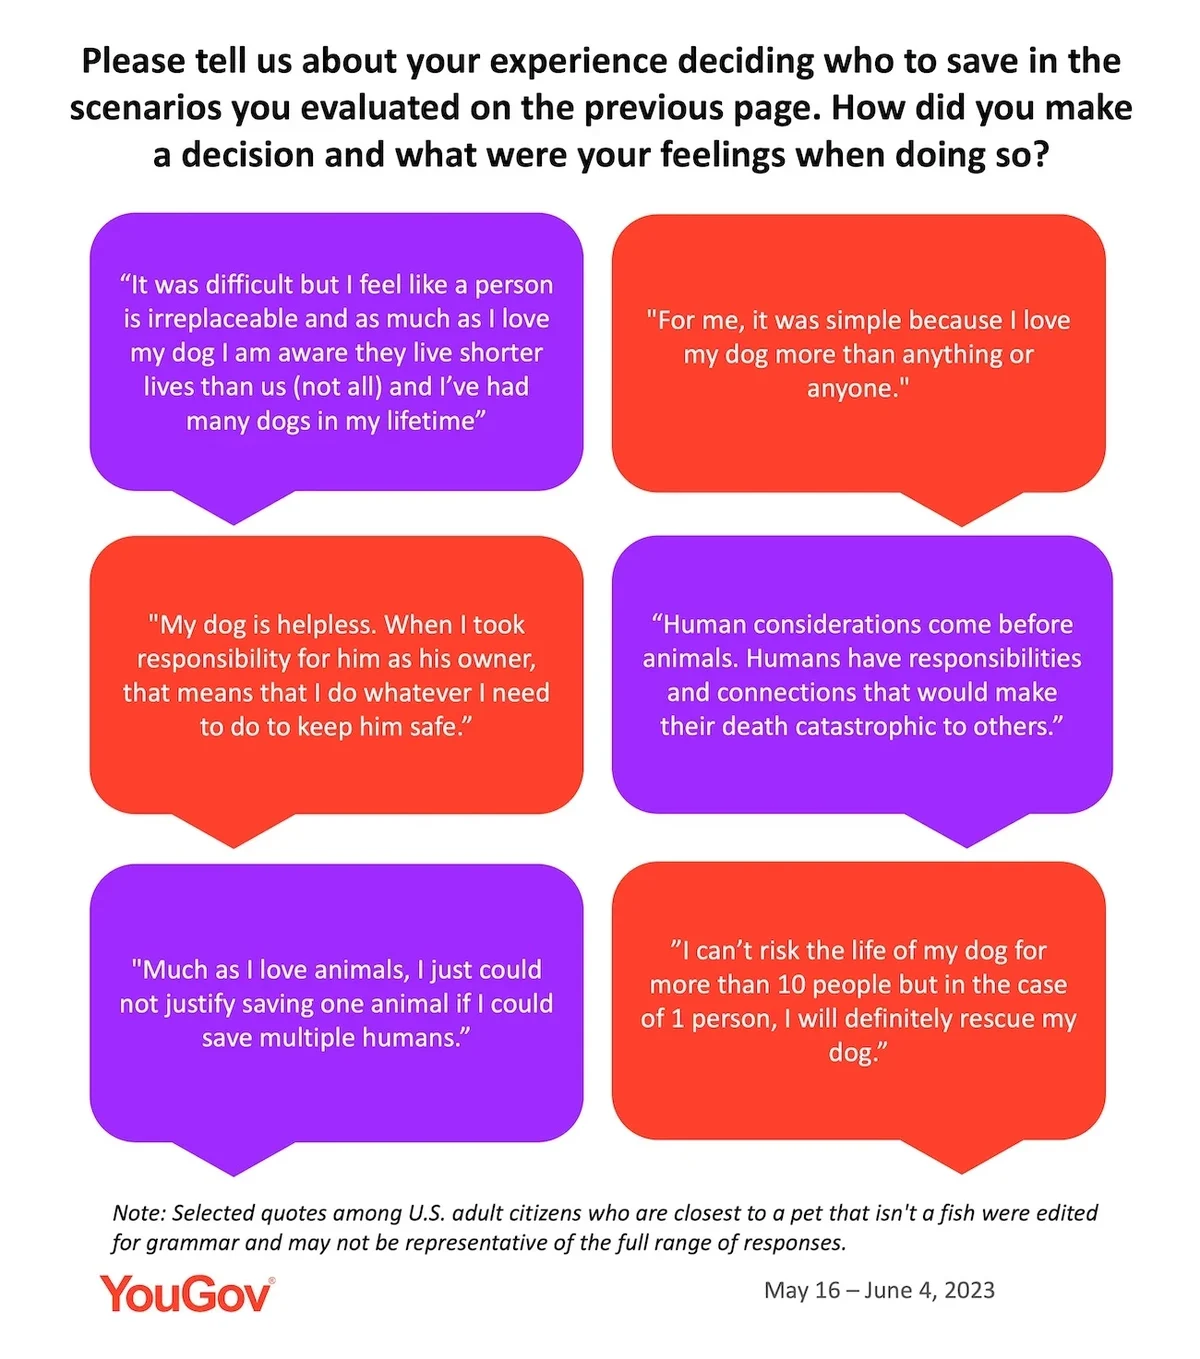
After the experiment, we asked American pet owners to describe how they made their decisions in each scenario and how they felt while doing so. Many respondents who would save an unspecified person or people rather than an unspecified dog or their closest pet highlighted their belief that human lives are more valuable than animal lives. Some said that because people live longer than animals and have responsibilities and connections to other people, saving their lives is more important than saving an animal's life.
Americans who chose to save their pet instead of a person or people often highlighted their love for their pet and the important role their pet plays in their lives. They also cited their pet’s helplessness, explaining that as their pet’s owner, they have a responsibility to keep them safe. Other pet owners felt that while they would choose to save their pet instead of one person, multiple human lives outweigh their pet's life.
American pet owners also differed in how they responded to the hypothetical scenarios based on the age of their closest pet. Americans with older pets were more likely than those with younger pets to choose to save their pet instead of the unspecified person or people. For example, in the scenario comparing their closest pet to one person, 33% of Americans whose closest pet is four years old or younger choose to save their pet, compared to 39% of those whose pet is between five and nine years old and 47% of people with a pet 10 or older. When choosing whether to save their pet or 100 people, pet owners whose closest pet is at least 10 years old (34%) were about 10 percentage points more likely to choose to save their pet than were people with pets between five and nine years old (26%) and four years old or younger (24%).
Related:
- Dogs, cats, and other pets play a meaningful role in the lives of many Americans
- The ethics of eating animals: Which factors influence Americans' views?
— Taylor Orth contributed to this article.
See the results of this YouGov poll
Methodology: The poll was conducted among 2,000 U.S. adult citizens on two separate surveys from May 16 - 19, 2023 and May 31 - June 4, 2023, with each survey taken by 1,000 U.S. adult citizens. Respondents were selected from YouGov’s opt-in panel using sample matching. A random sample (stratified by gender, age, race, education, geographic region, and voter registration) was selected from the 2019 American Community Survey. The sample was weighted according to gender, age, race, education, 2020 election turnout and presidential vote, baseline party identification, and current voter registration status. Demographic weighting targets come from the 2019 American Community Survey. Baseline party identification is the respondent’s most recent answer given prior to March 15, 2022, and is weighted to the estimated distribution at that time (33% Democratic, 28% Republican). The margin of error for the overall sample is approximately 3%.
Image: Adobe Stock (Gelpi)