

We updated this piece on ballot measures, originally published in October 2022, to include new figures, two recent research studies and other information.
When U.S. voters go to the polls in November, many will face two types of decisions: Selecting elected officials and choosing whether to support or reject individual ballot measures.
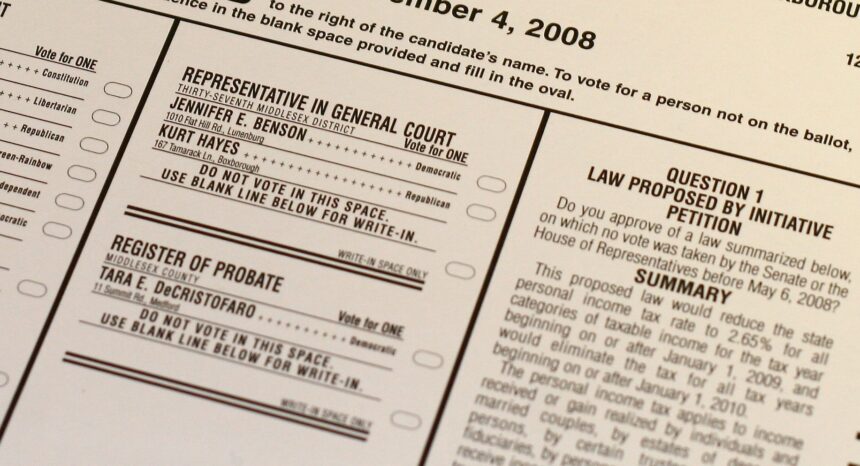
In most states, voters get a direct say in how they are governed by voting on ballot measures — proposals to enact or repeal certain laws or policies, or amend a state constitution.
In 2023, voters in eight states will decide on a total of 41 ballot measures addressing a range of policy topics, including marijuana legalization, abortion, farming and property tax exemptions, according to Ballotpedia, a nonprofit organization that tracks election and policy issues across the U.S.
This year, as in prior years, advocacy groups will spend tons of money trying to persuade voters to say “yes” or “no” to changes that can have a substantial impact on the everyday lives of people who work, live or attend school in a particular state, county or city. As of Sept. 18, campaigns promoting and opposing Ohio Issue 1, an abortion-related ballot question, had raised $27.1 million to fund their efforts, Ballotpedia reports.
But many factors beyond campaign ads and fiery policy debates can influence voters’ choices. It’s important for journalists covering ballot measures, also called ballot propositions, to understand which factors can push voters in one direction over another and why.
To help, we’ve gathered and summarized academic studies that investigate these issues. Their findings suggest:
- When voters enter their polling place, many will not know much, if anything, about the ballot measures they encounter.
- The way ballot questions are worded and framed affects how voters respond to them.
- If ballots are lengthy or ballot measures appear near the bottom, some voters will not vote on ballot measures.
- There’s a link between the types of students who attend local public schools and the level of support voters give tax referendums for public schools.
- It’s easier to persuade voters to choose “no.”
- Local newspapers play a key role in helping voters decide on ballot measures and getting them to finish filling out their ballots.
Keep reading to learn more. We plan to add studies to this list as new ones become available.
It’s important to note that scholars, government officials and others use several terms to refer to proposals placed on ballots for voters’ approval or rejection. “Ballot measure” is an umbrella term that applies to all types of ballot proposals. The Initiative & Referendum Institute, housed at the University of Southern California’s Gould School of Law, discusses the various terms in this brief explainer.
It’s also worth pointing out that voters typically vote “yes” or “no” on ballot measures. Sometimes, though, they are offered more than two choices. For example, a voter might be prompted to decide between two proposed laws or pick “neither,” according to John Matsusaka, executive director of the Initiative & Referendum Institute.
Influencing voter choices
Predicting Vote Choice and Election Outcomes from Ballot Wording: The Role of Processing Fluency in Low Information Direct Democracy Elections
Hillary C. Shulman; et al. Political Communication, June 2022.
When voters have little to no information about a ballot initiative, they’re more likely to say “yes” when it’s written in simple, easy-to-understand language, this study of 240 registered voters in Ohio indicates. Likewise, when voters have difficulty understanding a ballot question written with uncommon words and jargon, they tend to vote “no” — or not vote at all.
In this paper, researchers focus specifically on what they call “low salience” ballot initiatives, those that received little news coverage and for which no campaign fundraising was done. They conducted two experiments in which participants sat in a quiet room with a computer, which they used to read and vote on ballot initiatives taken from actual ballots in previous elections in other states.
In the first experiment, participants read and voted on 40 ballot initiatives from 21 states. To try to replicate their results, they conducted a second experiment using different ballots — 24 from 11 states.
The researchers write that the results of both experiments provide “support for the notion that ballots written with more frequently used words (i.e., easier) compelled an easier experience that led to a higher likelihood of ballot support.”
They note that when they compared participants’ votes with real-life votes on the ballot measures, they saw similar patterns. Of the 40 ballot measures tested in the first part of the study, 85% passed in both the experimental “election” and the real-world election. Meanwhile, 87.5% of the 24 ballots used in the second experiment were approved in both.
School Characteristics and Voting: What Matters in Turnout and Passage
Karin E. Kitchens. Urban Affairs Review, August 2022.
In Florida, there’s a link between the types of students who attend local public schools and the level of support voters give tax referendums aimed at raising money for public schools, according to this study.
“The percent of students who pass third-grade math in a [voting] precinct is associated with higher passage rates,” the author writes.
During primary elections specifically, voters are less likely to say “yes” to tax referendums in communities where a larger proportion of students qualify for free or reduced-price meals at school.
To better understand the factors that influence voter support for tax referendums for schools, the author analyzed a variety of data on elections, registered voters, and public and private schools in Florida from 2008 to 2018. During that time, public school districts asked voters 125 times for permission to either raise local tax rates or introduce new taxes to generate more funding for public schools. Ninety-five referendums passed.
The author learned that voter demographics also affect the odds someone will support or reject a referendum. For example, referendums received less support in communities with a lot of older voters or voters who own their homes.
“Because the majority of tax referendum votes are for property tax increases, this shows that the people that are most likely to be affected by the tax increase are less likely to support it,” she writes. “However, the higher household median income is associated with an increase in the percent yes vote.”
Ballot Initiatives and Status Quo Bias
Joshua J. Dyck and Shanna Pearson-Merkowitz. State Politics & Policy Quarterly, January 2021.
It’s easier to encourage voters to vote “no” than “yes” on ballot initiatives, this study suggests.
The researchers used two survey experiments to test the effectiveness of arguments made by campaigns urging voters to either support or reject certain ballot initiatives. For the first experiment, researchers conducted telephone surveys with 956 Massachusetts voters one week before the 2012 general election to ask them about three ballot initiatives they would be voting on. For the second experiment, conducted in May 2013, researchers surveyed a nationally representative sample of 1,000 U.S. adults about three hypothetical ballot initiatives.
Participants considered a total of six issues: second trimester abortions, medical use of marijuana, sex offender residency restrictions, assisted suicide, automotive repair laws and a supermajority state budget requirement.
In both experiments, participants were divided into three groups, each of which answered questions about three ballot initiatives. One group was cued with a short argument in favor of the ballot initiative. One was cued with a short argument in opposition to the initiative. Members of the third group — the control group — received no cues and were simply asked if they would support or oppose the measure.
The researchers discovered that cues against a measure were more effective than cues in favor of a measure. For example, U.S. adults cued to oppose a ballot question on second trimester abortion were 9.8% more likely to oppose the measure than adults in the control group. Meanwhile, U.S. adults cued to support the ballot question were less than 1% more likely to say “yes” to it than adults in the control group.
The results indicate opposition cues are most effective at moving people to oppose issues that require relatively high levels of political sophistication, education or effort to understand – for example, whether a supermajority of legislators should be required to make budgetary changes. U.S. adults cued to oppose a hypothetical ballot question about that issue were 20.2% more likely to say they would vote “no” than were members of the control group.
“Across all six issues and in both surveys, opposition cues decrease support for ballot measures from about 9 to 24 percentage points,” the authors write.
Extra, Extra, (Don’t) Roll-off about It! Newspaper Endorsements for Ballot Measures
Kevin Fahey, Carol S. Weissert and Matthew J. Uttermark. State Politics & Policy Quarterly, March 2018.
This 20-year study of ballot measures in Florida finds a link between local newspaper endorsements of specific ballot measure and a lower percentage of voters saying “no” to them.
Researchers collected county-level data on voting decisions on the 79 state constitutional amendments that appeared on general election ballots in Florida between 1994 and 2014. They also looked at whether and how newspapers in different parts of the state encouraged audiences to vote on each ballot measure.
The authors of the paper find that newspaper endorsements are associated with a 4.4% decline in “no” votes. Even a small reduction can make a big difference in Florida elections.
“As the average amendment receives 58% of the vote, an endorsement can be critical in helping push the amendment over the 60% requirement for passage,” the authors explain.
Voter Experience and Ballot Language Framing Effects: Evidence from a Survey Experiment
Ted D. Rossier. Social Science Quarterly, November 2021.
This small study demonstrates that the way ballot measures are worded and framed can affect how voters respond to them.
In an online experiment, 502 adults eligible to vote in the U.S. read hypothetical ballot measures and then indicated whether they would support them. The researcher recruited participants using Amazon Mechanical Turk, an online crowdsourcing marketplace many scholars use to find people for surveys and studies.
For the first part of the experiment, conducted in November 2016, each participant read one of two versions of a ballot measure calling for a tax increase to fund public education. People were almost twice as likely to support the increase when it was described as an additional “one cent per dollar” than when it was described as “a 22 percent increase,” the author of the paper found. The first version drew support from 60% of participants who read it. One-third of those who read the second version said they would vote for it.
For the second part of the experiment, participants read two hypothetical ballot measures on issues related to public money or property being used for the benefit of religion or religious organizations. The key difference: One measure focused on the removal of something — a Ten Commandments monument from the State Capitol — while the other called for something to be provided — tuition vouchers that low-income students could use to attend private, religious schools.
Participants were more likely to support the measure on school tuition vouchers — 43% of those who read it supported it. Meanwhile, 38% of adults who read the other measure said they would vote “yes.”
The author notes how important it is for authorities to understand how the language and framing of ballot measures can be used to draw or discourage support.
“As a general matter, state institutions that are responsible for writing ballot questions, as well as the courts that hear challenges thereto, must remain mindful of the potential for nefarious manipulation of the process,” he writes.
What voters know about ballot initiatives
Direct Democracy, Educative Effects, and the (Mis)Measurement of Ballot Measure Awareness
Jay Barth, Craig M. Burnett and Janine Parry. Political Behavior, 2020.
The purpose of this study was to determine whether traditional methods of measuring voters’ knowledge of ballot measures — primarily asking them “yes” or “no” questions — have been accurate. The researchers conclude these methods vastly overestimate voter knowledge.
They found most Arkansas voters who participated in survey experiments during two election years could not demonstrate familiarity with any of the ballot measures they would be voting on — even though the election was days away and some measures addressed high-profile issues such as gambling and increasing the minimum wage.
“Indeed, the results of our simple experiments suggest that only about 1 in 4 voters is conscious of even one measure on an upcoming ballot,” the researchers write.
Researchers conducted two statewide surveys of Arkansas voters in 2014 and 2016, one or two weeks before November elections. To gauge how familiar voters were with the ballot measures that would be coming before them, live callers conducted phone interviews with more than 1,500 adults, 75% of whom said they were “very likely” to participate in the upcoming election.
Half of participants were interviewed before Arkansas’s 2014 general election, which included five ballot questions. Half were interviewed prior to the 2016 general election, when Arkansas voters decided four ballot questions.
Among the key findings:
- In 2014, 54% of survey participants said they were unaware any measure would be on the ballot for the upcoming election. In 2016, 53% did not expect ballot measures.
- Half the people who knew ballot measures would appear on their ballots could not identify any of the issues.
- The voters most likely to overstate their level of knowledge about ballot measures were well educated, say they closely follow government and politics, and show a high level of knowledge about federal governance.
The researchers explain why they think earlier methods of measuring voter knowledge failed to accurately capture voter knowledge of ballot measures.
“We suspect that when asked by past researchers if they had ‘read or heard about Proposition X,’ most voters said ‘yes’ not because a robust policy discussion brought the matter to their attention, but because affectively ‘yes’ is the correct answer,” they write.
Insights on why voters skip parts of their ballot
Ballot Position, Choice Fatigue, and Voter Behaviour
Ned Augenblick and Scott Nicholson. The Review of Economic Studies, April 2016.
If ballot measures had appeared at the top of election ballots in San Diego County, California instead of at the bottom, 24 measures that failed between 1992 and 2002 would have passed, according to this analysis. Ballot measures, called propositions in California, appeared below 27 other items, on average.
Researchers examined voter behavior across San Diego County for all primary and general elections during that period. They chose that region because ballot positioning varied considerably among voting precincts thanks to differences in the number of local, state and federal political races and local and state ballot measures.
They found voters often did not finish long ballots, with many skipping races and measures appearing at the bottom.
“We find that voters are more likely to abstain and more likely to rely on decision shortcuts, such as voting for the status quo or the first candidate listed in a race, as the ballot position of a contest falls,” the authors write.
The share of voters who said “no” to ballot measures would have been 3.2 percentage points lower, on average, if the measures had appeared at the top of ballots, they conclude.
“Therefore, given the ballot position of each proposition, we calculate that 24 (6%) of the propositions in our data set would have passed rather than failed if voters did not experience choice fatigue,” they write.
Local newspapers and voter behavior
Newspapers and Political Participation: The Relationship Between Ballot Rolloff and Local Newspaper Circulation
Christopher Chapp and Peter Aehl. Newspaper Research Journal, May 2021.
This study suggests voters living in U.S. communities with a local newspaper complete a greater portion of their ballots. When researchers examined nationwide voting patterns, they discovered that in areas where the per capita newspaper circulation rate was higher, a larger percentage of voters voted in both the presidential race, located at the top of the ballot, and state legislative races, which are located farther down the ballot.
For the analysis, researchers merged data on the circulation and location of 8,000 local newspapers with results from the 2016 general election aggregated by legislative district.
They found people completed more of their ballots in areas with higher circulation rates, regardless of whether the newspaper published daily or weekly. They found the relationship to be particularly acute in areas where legislative races were less competitive, “suggesting that local news is an especially valuable information source when campaign activity is less pronounced.”
Additional resources
- Initiative & Referendum Institute at the University of Southern California studies ballot measures. It also maintains several databases of ballot measures. To access the data, contact the institute’s executive director, John Matsusaka.
- The National Conference of State Legislatures maintains a Statewide Ballot Measures Database, searchable by state, topic, keyword, year, status or primary sponsor.
- Ballotpedia provides a variety of information on ballot measure trends and individual ballot measures, including campaign fundraising totals, ballot readability scores and links to analyses and polls conducted on individual measures.
- The nonprofit research organization OpenSecrets tracks fundraising by campaigns supporting or opposing statewide ballot measures.
Expert Commentary