We’ve updated SWE’s Fast Facts with the latest statistics about women in engineering. Find out more about this data on the Society of Women Engineers’ research site. You can also download our updated SWE Research Flyer with this information.
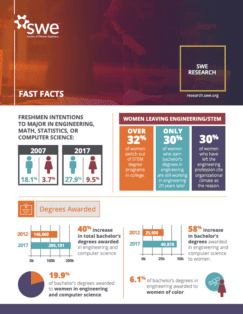
Freshmen Intentions to Major in Engineering, Math, Statistics, or Computer Science:[i],[ii]
- 2007: 18.1% (men); 3.7% (women)
- 2017: 27.9% (men); 9.5% (women)
Women Leaving Engineering/STEM
- Over 32% of women switch out of STEM degree programs in college.[iii]
- Only 30% of women who earn bachelor’s degrees in engineering are still working in engineering 20 years later.[iv]
- 30% of women who have left the engineering profession cite organizational climate as the reason.[v]
Degrees Awarded
- 40% increase in bachelor’s degrees awarded in engineering and computer science from 2012 (146,060) to 2017 (205,181).[vi]
- 58% increase in bachelor’s degrees awarded in engineering and computer science to women from 2012 (25,900) to 2017 (40,876).[vii]
- 20% of bachelor’s degrees awarded to women in engineering and computer science.[viii]
- 6% of bachelor’s degrees in engineering awarded to women of color.[ix]
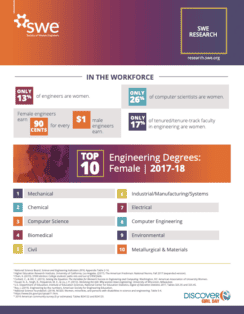
In the Workforce
- Only 13% of engineers are women.[x]
- Only 26% of computer scientists are women.[xi]
- Female engineers earn 10% less than male engineers.[xii]
Top 10 Engineering Degrees for Women, 2017-2018[xiii]
- Mechanical
- Chemical
- Computer Science
- Biomedical
- Civil
- Industrial/Manufacturing/Systems
- Electrical
- Computer Engineering
- Environmental
- Metallurgical & Materials
- [i] National Science Board. Science and Engineering Indicators 2016, Appendix Table 2-16.
- [ii] Higher Education Research Institute, University of California, Los Angeles. (2017). The American Freshman: National Norms, Fall 2017 (expanded version).
- [iii] Chen, X. (2013). STEM attrition: College students’ paths into and out of STEM fields.
- [iv] Corbett, C. & Hill, C. (2015). Solving the equation: The variables for women’s success in engineering and computing. Washington, DC: American Association of University Women.
- [v] Fouad, N. A., Singh, R., Fitzpatrick, M. E., & Liu, J. P. (2012). Stemming the tide: Why women leave engineering. University of Wisconsin, Milwaukee.
- [vi] U.S. Department of Education, Institute of Education Sciences, National Center for Education Statistics, Digest of Education Statistics 2017. Tables 325.35 and 325.45.
- [vii] U.S. Department of Education, Institute of Education Sciences, National Center for Education Statistics, Digest of Education Statistics 2017. Tables 325.35 and 325.45.
- [viii] Roy, J. (2019). Engineering by the numbers. American Society for Engineering Education.
- [ix] National Science Foundation. (2019). NCSES: Women, minorities, and persons with disabilities in science and engineering. Table 5.4.
- [x] https://www.bls.gov/cps/cpsaat11.htm.
- [xi] https://www.bls.gov/cps/cpsaat11.htm.
- [xii] 2016 American community survey (5-yr estimates): Tables B24122 and B24123.
- [xiii] Roy, J. (2019). Engineering by the numbers. American Society for Engineering Education.
Related content:
- SWE Research Update: Women in Engineering By the Numbers (Sep. 2018)
- SWE Research Updates on International Data (Aug. 2018)
- New SWE Research: Women Engineers of Color in Early Career (Feb. 2018)
- Panel Discussion on SWE Research of Gender Bias in India (Apr. 2019)
- Research Highlights from “Women and Technology: The Dimensions of a Revolution” (Sep. 2019)
Author
-

SWE Blog provides up-to-date information and news about the Society and how our members are making a difference every day. You’ll find stories about SWE members, engineering, technology, and other STEM-related topics.


