Effects of Permafrost Degradation on the Hydrological Regime in the Source Regions of the Yangtze and Yellow Rivers, China

1
Qilian Alpine Ecology and Hydrology Research Station, Key Laboratory of Inland River Ecohydrology, Northwest Institute of Eco-Environment and Resources, Chinese Academy of Sciences, Lanzhou 730000, China
2
University of Chinese Academy of Sciences, Beijing 100049, China
*
Author to whom correspondence should be addressed.
Water 2017, 9(11), 897; https://doi.org/10.3390/w9110897
Submission received: 22 July 2017
/
Revised: 12 October 2017
/
Accepted: 10 November 2017
/
Published: 16 November 2017
Abstract
:Climate warming has intensified permafrost degradation, which could have a variety of implications on the hydrological regime in permafrost regions. In this study, we analyzed the effects of permafrost degradation on the hydrological regime via four hydrological variables for 10 unregulated catchments in the source regions of the Yangtze and Yellow rivers. The results demonstrate that catchments with high permafrost coverage are expected to have an increased winter discharge ratio (proportion of winter discharge contribution to total annual flow), a decreased recession coefficient and a decreased ratio of Qmax/Qmin due to permafrost degradation. However, the great storage effects of lakes and wetlands, which could contribute to more groundwater instead of direct surface discharge, may affect the hydrological effects of permafrost degradation and result in the abnormal performance at catchment scale. The correlation analysis between summer precipitation (July–September) and the following winter discharge (December–February) indicates that permafrost degradation may affect the redistribution of summer precipitation towards the following winter discharge via increasing the soil storage capacity and delaying the release of water into streams in permafrost regions. However, unlike the Arctic and sub-Arctic regions, no significant changes for the hydrological regime (four hydrological variables) are detected over the individual periods of records for each catchment. Decreased precipitation in summer seems to reduce the water infiltration to supply the groundwater, which weakens the effects of permafrost degradation on the hydrological regime. This study implies that the storage effects of lakes and wetlands and the changes of summer precipitation patterns should be considered in future permafrost hydrological simulations, which have suggested that a large increase in groundwater discharge to streams will likely occur in response to permafrost degradation due to the warming climate in the ideal scenario.
1. Introduction
Global warming due to anthropogenic greenhouse gas emission is amplified in high-latitude [1] and -altitude regions [2], which significantly changes permafrost distribution, and thus affects hydrological processes and conditions [3,4,5]. The changes in the hydrological regime will affect the availability of water resources and the timing and magnitude of floods and low flows [5,6,7,8], which will play a profound implication on local ecological economy development and water resources management.
During winter, surface runoff is negligible due to freezing conditions, and river discharge with no direct liquid supply of rainfall but snowfall, is assumed to mainly come from the relatively deep groundwater flowing through the unfrozen parts of the ground [9,10,11,12]. Under climate warming, the groundwater is expected to become more and more important due to permafrost degradation, which enhances liquid water infiltration and supports deep flow paths [9,10,11,12]. The increased winter discharge or cold-season minimum discharge has been detected in the Arctic and sub-Arctic rivers, such as in Yukon River [12], Northern Eurasian rivers [13,14], Northwest Territories, Canada [11], Lena River [8], and entire pan-Arctic [15] for various time records. This increased trend is speculated to have a close relationship to permafrost dynamics. Model simulations have paid special attentions to the interaction between groundwater and surface water in permafrost regions. Bense et al. [16] suggested that a large increase in groundwater discharge to streams for the next few centuries will likely occur in response to permafrost degradation due to climate warming. Ge et al. [17] demonstrated that a three-fold thickening of the active layer will lead to a three-fold increase in groundwater discharge. Wellman et al. [18] demonstrated that permafrost thaw could accelerate rates of groundwater flow in the active layer above permafrost. Evans et al. [19] suggested that an increase in mean annual surface temperature of 2 °C could cause a three-fold increase in groundwater contribution to discharge.
Permafrost degradation has been shown to smooth out the seasonal distribution of discharge at catchment scale, which significantly affects groundwater dynamics and resources volumes [8,20,21,22,23]. Permafrost extent over a region plays a key role in the distribution of surface-subsurface water interactions [7,8,24,25]. Compared with non-permafrost regions, permafrost catchments have higher peak flow and lower base flow [20,26,27]. In the permafrost regions, catchments with higher permafrost coverage could have lower groundwater storage capacity, and thus a lower winter base flow and a higher summer peak flow [20,27,28]. Ye et al. [8] describe a relationship between the ratio of monthly maximum discharge to minimum discharge (Qmax/Qmin) and permafrost coverage in the Lena basin, where the hydrological regime is significantly influenced by permafrost extent when it exceeds 40% of the catchment area. Besides, the regions with the higher permafrost coverage correspond to the lower groundwater storage capacity, which may become weaker due to permafrost degradation [10,27,29,30,31,32]. Long-term trends in recession flow, as a proxy for permafrost degradation, have been analyzed in Northern Sweden [10,30], Yukon River basin [29] and Northwest Territories, Canada [31]. These changes in the recession flow properties are consistent with the observation of permafrost degradation.
Located in the hinterland of the Qinghai-Tibetan Plateau (QTP), the source regions of the Yangtze and Yellow rivers are one of the most important permafrost distribution regions in China. Widespread permafrost degradation has been extensively reported on the QTP [33,34]. Acted as the “water tower” of China, the source regions of the Yangtze and Yellow rivers provide substantial water supply for the adjacent lowlands. Understanding the effects of permafrost degradation on the hydrological regime in the area is very urgent for local water resources management and has substantial social, economic and ecological significance.
In this study, for the first time, we estimate the effects of permafrost degradation on the hydrological regime in the source regions of the Yangtze and Yellow rivers via four hydrological variables, namely, winter discharge, winter discharge ratio (proportion of winter discharge contribution to total annual flow), recession coefficient and the ratio of Qmax/Qmin. The primary objectives of the present study are to (1) detect hydrological regime changes of the 10 catchments in the study area and (2) attempt to analyze the effects of permafrost degradation on the hydrological regime by assessing the relationship between hydrological variables and the coverage of permafrost. The result of this study will improve our knowledge of cold region hydrology and its change due to climate impact in permafrost regions.
2. Materials and Methods
2.1. Study Area
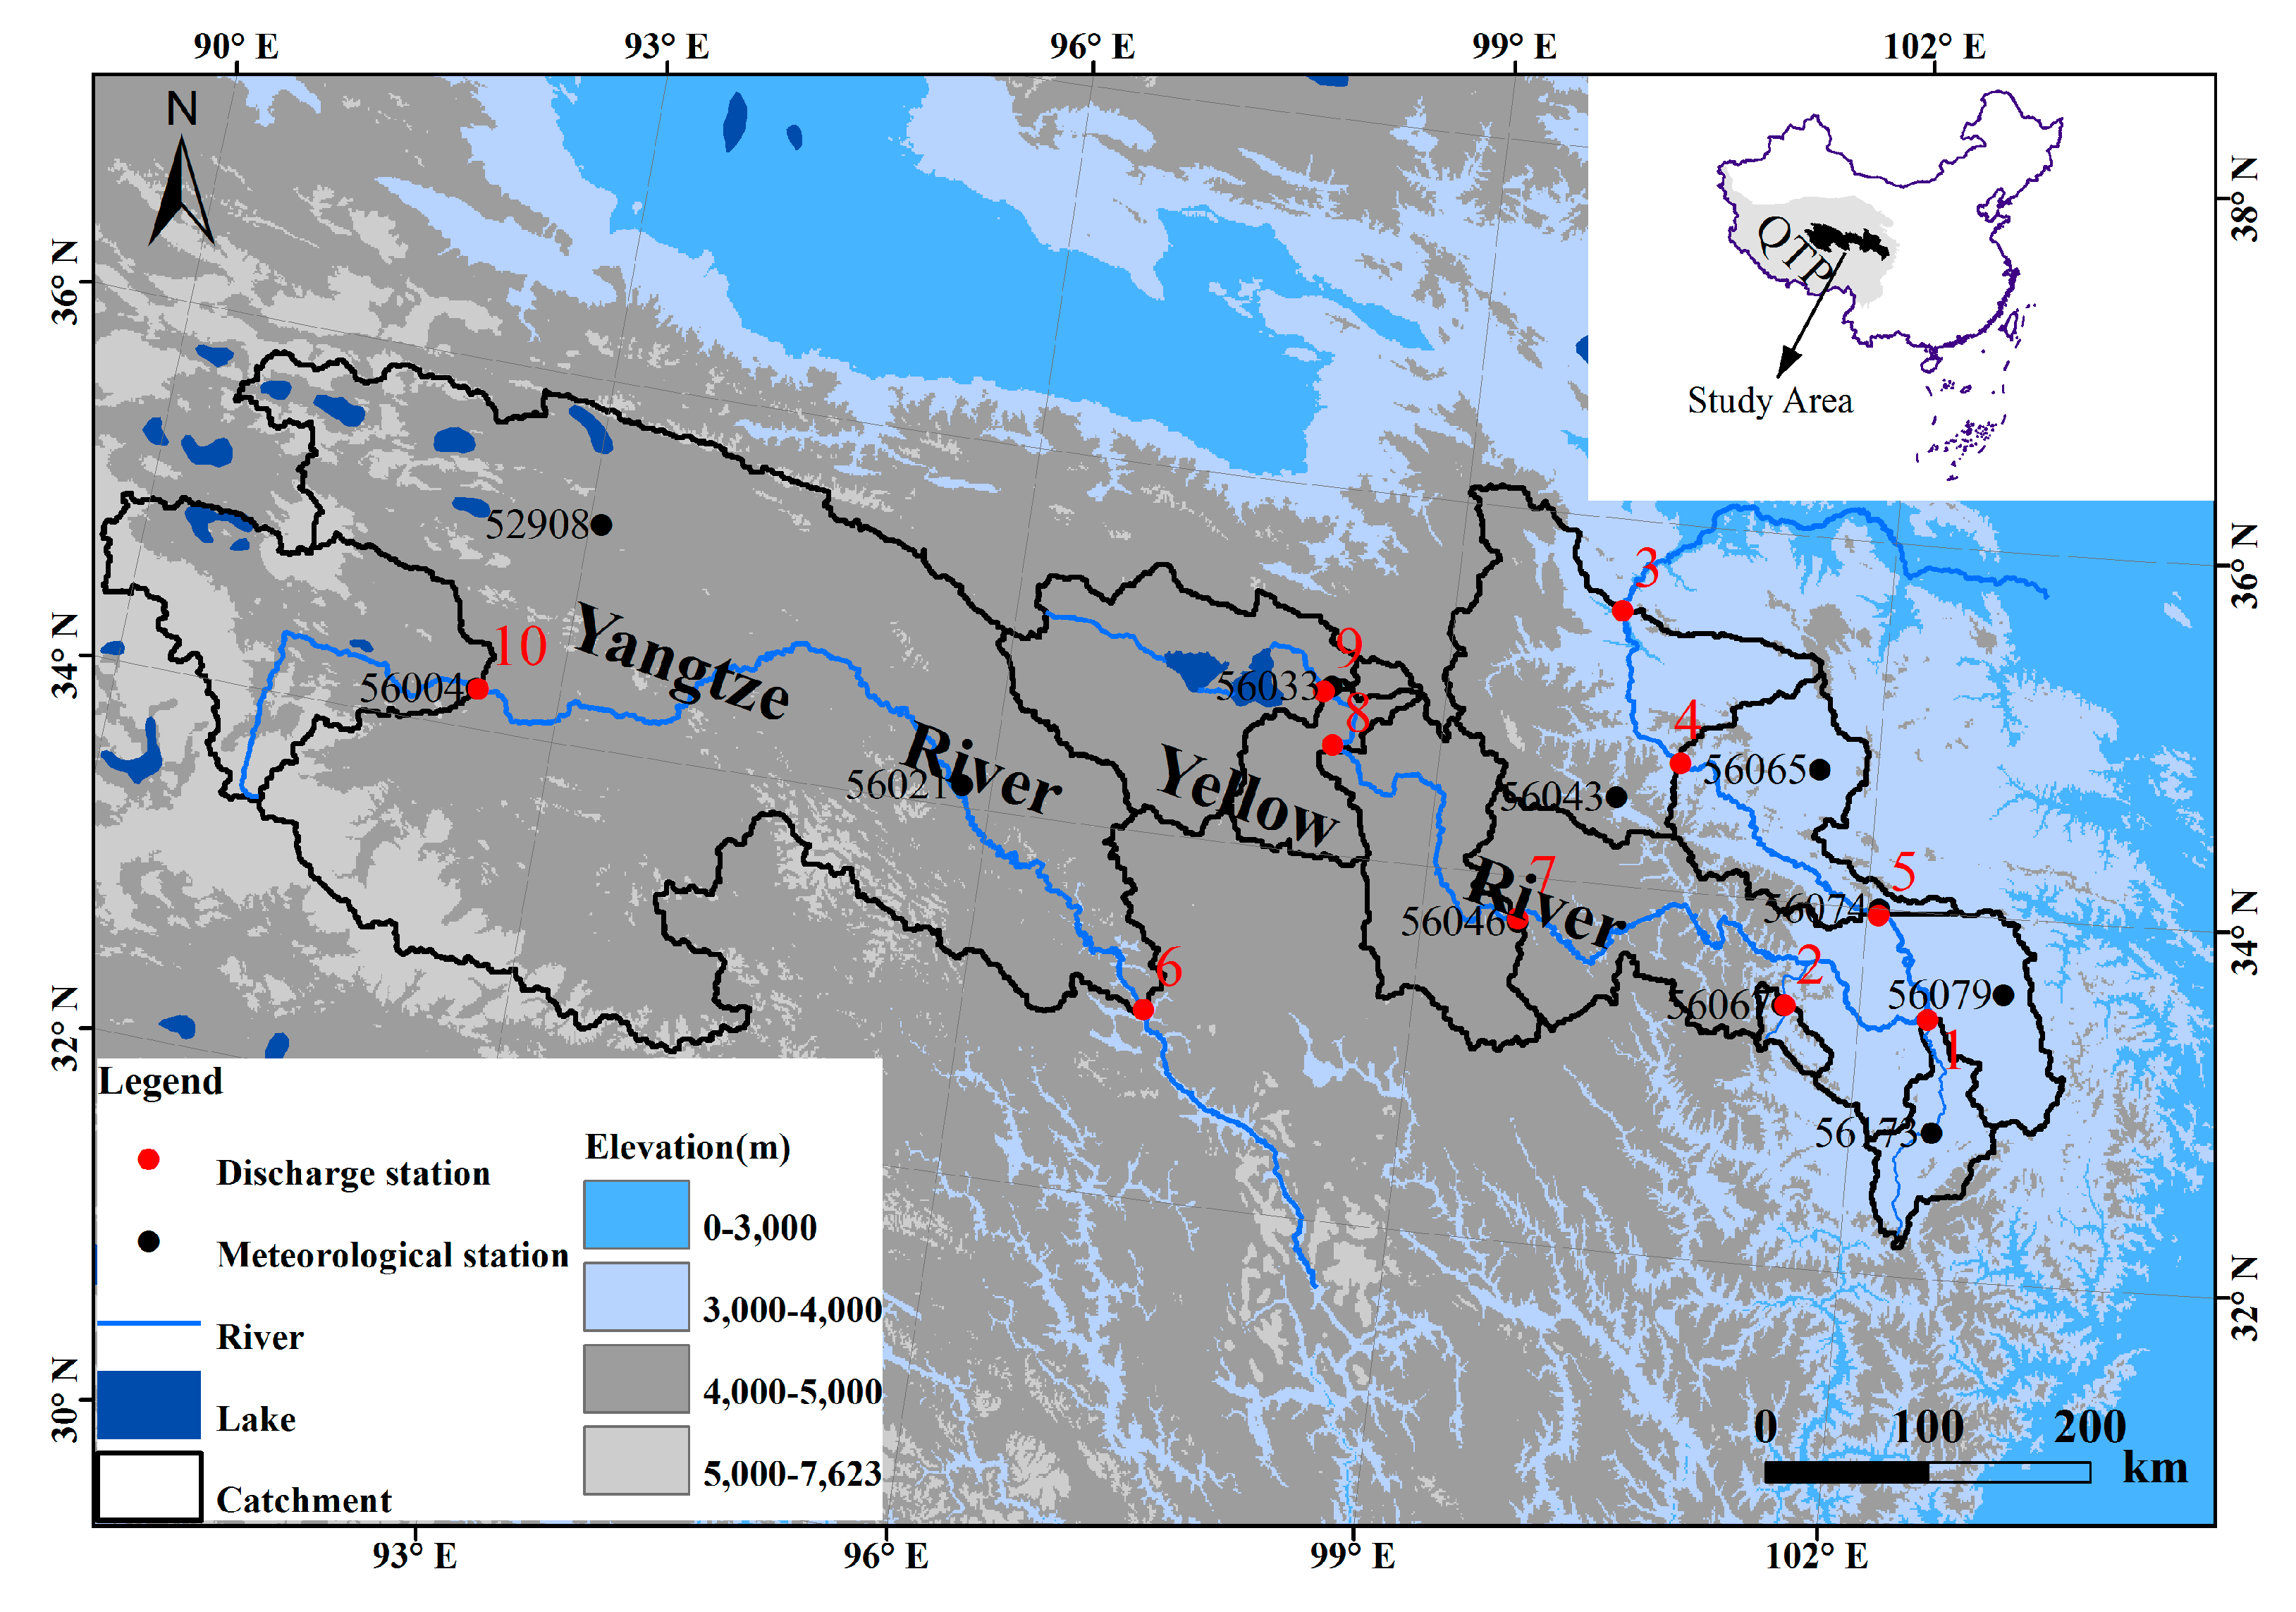
The source region of Yellow River is generally defined as the upstream catchment above the Tangnag Discharge Station (Figure 1, Table 1). With the geographical boundary of about 95°51′–103°28′ E and 32°12′–36°06′ N, the source region of Yellow River covers an area of 12.2 × 10⁴ km2, and yields a mean annual runoff of 168 mm (about 35% of total runoff of Yellow River) [35]. Located between 90°30′–97°20′ E and 32°30′–35°40′ N, the source region of the Yangtze River is generally defined as the upstream catchment above the Zhimenda Discharge Station (Figure 1, Table 1), and covers an area of 13.7 × 10⁴ km2.
Both source regions are located in the hinterland of the QTP, with an average elevation of more than 4000 m. There are some very large mountain ranges distributed in the source regions, such as Tangula Mountains, Bayan Har Mountains and Anyemaqen Mountains in the south, middle and north parts, respectively. Owing to the high relief, permafrost is widely distributed in the study area. The thickness of permafrost varies from 30 to 70 m, with a maximum thickness of 150–170 m [36].
Controlled by the typical QTP climate system, the climate in the study area is cold and dry. The mean annual temperature is generally below 0 °C. Of which, the mean annual air temperature varies from −4 to 5.2 °C for the source region of Yellow River, and from −5.5 to 4 °C for the source region of the Yangtze River. The mean annual precipitation is about 270–550 mm and decreases from east to west.
2.2. Data
Ten discharge stations in the source regions of the Yangtze and Yellow rivers were selected for analysis (Figure 1, Table 1). All 10 rivers have catchments which are located in permafrost regions and are free from the influences of flow regulation. Catchment boundaries and drainage areas were derived from the DEM data, which were based on SRTM (Shuttle Radar Topography Mission) data with a spatial resolution of 3 arc-seconds (SRTM3). The drainage areas from the DEM data were well-matched to those reported by the official statistics with the relative errors of less than 8%.
In this paper, the altitude model was used to determine the coverage of permafrost in the drainage catchment. Altitude model is based on the three-dimensional zonation in the distribution of high-altitude permafrost, namely, vertical, latitudinal and aridity (or longitudinal) zonation and has been proven that the accuracy of the model is high on the QTP [38]. This model has been widely used to analyze the permafrost distribution in western China [6,39,40]. Using observed data for the lower limit of high-altitude permafrost distribution, the relationship between the altitude of the lower limit and latitude can be represented by fitting a Gaussian distribution curve [37]:
where H is the altitude of the lower limit of high-altitude permafrost, and is the geographical latitude. Equation (1) is referred to as the altitude model.
Because the altitude model takes the lower limit as the main criterion of high-altitude permafrost distribution, DEM (SRTM3) is used to calculate the lower limit of permafrost distribution at each grid cell and then the lower limit is compared with the altitude of the same grid cell to determine if there is permafrost on the grid.
The monthly precipitation data at 11 meteorological stations within the study area from the establishment of stations to 2015 were collected from the China Meteorological Administration (Figure 1, Table 2). This meteorological dataset has been subject to strict quality control by the National Meteorological Information Center, and has been used widely as the official meteorological data [35,41,42,43]. In this study, the monthly precipitation data (July–September) at 11 meteorological stations were complete, and the average precipitation for each catchment was obtained by taking the average precipitation value for all stations within the specific catchment or nearby the discharge stations [35,41,42,43]. Due to the harsh natural environmental conditions, the meteorological stations are sparsely distributed in the high-altitude mountain regions, and these 11 meteorological stations are basically located in the low altitude regions (Figure 1, Table 2). Although there may be a low-altitude bias, these stations provide the best data available and can make an approximate proxy for the change trend of catchment precipitation in the source regions. However, it is important to note that the average precipitation value for each catchment can make a proxy for the change trend of catchment precipitation, but it does not necessarily correspond to the true precipitation.
Monthly discharge data were collected from the local hydrology bureau. All discharge data end at the present (2014) and include year-round records spanning at least 30 years, except for the Huanghe (8) and Jiuzhi (2) discharge station with a 24 and 27 years record, respectively (Table 1). Sometimes monthly discharge data are missing but time span of gaps is no more than two years (Table 1). Missing discharge data were inferred using linear least square regression from nearby discharge station whose record was highly correlated to that being infilled. In this study, in order to ensure high quality of the gap filled dataset, only stations with correlation coefficients above 0.9 were used to fill gaps.
2.3. Methods
2.3.1. Winter Discharge and Winter Discharge Ratio
To be consistent with previous authors, we assumed that all flow measured under ice during winter (December-February) derived from subsurface flow [11,12]. However, care must be taken to make this assumption for which we cannot ascertain the exact source of the winter flows. Winter discharge ratio was estimated by dividing the mean flow (m3/s) for winter (December–February) by the mean flow (m3/s) for each year. Besides, average winter discharge ratio was calculated for each catchment over the individual periods of record as well.
2.3.2. Recession Flow
To quantify the recession magnitude for each catchment, the monthly discharge was fitted using least-squares method to a simple linear-reservoir model represented by exponential behavior [32,45]:
where Qt is discharge at time t, Q0 is discharge at the onset of the recession period and k is a recession coefficient. Based on the monthly average discharge (m3/s), the recession coefficient was calculated for each catchment during recession periods (from November to either zero flow or February) over the observed period.
A lower recession coefficient reflected longer and/or slower drainage pathways associated with larger source areas transferring storage to discharge [24,31]. Under climate warming, the recession coefficient will likely become slow due to permafrost degradation, which may allow more water storage to support the following winter discharge. Besides the yearly k value, the average recession coefficient over the individual periods of record was determined as well. Similar to the analysis of winter discharge, time series trends of the recession coefficient for each catchment were again analyzed using the Mann-Kendall test.
2.3.3. Ratio of Qmax/Qmin
The ratio of the monthly maximum discharge (Qmax) to minimum discharge (Qmin) is a direct measure of the hydrograph shape and hydrological regime, which is expected to change due to permafrost degradation [6,8,46]. Therefore, this ratio can reflect the response of hydrological processes to permafrost degradation to some extent. In this study, the monthly maximum discharge was selected during summer in order to avoid the effects of the spring flood. The monthly minimum discharge was selected during winter following the monthly maximum discharge.
2.3.4. Correlation Analysis between Summer Precipitation and Winter Discharge
A correlation analysis between summer precipitation and the following winter discharge was conducted to assess the influence of summer precipitation on winter discharge under permafrost degradation. In this study, we defined summer precipitation as the total precipitation over the warm months of July–September, which can avoid the transitional months of June and October when sleet events often occur. Winter discharge is the average flow (m3/s) for the December–February period. The abrupt changes of the average annual temperature on the QTP were mainly detected in the 1980s [47,48]. Therefore, the period for correlation analysis was sub-divided into two sections (before 1985 and after 1985) in this study.
3. Results
3.1. Hydrological Regime Changes
The winter discharge had an increased trend in 6 of the 10 catchments over the records of observations considered in this study (Table 3). However, of these 6 catchments with increased trends, none of these catchments passed the statistical tests at the p ≤ 0.1 level. Similarly, the winter discharge ratio had an increased trend in 5 of the 10 catchments, with only 2 exhibited increased trends that were significant at the p ≤ 0.1 level, and none of these catchments passed the statistical tests at the p ≤ 0.05 level (Table 3).
Decreased trends in the recession coefficient were found in 6 of the 10 catchments, with only 3 exhibited decreased trends that were significant at the p ≤ 0.05 level, and none of these catchments passed the statistical tests at the p ≤ 0.01 level (Table 3). Six of the 10 catchments showed decreased trends in the ratio of Qmax/Qmin, with only 1 exhibited decreased trend that was significant at the p ≤ 0.05 level, and none of these catchments passed the statistical tests at the p ≤ 0.01 level (Table 3).
3.2. Relation between Hydrological Variables and Permafrost Coverage
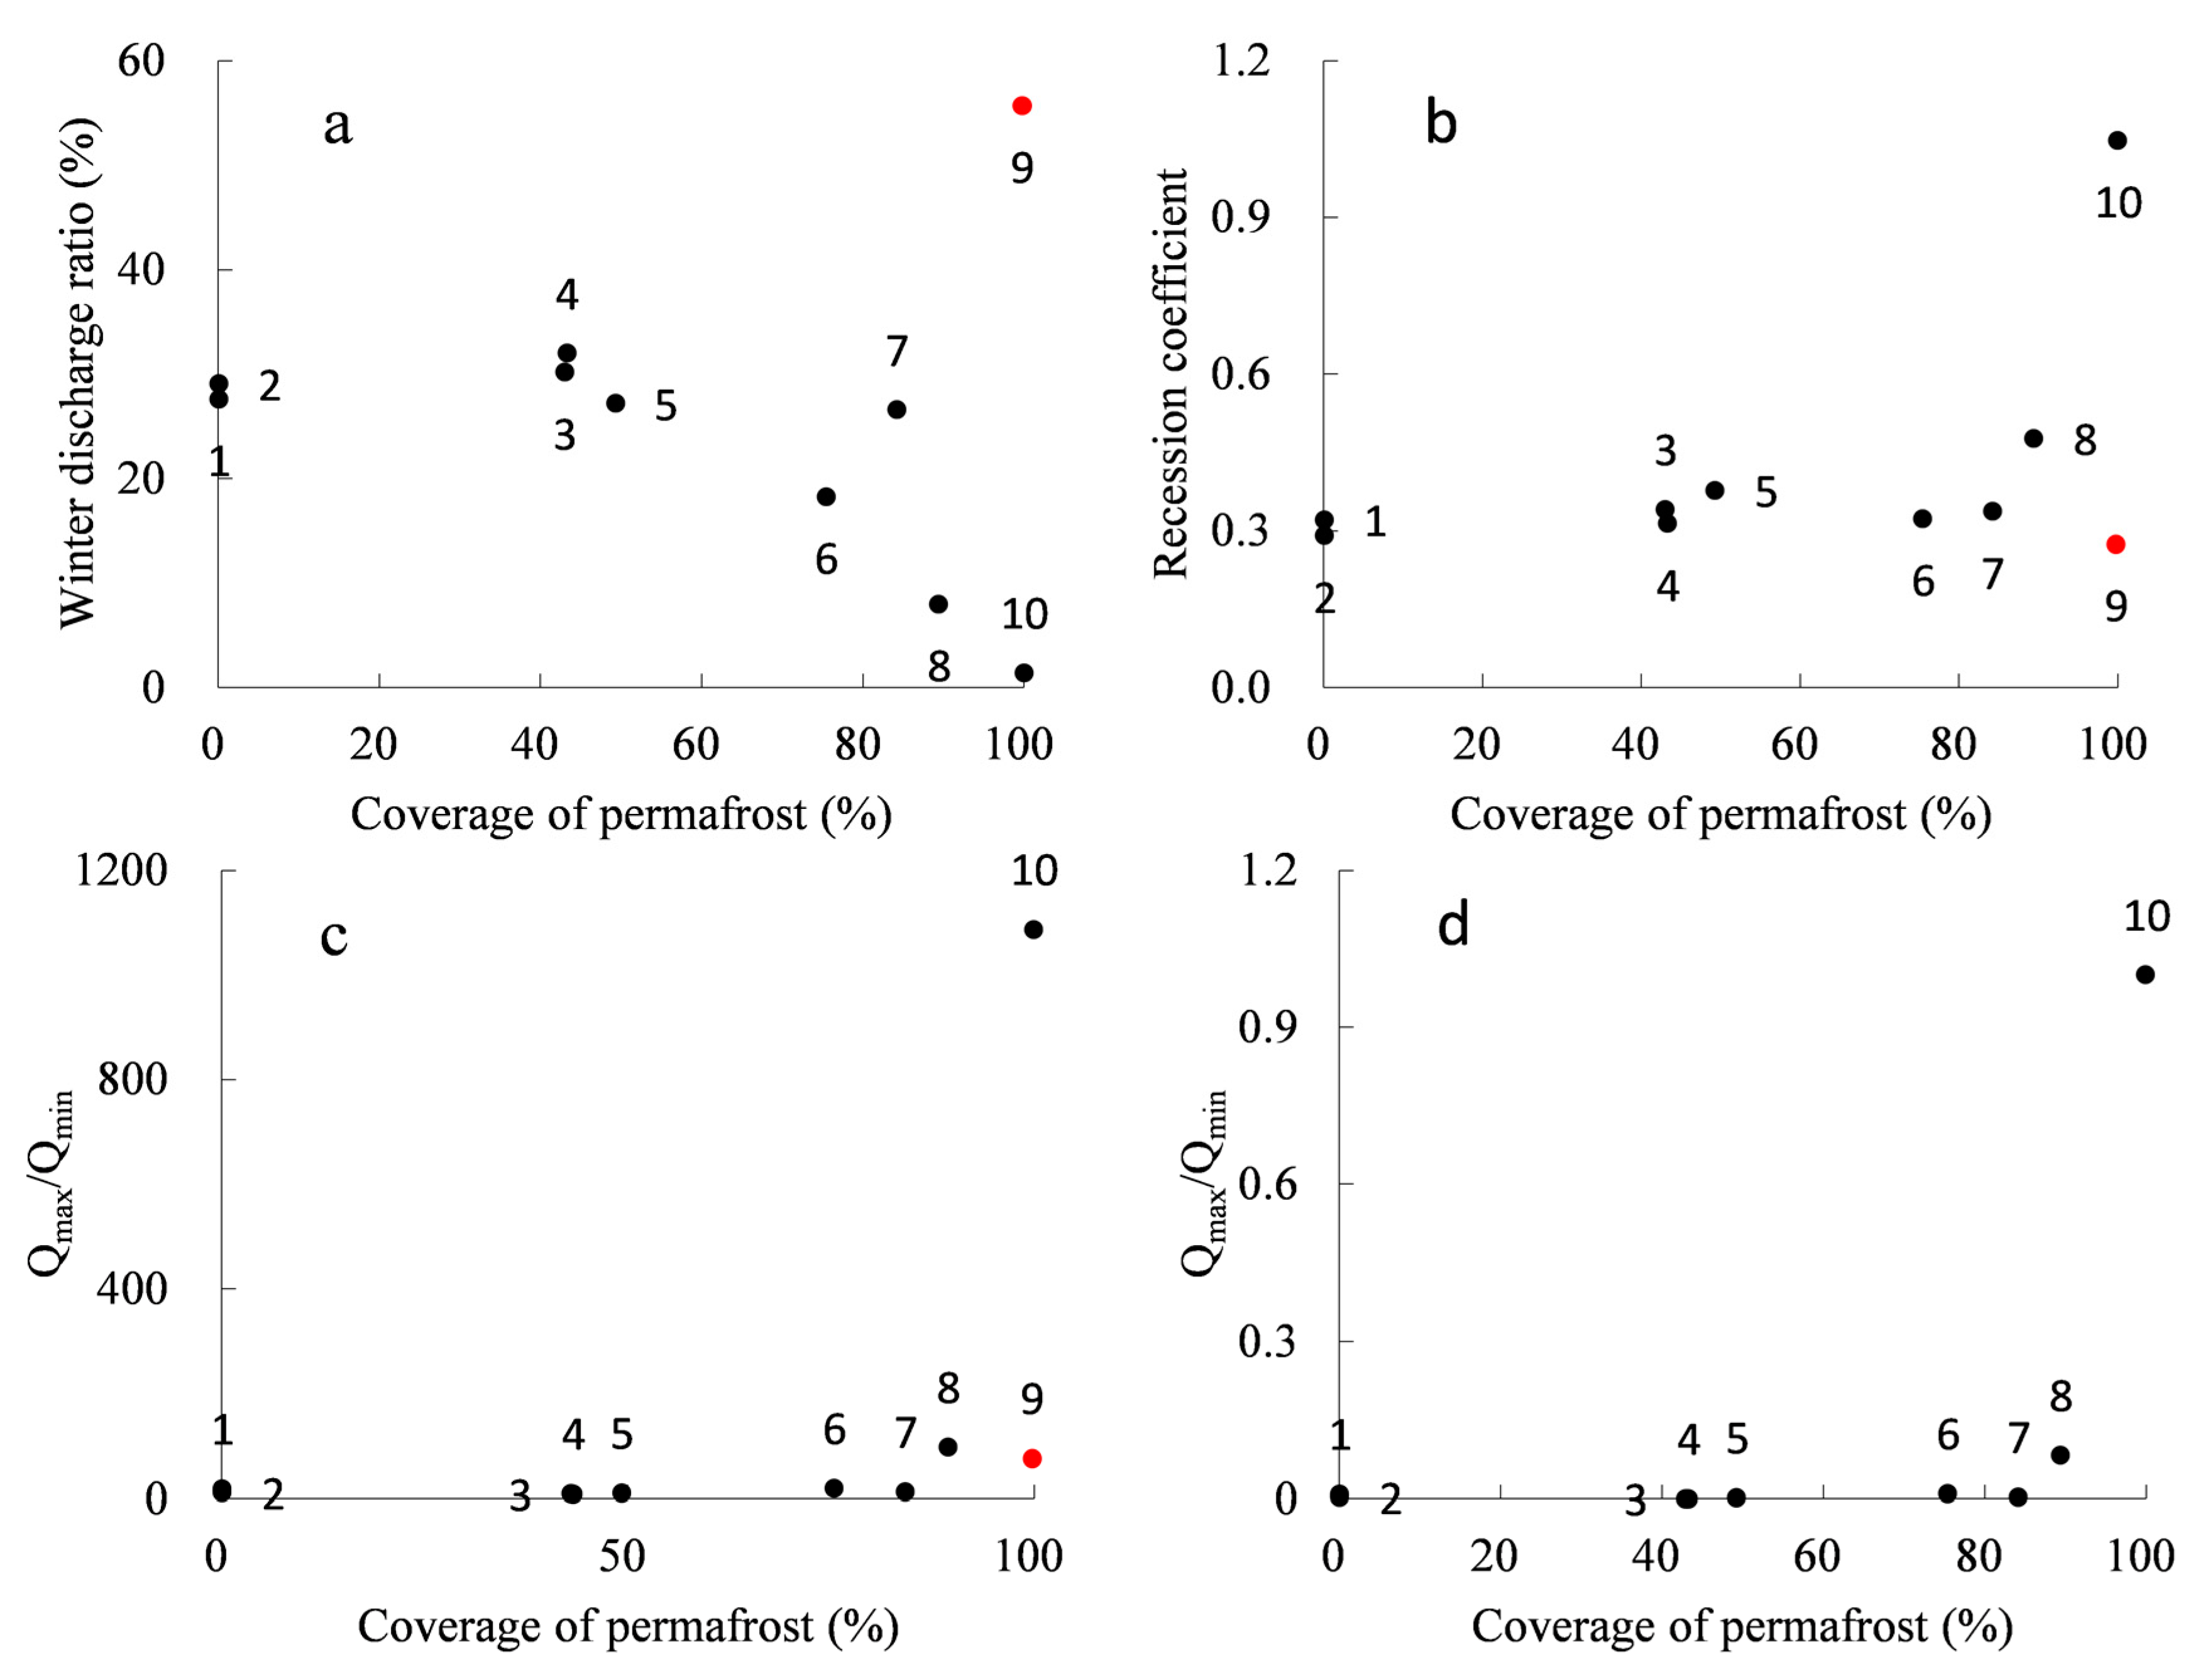
Although 10 catchments are characterized with various sizes, elevations and locations (Table 1), a moderately significantly negative correlation between the average winter discharge ratio and permafrost coverage (r = 0.72, p ≤ 0.05, except catchment 9) was found (Figure 2a). This result indicated that catchments with higher permafrost coverage were expected to have lower winter discharge ratio in the permafrost regions.
Similar to the winter discharge ratio, a positive correlation between the average recession coefficient and permafrost coverage (r = 0.58, p ≤ 0.1, except catchment 9) was found, which indicated that the fast recession flow was associated with the high permafrost coverage (Figure 2b). Meanwhile, a non-significantly positive correlation between the average ratio of Qmax/Qmin and permafrost coverage (r = 0.50, p = 0.17, except catchment 9) was also found (Figure 2c,d).
4. Discussion
For 10 catchments in the study area, the correlation analysis between winter discharge ratio and permafrost coverage implied that catchments with higher permafrost coverage could have lower winter discharge ratio in the permafrost regions (Figure 2a), which was consistent with the common results that dominated the current literature [11,12]. However, catchment 9 had higher winter discharge ratio (56%) but with higher permafrost coverage (99%), which may be attributed to the great storage effects of widespread lakes and wetlands in the drainage area. According to the statistics in the late 1980s [49], there are about 5300 lakes in the source region of Yellow River, and about 80% of them are located in catchment 9, including the two largest fresh water lakes in the source regions (Eling and Zhaling). Summer precipitation in this catchment mainly contributes to groundwater instead of direct surface water due to the widespread lakes and wetlands [35,49], which makes an important supply for the following winter discharge. A positive correlation between the average recession coefficient and permafrost coverage, the average ratio of Qmax/Qmin and permafrost coverage was also detected, which implied that permafrost degradation could allow more water storage to support winter discharge and smooth out the seasonal distribution of discharge at catchment scale to some extent. Similarly, catchment 9 appeared to be non-consistent with the above trend, the great storage effects of widespread lakes and wetlands may be responsible for it as well.
Under the warming climate, the hydrological regime of the source regions of the Yangtze and Yellow rivers is expected to change significantly due to permafrost degradation. However, using the same statistical methods as Walvoord and Striegl [12], St. Jacques and Sauchyn [11], we reported a much lower proportion (0%) showing increased winter discharge for the source regions of the Yangtze and Yellow rivers than for the Yukon River Basin (90%) and the Northwest Territories, Canada (87%) at the p ≤ 0.1 level. Besides, the other three hydrological variables, namely winter discharge ratio, recession coefficient and the ratio of Qmax/Qmin also did not change significantly (Table 3).
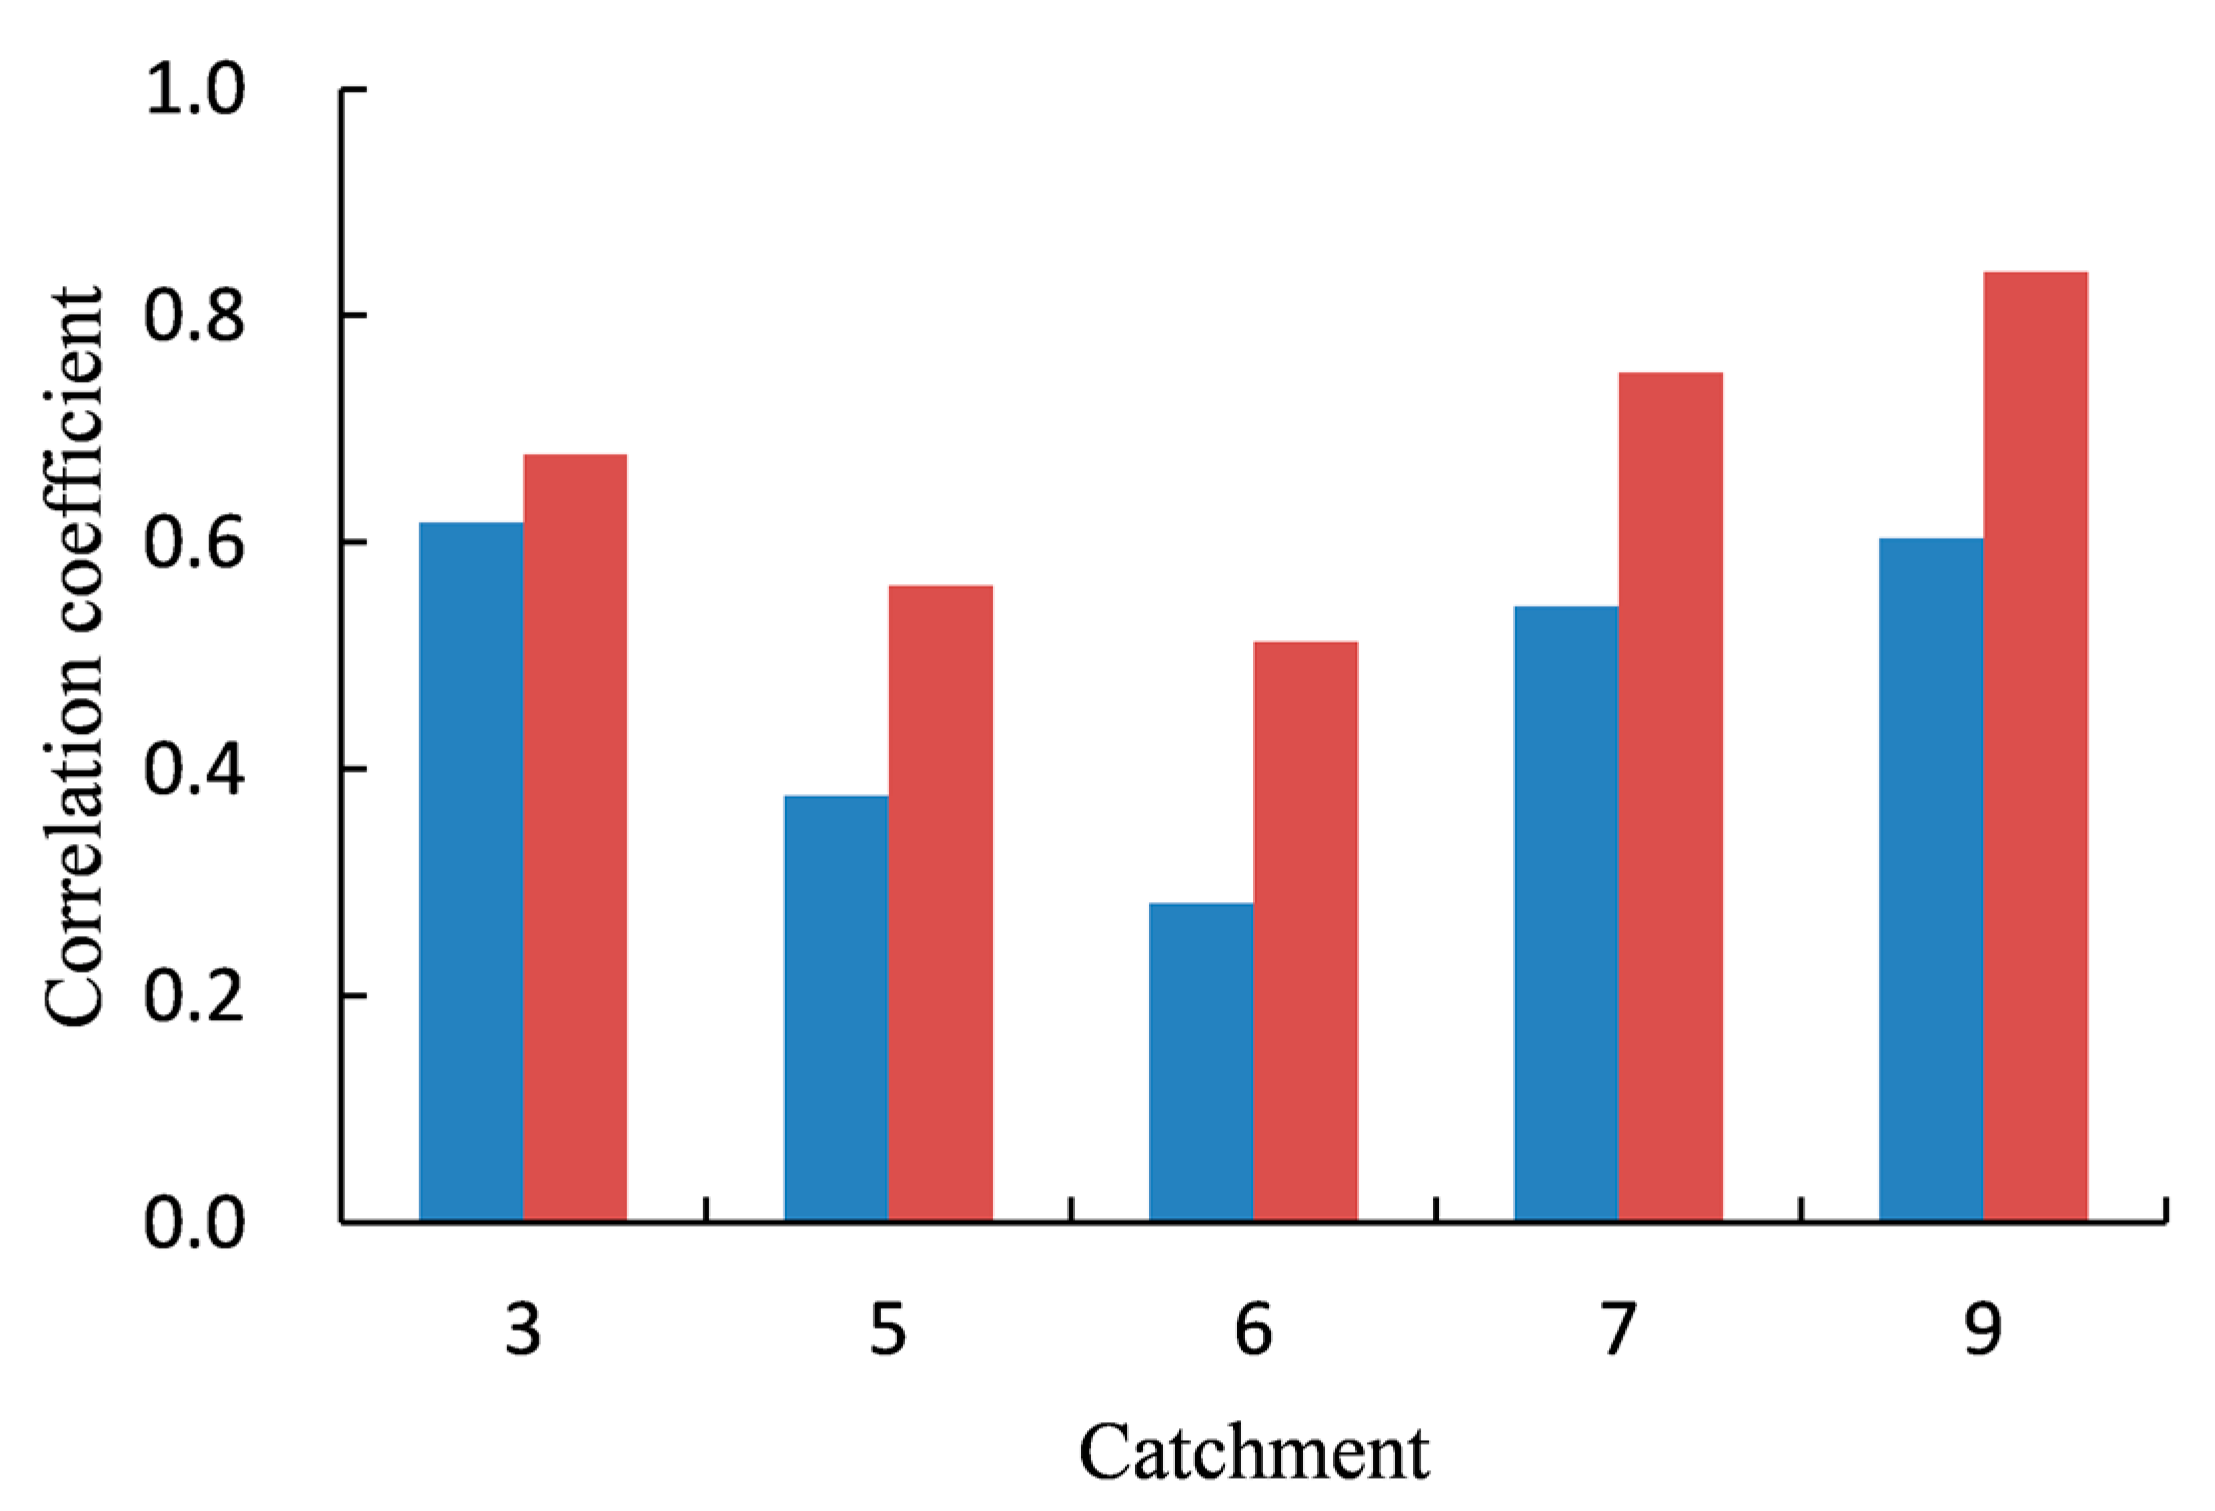
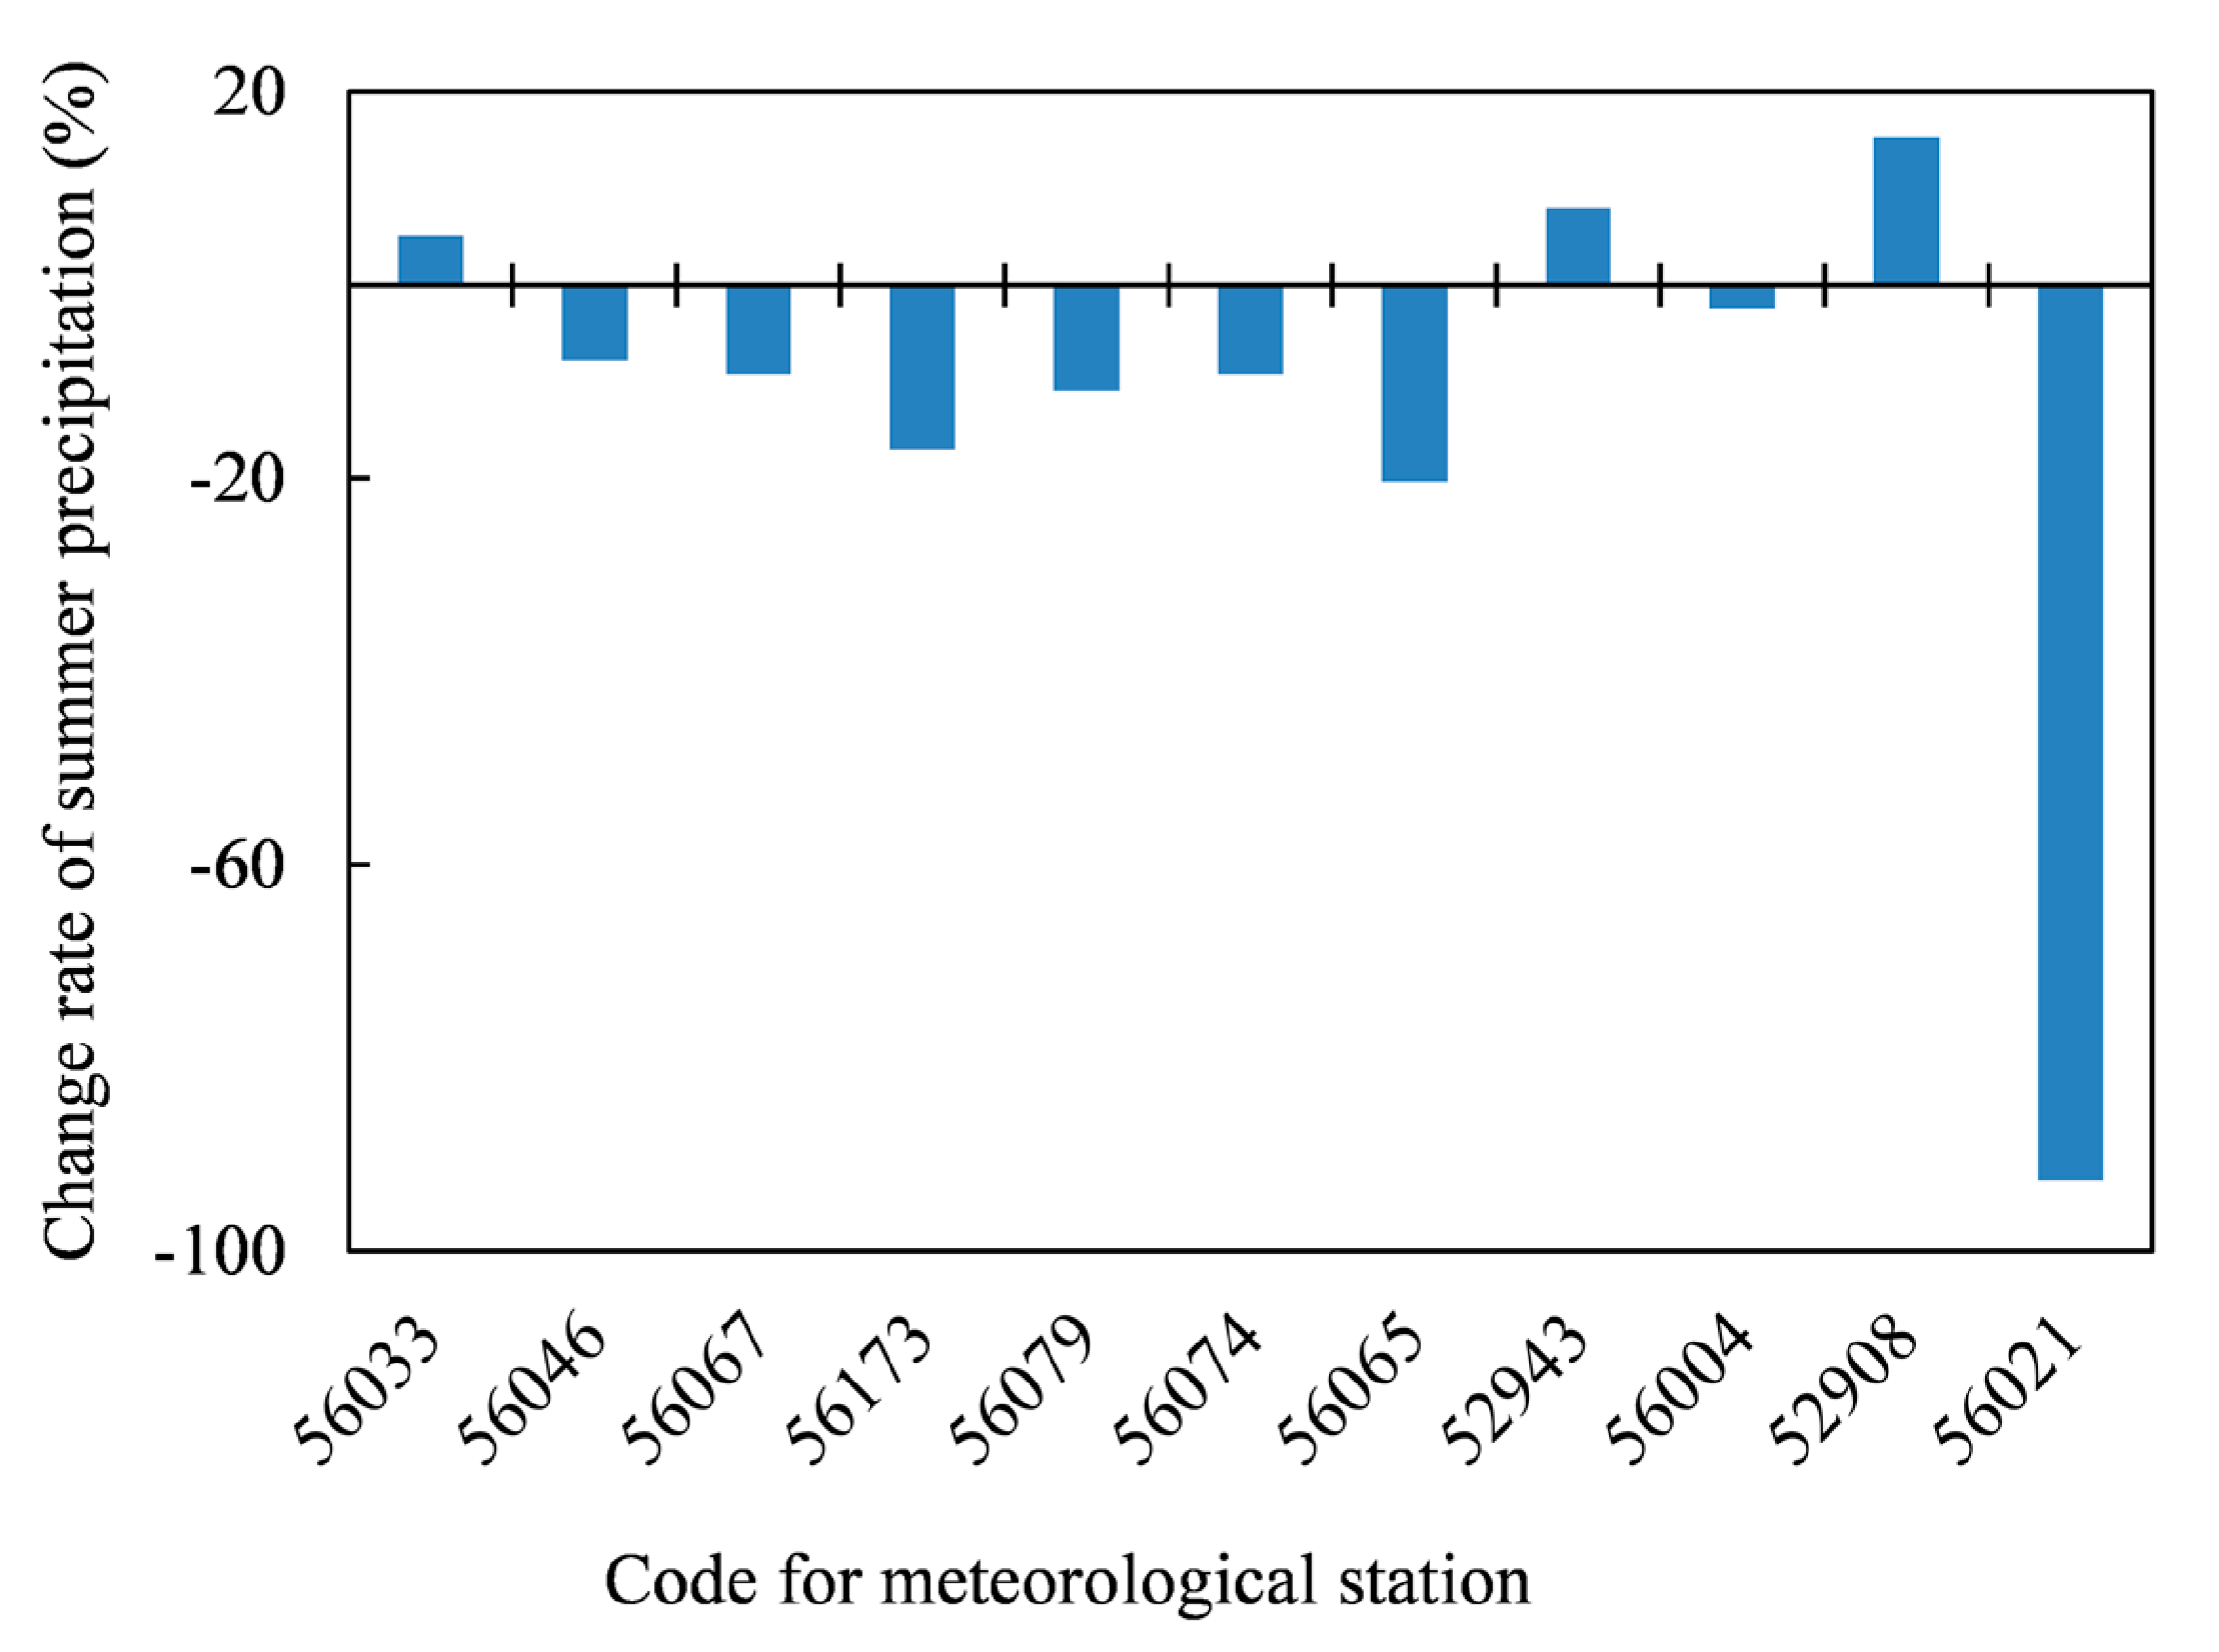
In general, summer precipitation greatly contributes to discharge in the areas underlain by permafrost, and catchments without permafrost have high base flow contributions [7]. A deeper active layer allows additional water storage and pathways for transferring water, resulting in the dependence of winter discharge on the timing and amount of summer precipitation [50]. In the source region of Yellow River, the correlation analysis between monthly discharge and precipitation suggested that the monthly discharge was often the result of a combined effect of the precipitation in the current and previous months [35]. At the boundary of continuous and discontinuous permafrost of the lower Yenisei River, a common increase in the time-lag between precipitation events and stream discharge was detected between 1970s and 1980s [50]. In this study, a common increase in the time-lag between summer precipitation and the following cold-season monthly discharge for the two periods (before 1985 and after 1985) was also detected (Figure 3), which implied that permafrost degradation may affect the redistribution of summer precipitation towards the following winter discharge via increasing the soil storage capacity and delaying the release of water into streams. For the source regions of the Yangtze and Yellow rivers, a decline in summer precipitation is noticeable in the majority of the stations as shown in Figure 4, which is consistent with other researchers [35]. In order to validate the above results (as shown in Figure 3 and Figure 4), we turn to precipitation (July–September), DEM (SRTM3), latitude, and longitude data of 36 meteorological stations in and around the source regions (Figure S1). A linear multiple regression analysis between precipitation, DEM, latitude, and longitude data of 36 meteorological stations was carried out for each year (all passed the statistical tests), and the precipitation data can be interpolated for the whole source regions for each year by using linear multiple regression equations (Figure S2). Catchment boundaries were used to extract the average precipitation for each catchment. The common increase in the time-lag between summer precipitation and the following winter discharge for the two periods (before 1985 and after 1985) was detected (Figure S3), and also a decline in summer precipitation was noticeable for most of the 10 catchments as shown in Figure S4.
Although permafrost hydrological simulations have suggested that a large increase in groundwater discharge to streams will likely occur in response to permafrost degradation due to the warming climate, they also emphasize the essential hypothesis that sufficient surface water could infiltrate to replenish the shallow groundwater system. Otherwise, there will be a substantial lowering of the water table in the recharge area of the catchments [16,17,18,19]. In this study, the decreased summer precipitation may result in less liquid water infiltration to supply the groundwater, which could weaken the effects of permafrost degradation on hydrological regime, and result in non-significant change trends for the hydrological variables. This may provide an important reference for permafrost hydrological simulations under permafrost degradation. Besides, unlike the Arctic and sub-Arctic regions, the relatively low ground ice content in the source regions of the Yangtze and Yellow rivers may result in less melting ground ice, and further weaken the hydrological response of permafrost degradation.
5. Conclusions
This study analyzed the effects of permafrost degradation on the hydrological regime via four hydrological variables for 10 unregulated catchments in the source regions of the Yangtze and Yellow rivers. The relationship between hydrological variables and the coverage of permafrost implies that catchments with high permafrost coverage are expected to have an increased winter discharge ratio, a decreased recession coefficient and a decreased ratio of Qmax/Qmin due to permafrost degradation. However, catchment 9 seems inconsistent with the above rules, the great storage effects of widespread lakes and wetlands may be responsible, which could contribute to more groundwater instead of direct surface discharge and make an important supply for the following winter discharge.
The correlation analysis between summer precipitation and the following winter discharge indicates that permafrost degradation may affect the redistribution of summer precipitation towards the following winter discharge via increasing the soil storage capacity and delaying the release of water into streams. However, unlike the Arctic and sub-Arctic regions, almost no significant changes for hydrological variables were detected over the individual periods of records for each catchment. Decreased summer precipitation seems to reduce water infiltration to supply the groundwater, which could weaken the effects of permafrost degradation on the hydrological regime, and result in non-significant change trends of the hydrological variables.
Model simulations have suggested that a large increase in groundwater discharge to streams will likely occur in response to permafrost degradation due to the warming climate in the ideal scenario. However, this study found that the storage effects of lakes and wetlands and the changes of summer precipitation patterns should be considered in future permafrost hydrological simulations.
Supplementary Materials
The following are available online at www.mdpi.com/2073-4441/9/11/897/s1. Figure S1: Location of the 36 meteorological stations in and around the source regions; Figure S2: Distribution of multi-year average summer precipitation (1960–2015) in the source regions; Figure S3: Correlation between summer precipitation (July–September) and the following winter discharge (December–February) for the period before 1985 (blue) and after 1985 (red); Figure S4: Change rate of summer precipitation (July–September) for all 10 catchments within the source regions.
Acknowledgments
This study was supported primarily by the National Basic Research Program of China (2013CBA01806) and the National Natural Sciences Foundation of China (41690141, 41671029 and 41401041).
Author Contributions
All authors made substantial contributions to data acquisition and results interpretation, and they also all participated in drafting and revising the article. All authors gave their approval of the version submitted for publication.
Conflicts of Interest
The authors declare no conflict of interest.
References
- Mcbean, G.; Alekseev, G.; Chen, D.; Forland, E.; Fyfe, J.; Groisman, P.Y.; King, R.; Melling, R.; Vose, R.; Whitfield, P.H. Chapter 2—Arctic Climate: Past and Present. In Arctic Climate Impact Assessment; Cambridge University Press: New York, NY, USA, 2005. [Google Scholar]
- Pepin, N.; Bradley, R.S.; Diaz, H.F.; Baraer, M.; Caceres, E.B.; Forsythe, N.; Fowler, H.; Greenwood, G.; Hashmi, M.Z.; Liu, X.D.; et al. Elevation-dependent warming in mountain regions of the world. Nat. Clim. Chang. 2015, 5, 424–430. [Google Scholar] [CrossRef] [Green Version]
- Hinzman, L.D.; Deal, C.J.; McGuire, A.D.; Mernild, S.H.; Polyakov, I.V.; Walsh, J.E. Trajectory of the Arctic as an integrated system. Ecol. Appl. 2013, 23, 1837–1868. [Google Scholar] [CrossRef] [PubMed]
- Kurylyk, B.L.; MacQuarrie, K.T.B.; McKenzie, J.M. Climate change impacts on groundwater and soil temperatures in cold and temperate regions: Implications, mathematical theory, and emerging simulation tools. Earth Sci. Rev. 2014, 138, 313–334. [Google Scholar] [CrossRef]
- Walvoord, M.A.; Kurylyk, B.L. Hydrologic impacts of thawing permafrost—A review. Vadose Zone J. 2016, 15. [Google Scholar] [CrossRef]
- Niu, L.; Ye, B.; Li, J.; Sheng, Y. Effect of permafrost degradation on hydrological processes in typical basins with various permafrost coverage in Western China. Sci. China Earth Sci. 2011, 54, 615–624. [Google Scholar] [CrossRef]
- Woo, M.K.; Kane, D.L.; Carey, S.K.; Yang, D. Progress in permafrost hydrology in the new millennium. Permafr. Periglac. Process. 2008, 19, 237–254. [Google Scholar] [CrossRef]
- Ye, B.; Yang, D.; Zhang, Z.; Kane, D.L. Variation of hydrological regime with permafrost coverage over Lena Basin in Siberia. J. Geophys. Res. 2009, 114, 1291–1298. [Google Scholar] [CrossRef]
- Connon, R.F.; Quinton, W.L.; Craig, J.R.; Hayashi, M. Changing hydrologic connectivity due to permafrost thaw in the lower Liard River valley, NWT, Canada. Hydrol. Process. 2014, 28, 4163–4178. [Google Scholar] [CrossRef]
- Sjöberg, Y.; Frampton, A.; Lyon, S.W. Using streamflow characteristics to explore permafrost thawing in northern Swedish catchments. Hydrogeol. J. 2013, 21, 121–131. [Google Scholar] [CrossRef]
- St. Jacques, J.M.; Sauchyn, D.J. Increasing winter baseflow and mean annual streamflow from possible permafrost thawing in the Northwest Territories, Canada. Geophys. Res. Lett. 2009, 36, 329–342. [Google Scholar] [CrossRef]
- Walvoord, M.A.; Striegl, R.G. Increased groundwater to stream discharge from permafrost thawing in the Yukon River basin: Potential impacts on lateral export of carbon and nitrogen. Geophys. Res. Lett. 2007, 34, 123–134. [Google Scholar] [CrossRef]
- Rawlins, M.A.; Ye, H.; Yang, D.; Shiklomanov, A.; McDonald, K.C. Divergence in seasonal hydrology across northern Eurasia: Emerging trends and water cycle linkages. J. Geophys. Res. 2009, 114, 3151–3157. [Google Scholar] [CrossRef]
- Smith, L.C.; Pavelsky, T.M.; MacDonald, G.M.; Shiklomanov, A.I.; Lammers, R.B. Rising minimum daily flows in northern Eurasian rivers: A growing influence of groundwater in the high-latitude hydrologic cycle. J. Geophys. Res. Biogeosci. 2007, 112, 1029. [Google Scholar] [CrossRef]
- Rennermalm, A.K.; Wood, E.F.; Troy, T.J. Observed changes in pan-arctic cold-season minimum monthly river discharge. Clim. Dyn. 2010, 35, 923–939. [Google Scholar] [CrossRef]
- Bense, V.F.; Ferguson, G.; Kooi, H. Evolution of shallow groundwater flow systems in areas of degrading permafrost. Geophys. Res. Lett. 2009, 36, 297–304. [Google Scholar] [CrossRef]
- Ge, S.; McKenzie, J.; Voss, C.; Wu, Q. Exchange of groundwater and surface-water mediated by permafrost response to seasonal and long term air temperature variation. Geophys. Res. Lett. 2011, 38, 3138–3142. [Google Scholar] [CrossRef]
- Wellman, T.P.; Voss, C.I.; Walvoord, M.A. Impacts of climate, lake size, and supra- and sub-permafrost groundwater flow on lake-talik evolution, Yukon Flats, Alaska (USA). Hydrogeol. J. 2013, 21, 281–298. [Google Scholar] [CrossRef]
- Evans, S.G.; Ge, S.; Liang, S. Analysis of groundwater flow in mountainous, headwater catchments with permafrost. Water Resour. Res. 2015, 51, 9564–9576. [Google Scholar] [CrossRef]
- Woo, M.K. Permafrost hydrology in North America. Atmos. Ocean 1986, 24, 201–234. [Google Scholar] [CrossRef]
- Hinzman, L.D.; Bettez, N.D.; Bolton, W.R.; Chapin, F.S.; Dyurgerov, M.B.; Fastie, C.L.; Griffith, B.; Hollister, R.D.; Hope, A.; Huntington, H.P. Evidence and implications of recent climate change in Northern Alaska and other Arctic regions. Clim. Chang. 2005, 72, 251–298. [Google Scholar] [CrossRef]
- Michel, F.A.; Everdingen, R.O.V. Changes in hydrogeologic regimes in permafrost regions due to climatic change. Permafr. Periglac. Process. 1994, 5, 191–195. [Google Scholar] [CrossRef]
- White, D.; Hinzman, L.; Alessa, L.; Cassano, J.; Chambers, M.; Falkner, K.; Francis, J.; Gutowski, W.J.; Holland, M.; Holmes, R.M. The arctic freshwater system: Changes and impacts. J. Geophys. Res. Biogeosci. 2007, 112, 310–317. [Google Scholar] [CrossRef]
- Carey, S.K.; Woo, M.K. Slope runoff processes and flow generation in a subarctic, subalpine catchment. J. Hydrol. 2001, 253, 110–129. [Google Scholar] [CrossRef]
- Lemieux, J.M.; Sudicky, E.A.; Peltier, W.R.; Tarasov, L. Dynamics of groundwater recharge and seepage over the Canadian landscape during the Wisconsinian glaciation. J. Geophys. Res. Earth Surf. 2008, 113, 66–75. [Google Scholar] [CrossRef]
- Kane, D.L. The Impact of Hydrologic Perturbations on Arctic Ecosystems Induced by Climate Change; Springer: New York, NY, USA, 1997; pp. 63–81. [Google Scholar]
- Yamazaki, Y.; Kubota, J.; Ohata, T.; Vuglinsky, V.; Mizuyama, T. Seasonal changes in runoff characteristics on a permafrost watershed in the southern mountainous region of eastern Siberia. Hydrol. Process. 2006, 20, 453–467. [Google Scholar] [CrossRef]
- Yang, D.; Zhao, Y.; Armstrong, R.; Robinson, D.; Brodzik, M.J. Streamflow response to seasonal snow cover changes over large Siberian watersheds. J. Geophys. Res. Atmos. 2003, 108, 1–14. [Google Scholar] [CrossRef]
- Lyon, S.W.; Destouni, G. Changes in catchment-scale recession flow properties in response to permafrost thawing in the Yukon river basin. Int. J. Climatol. 2010, 30, 2138–2145. [Google Scholar] [CrossRef]
- Lyon, S.W.; Destouni, G.; Giesler, R.; Humborg, C.; Mörth, M.; Seibert, J.; Karlsson, J.; Troch, P.A. Estimation of permafrost thawing rates in a sub-arctic catchment using recession flow analysis. Hydrol. Earth Syst. Sci. 2009, 6, 595–604. [Google Scholar] [CrossRef] [Green Version]
- Spence, C.; Kokelj, S.A.; Kokelj, S.V.; Hedstrom, N. The process of winter streamflow generation in a subarctic Precambrian Shield catchment. Hydrol. Process. 2014, 28, 4179–4190. [Google Scholar] [CrossRef]
- Watson, V.; Kooi, H.; Bense, V. Potential controls on cold-season river flow behavior in subarctic river basins of Siberia. J. Hydrol. 2013, 489, 214–226. [Google Scholar] [CrossRef]
- Cheng, G.; Jin, H. Permafrost and groundwater on the Qinghai-Tibet Plateau and in northeast China. Hydrogeol. J. 2013, 21, 5–23. [Google Scholar] [CrossRef]
- Cheng, G.; Wu, T. Responses of permafrost to climate change and their environmental significance, Qinghai-Tibet Plateau. J. Geophys. Res. Earth Surf. 2007, 112, 93–104. [Google Scholar] [CrossRef]
- Hu, Y.; Maskey, S.; Uhlenbrook, S.; Zhao, H. Streamflow trends and climate linkages in the source region of the Yellow River, China. Hydrol. Process. 2011, 25, 3399–3411. [Google Scholar] [CrossRef]
- Wang, G.; Cheng, G. Eco-environmental changes and causative analysis in the source regions of the Yangtze and Yellow Rivers, China. Environmentalist 2000, 20, 221–232. [Google Scholar]
- Cheng, G. Problems on zonation of high-altitude permafrost. Acta Geogr. Sin. 1984, 39, 185–193. [Google Scholar]
- Wu, Q.; Li, X.; Li, W. Computer simulation and mapping of the regional distribution of permafrost along the Qinghai-Xizang Highway. J. Glaciol. Geocryol. 2000, 22, 323–326. [Google Scholar]
- Jin, H.; Li, S.; Cheng, G.; Wang, S.; Li, X. Permafrost and climatic change in China. Glob. Planet. Chang. 2000, 26, 387–404. [Google Scholar] [CrossRef]
- Cheng, W.; Zhao, S.; Zhou, C.; Chen, X. Simulation of the decadal permafrost distribution on the Qinghai-Tibet Plateau (China) over the past 50 years. Permafr. Periglac. Process. 2012, 23, 292–300. [Google Scholar]
- Tian, Q.; Prange, M.; Merkel, U. Precipitation and temperature changes in the major Chinese river basins during 1957–2013 and links to sea surface temperature. J. Hydrol. 2016, 536, 208–221. [Google Scholar] [CrossRef]
- Yang, J.; Ding, Y.; Liu, S.; Junfeng, L. Variations of snow cover in the source regions of the Yangtze and Yellow Rivers in China between 1960 and 1999. J. Glaciol. 2007, 53, 420–426. [Google Scholar]
- Yang, P.; Xia, J.; Zhang, Y.; Hong, S. Temporal and spatial variations of precipitation in Northwest China during 1960–2013. Atmos. Res. 2017, 183, 283–295. [Google Scholar] [CrossRef]
- Déry, S.J.; Wood, E.F. Decreasing river discharge in northern Canada. Geophys. Res. Lett. 2005, 32, L10401. [Google Scholar] [CrossRef]
- Tallaksen, L.M. A review of baseflow recession analysis. J. Hydrol. 1995, 165, 349–370. [Google Scholar] [CrossRef]
- Gao, T.; Zhang, T.; Cao, L.; Kang, S.; Sillanpää, M. Reduced winter runoff in a mountainous permafrost region in the northern Tibetan Plateau. Cold Reg. Sci. Technol. 2016, 126, 36–43. [Google Scholar] [CrossRef]
- Li, L.; Zhu, X.; Qin, N.; Wang, Z.; Wang, Q.; Zhou, L. Study on temperature variations and its anomaly patterns over Qinghai-Xizang Plateau. Plateau Meteorol. 2003, 22, 524–530. [Google Scholar]
- Song, C.; Pei, T.; Zhou, C. Research progresses of surface temperature characteristic change over Tibetan Plateau since 1960. Prog. Geogr. 2012, 31, 1503–1509. [Google Scholar]
- Liang, S.; Xu, D.; Wan, L.; Chen, J.; Zhang, J. Periodic regularity of the base flow in the headwater region of the Yellow river and affecting factors. Earth Sci. Front. 2008, 15, 281–289. [Google Scholar]
- Streletskiy, D.A.; Tananaev, N.I.; Opel, T.; Shiklomanov, N.I.; Nyland, K.E.; Streletskaya, I.D.; Tokarev, I.; Shiklomanov, A.I. Permafrost hydrology in changing climatic conditions: Seasonal variability of stable isotope composition in rivers in discontinuous permafrost. Environ. Res. Lett. 2015, 10, 095003. [Google Scholar] [CrossRef]
Figure 1.
Location of the Qinghai-Tibetan Plateau (QTP) and 10 catchments analyzed in this study. Codes are listed in Table 1. Discharge stations are listed with increased permafrost coverage. Included are the 11 meteorological stations with station codes from the China Meteorological Administration (Table 2).

Figure 2.
Relation between the hydrological variables and coverage of permafrost for 10 catchments (1–10). Codes are listed in Table 1. The red dot indicated the outlier catchment (code 9). (a–c) indicated the relationship between winter discharge ratio and permafrost coverage, recession coefficient and permafrost coverage, the ratio of Qmax/Qmin and permafrost coverage, respectively. (d) is (c) but without code 9 and Y-axis normalized.

Figure 3.
Correlation between summer precipitation (July–September) and the following winter discharge (December–February) for the period before 1985 (blue) and after 1985 (red). The catchments with short discharge records were not analyzed, such as catchment 1, 2, 4 and 8. Catchment 10 was not considered due to complete cessation of winter discharge from 1986 to 2013. The correlation coefficients were calculated by linear least square regression. See Table 1 for station/catchment information.

Figure 4.
Change rate of summer precipitation (July–September) for all 11 meteorological stations within the source regions. Change rate was estimated by dividing the difference between the mean summer precipitation (mm) for two periods (before 1985 and after 1985) by the mean summer precipitation (mm) before 1985 for each station. See Table 2 for meteorological stations information.


Table 1.
General information about the discharge stations/catchments.
| River Name | Discharge Station | Code a | Lon. (°E) | Lat. (°N) | Ele. (m) | Area (km2) | Coverage of Permafrost (%) b | Mean Discharge (m3/s) | Available (Missing) Years | |
|---|---|---|---|---|---|---|---|---|---|---|
| Winter | Annual | |||||||||
| Bai River | Tangke | 1 | 102.47 | 33.42 | 3399 | 5374 | 0.1 | 16.9 | 61.2 | 1981–2014 (1985) |
| Shakequ | Jiuzhi | 2 | 101.50 | 33.43 | 3711 | 1248 | 0.2 | 5.1 | 17.4 | 1988–2014 |
| Yellow River | Tangnag | 3 | 100.15 | 35.50 | 2632 | 121,972 | 43.0 | 188.2 | 636.4 | 1956–2014 |
| Yellow River | Jungong | 4 | 100.65 | 34.70 | 4176 | 98,414 | 43.3 | 165.8 | 536.6 | 1980–2014 |
| Yellow River | Maqu | 5 | 102.08 | 33.97 | 3383 | 86,048 | 49.3 | 119.9 | 451.1 | 1956–2014 |
| Tongtian River | Zhimenda | 6 | 97.22 | 33.03 | 3536 | 137,740 | 75.4 | 71.7 | 411.4 | 1957–2014 |
| Yellow River | Jimai | 7 | 99.65 | 33.77 | 3925 | 45,019 | 84.2 | 34.5 | 128.6 | 1956–2014 |
| Requ | Huanghe | 8 | 98.27 | 34.60 | 4220 | 6446 | 89.4 | 1.3 | 19.1 | 1991–2014 |
| Yellow River | Huangheyan | 9 | 98.17 | 34.88 | 4176 | 20,930 | 99.8 | 13.9 | 22.2 | 1976–2014 |
| Tuotuohe | Tuotuohe | 10 | 92.45 | 34.22 | 4533 | 15,924 | 100.0 | 0.3 | 29.3 | 1959–2014 (2010, 2012) |
Note: a Discharge stations/catchments (1–10) are listed according to the increased permafrost coverage and codes are the station numbers in Figure 1; b Coverage of permafrost was computed using the altitude model [37]. Because the field survey data for building the altitude model were mainly collected in the 1970s, permafrost distribution mainly represents the permafrost distribution status of that decade.
Table 2.
General information about the meteorological stations.
| Code a | Lat. (°N) | Lon. (°E) | Ele. (m) | Mean Precipitation (mm) | Available Years | Representative Catchment | |
|---|---|---|---|---|---|---|---|
| Annual | Summer b | ||||||
| 52908 | 35.22 | 93.08 | 4612 | 290.8 | 192.2 | 1956–2015 | 6 |
| 56004 | 34.22 | 92.43 | 4533 | 291.0 | 122.4 | 1956–2015 | 6,10 |
| 56021 | 34.12 | 95.80 | 4175 | 411.7 | 27.0 | 1956–2015 | 6 |
| 56033 | 34.92 | 98.22 | 4272 | 321.6 | 183.0 | 1953–2015 | 3,4,5,7,8,9 |
| 56043 | 34.48 | 100.23 | 3719 | 512.5 | 291.7 | 1959–2015 | 3 |
| 56046 | 33.75 | 99.65 | 3968 | 552.1 | 293.7 | 1956–2015 | 3,4,5,7 |
| 56065 | 34.73 | 101.60 | 3500 | 580.1 | 319.0 | 1959–2015 | 3,4 |
| 56067 | 33.43 | 101.48 | 3629 | 746.9 | 196.4 | 1958–2015 | 2,3,4,5 |
| 56074 | 34.00 | 102.08 | 3471 | 600.9 | 326.5 | 1967–2015 | 3,4,5 |
| 56079 | 33.58 | 102.97 | 3441 | 649.3 | 339.5 | 1957–2015 | 1,3,4,5 |
| 56173 | 32.80 | 102.55 | 3492 | 750.0 | 351.1 | 1960–2015 | 1,3,4,5 |
Note: a Codes for meteorological stations are derived from the China Meteorological Administration; b Summer precipitation is the total precipitation over the warm months of July–September in this study.
Table 3.
Winter discharge, winter discharge ratio, recession coefficient, Qmax/Qmin and trend analysis results for each discharge station.
Table 3.
Winter discharge, winter discharge ratio, recession coefficient, Qmax/Qmin and trend analysis results for each discharge station.
| Code | Winter Discharge | Winter Discharge Ratio | Recession Coefficient | Qmax/Qmin | ||||
|---|---|---|---|---|---|---|---|---|
| Mean (m3/s) | β | Mean (%) | β | Mean | β | Mean | β | |
| 1 | 16.9 | 2.00 | 27.59 | 0.03 | 0.32 | −0.06 | 18.12 | −2.96 |
| 2 | 5.1 | −1.10 | 29.04 | −0.05 | 0.29 | 0.02 | 12.15 | 3.59 |
| 3 | 188.2 | 0.90 | 30.15 | 0.01 | 0.34 | −0.01 | 9.43 | −0.20 |
| 4 | 165.8 | 0.00 | 31.96 | 0.02 | 0.31 | −0.03 | 9.10 | −1.13 |
| 5 | 119.9 | −2.38 | 27.16 | 0.00 | 0.38 | 0.01 | 10.86 | 0.40 |
| 6 | 71.7 | 1.09 | 18.23 | 0.00 | 0.32 | 0.01 | 19.35 | 0.49 |
| 7 | 34.5 | 1.56 | 26.57 | 0.01 | 0.34 | −0.02 | 12.54 | −0.36 |
| 8 | 1.3 | 0.30 | 7.95 | 0.00 | 0.48 | −0.02 | 98.21 | −12.59 |
| 9 | 13.9 | 0.21 | 55.68 | 0.01 | 0.27 | −0.03 | 76.72 | −0.42 |
| 10 | 0.3 | −0.15 | 1.38 | −0.01 | 1.05 | 0.09 | 1086.79 | 12.40 |
Note: β indicated the change rate per decade, which was derived from the Mann-Kendall test. Italicized, bolded, and underlined values indicate statistical significance of p ≤ 0.1, p ≤ 0.05, and p ≤ 0.01, respectively. See Table 1 for station/catchment information.
© 2017 by the authors. Licensee MDPI, Basel, Switzerland. This article is an open access article distributed under the terms and conditions of the Creative Commons Attribution (CC BY) license (http://creativecommons.org/licenses/by/4.0/).
Share and Cite
MDPI and ACS Style
Wang, X.; Chen, R.; Yang, Y. Effects of Permafrost Degradation on the Hydrological Regime in the Source Regions of the Yangtze and Yellow Rivers, China. Water 2017, 9, 897. https://doi.org/10.3390/w9110897
AMA Style
Wang X, Chen R, Yang Y. Effects of Permafrost Degradation on the Hydrological Regime in the Source Regions of the Yangtze and Yellow Rivers, China. Water. 2017; 9(11):897. https://doi.org/10.3390/w9110897
Chicago/Turabian StyleWang, Xiqiang, Rensheng Chen, and Yong Yang. 2017. "Effects of Permafrost Degradation on the Hydrological Regime in the Source Regions of the Yangtze and Yellow Rivers, China" Water 9, no. 11: 897. https://doi.org/10.3390/w9110897
Note that from the first issue of 2016, this journal uses article numbers instead of page numbers. See further details here.