Drought Evolution Due to Climate Change and Links to Precipitation Intensity in the Haihe River Basin


1
State Key Laboratory of Simulation and Regulation of Water Cycle in River Basin, China Institute of Water Resources and Hydropower Research, Beijing 100038, China
2
School of Water Conservancy and Hydroelectric Power, Hebei University of Engineering, Handan 056021, China
3
School of Earth Science and Engineering, Hebei University of Engineering, Handan 056021, China
*
Author to whom correspondence should be addressed.
Water 2017, 9(11), 878; https://doi.org/10.3390/w9110878
Submission received: 22 August 2017
/
Revised: 30 October 2017
/
Accepted: 8 November 2017
/
Published: 11 November 2017
Abstract
:Droughts often have a substantial impact on normal socio-economic activities and agricultural production. The Haihe River Basin, one of the primary food production areas in China, has become increasingly sensitive to alternating droughts and floods, and the sharp transitions between them, due to rapid economic development and population growth combined with climate change. In this study, we employ the self-organizing map (SOM) neural network method to perform a cluster analysis on 43 meteorological stations in the study area, dividing the basin into five sub-regions. Then daily precipitation data (1960–2015) are collected, and the number of continuous dry days is used as a drought index to investigate drought evolution trends. Lastly, the Pearson-III curve is used to analyze the first daily precipitation after different drought duration, and the relationships between precipitation intensity, drought duration, and interdecadal drought frequency are observed. The results demonstrate that under the climate warming of the Haihe River Basin, the frequency of droughts increases throughout the whole basin, while the droughts are of shorter duration, the probability of more intense first daily precipitation after droughts increases during the dry–wet transition. The research provides a useful reference for the planning and management of water resources in the Haihe River Basin.
1. Introduction
Global warming has led to a more rapid but less stable water cycle, resulting in more frequent droughts and floods [1,2]. Since the 1990s, the area affected by droughts and floods in China has increased considerably to 1.4 times the average [3]. Therefore, understanding the drought/flood variation patterns under different environmental conditions is critical for ensuring the rational distribution of industrial structures, optimal water resource allocation, and developing disaster prevention and mitigation strategies. Precipitation is a key factor causing droughts and floods, and variations in the amount and intensity determine drought and flood intensity and coverage. Research into changes in the precipitation intensity after drought, and whether longer droughts lead to more concentrated, heavier precipitation, is important for understanding drought- and flood-driving mechanisms and their evolutionary trends. This, in turn, can help guide disaster prevention and mitigation strategies.
Numerous studies have analyzed drought variation patterns due to climate change around the world. Analyses predominantly involve the drought evaluation index method, which uses one or more drought indexes based on long-term meteorological observations to demonstrate drought evolution laws [4,5,6,7,8,9,10,11,12,13,14]; the simulation method, which combines drought evaluation indexes with climate models [15,16] and hydrologic models [17,18] to simulate drought variability; and remote sensing methods, which use remote sensing data to assess spatiotemporal variations [19,20,21]. As precipitation extremes give rise to flooding and droughts, the impact of climate change is receiving considerable attention, and many studies show that extreme precipitation events will become more common in a warmer climate [22,23,24,25,26]. However, previous research has mainly focused on the temporal and spatial distribution of droughts and precipitation, and there are few studies on precipitation intensity variability after a drought.
The Haihe River Basin is a primary food production area in China and is highly prone to droughts. To ensure stable and high regional food production and minimize the impacts of droughts on wheat yield, a large amount of groundwater is exploited for agricultural irrigation in the basin, resulting in groundwater overexploitation and a continuous decline in the groundwater level. The shallow groundwater level dropped by an average of 10.99 m from 1959–2013, with an overexploitation volume of 97.945 billion m3 [27]. Owing to diminishing groundwater resources and increasing exploitation difficulties, the drought resistance of the Haihe River Basin has been steadily decreasing. Many researchers have investigated the drought and flood hazards of this region, and their variation characteristics due to climate change. Wang et al. [28], Bao et al. [29], and Zong et al. [30] analyzed precipitation processes in the region and observed an annual precipitation decrease and progressively more intense droughts. Wang et al. [31] discovered an overall temperature rise in the region from 1961–2010 based on meteorological data from 30 stations. The authors also noted an increase in short-lived heavy rainfall and a general warming and drying trend. Yan et al. [32] studied drought classes and areas for different sub-regions and periods using the accumulated relative moisture index and FSPAAM (fuzzy and set pair analysis evaluation method). They observed a considerable increase in the area affected by severe drought. Ying [33] and Li et al. [34] analyzed drought temporal and spatial patterns in the entire basin and mountainous areas, respectively, using the relative humidity index. They found that the basin was generally dry, while drought-affected mountainous areas decreased during certain seasons. Yan et al. [35] used the reduction in food yield as an agricultural drought index, and revealed increased agricultural drought intensity in the basin by employing the Mann–Kendall trend test. Overall, current research typically concentrates on precipitation evolution trends, drought evaluation methods, and temporal and spatial drought evolution trends in the Haihe River Basin. No studies have integrated precipitation and drought by investigating the relationship between drought duration and precipitation intensity under sudden dry–wet changes.
In this study, we divide the Haihe River basin study area into five sub-regions using SOM clustering analysis on 43 meteorological stations in and around the basin. Then, the drought spatio-temporal evolution characteristics of the basin are analyzed using the number of continuous days without effective precipitation as the drought index. The relationships between the intensity of the first daily precipitation following a drought period and drought duration, as well as the drought frequency of different years, are observed. Finally, changes in drought frequency, drought duration, and precipitation intensity under a warmer climate are qualitatively analyzed.
2. Study Area
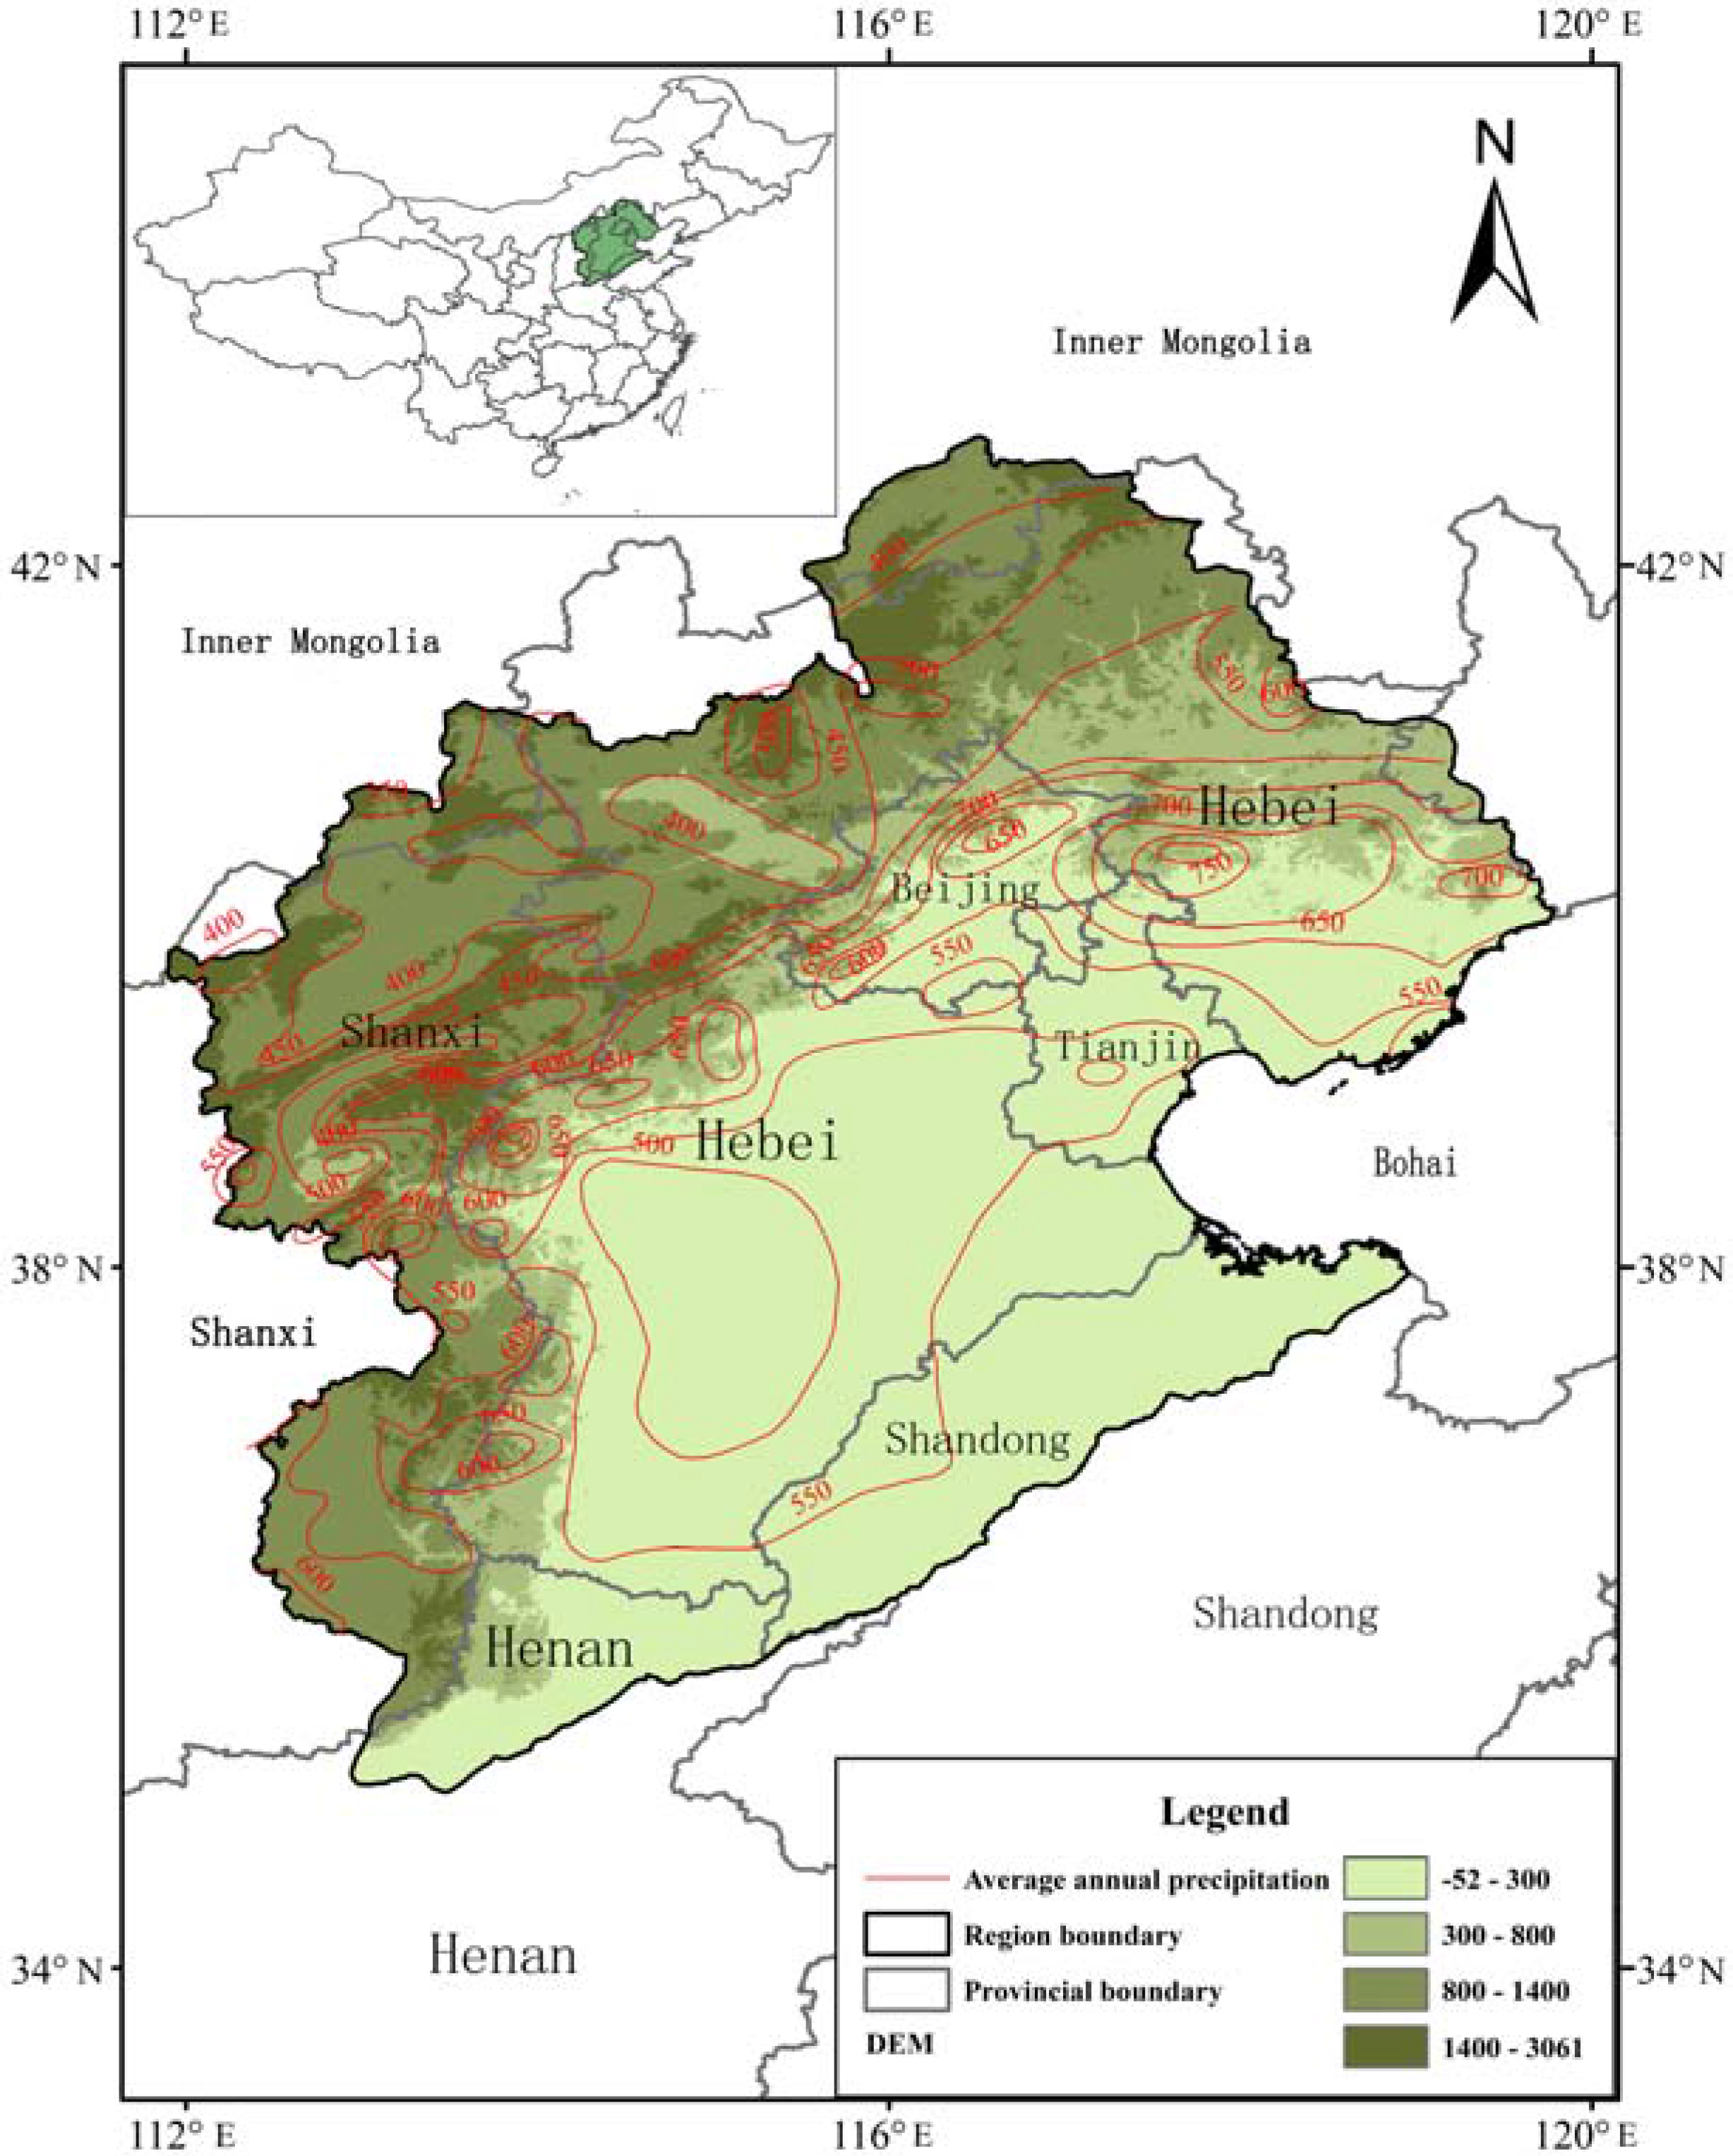
The Haihe River Basin is in north China (longitude 112–120°, latitude 35–43°), enclosed by the Shanxi Plateau and the Yellow River Basin to the west, the Mongolian Plateau and inland river basins to the north, the Yellow River to the south, and the Bohai Sea to the east. The total area is 317.8 × 10³ km2, and it covers eight provinces (direct-controlled municipalities, autonomous regions): Beijing, Tianjin, Hebei, Henan, Shanxi, Shandong, Liaoning, and Inner Mongolia. Its topography mainly consists of plateaus, mountains, and plains, and is generally high in the northwest and low in the southeast. The northern and western parts of the basin are plateaus and mountains, and belong to the second step of the China terraced terrain. The main mountain ranges are the Yanshan and Taihang Mountains, whose average elevation is 1000–2000 m, with a total area of 189.4 × 10³ km2, accounting for 60% of the entire basin. The eastern and southern parts are plains located on the third step of the terraced terrain, with a typical elevation below 500 m. Some parts of the North China Plain lie below 200 m, with a total area of 128.4 × 10³ km2, accounting for approximately 40% of the entire basin. The geographic location and topographic distribution of the Haihe River Basin are shown in Figure 1.
The Haihe River Basin has a temperate East Asian monsoon climate that is semi-humid and semi-arid. In spring, under the influence of continental air masses from Mongolia, it is susceptible to droughts. In summer, affected by maritime air masses, it is rainy and hot, and heavy rains are common; thus, droughts and floods are common. Precipitation decreases in autumn and it is cold in winter. The air temperature in the basin gradually increases southwards, with an annual average of approximately 1.5–14 °C. The minimum and maximum temperatures of −35 °C and 40 °C or higher occur in January and July, respectively. The Haihe River Basin receives the lowest precipitation of other coastal areas in China. In addition, precipitation in the region shows significant seasonal and decadal variability, as well as continuous wet/dry variation patterns. Approximately 75%–85% of the annual precipitation is concentrated in the wet season in summer, and there is little precipitation in winter and spring. The average annual precipitation is 539 mm and the average annual relative humidity is approximately 50%–70%. The average annual evapotranspiration from the basin is 470 mm and the pan evaporation is 1100 mm.
Precipitation is a key driving factor of droughts in the Haihe River Basin. Precipitation variability significantly affects drought frequency in the region [36,37]. There has been a notable decrease in the average annual precipitation anomalies between 1956 and 2013, with an average decrease per decade of 2.6% [38]. Moreover, due to periodic changes in atmospheric circulation, precipitation in the basin has shown an alternating pattern of wet/dry years and clear annual changes. Although the current precipitation fluctuations are smaller than those in the 1950s, the rate of precipitation decrease is growing, and has been particularly significant since 1980 [39]. For the period 1956–2013, the regions of the Haihe River Basin with the most significant decline in annual precipitation were the central and northern plains, northern mountains, and southern plains, at a rate of −2% to −5% per decade. The northwestern mountains and eastern coastal areas have experienced a smaller reduction in annual precipitation, with a typical rate below −3% per decade [37].
3. Materials and Methods
3.1. Data Sources
Daily meteorological data (1951–2015) from 754 weather stations were provided by the National Meteorological Information Center, China Meteorological Administration. From this, continuous daily precipitation data (1960–2015) from 43 stations and continuous temperature data (1960–2015) from 46 stations in and around the Haihe River Basin were selected for this study. The data also include station latitude, longitude, and elevation.
3.2. SOM Cluster Analysis and Subregion Division
Due to the differences in geographic location, elevation, and precipitation characteristics of the meteorological stations in the Haihe River Basin, it was necessary to perform a cluster analysis and divide the basin into sub-regions based on these characteristics. Four indices—geodetic coordinates (X, Y values), elevation, and average precipitation—of each meteorological station were selected as clustering factors. The SOM (self-organizing map) neural network method [40] was applied for the cluster analysis. SOM is a self-organizing and self-learning network, which can achieve topology and probability preservation due to unsupervised learning. It can perform self-organized training, evaluate input modes, and eventually divide input modes into different types [41].
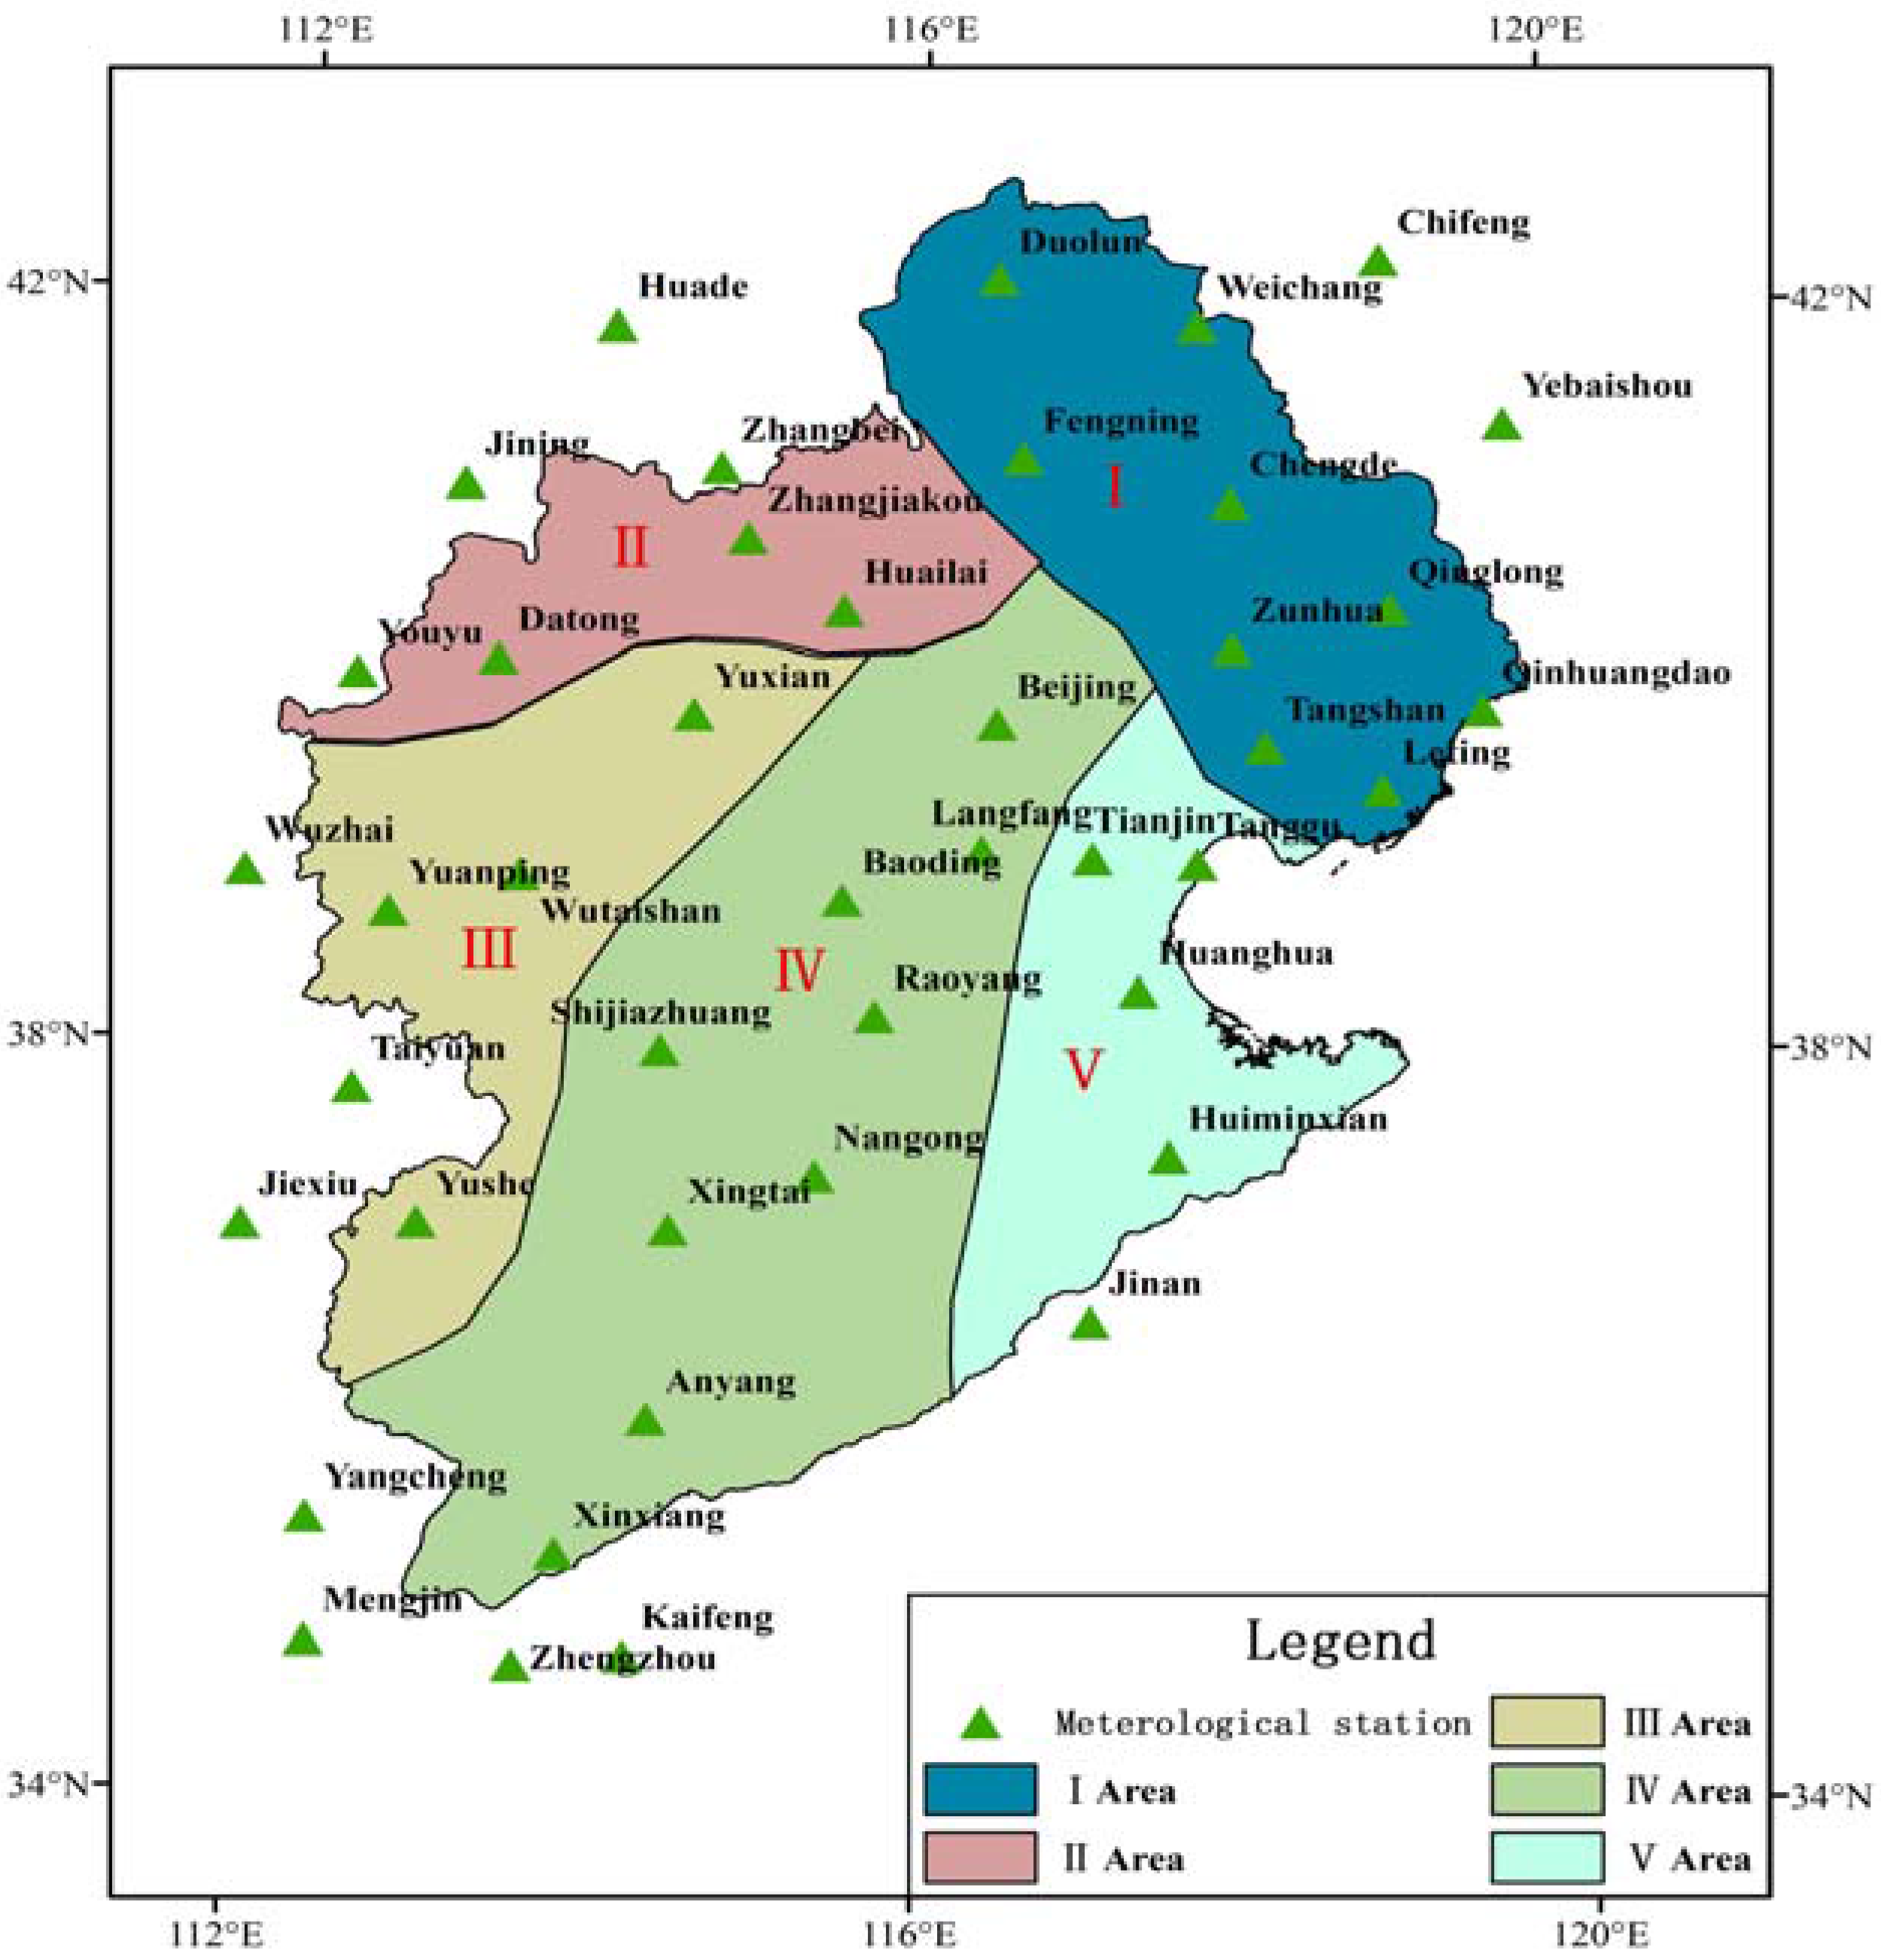
The MATLAB program provides learning and training for the designed network, which can divide the Haihe River Basin into different sub-regions based on the selected meteorological stations. The clustering results are shown in Figure 2, from which the basin is divided into five sub-regions (Figure 3). There was only one of each station type 3, 4, and 7; therefore, the 3, 4, 7, and 5 type stations were combined to form one sub-region considering the regional terrain conditions. Details of each sub-region are listed in Table 1.
3.3. Drought Magnitude Evaluation Standards
There are several drought indices used to assess drought magnitude. These mainly include the Standard Precipitation Index (SPI), the Palmer Drought Severity Index (PDSI), Foley’s Anomaly Index (FAI), the Soil Moisture Anomaly Index (SMAI), the Palmer Hydrological Drought Index (PHDI), and the Accumulative Relative Moisture Density (ARMD) [32,42]. By considering the ease of data collection and computation, as well as the applicability of the evaluation indices, we selected the number of continuous days without effective precipitation as the drought index for characterizing drought magnitude. The standards for drought magnitude classification are listed in Table 2 [43]. In spring (3–5) and autumn (9–11), a daily precipitation below 3 mm was considered ineffective; thus, those days were classed as dry days. In summer (6–8), a daily precipitation below 5 mm was considered ineffective. If consecutive dry days extend across two, three, or even four seasons, it can be taken as one drought, and the drought season is determined as the season with the most dry days.
3.4. Precipitation Intensity and Frequency Analysis
The volume of the first daily precipitation after a drought represents precipitation intensity, which was used to analyze temporal and spatial variation patterns in precipitation intensity after a drought period. The classification of precipitation intensity is described in Table 3 [44].
In China, extensive previous research into numerous fitting and analysis methods using hydrological data from river basins across the country has concluded that the Pearson-III distribution curve [45] (P-III curve) has a better fit with precipitation and flood data, and more accurately reflects the frequency distribution patterns of hydrological data [46]. Therefore, we use the asymmetric single peak P-III distribution curve to analyze the frequency of first daily precipitation after a drought period. The probability density function of the P-III curve is shown below:
where represents the gamma distribution of parameters and with the starting point , > 0 and > 0.
4. Results
4.1. Temperature Change in the Haihe River Basin
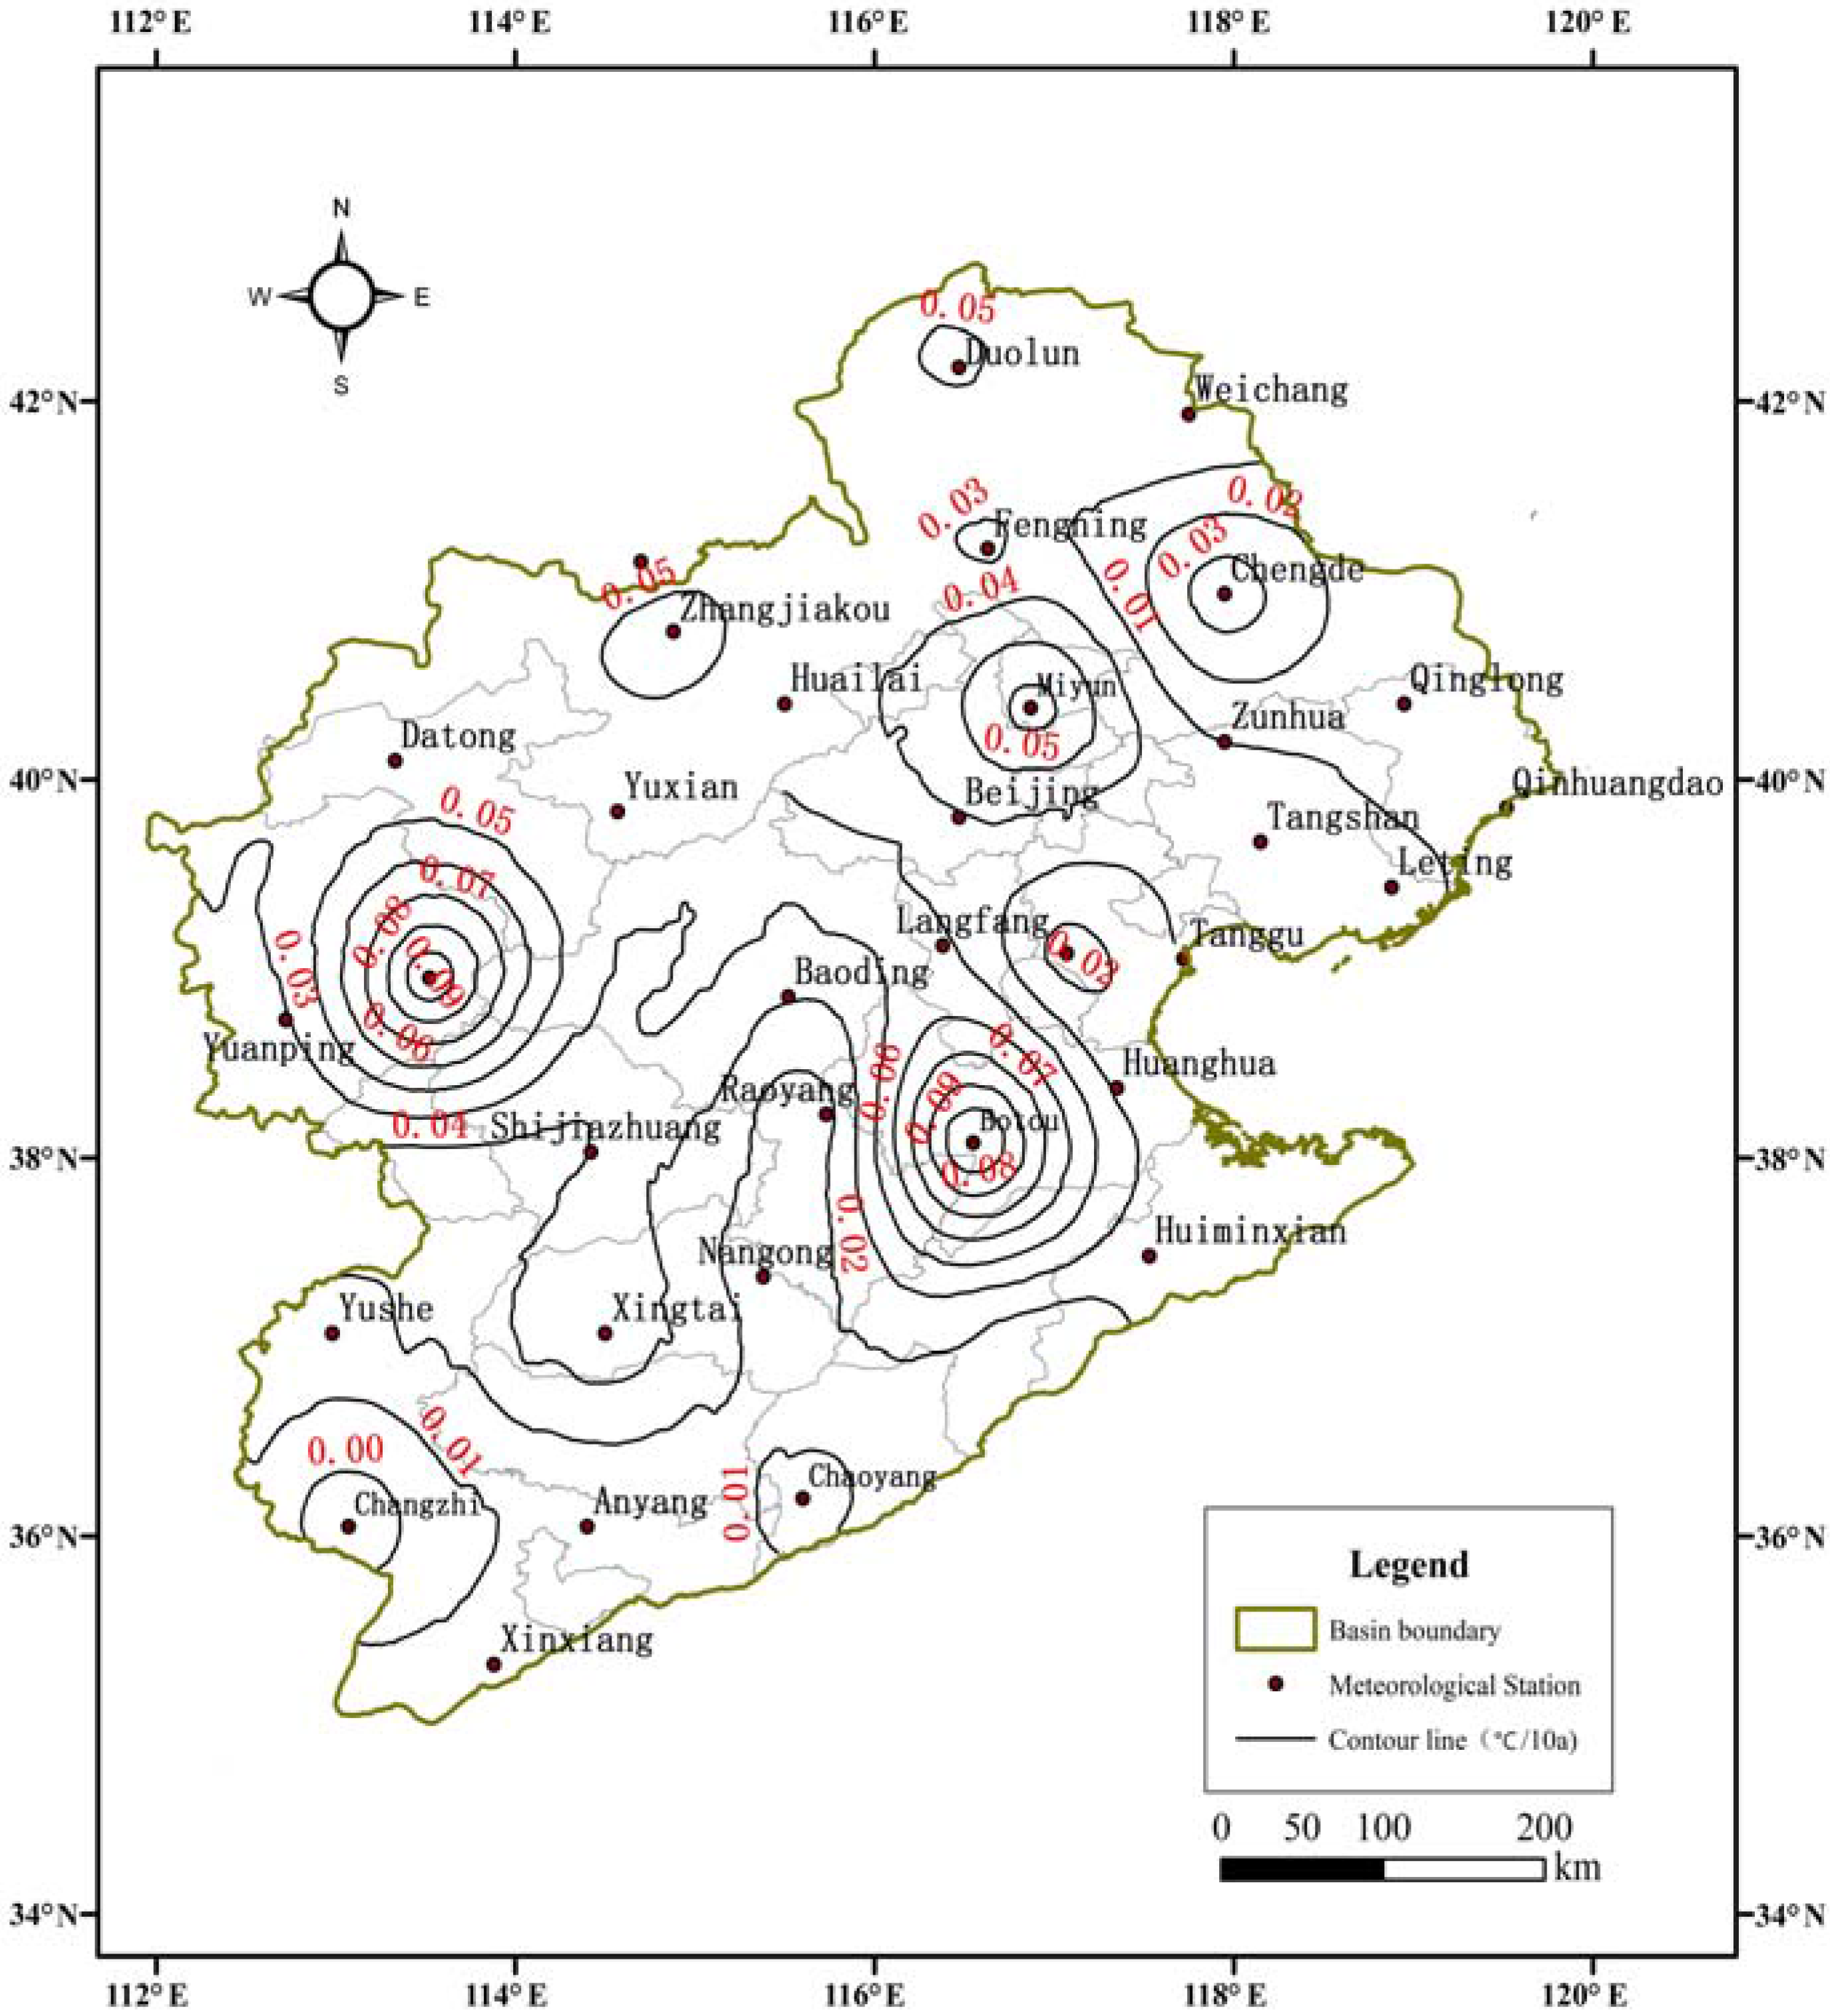
The trend of annual average temperature from every meteorological station and sub-region in the Haihe River Basin was calculated using the continuous temperature data (1960–2015); the results are shown in Figure 4 and Figure 5. It can be seen that the annual average temperature of the Haihe River Basin is increasing, except for Changzhi station in the south, which shows a declining trend, and the upward trend is significant at most sites. The most rapid temperature rise is in the Botou and Wutaishan meteorological stations, where the average temperature increased by 0.09 °C/10 a, followed by Miyun, where the temperature rise is up to 0.06 °C/10 a (Figure 4). Moreover, the variation in temperature change between the different sub-regions is also obvious. The annual average rates of temperature increase in each sub-region is 0.318 °C/10 a (I), 0.230 °C/10 a (II), 0.471 °C/10 a (III), 0.225 °C/10 a (IV) and 0.267 °C/10 a (V) (Figure 5). The spatial variability of temperature change is significant.
4.2. Intraannual Variations of Drought Frequency and Duration
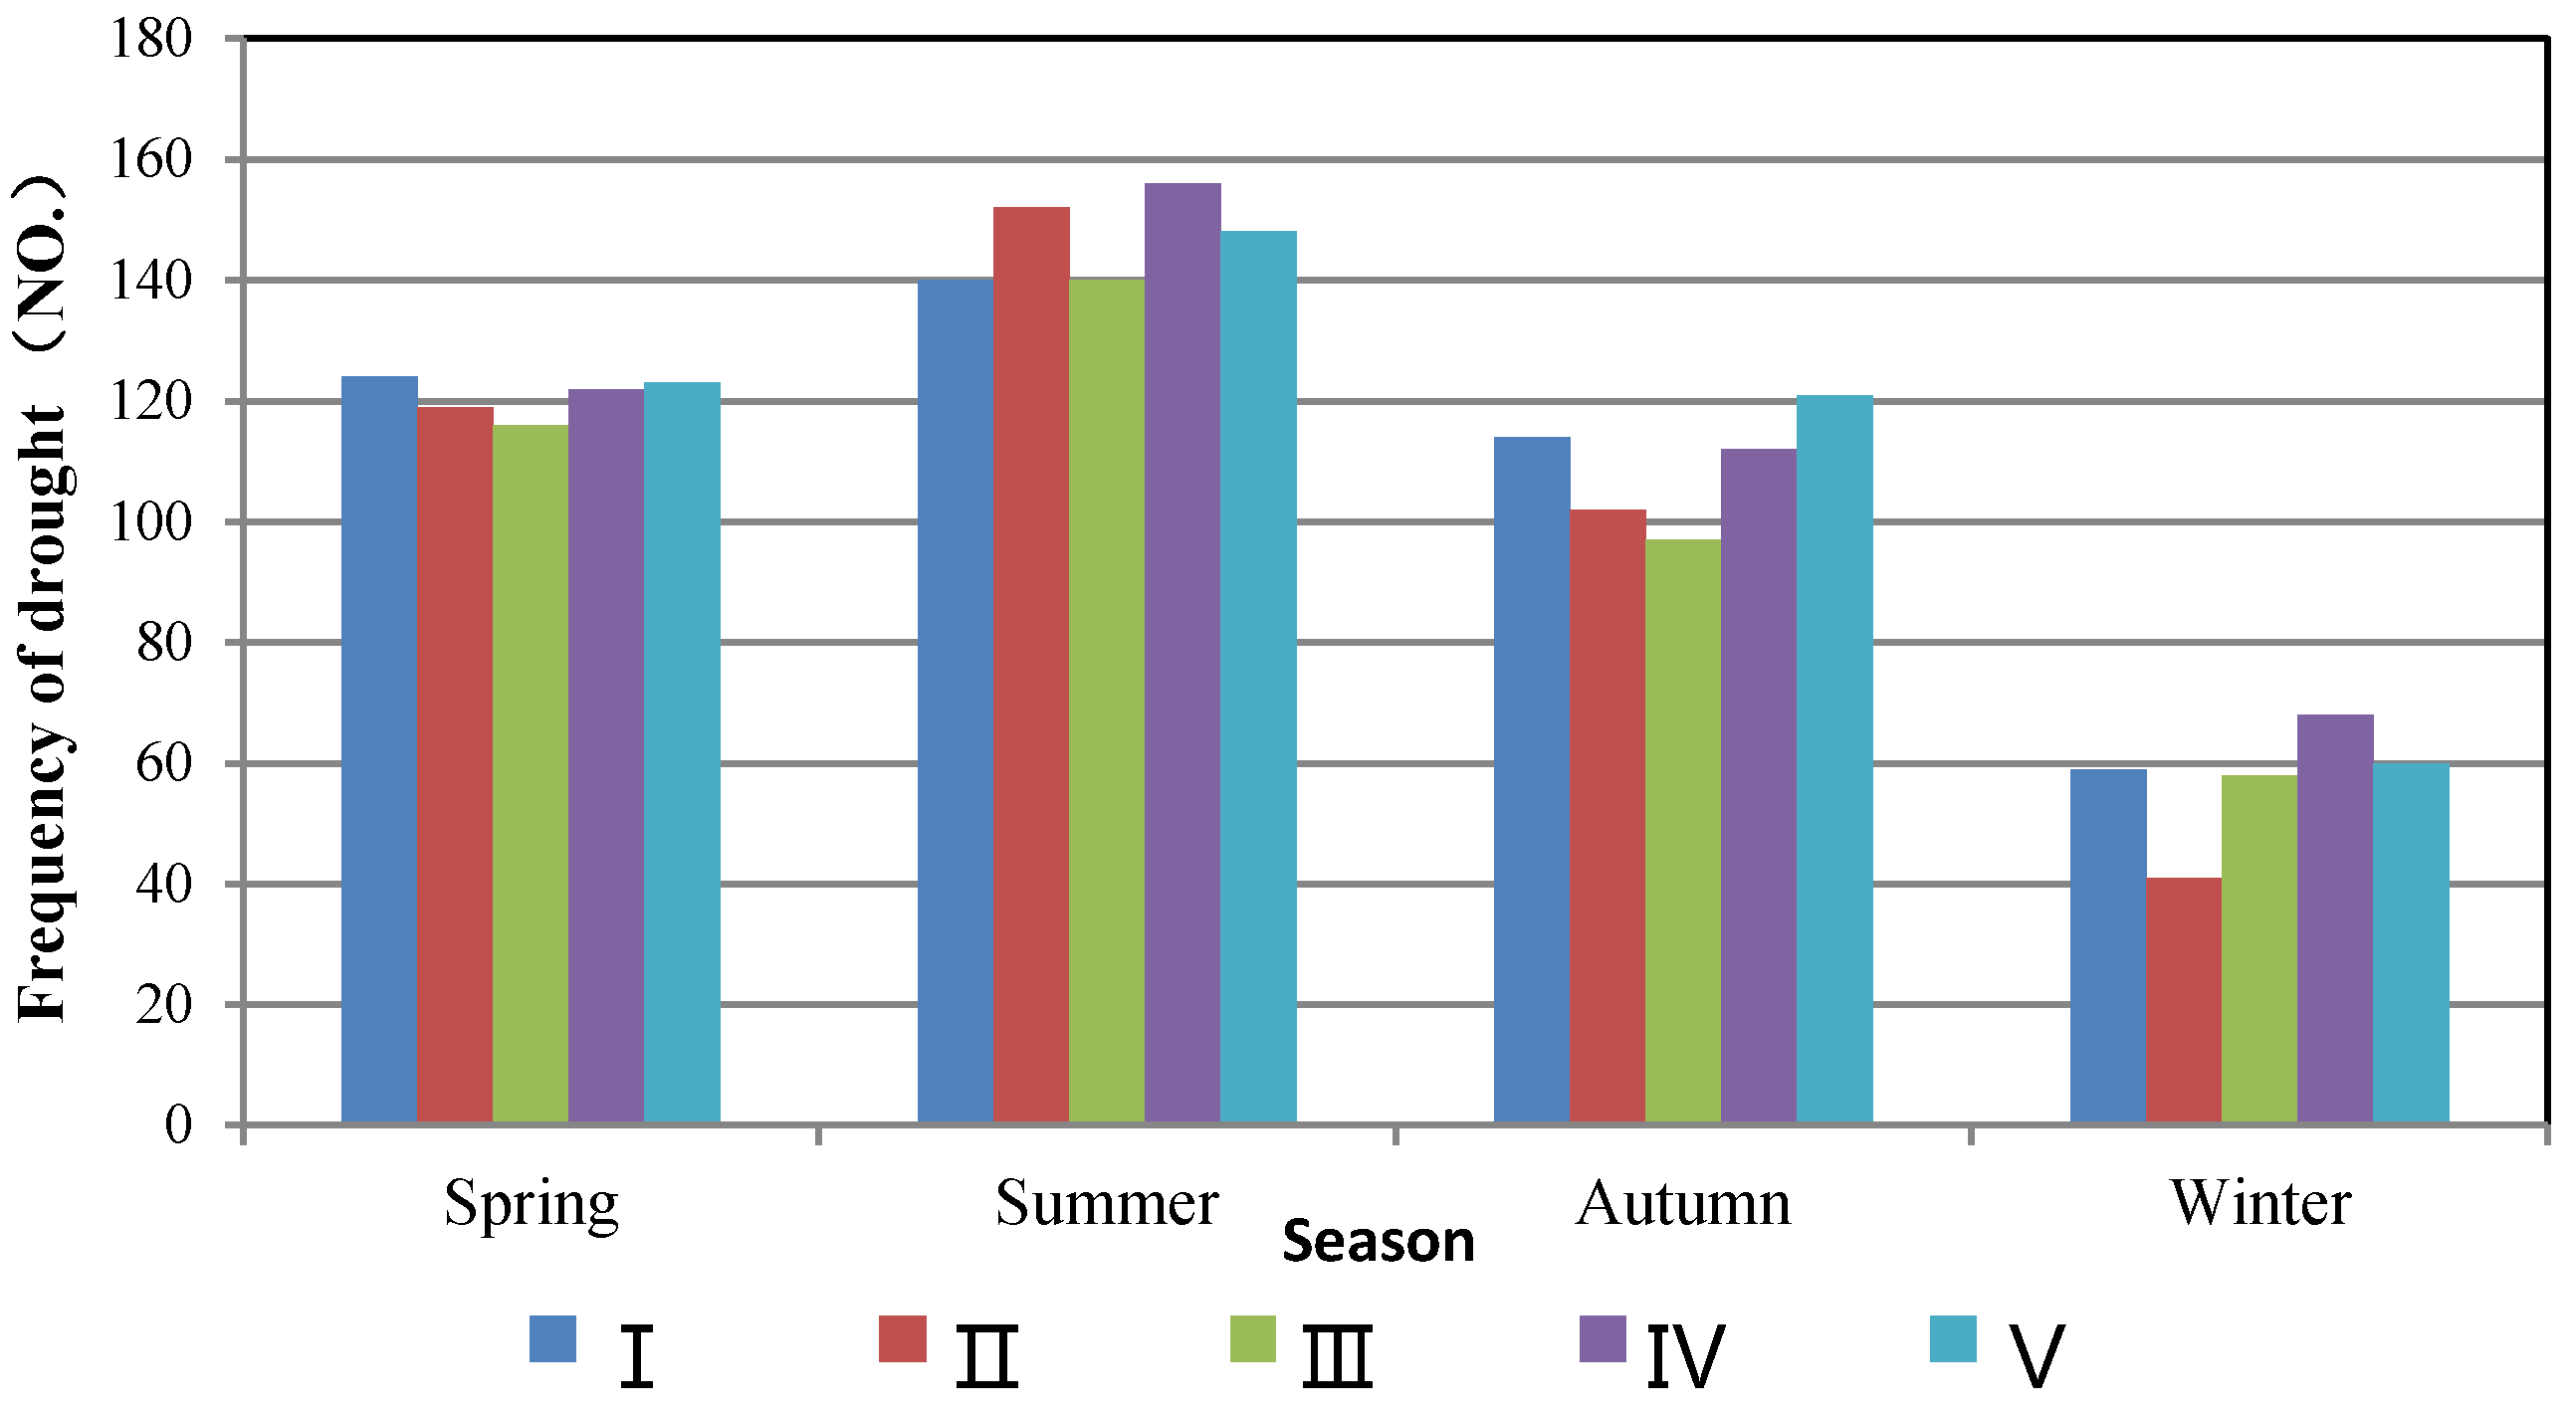
The number of consecutive days without effective precipitation drought index was used to analyze the intraannual variations of drought duration for each sub-region, as shown in Figure 6 and Figure 7. Intraannual variations in drought frequency are significant in each sub-region. Between spring and winter, the drought frequency first increases then decreases. Moreover, droughts are more common in summer. From spring to summer, the drought frequency increases by 27.9%, 27.7%, 20.7%, 20.3%, and 12.9% in region IV, II, III, V, and I, respectively. Then it decreases by 73.0%, 59.4%, 58.6%, 57.8%, and 56.4% in region II, V, III, I, and IV from summer to winter. Droughts are slightly more frequent in regions IV and V, which experienced 458 and 452 droughts, respectively, from 1960–2015, whereas regions I, II, and III experienced 437, 414, and 411 droughts, respectively. Within the same seasons, the drought frequency in different sub-regions showed no significant fluctuations.
Light droughts are more common in summer than in other seasons throughout the basin (Figure 7a). The number of light droughts is similar for spring and autumn; however, in winter, light droughts are rare. In all sub-regions, light droughts become more frequent from spring to summer; the frequency increases by 89%, 70.4%, 54.5%, 52.7%, and 49.8% in region II, V, IV, I, and III, respectively. From summer to winter, the light drought frequency decreases by 80.6, 76.6%, 75.8%, 72.9, and 70.1% in region II, III, IV, and I, respectively.
Figure 7b shows the frequency of moderate droughts in different seasons for each sub-region. Moderate droughts are more common in spring and autumn than in winter and summer in the Haihe River Basin. From spring to summer, the frequency of moderate droughts decreases by 43.1%, 35.8%, 34.4%, 31.6%, and 13.9% in region I, V, II, III, and IV, respectively. From summer to autumn, moderate droughts become more common; increasing by 62.4%, 55.7%, 19.9%, and 13.5% in region I, V, II, and IV, respectively. Region III shows a relatively small increase. A decreasing trend is observed from autumn to winter, and moderate drought frequency decreases by 49.7%, 27.9%, 26.9%, and 0.77% in region II, V, I, and IV, respectively.
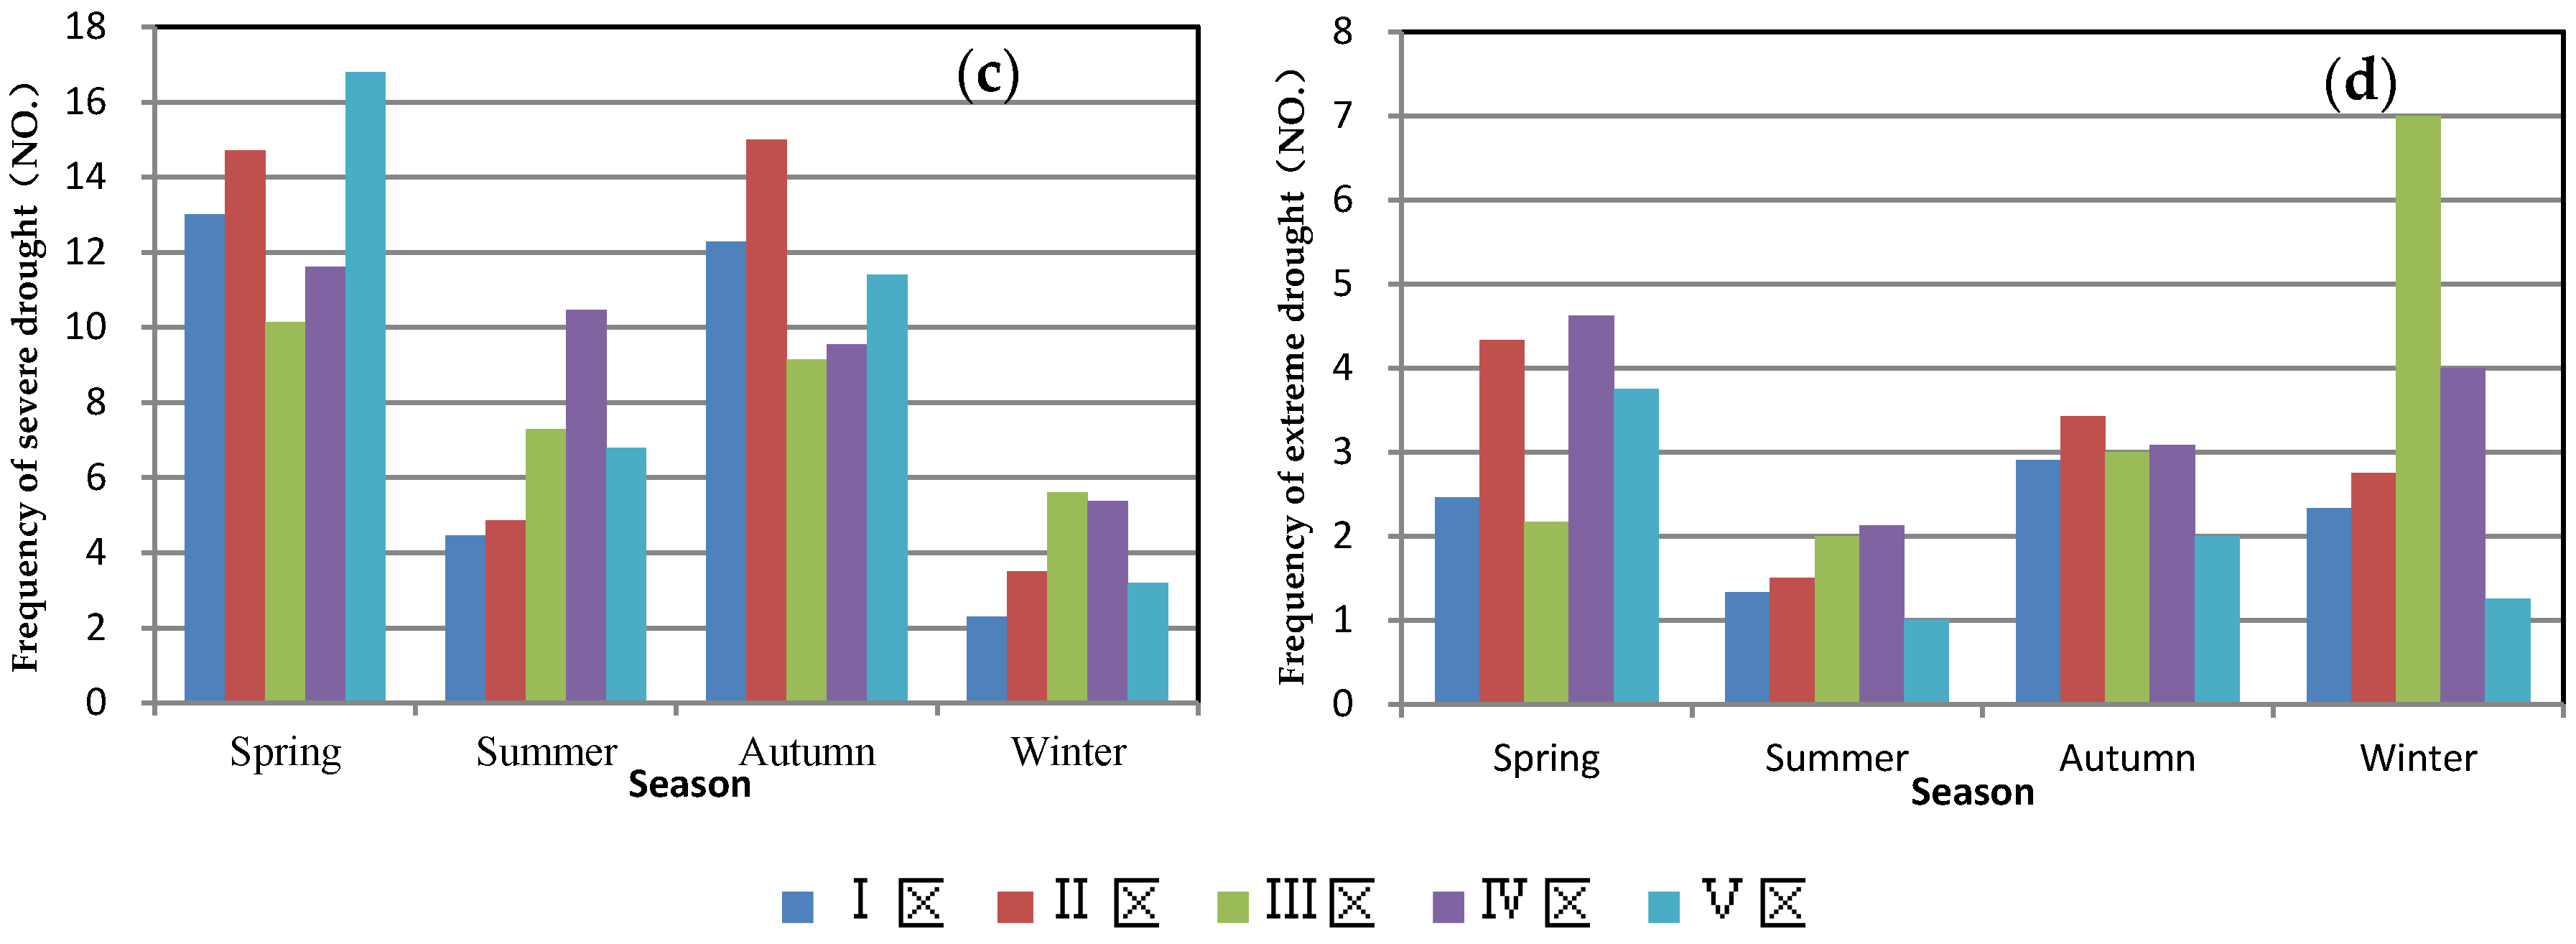
The Haihe River Basin is more prone to severe droughts in spring and autumn than in winter and summer (Figure 7c). The severe drought frequency declines from spring to summer by 67.0%, 65.7%, 60.0%, −28.2%, and −9.9% in region II, I, V, III, and IV, respectively. From summer to autumn, severe droughts increase by 209%, 175%, 67.6%, and 25.5% in region II, I, V, and III, respectively. The change in region III is relatively small. From autumn to winter, the number of severe droughts decreases by 81.2%, 76.7%, 71.9%, 43.5%, and 38.8% in region I, II, V, IV, and III, respectively.
Figure 7d shows the seasonal frequency of extreme droughts in each sub-region. Since the Haihe River Basin has a temperate East Asian monsoon climate zone, precipitation is concentrated during the summer. As a result, the basin is least prone to extreme droughts in summer. In winter, however, region III is more susceptible to extreme droughts. The frequency of extreme droughts decreases from spring to summer by 73.3%, 65.4%, 54.1%, 45.7%, and 7.7% in region V, II, IV, I, and III, respectively. There is a slight increase in extreme drought frequency from summer to winter.
In summary, light droughts are more likely to occur in summer. Moderate and severe droughts are more likely to occur due to relatively little precipitation in spring and autumn. Extreme droughts seldom occur in summer, but they are equally common in other seasons. The only exception is region III, where extreme droughts are more intense and most serious in winter.
4.3. Interannual and Interdecadal Variations of Drought Frequency and Duration
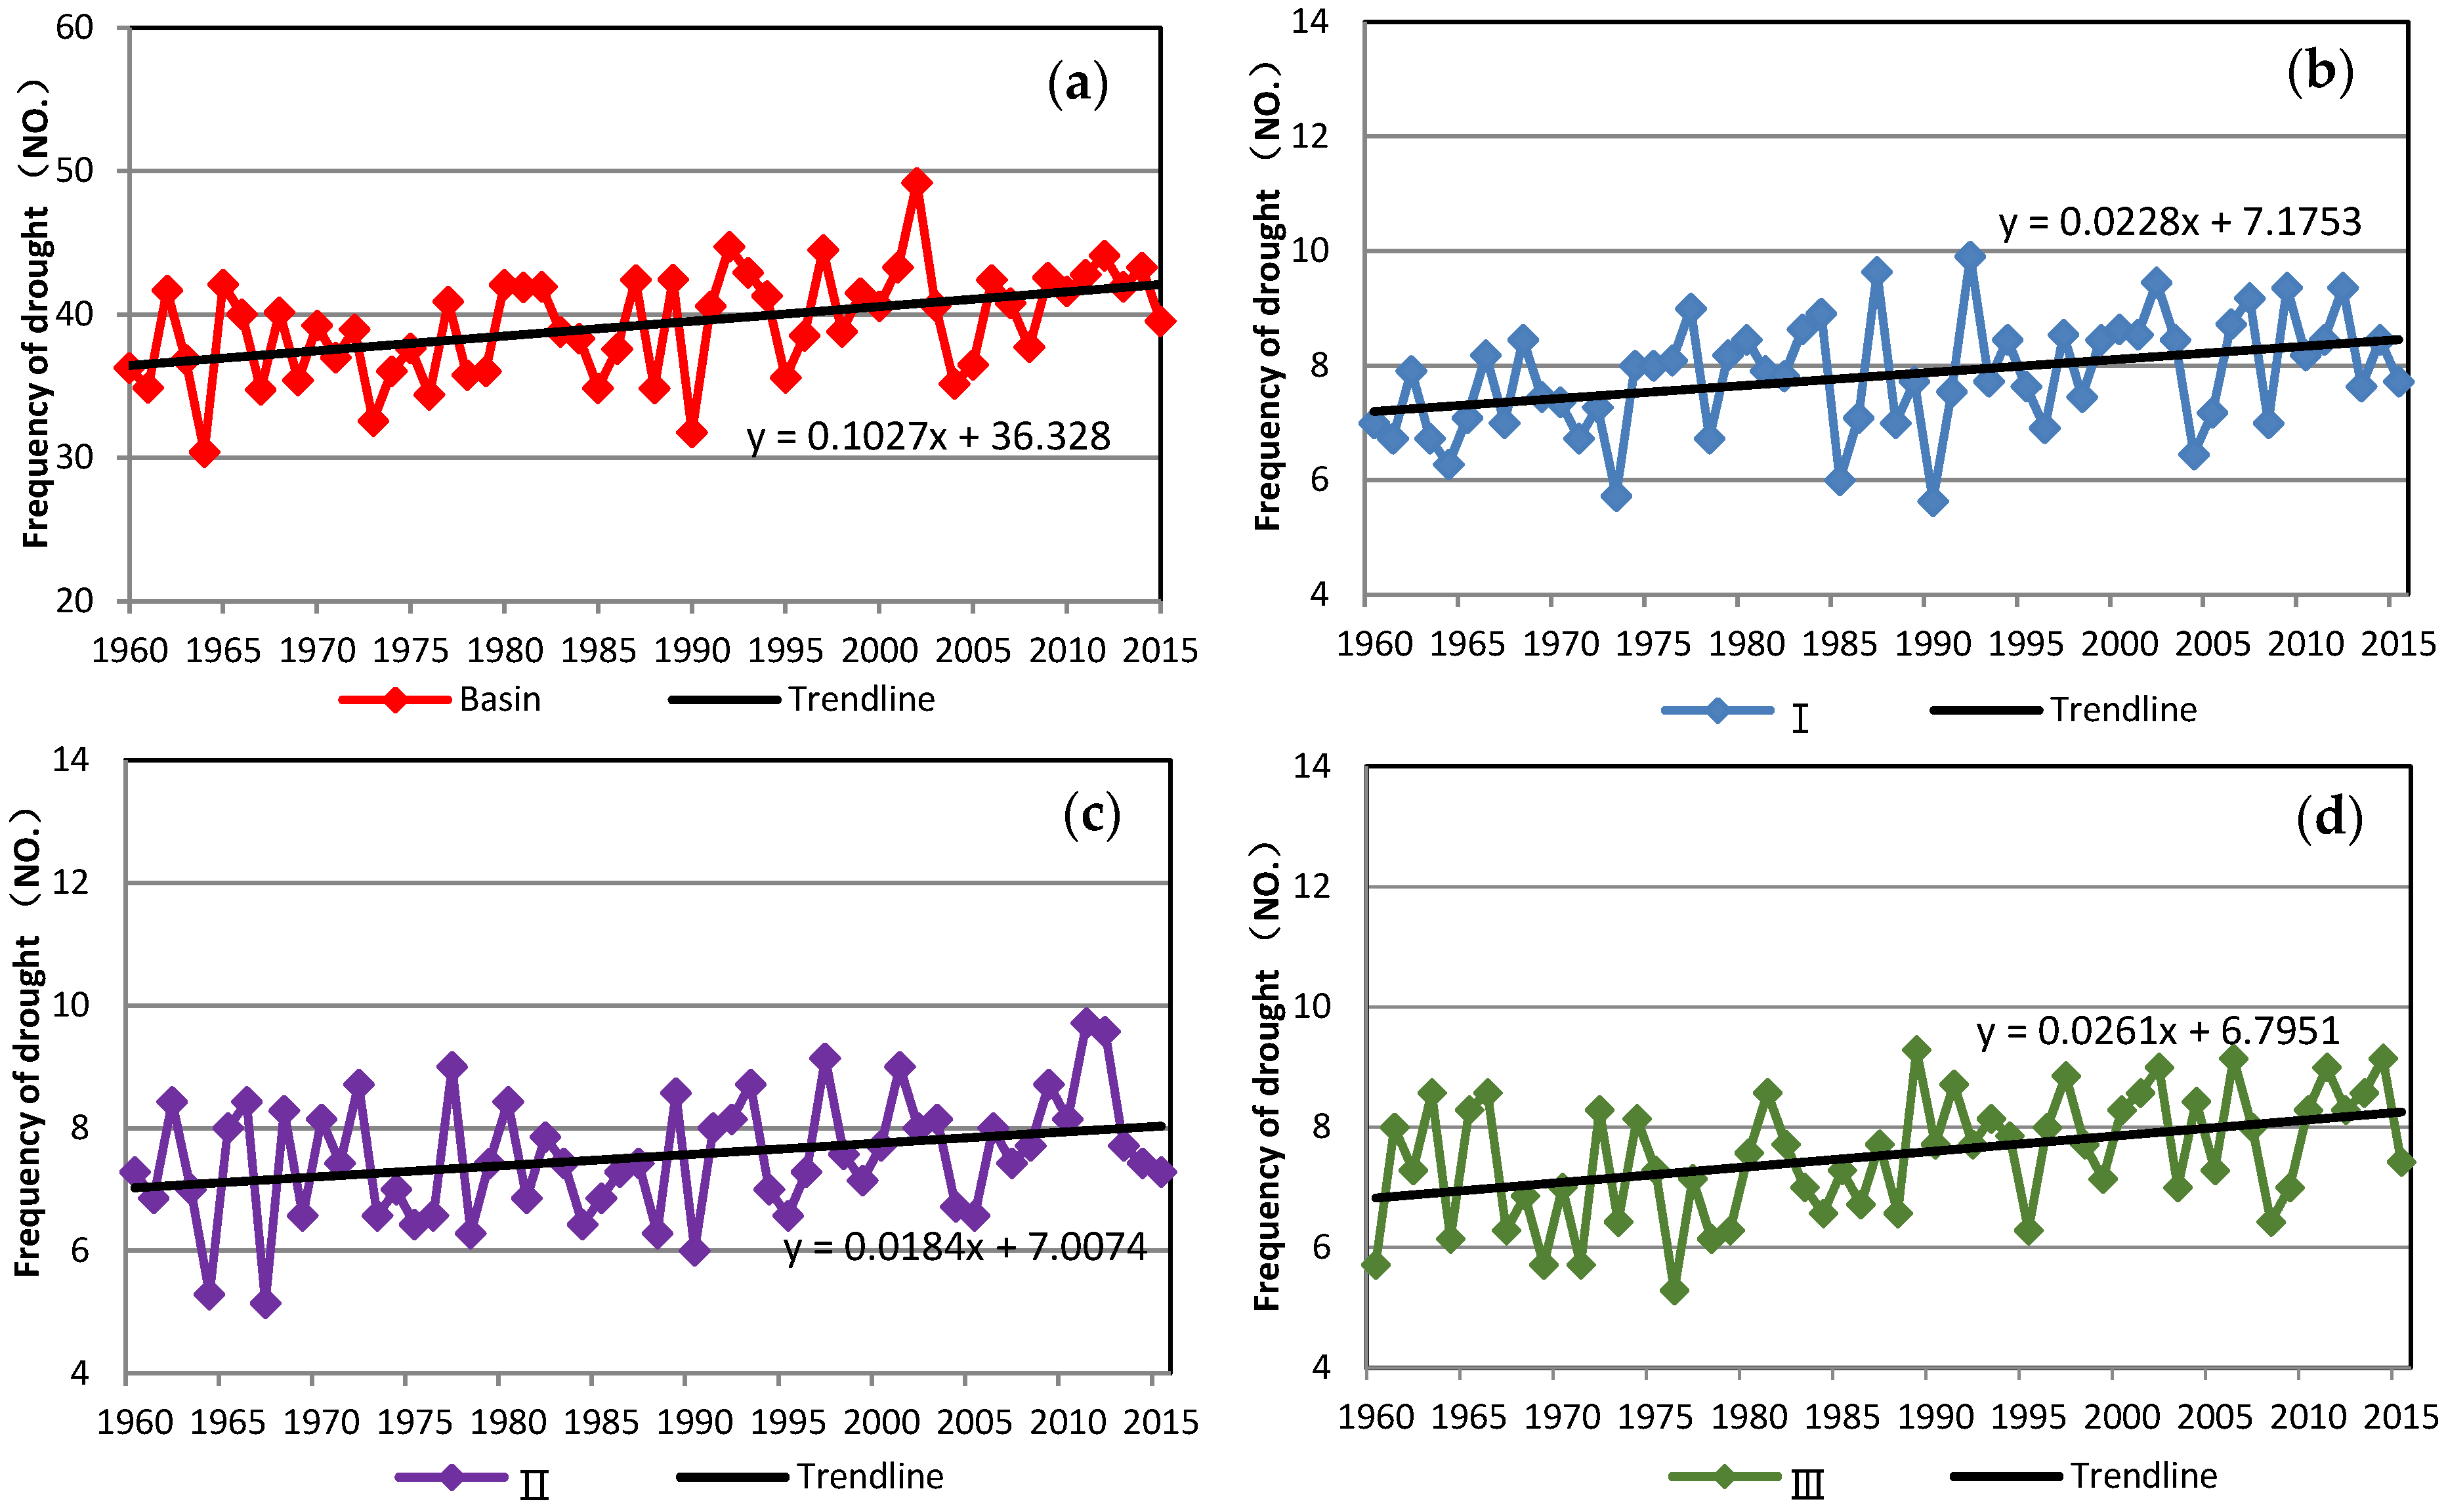
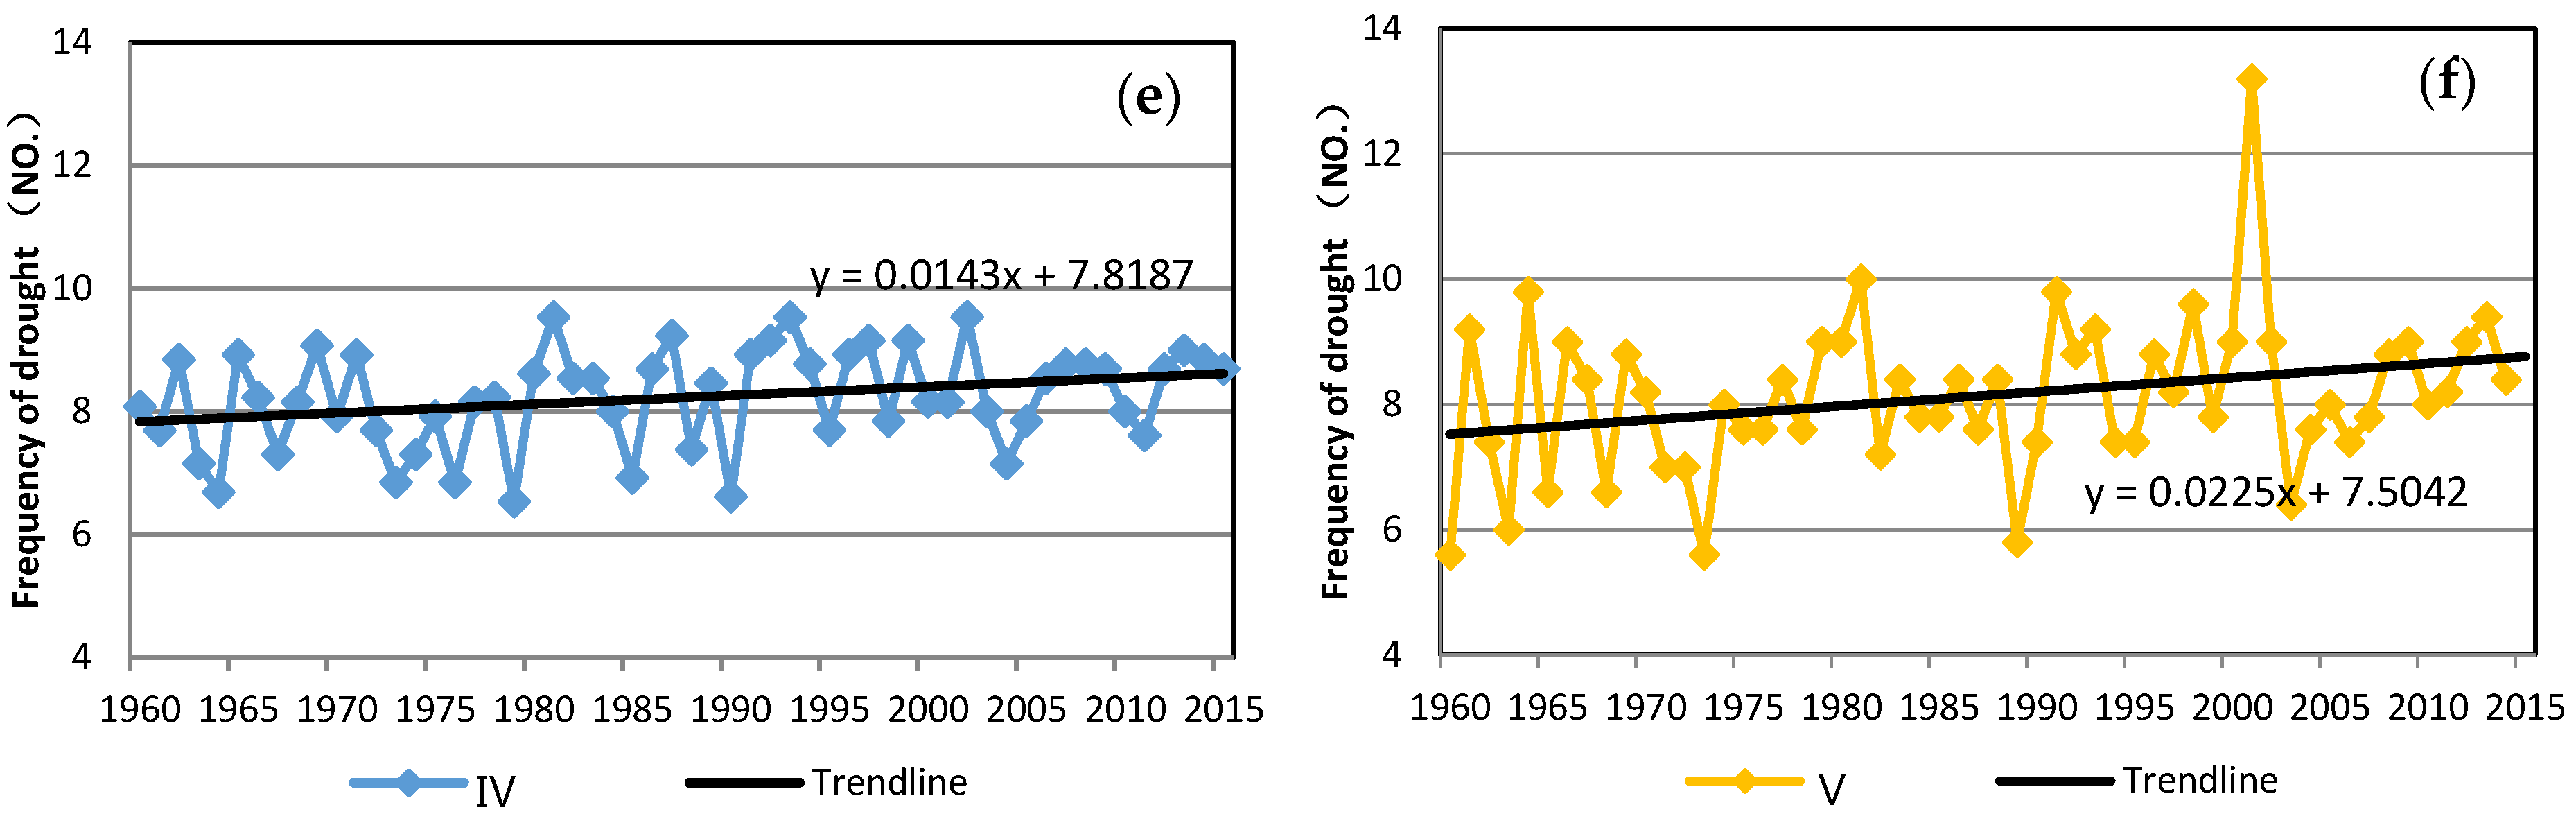
Using linear trend analysis, interannual variations of drought frequency for the Haihe River Basin and the five sub-regions are illustrated in Figure 8. The annual frequency of droughts increases, but with different growth in each sub-region. The rate of drought increase in the five sub-regions is greatest in region III (0.26/10 a), followed by, in order, I (0.23/10 a), V (0.23/10 a), II (0.18/10 a), and IV (0.14/10 a).
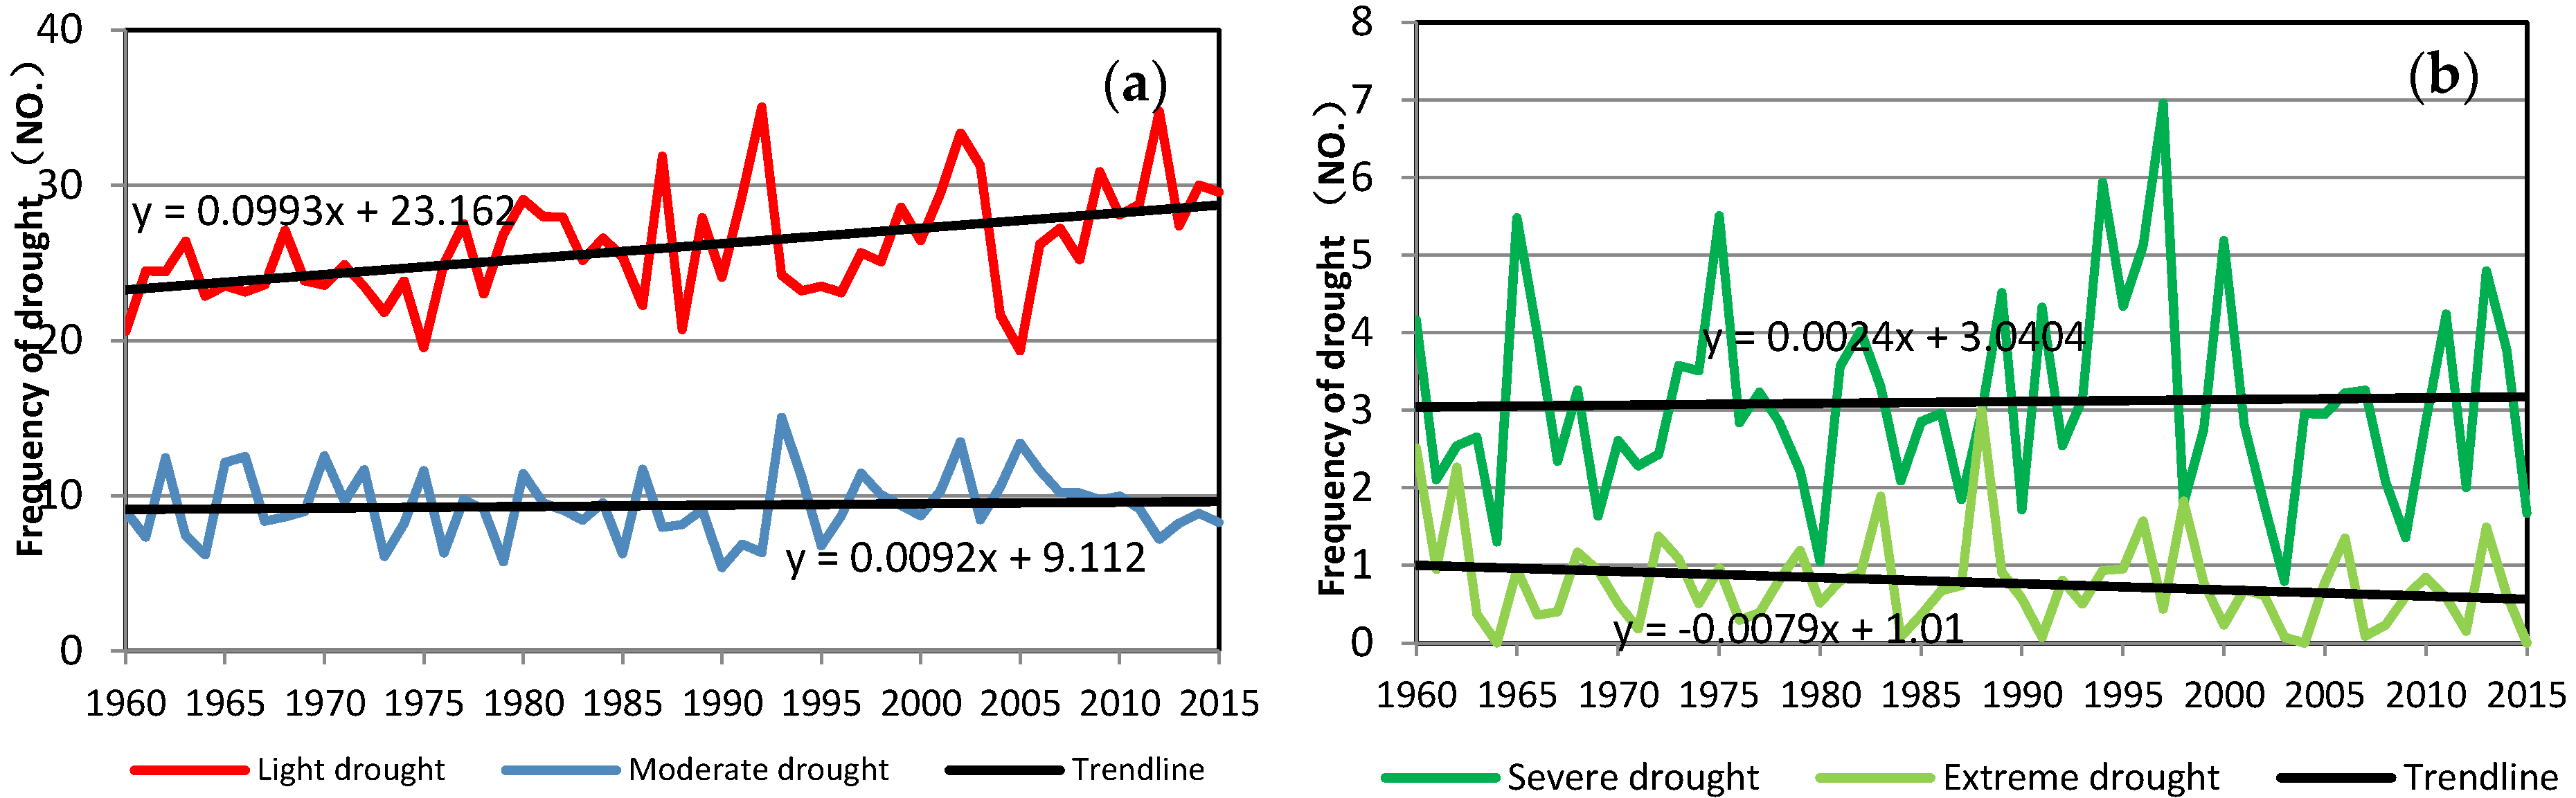
Thus, droughts have become more frequent. Moreover, Figure 9 reveals significantly more light droughts from 1960 to 2015, almost no change in moderate and heavy droughts, and a decrease in extreme droughts. Therefore, we conclude that, as droughts become more frequent, the duration of the droughts decreases.
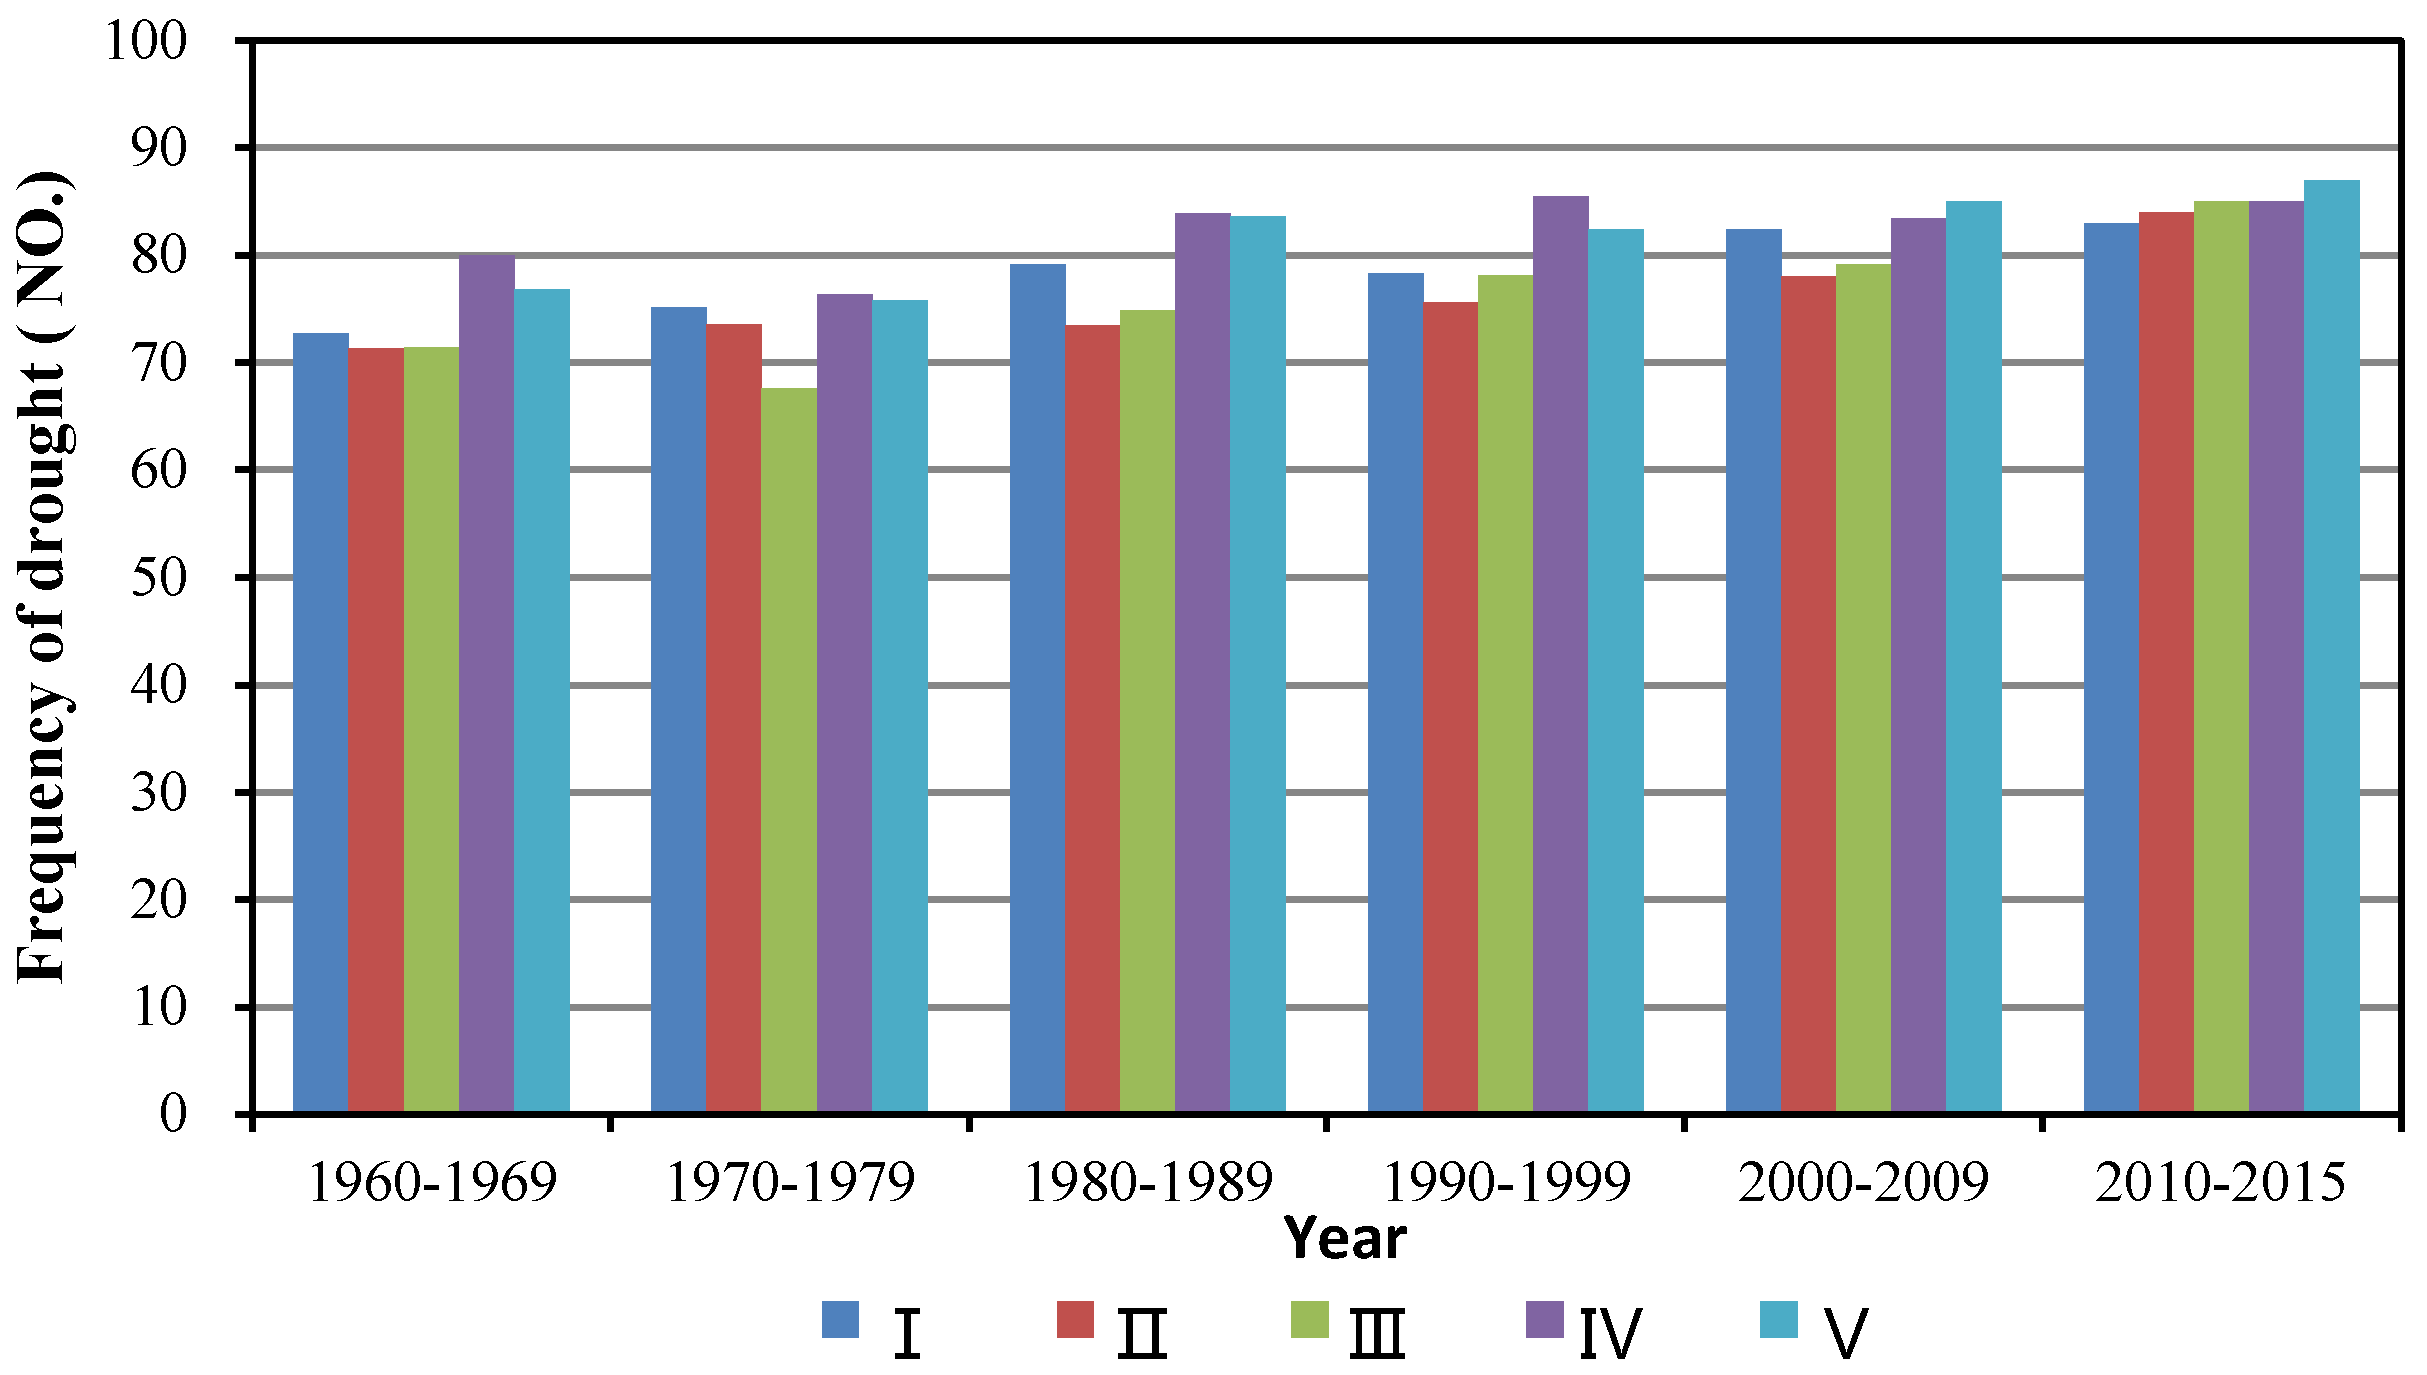
Figure 10 indicates considerable interdecadal variations, and the interdecadal frequency of droughts generally increases for all sub-regions. It should be noted that the drought frequency for 2010–2019 was extrapolated from the average value for 2010–2015. For region III and II, the increase is relatively large; 19.0% and 17.8%, respectively, compared to that of the 1960s. The interdecadal drought frequency in region I and V increases by 14.1% and 13.3%, respectively, while region IV shows a relatively small increase (6.25%). Regarding their spatial distribution, droughts are slightly more frequent in regions IV and V. These two sub-regions experience an average of 82 and 81 droughts every 10 years, while regions I, II, and III experience 78, 74, and 73 droughts, respectively.
4.4. Relationship between Precipitation Intensity and Drought Duration
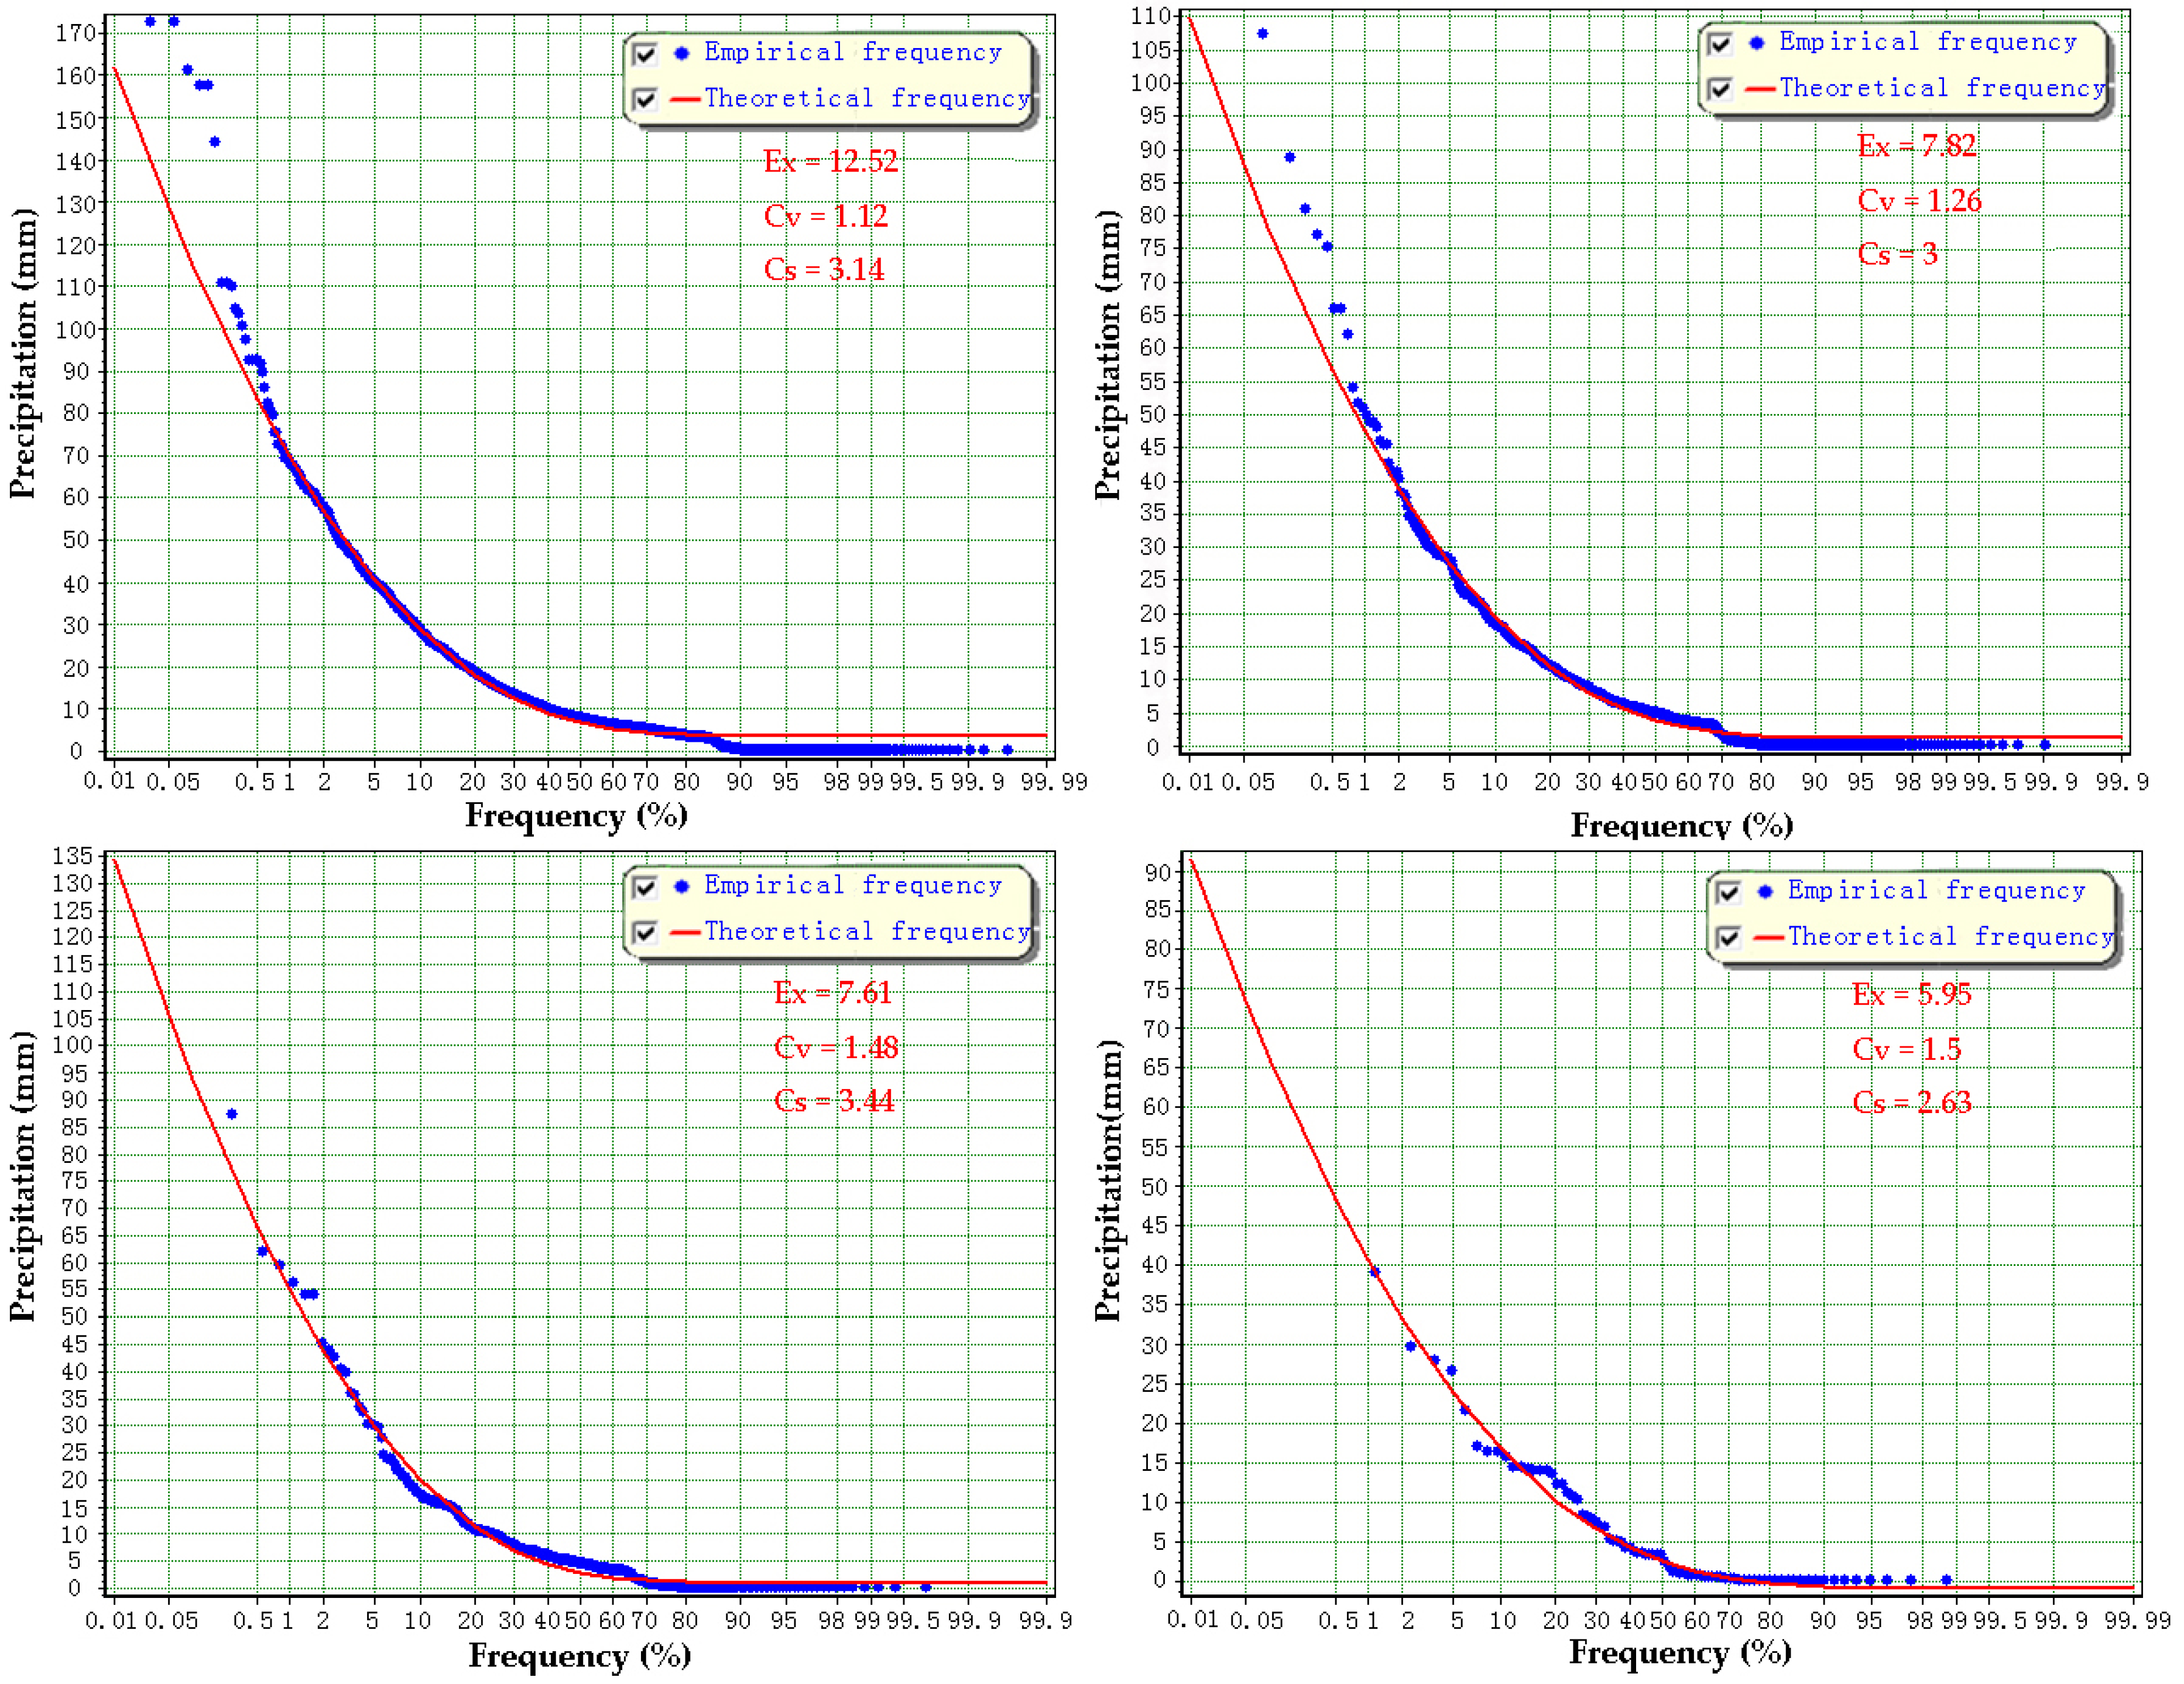
Pearson-III analysis was used to analyze the frequency of the first daily precipitation after droughts of different durations. Then, the probabilities of all precipitation types were determined for different drought durations. For brevity, the results of region I are described in detail in Figure 11, while those of other sub-regions are listed in Table 4. Figure 11a shows the first precipitation P-III frequency curve after light droughts. The frequency of light rains is the difference between the frequency of precipitation above light rains (> 0 mm), which is 100%, and that above moderate rain (>10 mm), which is 36.94%; thus, the frequency of light rains is 63.06%. In the same manner, the frequencies from moderate rain to extreme rainstorms after light droughts are 24.31%, 9.69%, 2.73%, 0.21%, and 0, respectively. The respective precipitation frequencies after moderate droughts are 75.63%, 18.17%, 5.36%, 0.82%, 1.51%, and 0.02%, respectively (Figure 11b), those after severe droughts are 77.41%, 15.59%, 5.64%, 1.29%, 0.07%, and 0.00%, respectively (Figure 11c), and those after extreme droughts are 79.22%, 16.28%, 4.08%, 0.42%, 0.00%, and 0.00%, respectively (Figure 11d).
In region I, as drought duration progressively increases, the frequency of light rains also increases (Table 4). The frequency of moderate rains decreases as light droughts progress to severe droughts, but then increases with greater drought duration. With drought duration increasing, the likelihood of heavy rain, rainstorms, and heavy rainstorms decreases overall, with a slightly higher probability after severe droughts. No extreme rainstorms occur in region I, regardless of drought duration. In region II, light rain frequency increases with drought duration but moderate rain frequency decreases. When light droughts evolve into moderate droughts and moderate droughts to extreme droughts, the probability of heavy rain and rainstorms first decreases then increases. Heavy rainstorms only occur after extreme droughts, and extreme rainstorms do not occur in region II. In region III, with increasing drought duration, the frequency of light rain generally increases, while the probability of moderate rains and heavy rains first decreases, then increases, and decreases again. The frequency of rainstorms and heavy rainstorms first decreases then increases. Extreme rainstorms occur only after extreme droughts. In region IV, the frequency of light rain also increases with drought duration. Moderate rains, heavy rains, rainstorms, and heavy rainstorms generally decrease with drought duration, although there is a slightly higher probability of all precipitation types after severe droughts. No extreme rainstorms occur in region IV. In region V, the probability of light rains increases with drought duration, but that of moderate and heavy rains decreases, and the probability of rainstorms and heavy rainstorms first decreases then increases. Extreme rainstorms occur only after a period of extreme drought.
Generally, the probability of extreme rainstorms after droughts in the Haihe River Basin is much smaller than that of other precipitation intensities, and the frequency of heavy rainstorms is always higher than that of extreme rainstorms. In region III and V, the probability of heavy rainstorms varies with drought duration. In region I and IV, the probability of heavy rainstorms typically decreases with drought duration, but in region II, heavy rainstorms occur only after extreme droughts. Rainstorms show a similar trend to heavy rainstorms; the frequency is variable with drought duration in regions II, III, and V, but generally decreases in regions I and IV. Heavy and moderate rains typically decrease but fluctuate in all sub-regions. Light rains, however, generally increase in all sub-regions with increasing drought duration. In sum, longer duration droughts do not lead to more concentrated and heavier precipitation. With increasing drought duration, the frequency of light rains shows an increasing trend, while the possibility of moderate rain and heavy rain is reduced. The frequency of rainstorms, heavy rainstorms, and extreme rainstorms is irregular.
4.5. Relationship between Precipitation Intensity and Drought Frequency
The relationship between precipitation intensity and drought frequency at 10-year intervals during 1960–2019, in different sub-regions of the Haihe River Basin, are shown in Table 5. The drought incidence for 2010–2019 was extrapolated from the average value during 2010–2015. In region I, drought frequency generally increases with time. The calculated incidence of droughts in 2010–2019 is 83, which is 2.83% higher than that of the 1960s. With a higher drought frequency, moderate rains decrease by 4.18%, while light rains, heavy rains, rainstorms, and heavy rainstorms increase by an average of 1.57%, 2.57%, 2.58%, and 137.8%, respectively. Therefore, with increased droughts, the frequency of heavy rainstorms, rainstorms, heavy rains, and light rains increases with descending order, while moderate rain frequency typically decreases. In region II, there were 50 droughts in 2010–2015, so the extrapolated incidence equals 84 for 2010–2019. The frequency of droughts increases over the entire region. The average increase is 3.46% from the 1960s. With more frequent droughts, the frequency of moderate rains, heavy rains, and rainstorms increases by an average of 1.42%, 2.98%, and 21.3%, respectively, while the light rain frequency decreases by 0.42% on average. Hence, with increased drought frequency, rainstorm frequency increases the most, followed by heavy rains and then moderate rains, whereas the probability of light rain decreases.
Region III experienced 51 droughts in 2010–2015, so the extrapolated 2010–2019 drought frequency is approximately 85. Droughts increase over the entire basin by 3.66% on average (compared to the 1960s). Moderate rains, heavy rains, rainstorms, and heavy rainstorms all show increasing trends, with average increases of 6.74%, 7.72%, 18.77%, and 191.2%, respectively. The frequency of light rains decreases by 2.22% on average. Thus, with increased droughts, the frequency of heavy rainstorms, rainstorms, heavy rains and moderate rains increases (in descending order) while light rains become less frequent. In region IV, there were 51 droughts in 2010–2015. The extrapolated number in 2010–2019 is approximately 85, which is a 1.37% increase from the 1960s. Light rains and moderate rains increase by 0.7% and 0.75%, respectively. The probability of heavy rains, rainstorms, and heavy rainstorms decreases by an average of 1.04%, 5.03%, and 10.05%, respectively. Hence, with an increase of drought frequency, moderate rain frequency increases the most, followed by light rain frequency, whereas heavy rainstorm frequency decreases the most, followed by rainstorms then heavy rains. Region V experienced 52 droughts in 2010–2015, extrapolated to 87 for 2010–2019. Drought frequency over the entire basin is, on average, 2.54% higher than the 1960s. The frequency of light rain, rainstorms, heavy rainstorms, moderate rain, and heavy rain changes by an average of +1.47%, +6.4%, +30.2, −1.24%, and −1.34%, respectively. Thus, it can be concluded that heavy rainstorms, rainstorms, and light rains increase (in descending order) while heavy rains and moderate rains become less frequent.
In general, with an increasing drought frequency, the heavy rainstorm and rainstorm frequency increases in regions I, II, III, and V. Heavy rains become more frequent in regions I, II, and III, but less frequent in regions IV and V. The moderate rain frequency increases in regions II, III, and IV, while decreasing in regions I and V. Light rains are the opposite, becoming more frequent in regions I and V, but less frequent in regions II, III, and IV.
5. Discussion
5.1. Temporal and Spatial Variation of Drought Frequency and Duration
Intra-annual frequency variations are significant for droughts of different duration in the Haihe River Basin. As the occurrence of light droughts is much higher than that of other droughts, the main period of its occurrence determines the overall drought occurrence period of the whole basin. Light droughts are more common and typically occur in summer; therefore, droughts more commonly occur in summer throughout the basin. This is predominantly because regional precipitation is mainly concentrated between July and September, and there is relatively little precipitation in March to May (spring) and June (summer). Statistically, however, consecutive dry day periods often extend across these two seasons, and half or more of the dry days occur in June, which increases the overall frequency of light droughts in summer. Moderate and severe droughts are more likely with relatively less precipitation in spring and autumn. Extreme droughts seldom occur in summer, but their occurrence is equally common in other seasons, with the exception of region III, where extreme droughts are more intense and most serious in winter.
The inter-annual and interdecadal variations of droughts are also considerable. Droughts become more frequent throughout the basin, but are shorter in duration. The drought frequency increases from 1960–2015 in all sub-regions, but the rate of drought increase differs for each sub-region. Regions IV and V are subjected to more frequent droughts than other sub-regions. This is mainly because regions I and III are located along the windward slopes of the Yanshan, and Taihang Mountains, and they receive significantly more precipitation than region IV (central plains) and V (southeast coastal areas). Region II is on the downwind hillside, although its precipitation is the least, its temporal distribution is relatively uniform, with the number of droughts occurring less than in regions IV and V.
5.2. Drought Variations under Climate Change
On the whole, the climate in the Haihe River Basin is warming. However, the rate of temperature increase differs across sub-regions. The annual average rates of temperature increase in the sub-regions are 0.471 °C/10 a (III), 0.318 °C/10 a (I), 0.267 °C/10 a (V), 0.230 °C/10 a (II) and 0.225 °C/10 a (IV) in descending order. By comparing Figure 5 and Figure 8, it can be seen that there is some correlation between the temperature rise and the occurrence of drought. The increasing rate of temperature is consistent with the drought growth trend of each sub-region. The faster the temperature increases, the more droughts occurs. For example, the rates of drought increase are III (0.26/10 a), I (0.23/10 a), V (0.23/10 a), II (0.18/10 a), and IV (0.14/10 a), which are consistent with the trend of temperature increase in each sub-region. Thus, climatic warming is likely to be one of the factors influencing the increased drought frequency in the past 56 years.
5.3. Precipitation Intensity Variations with Changes in Drought Frequency and Duration
In the Haihe River Basin, with the increase of drought frequency, the intensity of the first daily precipitation after droughts of different duration also show a notable pattern. In the basin as a whole, the frequency of rainstorms, heavy rainstorms, and extreme rainstorms increases; the moderate rains, and heavy rains in most areas show an increasing trend, while some areas show a deceasing trend. Light rains show the opposite pattern: they increased in fewer areas, but decreased in more areas. This shows that, in general, in the context of global warming, more intense precipitation occurs more frequently throughout the basin as droughts become more common. At the same time, as the frequency of droughts increases, the duration of droughts becomes shorter. Shorter duration droughts lead to a decrease in the frequency of light rains, while the frequency of heavy and moderate rains increases. This also indicates that the intensity of the first daily precipitation after droughts increases under regional temperatures rising. In summary, more intense precipitation events will become more common under a warmer climate in the Haihe River Basin.
5.4. Pearson-III Distribution Curve Fitting to the Precipitation Intensity and Frequency
The Pearson-III distribution curve was used to analyze the frequency of the first daily precipitation after droughts of different duration in the five sub-regions of the Haihe River Basin. The Pearson-III frequencies of the first precipitation after light drought, moderate drought, severe drought, and extreme drought in region I are shown in Figure 11; the fitting curves for other regions are not listed in detail. It can be seen that the Pearson-III curve generally has a good fit to the precipitation throughout the basin; for precipitation after severe drought and extreme drought, in particular, there is good fit with the existing data. However, for light drought and moderate drought, the fit is poor in some sub-regions; for example, in sub-region I, there is a poor fit with the existing data above 80 mm in light drought, and above 50 mm in moderate drought. The reasons for this phenomenon are complex. One possible reason is that owing to the occurrence of light droughts and moderate droughts being much higher than those of severe droughts and extreme droughts, there are more data points in the fitting curves; at same time, there are far more low-intensity precipitation data points than high-intensity data points. When the Pearson-III curve is determined by the optimal fitting degree, the low-intensity precipitation data points control the Pearson-III curve, and the fitting degree in the high-value part is poor. Another possible reason is that the Pearson-III curve is less adaptable to sub-region I, although it has good adaptability in other sub-regions of the Haihe River Basin. For sub-region I, obtaining a better fitting curve for the first daily precipitation after droughts will be one of the objectives of the next in-depth study.
6. Conclusions
Global warming is associated with frequent and alternating droughts and floods, with sharp transitions between them, which seriously threaten the normal operation of the national economy. We used the Haihe River Basin as a study area and analyzed the relationships between precipitation intensity, precipitation frequency, drought duration, and interdecadal drought frequency based on daily precipitation data (1960–2015) measured at 43 meteorological stations in and around the basin. Our major conclusions are listed below:
- (1)
- Droughts show significant intra-annual, inter-annual, and interdecadal variations in the Haihe River Basin. From spring to winter, the drought frequency increases then decreases, and droughts are more likely in summer. Droughts show an increasing frequency throughout the basin, but the drought duration decreases overall.
- (2)
- As the drought duration increases, the frequency of light rains increases in the Haihe River Basin, while the moderate rain and heavy rain frequency decreases with a fluctuating trend. Rainstorm frequency first decreases then increases in regions II, III, and V. However, in regions I and IV, the rainstorm frequency decreases as droughts become more intense. The probability of extreme rainstorms is relatively small; they only occur after extreme droughts in regions III and V. Heavy rainstorm frequency decreases then increases with drought duration in regions III and V, while it shows a variable but decreasing trend in regions I and IV. Heavy rainstorms only occur in region III after extreme droughts.
- (3)
- The frequency of light rain and moderate rain does not change substantially with increasing drought frequency. Heavy rains are more frequent in regions I, II, and III, but less frequent in regions IV and V. The rainstorm and heavy rainstorm frequencies increase in all sub-regions except region IV.
- (4)
- From the statistical analysis of the precipitation and temperature data, global warming is consistent with the increase in drought frequency in the past 56 years. As the number of droughts increases, the drought duration becomes shorter, and the intensity of the first daily precipitation after droughts becomes stronger.
Owing to the complexity of the relationships between changes in temperature, drought duration, and subsequent rainfall intensity, we have only qualitatively analyzed these relationships in this study. Quantitative analysis requires further research. Moreover, the drought incidence for 2010–2019 was derived simply by extrapolating the average value for 2010–2015. Other predictive methods, such as wavelet analysis, could be used in future studies.
Acknowledgments
This work was supported by the Science and Technology Project of Hebei Province, China (Grant No. 15227005D) and Scientific Research Project of Hebei Provincial Education Department (QN2016233, ZD2016131).
Author Contributions
This paper is a joint effort by several authors. B.L. and J.S. conceived and designed the paper’s structure; Z.Y. performed the SOM cluster analysis; B.L. and S.L. analyzed the data; J.S. contributed Pearson-III analysis tools; B.L. wrote the paper.
Conflicts of Interest
The authors declare no conflict of interest.
References
- IPCC. Climate Change 2007: Impacts, Adaptation and Vulnerability. In Contribution of Working Group II to the Fourth Assessment Report of the Intergovernmental Panel on Climate Change; Parry, M.L., Canziani, O.F., Palutikof, J.P., van der Linden, P.J., Hanson, C.E., Eds.; Cambridge University Press: Cambridge, UK, 2007. [Google Scholar]
- IPCC. Climate Change 2014: Impacts, Adaptation, and Vulnerability. In Part A: Global and Sectoral Aspects. Contribution of Working Group II to the Fifth Assessment Report of the Intergovernmental Panel on Climate Change; Field, C.B., Barros, V.R., Dokken, D.J., Mach, K.J., Mastrandrea, M.D., Bilir, T.E., Chatterjee, M., Ebi, K.L., Estrada, Y.O., Genova, R.C., et al., Eds.; Cambridge University Press: New York, NY, USA, 2014; p. 1132. [Google Scholar]
- Yao, Y.Q.; Zheng, F.L.; Guan, Y.H. The temporal and spatial characteristics of flood and drought during the recent 60 years in China. Agric. Res. Arid Areas 2017, 35, 228–232, 263. (In Chinese) [Google Scholar]
- Dai, A.; Trenberth, K.E.; Qian, T. A global dataset of Palmer Drought Severity Index for 1870–2002: Relationship with soil moisture and effects of surface warming. J. Hydrometeorol. 2004, 5, 1117–1130. [Google Scholar] [CrossRef]
- Cancelliere, A.; Mauro, G.D.; Bonaccorso, B.; Rossi, G. Drought forecasting using the Standardized Precipitation Index. Water Resour. Manag. 2007, 21, 801–819. [Google Scholar] [CrossRef]
- Łabedzki, L. Estimation of local drought frequency in central Poland using the standardized precipitation index SPI. Irrigat. Drain. 2007, 56, 67–77. [Google Scholar] [CrossRef]
- Wang, W.; Cai, X.J. Analysis on Variation Feature of Drought in Mid- and Lower-Reaches of Yangtze River Basin. Plateau Meteorol. 2010, 29, 1587–1593. (In Chinese) [Google Scholar]
- Wang, X.H.; Yan, J.P.; Yang, J.F.; Liu, X.T. An Analysis of Global Warming and Economic Adaptation in Hanzhong during 1950–2008. Prog. Geogr. 2011, 30, 557–562. (In Chinese) [Google Scholar]
- Martins, D.S.; Raziei, T.; Paulo, A.A.; Pereira, L.S. Spatial and temporal variability of precipitation and drought in Portugal. Nat. Hazards Earth Syst. Sci. 2012, 12, 1493–1501. [Google Scholar] [CrossRef] [Green Version]
- Zhang, Q.; Xiao, M.; Singh, V.P.; Li, J. Regionalization and spatial changing properties of droughts across the Pearl River basin, China. J. Hydrol. 2012, 472, 355–366. [Google Scholar] [CrossRef]
- Gocic, M.; Trajkovic, S. Spatiotemporal characteristics of drought in Serbia. J. Hydrol. 2014, 510, 110–123. [Google Scholar] [CrossRef]
- Xu, K.; Yang, D.; Yang, H.; Li, Z.; Qin, Y.; Shen, Y. Spatio-temporal variation of drought in China during 1961–2012: A climatic perspective. J. Hydrol. 2015, 526, 253–264. [Google Scholar] [CrossRef]
- Yang, G.; Shao, W.; Wang, H.; Han, D. Drought evolution characteristics and attribution analysis in northeast China. Procedia Eng. 2016, 154, 749–756. [Google Scholar] [CrossRef]
- Dabanlı, İ.; Mishra, A.K.; Sen, Z. Long-Term Spatio-Temporal Drought Variability in Turkey. J. Hydrol. 2017, 552, 779–792. [Google Scholar] [CrossRef]
- Burke, E.J.; Brown, S.J.; Christidis, N. Modeling the Recent Evolution of Global Drought and Projections for the Twenty-First Century with the Hadley Centre Climate Model. J. Hydrometeorol. 2009, 7, 1113–1125. [Google Scholar] [CrossRef]
- Ahmadalipour, A.; Moradkhani, H.; Svoboda, M. Centennial drought outlook over the CONUS using NASAnsEX downscaled climate ensemble. Int. J. Climatol. 2017, 37, 2477–2491. [Google Scholar] [CrossRef]
- Narasimhan, B.; Srinivasan, R. Development and evaluation of soil moisture deficit index (SMDI) and evapotranspiration deficit index (ETDI) for agriculture drought monitoring. Agric. For. Meteorol. 2005, 133, 69–88. [Google Scholar] [CrossRef]
- Ahmadalipour, A.; Moradkhani, H.; Demirel, M.C. A comparative assessment of projected meteorological and hydrological droughts: Elucidating the role of temperature. J. Hydrol. 2017, 553, 785–797. [Google Scholar] [CrossRef]
- Gu, Y.X.; Brown, J.F.; Verdin, J.P.; Wardlow, B. A five-year analysis of MODIS NDVI and NDWI for grassland drought assessment over the central Great Plains of the United States. Geophys. Res. Lett. 2007, 34, L06407. [Google Scholar] [CrossRef]
- Murthy, C.S.; Sesha Sai, M.V.R.; Bhanuja Kumari, V.; Roy, P.S. Agricultural drought assessment at disaggregated level using AWiFS/WiFS data of Indian Remote Sensing satellites. Geocarto Int. 2007, 22, 127–140. [Google Scholar] [CrossRef]
- Ahmadalipour, A.; Moradkhani, H.; Yan, H.; Zarekarizi, M. Remote Sensing of Drought: Vegetation, SoilMoisture, and Data Assimilation. In Remote Sensing of Hydrological Extremes; Springer: Zürich, Switzerland, 2017; pp. 121–149. [Google Scholar]
- Trenberth, K.E.; Dai, A.; Rasmussen, R.M.; Parsons, D.B. The Changing Character of Precipitation. Bull. Am. Meteorol. Soc. 2003, 84, 1205–1217. [Google Scholar] [CrossRef]
- Allan, R.P.; Soden, B.J. Atmospheric warming and the amplification of precipitation extremes. Science 2008, 321, 1481–1484. [Google Scholar] [CrossRef] [PubMed]
- Almazroui, M.; Saeed, F.; Islam, M.N.; Alkhalaf, A.K. Assessing the robustness and uncertainties of projected changes in temperature and precipitation in AR5 global climate models over the arabian peninsula. Atmos. Res. 2016, 182, 163–175. [Google Scholar] [CrossRef]
- Gao, T.; Wang, H.J.; Zhou, T. Changes of extreme precipitation and nonlinear influence of climate variables over monsoon region in china. Atmos. Res. 2017, 197, 379–389. [Google Scholar] [CrossRef]
- Gao, T.; Xie, L. Spatiotemporal changes in precipitation extremes over yangtze river basin, china, considering the rainfall shift in the late 1970s. Glob. Planet. Chang. 2016, 147, 106–124. [Google Scholar] [CrossRef]
- Jia, S.F.; Li, Y.Y.; Lv, A.F.; Yan, J.B. Estimation of excess pumping of shallow groundwater aquifer in Haihe Plain. South-to-North Water Transf. Water Sci. Technol. 2016, 14, 1–7, 71. (In Chinese) [Google Scholar]
- Wang, Q.P.; Ji, Z.H.; Wang, X.C. Hydrological Cycle and Analysis of Spatial and Temporal Evolution of Changing Environment in Haihe River Basin. South-to-North Water Transf. Water Sci. Technol. 2010, 8, 92–96. (In Chinese) [Google Scholar]
- Bao, Z.X.; Zhang, J.Y.; Yan, X.L.; Wang, G.Q.; He, R.M. Analysis of precipitation in the Haihe River basin during the last decades of years and future scenarios. Hydro-Sci. Eng. 2014, 5, 8–13. (In Chinese) [Google Scholar]
- Zong, Y.; Wang, Y.J.; Zhai, J.Q. Spatial and temporal characteristics of meteorological drought in the Haihe river basin based on standardized precipitation index. J. Arid Land Resour. Environ. 2013, 27, 198–202. (In Chinese) [Google Scholar]
- Wang, G.; Yan, D.H.; Zhang, D.D.; Liu, S.H. Trend Analysis of Variations in Extreme Precipitation and Temperature in the Hai River Basin from 1961 to 2010. South-to-North Water Transf. Water Sci. Technol. 2014, 12, 1–6, 11. (In Chinese) [Google Scholar]
- Yan, D.H.; Yuan, Z.; Yang, Z.Y.; Yu, Y.D. Spatial and temporal changes in drought since 1961 in Haihe River basin. Adv. Water Sci. 2013, 24, 34–41. (In Chinese) [Google Scholar]
- Yin, J. Evolution Law and Comprehensive Measures of Drought of Mountain Area in Haihe Basin. Master’s Thesis, China Institute of Water Resources and Hydropower Research (IWHR), Beijing, China, June 2013. (In Chinese). [Google Scholar]
- Li, L.X.; Yan, D.H.; Qin, T.L.; Hao, C.L.; Zheng, X.D. Drought variation in Haihe river basin from 1961 to 2010. J. Arid Land Resour. Environ. 2012, 26, 61–67. (In Chinese) [Google Scholar]
- Yan, X.L.; Zhang, J.Y.; Bao, Z.X.; Wang, G.Q.; Wang, X.J. Analysis of evaluation of agricultural drought in Haihe River Basin. J. Water Resour. Water Eng. 2016, 27, 220–225. (In Chinese) [Google Scholar]
- Liu, X.F.; Xiang, L.; Yu, C.W. Characteristics of temporal and spatial variations of the precipitation extremes in the Haihe River basin. Clim. Environ. Res. 2010, 15, 451–461. (In Chinese) [Google Scholar]
- Geng, S.M. Effects of Drought on Evolution of Typical Farmland Soil Ecosystem in Haihe River Basin. Master’s Thesis, Ocean University of China, Qindao, China, May 2012. (In Chinese). [Google Scholar]
- Ren, G.Y.; Wang, T.; Guo, J.; Hao, Z.X.; Zhan, Y.J. Characteristics of precipitation variations in Haihe River Basin in modern times. Adv. Sci. Water Resour. 2015, 35, 103–111. (In Chinese) [Google Scholar]
- Zhang, J. Modeling Impacts of Climate Change on Water Resources and the Yields of Winter Wheat in the Haihe River Basin. Master’s Thesis, Capital Normal University, Beijing, China, May 2014. (In Chinese). [Google Scholar]
- Kohonen, T. Self-Organizing Maps, 3rd ed.; Springer: Berlin, Germany, 2001. [Google Scholar]
- Liu, X.; Chi, D.C.; Wu, P. SOM Network’s on Clustering Analysis of The Drought Based on Matlab. J. Shenyang Agric. Univ. 2008, 39, 61–64. (In Chinese) [Google Scholar]
- Mishra, A.K.; Singh, V.P. Drought modeling—A review. J. Hydrol. 2011, 403, 157–175. [Google Scholar] [CrossRef]
- People’s Republic of China Ministry of Water Resources. People’s Republic of China Water Industry Standard SL424–2008, Standard of Classification for Drought Severity; China Water and Power Press Beijing: Beijing, China, 2008. (In Chinese)
- Xiao, J.X.; Mu, B.; Hu, F. Agrometeorology; Higher Education Press: Beijing, China, 2009; p. 93. (In Chinese) [Google Scholar]
- Huang, Z.P. Hydrologic Statistics; HoHai University Press: Nanjing, China, 2003; pp. 179–189. (In Chinese) [Google Scholar]
- Yu, Y.Y.; He, X. Maximum Likelihood Estimation of P-III Curve and its application. Yangtze River 2012, 43, 21–23. (In Chinese) [Google Scholar]
Figure 1.
Location, topography and average annual precipitation contours (1960–2015) of the Haihe River Basin.
Figure 1.
Location, topography and average annual precipitation contours (1960–2015) of the Haihe River Basin.

Figure 2.
SOM clustering results and spatial distribution for the Haihe River Basin.

Figure 3.
Sub-regions of the Haihe River Basin.

Figure 4.
Contour map of average temperature gradient in the Haihe River Basin.

Figure 5.
Trend analysis of temperature for the five sub-regions (a) region I; (b) region II; (c) region III; (d) region IV; (e) region V in the Haihe River Basin (1960–2015).
Figure 5.
Trend analysis of temperature for the five sub-regions (a) region I; (b) region II; (c) region III; (d) region IV; (e) region V in the Haihe River Basin (1960–2015).

Figure 6.
Intraannual drought frequency for the five sub-regions of the Haihe River Basin.

Figure 7.
Intraannual frequency of light droughts (a), moderate droughts (b), severe droughts (c), and extreme droughts (d) for the five sub-regions of the Haihe River Basin.
Figure 7.
Intraannual frequency of light droughts (a), moderate droughts (b), severe droughts (c), and extreme droughts (d) for the five sub-regions of the Haihe River Basin.


Figure 8.
Trend analysis of drought frequency for (a) the Haihe River Basin and the five sub-regions (b) region I; (c) region II; (d) region III; (e) region IV; (f) region V in 1960–2015.
Figure 8.
Trend analysis of drought frequency for (a) the Haihe River Basin and the five sub-regions (b) region I; (c) region II; (d) region III; (e) region IV; (f) region V in 1960–2015.


Figure 9.
Trend analysis of drought duration for (a) light droughts and moderate droughts; (b) severe droughts and extreme droughts in 1960–2015.
Figure 9.
Trend analysis of drought duration for (a) light droughts and moderate droughts; (b) severe droughts and extreme droughts in 1960–2015.

Figure 10.
Interdecadal drought frequency for the five sub-regions of the Haihe River Basin.

Figure 11.
The Pearson-III frequency of the first precipitation after (a) light drought; (b) moderate drought; (c) severe drought; and (d) extreme drought in region I.
Figure 11.
The Pearson-III frequency of the first precipitation after (a) light drought; (b) moderate drought; (c) severe drought; and (d) extreme drought in region I.


Table 1.
Basic information of each sub-region of the Haihe River Basin.
| Sub-Region | Climate Type | Elevation (m) | Average Annual Precipitation (mm) | Number of Meteorological Stations | Ratio of Meteorological Stations |
|---|---|---|---|---|---|
| I | Temperate monsoon climate | 51–2287 | 630.6 | 11 | 26% |
| II | Temperate continental climate | 330–2306 | 404.6 | 7 | 16% |
| III | Temperate monsoon climate | 388–3061 | 597.5 | 7 | 16% |
| IV | 52–435 | 560.7 | 13 | 30% | |
| V | 43–236 | 555.8 | 5 | 12% |
Table 2.
Drought magnitude standards of consecutive dry days.
| Season (month) | Light Drought (day) | Moderate Drought (day) | Severe Drought (day) | Extreme Drought (day) |
|---|---|---|---|---|
| Spring (Mar–May) | 15–30 | 31–50 | 51–75 | >75 |
| Summer (Jun–Aug) | 10–20 | 21–30 | 31–50 | >50 |
| Autumn (Sep–Nov) | 15–30 | 31–50 | 51–75 | >75 |
| Winter (Dec–Feb) | 20–30 | 31–60 | 61–80 | >80 |
Table 3.
Precipitation magnitude standards.
| Precipitation Magnitude | 24-H Precipitation Intensity (mm·day−1) |
|---|---|
| Light rain | 0.0–10.0 |
| Moderate rain | 10.1–25.0 |
| Heavy rain | 25.1–50.0 |
| Rainstorm | 50.1–100.0 |
| Heavy rainstorm | 100.1–250.0 |
| Extreme rainstorm | >250.0 |
Table 4.
Precipitation intensity changes after droughts of different magnitude for each sub-region.
| Sub-Region | Drought Magnitude | Light Rain (%) | Moderate Rain (%) | Heavy Rain (%) | Rainstorm (%) | Heavy Rainstorm (%) | Extreme Rainstorm (%) |
|---|---|---|---|---|---|---|---|
| I | Light drought | 63.06 | 24.31 | 9.69 | 2.73 | 0.21 | 0 |
| Moderate drought | 75.63 | 18.17 | 5.36 | 0.82 | 0.02 | 0 | |
| Severe drought | 77.41 | 15.59 | 5.64 | 1.29 | 0.07 | 0 | |
| Extreme drought | 79.22 | 16.28 | 4.08 | 0.42 | 0 | 0 | |
| II | Light drought | 65.8 | 28.68 | 5.25 | 0.27 | 0 | 0 |
| Moderate drought | 77.40 | 18.94 | 3.45 | 0.21 | 0 | 0 | |
| Severe drought | 80.66 | 15.85 | 3.23 | 0.26 | 0 | 0 | |
| Extreme drought | 83.32 | 11.93 | 3.95 | 0.77 | 0.03 | 0 | |
| III | Light drought | 69.63 | 20.48 | 7.65 | 2.08 | 0.16 | 0 |
| Moderate drought | 75.98 | 19.25 | 4.38 | 0.39 | 0 | 0 | |
| Severe drought | 71.51 | 21.96 | 5.89 | 0.63 | 0.01 | 0 | |
| Extreme drought | 87.40 | 5.93 | 3.50 | 2.19 | 0.92 | 0.06 | |
| IV | Light drought | 59.48 | 24.68 | 11.34 | 4.02 | 0.48 | 0 |
| Moderate drought | 70.37 | 19.36 | 7.96 | 2.16 | 0.15 | 0 | |
| Severe drought | 68.10 | 20.25 | 8.79 | 2.63 | 0.23 | 0 | |
| Extreme drought | 76.24 | 17.31 | 5.53 | 0.9 | 0.02 | 0 | |
| V | Light drought | 56.22 | 26.53 | 12.71 | 4.15 | 0.39 | 0 |
| Moderate drought | 70.59 | 19.71 | 7.76 | 1.84 | 0.10 | 0 | |
| Severe drought | 72.12 | 17.8 | 7.41 | 2.41 | 0.26 | 0 | |
| Extreme drought | 78.06 | 11.87 | 6.25 | 3.06 | 0.75 | 0.01 |
Table 5.
Drought frequencies and probability of precipitation intensities in each sub-region.
| Sub-Region | Time Period | Drought Frequency | Light Rain (%) | Moderate Rain (%) | Heavy Rain (%) | Rainstorm (%) | Heavy Rainstorm (%) | Extreme Rainstorm (%) |
|---|---|---|---|---|---|---|---|---|
| I | 1960–1969 | 73 | 67.64 | 23.36 | 7.71 | 1.26 | 0.03 | 0 |
| 1970–1979 | 75 | 64.48 | 24.07 | 9.35 | 2.01 | 0.09 | 0 | |
| 1980–1989 | 79 | 73.37 | 17.01 | 7.05 | 2.31 | 0.26 | 0 | |
| 1990–1999 | 78 | 63.88 | 23.90 | 9.78 | 2.32 | 0.12 | 0 | |
| 2000–2009 | 82 | 66.52 | 20.84 | 9.31 | 3.03 | 0.30 | 0 | |
| 2010–2019 | 83 | 71.54 | 16.19 | 7.66 | 3.69 | 0.91 | 0.01 | |
| II | 1960–1969 | 71 | 71.15 | 23.12 | 5.27 | 0.46 | 0 | 0 |
| 1970–1979 | 74 | 70.31 | 23.88 | 5.37 | 0.44 | 0 | 0 | |
| 1980–1989 | 73 | 72.59 | 23.32 | 3.90 | 0.19 | 0 | 0 | |
| 1990–1999 | 76 | 70.69 | 25.57 | 3.63 | 0.11 | 0 | 0 | |
| 2000–2009 | 78 | 67.8 | 27.32 | 4.69 | 0.19 | 0 | 0 | |
| 2010–2019 | 84 | 69.52 | 24.49 | 5.54 | 0.45 | 0 | 0 | |
| III | 1960–1969 | 71 | 73.11 | 20.74 | 5.42 | 0.72 | 0.01 | 0 |
| 1970–1979 | 68 | 73.81 | 19.74 | 5.57 | 0.86 | 0.02 | 0 | |
| 1980–1989 | 75 | 76.59 | 15.29 | 5.97 | 1.93 | 0.22 | 0 | |
| 1990–1999 | 78 | 70.1 | 19.90 | 7.73 | 2.11 | 0.16 | 0 | |
| 2000–2009 | 79 | 67.12 | 22.16 | 8.51 | 2.09 | 0.12 | 0 | |
| 2010–2019 | 85 | 65.05 | 26.49 | 7.58 | 0.87 | 0.01 | 0 | |
| IV | 1960–1969 | 80 | 63.43 | 22.20 | 10.32 | 3.62 | 0.43 | 0 |
| 1970–1979 | 76 | 66.83 | 19.93 | 9.24 | 3.50 | 0.50 | 0 | |
| 1980–1989 | 84 | 65.05 | 21.08 | 9.84 | 3.57 | 0.46 | 0 | |
| 1990–1999 | 85 | 63.9 | 22.29 | 9.98 | 3.43 | 0.40 | 0 | |
| 2000–2009 | 83 | 59.39 | 25.41 | 11.59 | 3.36 | 0.25 | 0 | |
| 2010–2019 | 85 | 65.12 | 22.48 | 9.41 | 2.76 | 0.23 | 0 | |
| V | 1960–1969 | 77 | 62.11 | 24.50 | 10.46 | 2.76 | 0.17 | 0 |
| 1970–1979 | 76 | 55.59 | 29.41 | 11.08 | 3.68 | 0.24 | 0 | |
| 1980–1989 | 84 | 64.59 | 22.22 | 9.80 | 3.10 | 0.29 | 0 | |
| 1990–1999 | 82 | 61.16 | 21.82 | 11.57 | 4.74 | 0.71 | 0 | |
| 2000–2009 | 85 | 62.58 | 23.27 | 10.57 | 3.29 | 0.29 | 0 | |
| 2010–2019 | 87 | 65.49 | 21.72 | 9.46 | 3.03 | 0.30 | 0 |
© 2017 by the authors. Licensee MDPI, Basel, Switzerland. This article is an open access article distributed under the terms and conditions of the Creative Commons Attribution (CC BY) license (http://creativecommons.org/licenses/by/4.0/).
Share and Cite
MDPI and ACS Style
Liu, B.; Yan, Z.; Sha, J.; Li, S. Drought Evolution Due to Climate Change and Links to Precipitation Intensity in the Haihe River Basin. Water 2017, 9, 878. https://doi.org/10.3390/w9110878
AMA Style
Liu B, Yan Z, Sha J, Li S. Drought Evolution Due to Climate Change and Links to Precipitation Intensity in the Haihe River Basin. Water. 2017; 9(11):878. https://doi.org/10.3390/w9110878
Chicago/Turabian StyleLiu, Bin, Zhihong Yan, Jinxia Sha, and Su Li. 2017. "Drought Evolution Due to Climate Change and Links to Precipitation Intensity in the Haihe River Basin" Water 9, no. 11: 878. https://doi.org/10.3390/w9110878
Note that from the first issue of 2016, this journal uses article numbers instead of page numbers. See further details here.